what prometheus means for monitoring vendors · 2020-02-19 · -some have seen prometheus as a...
TRANSCRIPT

Jorge Salamero - @bencerilloSysdig - PromCon 2018
What Prometheus means for
monitoring vendors

What is a monitoring vendor?

Different vendors provide monitoring
- Traditional based vendors
- Database based vendors
- Prometheus added-value vendors

What is Prometheus?

Multiple meanings for a word
- TSDB: metrics server
- Monitoring stack
- Metrics interface
- A way to instrument your code

A way to instrument your code
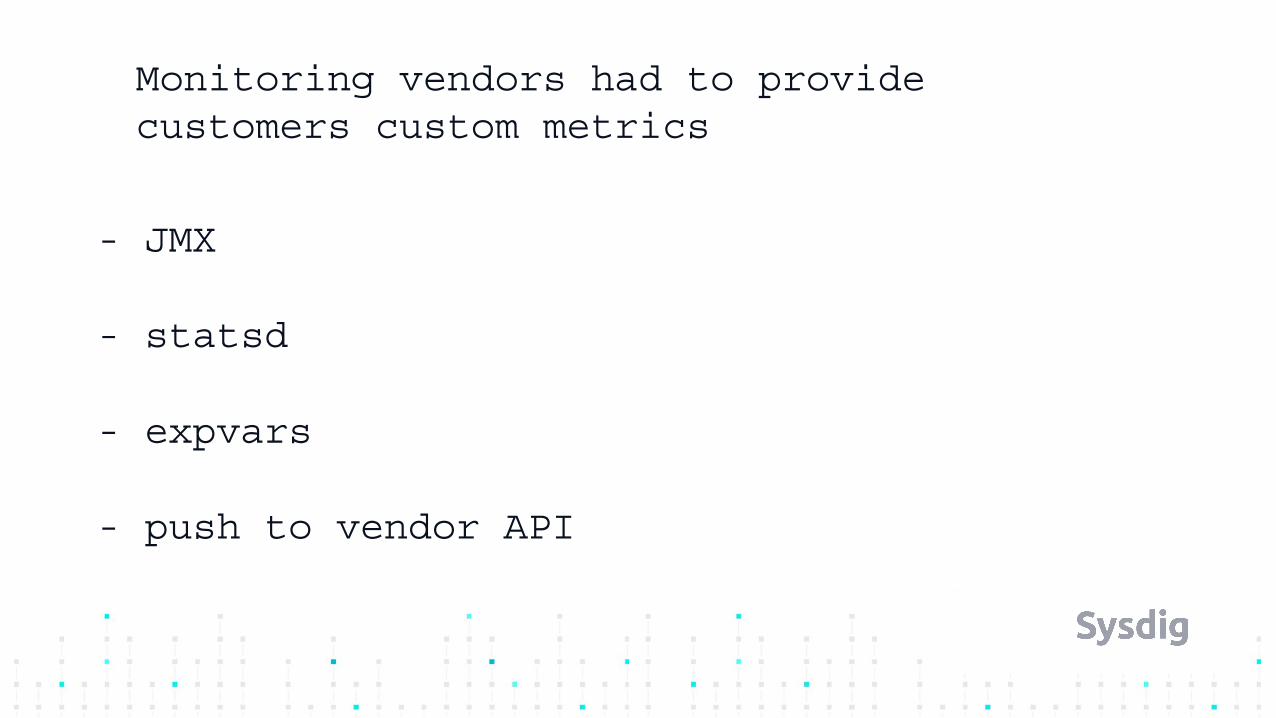
- JMX
- statsd
- expvars
- push to vendor API
Monitoring vendors had to provide customers custom metrics

- maintain huge code base with little value
- different interfaces between vendors
- not always available for your language
- doesn’t work with microservices / Kubernetes
PITA for everyone

- Metrics 2.0
- dogstatsd
- Prometheus metrics
- Open Metrics
- Open Census
Trying to fix this problem

- Defacto industry standard for exposing metrics
- Cloud-Native apps support OOB- k8s: apiserver, kube-controller-manager, etcd- kube-state-metrics- services: istio, traefik, coredns, fluentd, rook
- Instrument once, support many- Open source and commercial tools
- Different purposes: infra and APM
- Can we kill checks/exporters/scripts to massage jsons?
Prometheus metrics

{ host: dfs1 what: diskspace mountpoint: srv/node/dfs10 unit: B type: used metric_type: gauge}meta: { agent: diamond, processed_by: statsd2}

Monitoring stack
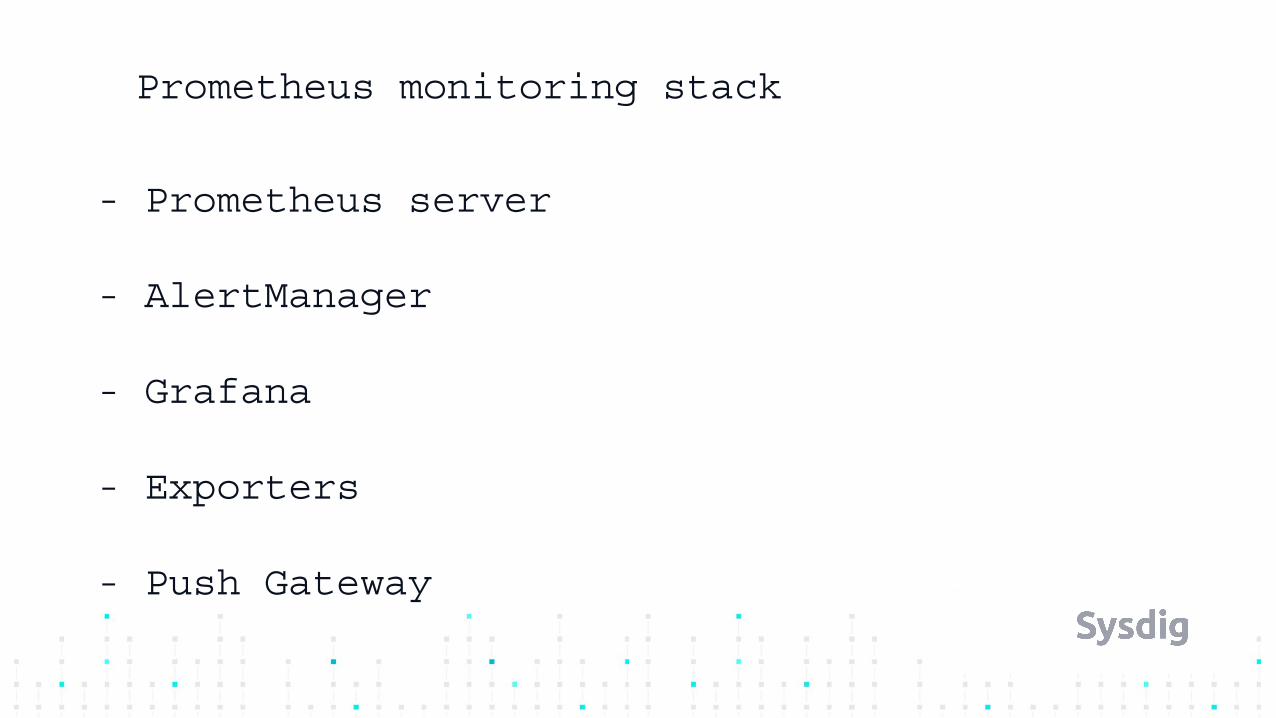
- Prometheus server
- AlertManager
- Grafana
- Exporters
- Push Gateway
Prometheus monitoring stack

- Prometheus stack DIY
- Different organizations, different needs
- User experience touch points:
- visualization
- metric collection
Embracing Prometheus ecosystem

- Grafana has become a popular interface
- Some teams don’t want to change
- Some teams still prefer vendor’s UI
- Give the choice
https://github.com/draios/grafana-sysdig-datasource
Visualization: Prometheus UI

- cadvisor, node_exporter, kube-state-metrics
- Sysdig’s commercial agent:
- eBPF / kernel module syscall tracing- per process metrics- short lived processes- container agnostic- host instrumentation vs sidecar
- Expose metrics as a exporter
Metric collection

Prometheus metrics server

- Some orgs want to run Prometheus
- Alone or with other monitoring tools- Provide support to them anyway
- Challenges:- Scalability- Multiple backends- Long term storage- Operations
Prometheus metrics server

- Offer hosted Prometheus backend
- Alternative backend (Sysdig):
- Scalability, LTS, operations, RBAC
- PromQL: defacto industry standard for querying metrics
- Interface to other services:- Kubernetes custom-metrics-api-server
https://github.com/draios/kubernetes-sysdig-metrics-apiserver
Vendors helping with the backend

To wrap up

- Some have seen Prometheus as a threat
- We believe it’s an opportunity:- Metrics standardization- Do more:- scale with the ecosystem- approach new opportunities- contribute back to the community
- Open source users are not lost deals, think how you can provide value to people using open source
Monitoring vendors and Prometheus

- Offer Prometheus support
- Allow to mix and match
- Visualization (Grafana or Sysdig Monitor)
- Metric collection (Sysdig agent for Prometheus users)
- Backend (Sysdig backend with Grafana and exporters)
- Contribute back:
- Sysdig and Sysdig Inspect, Falco, etc.
Sysdig ❤ Prometheus

Thank you! :)
Help us with the Prometheus user survey:
https://setns.run/2KGIZ9e
Jorge Salamero - @bencerilloQuestions?