what now for prone positioning? - critical care canada · what now for prone positioning? luciano...
TRANSCRIPT

What Now for Prone
Positioning?
Luciano Gattinoni, MD, FRCP
Università di Milano
Fondazione IRCCS Ca’ Granda
Ospedale Maggiore Policlinico
Milan, Italy
2013, Toronto

1976
1977
… nothing happened
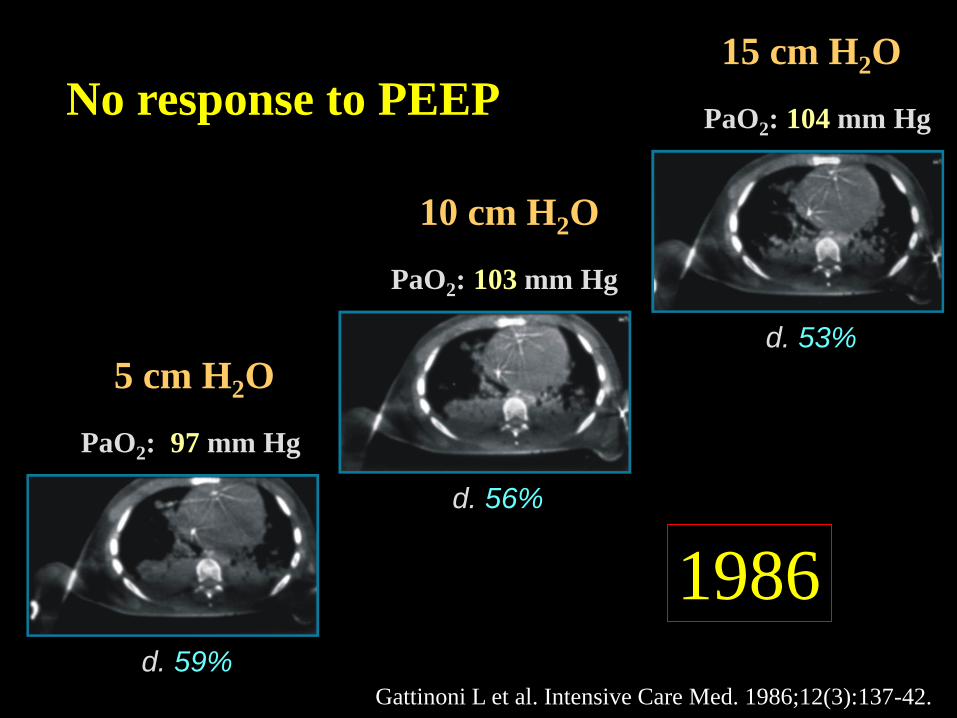
5 cm H2O
PaO2: 97 mm Hg
d. 59%
d. 56%
PaO2: 103 mm Hg
10 cm H2O
d. 53%
PaO2: 104 mm Hg
15 cm H2O
No response to PEEP
1986
Gattinoni L et al. Intensive Care Med. 1986;12(3):137-42.

d. 70%
PaO2 : 34 mm Hg
5 cm H2O
d. 52%
PaO2 : 49 mm Hg
10 cm H2O
d. 32%
PaO2 : 121 mm Hg
15 cm H2O
Great response to PEEP!
1986
Gattinoni L et al. Intensive Care Med. 1986;12(3):137-42.

First hypothesis
PaO2 PaO2
High perfusion High perfusion

1988

End Expiration Supine
Prone
Supine

Supine
100%
U
L
0%
50%
50%
U
L
50%
Prone
100%
U
L
0%
50%
75%
U
L
25%
Gattinoni L et al. Intensive Care Med. 2013 Nov;39(11):1909-15.

Gattinoni L et al. Anesthesiology 74: 15-23, 1991
1991

Without
gravity
Interstitial edema
and increased mass
The Sponge Model
g/t - 0.6
g/t - 0.6
g/t - 0.6
With
gravity
Superimposed
Pressure
Interstitial edema, increased mass
and collapse
g/t - 0.2
g/t - 1.0
g/t - 0.5

Shifting from
oxygenation to lung
protection:
Lung homogeneity

Altezza (mm)
0
10
20
30
40
50
N° immagine
80 0 20 40 60
2005
Valenza F et al, Crit Care Med. 2005 Feb;33(2):361-7

SUPINE vs PRONE
lung regions
1 2 3 4
mean
HU
-600
-500
-400
-300
prone
supine
Valenza F et al, Crit Care Med. 2005 Feb;33(2):361-7
2005

Shape matching Shape matching
and gravity Isolated lung
Absence of gravity Gravity S
upin
e P
ron
e
A B C
D E F
Gattinoni L et al. Am J Respir Crit Care Med. 2013 Oct 17. [Epub ahead of print]

Prone position attenuates VILI
Broccard CCM 2000
Dog, normal P vs. S Histology, W/D
Du Acta An Scand 1997
Dog, oleic acid P vs. LD Histology, PaO2
Nishimura ICM 2000
Rabbit, normal P vs. S Histology, CT scan, time

SUPINE PRONE
Vt (mL/Kg)
RR (bpm)
Pawm (cmH2O)
W/D
Ers%
31 ± 2.94
24 ± 11
6.61 ± 0.11
6.54 ± 0.46
158 ± 5
30 ± 3.76
24 ± 11
6.56 ± 0.15
6.57 ± 0.79
155 ± 5
p = 0.80
p = 0.79
p = 0.29
p = 0.91
p = 0.14
min
0 20 40 60 80 100 120 140 160
Time
Equal VILI
p = 0.01
Valenza F et al, Crit Care Med. 2005 Feb;33(2):361-7

2008
2000
Ventilation with Low
Tidal Volume
Atelectrauma
and PEEP 2004
Neuromuscolar
Blockade 2010

STUDY CHARACTERISTICS
Patients (n)
Study period
(years)
Enrolment rate
(pts/month/unit)
Trial ended early
Gattinoni
et al.
304
1996-1999
0.28
Yes (slow
enrolment)
Guérin
et al.
802
1998-2002
0.24
No
Mancebo
et al.
142
1998-2002
0.24
Yes (slow
enrolment)
Taccone
et al.
344
2004-2008
0.26
No
2001 2004 2006 2009

ENROLLMENT
Enrollment
criteria
Average PaO2/FiO2
at enrollment
Average PEEP at
Enrollment (cmH2O)
Average enrollment
SAPS II
Gattinoni
et al.
ALI/ARDS with
PEEP≥5 cmH2O
127
10
40
Guérin
et al.
Hypoxemic acute
respiratory failure
(413 ALI/ARDS
pts)
152
8
46
Mancebo
et al.
ARDS with
four-quadrant
infiltrates on
CXR
105
7
41
Taccone
et al.
ARDS with
PEEP≥5
cmH2O
113
10
41
Time after meeting
enrollment criteria
Not
pre-specified >12-24 h <48 h <72 h
2001 2004 2006 2009

ENROLLMENT
Planned duration
of prone posit. (avg)
Actual duration
of prone posit. (avg)
Protective mechanical
ventilation
Crossover (supine to
Prone group)
Gattinoni
et al.
6h/day for
10 days
7 h for
5 days
No
12/152
(7.9%)
Guérin
et al.
≥8h/day until
weaning criteria
9 h for
4 days
No
81/378
(21.4%)
Mancebo
et al.
20h/day until
weaning criteria
17 h for
10 days
Yes
(VT≤10 ml/kg
of PBW or ABW)
5/60
(8.3%)
Taccone
et al.
20h/day until
weaning criteria
18 h for
8 days
Yes
(VT≤8 ml/kg
of PBW )
20/174
(11.5%)
2001 2004 2006 2009

OUTCOME
Last follow-up
Mortality (prone vs
supine)
P value
Gattinoni
et al.
6 months
62.2%
vs
58.3%
0.50
Guérin
et al.
90 days
43.3%
vs
42.2%
0.74
Mancebo
et al.
Hospital
discharge
50.0%
vs
60.0%
0.22
Taccone
et al.
6 months
47.6%
vs
52.9%
0.33
2001 2004 2006 2009

Abroug F. et al. Intensive Care Med. 2008 Jun;34(6):1002-11
Effect of ventilation in prone position on mortality.
Conclusions:
Prone position is not associated with a significant reduction in mortality from ALI/ARDS
despite a significant increase in PaO2/FiO2, is safe, and tends to decrease VAP. Published
studies exhibit substantial clinical heterogeneity, suggesting that an adequately sized study
optimising the duration of proning and ventilation strategy is warranted to enable definitive
conclusions to be drawn.

Effect of prone ventilation on mortality (at hospital discharge or longest duration of follow-up)
Sud et al. Intensive Care Med. 2010 Apr;36(4):585-99.

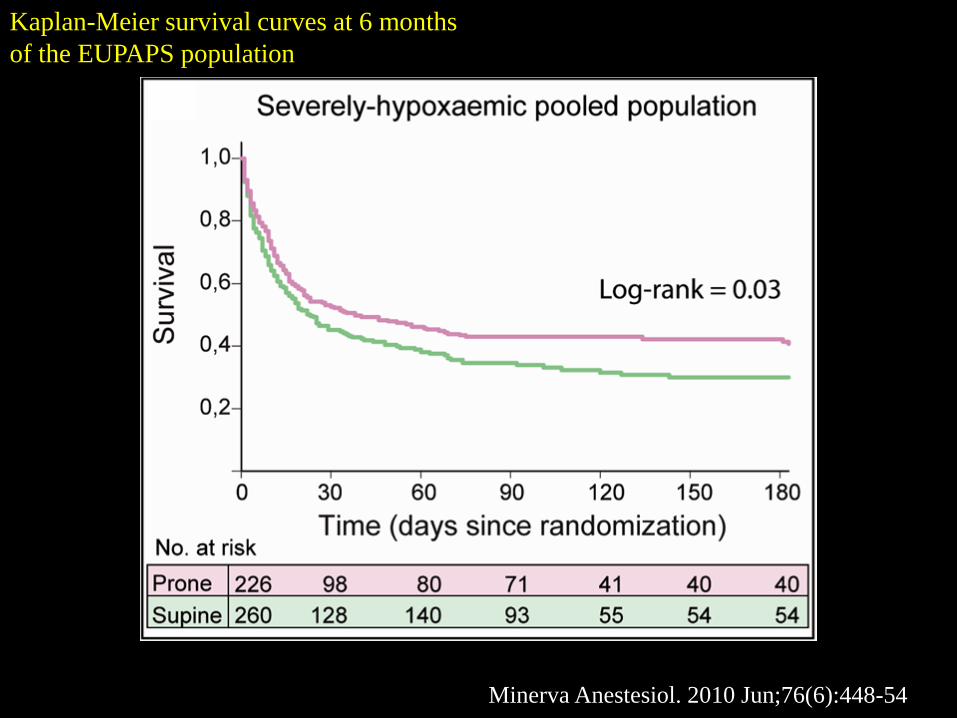
Kaplan-Meier survival curves at 6 months
of the EUPAPS population
Minerva Anestesiol. 2010 Jun;76(6):448-54
Kaplan-Meier survival curves at 6 months
of the EUPAPS population
Minerva Anestesiol. 2010 Jun;76(6):448-54

Gattinoni L. et al. Minerva
Anestesiol. 2010 Jun;76(6):448-54
Guerin C. et al. N Engl J Med.
2013 Jun 6;368(23):2159-68

Mild Moderate Severe
300 200 100
ALTERNATIVE
TREATMENTS
ECMO
ECCO2-R
Neuromusc.
Blockade
Prone Position
Paw plat/PL plat ≤ 30 cmH2O/≤ 20 cmH2O
Tidal Volume/strain 6 ml/kg IBW/≤ 1.5-2
PEEP ≈ 10 cmH2O > 15 cmH2O
ARDS
