what matters to built environment students · what matters to built environment students: ......
TRANSCRIPT

1
What matters to built environment students
Jessica Lamond, David Proverbs and Teresa Wood
July 2013

2
Contents
What matters to built environment students: an analysis of the National Student Survey (NSS) and Key
Information Sets (KIS) data ___________________________________________________ 3
Summary ________________________________________________________________ 3
Introduction _____________________________________________________________ 4
Method _________________________________________________________________ 5
Results _________________________________________________________________ 6
Overall satisfaction _______________________________________________________ 6
Question scores _________________________________________________________ 7
Variation in individual question responses ______________________________________ 13
Correlation analyses ______________________________________________________ 16
Strategic analysis ________________________________________________________ 20
Correlation with KIS data __________________________________________________ 25
Summary and discussion _____________________________________________________ 29
Recommendations _________________________________________________________ 31
References ______________________________________________________________ 32
Appendix 1: The dataset ____________________________________________________ 33
Survey questions ________________________________________________________ 33
Appendix 2: Factors derived from principal components analysis of NSS question scores. _____ 34
3
What matters to built environment students: an analysis of the
National Student Survey (NSS) and Key Information Sets (KIS) data
Summary The results of the National Student Survey (NSS) reveal that the overall satisfaction levels with built
environment courses are on average lower than that of other subjects (Higher Education Academy,
2012). However, as a largely vocational discipline, it is recognised within the sector that built
environment courses have issues and demands upon them that may differ from more purely academic
subjects. This research aims to explore the reasons for this lower level of satisfaction and to identify
areas where improvements in built environment courses could enhance the student experience. The
work will be based on the output of the NSS but will link the data to the Key Information Sets (KIS) on
courses available to students via the Unistats website.
The objectives of this report are to:
1. Examine the range of performance of built environment courses in the three critical areas of
teaching quality, quality of feedback and student support and advice.
2. Conduct a cross-disciplinary comparison to identify common areas of strengths and weakness
among four representative built environment courses.
3. Explore the influence of external and internal factors on the NSS results.
4. Recommend areas of improvement for built environment courses to improve the student
experience.
The report is based on the Unistats downloadable data (available from http://unistats.direct.gov.uk/open-
access-data/) consisting of information provided directly by higher education institutions (HEIs) and
further education colleges (FECs) combined with the destinations of leavers survey and the NSS.
Descriptive statistics on the range of NSS scores and KIS data are presented. This is followed by analysis
of the correlation between elements of the data based on hypothesised relationships between KIS as
inputs to the student experience and NSS scores as outputs from the student experience. Finally, a
strategic analysis of the potential to meet the gap in student expectations, as represented by the NSS
scores, by improvements to the learning experience is performed.
The results reveal significant patterns of correlation within the NSS scores such that satisfaction with
different elements of the student experience are related strongly to overall student satisfaction with their
course. The variation in the strength of this relationship across question areas is revealing with regard to
which elements appear most influential in determining overall satisfaction, and this pattern is largely
consistent across courses and over time. Patterns of correlation between inputs as represented by the
KIS data, and outputs as represented by NSS scores, are weaker and less consistent. Nevertheless, some
interesting questions arise out of the contrasts between different built environment courses. These point
the way to avenues for further research into the attributes and learning styles of built environment
students from different cognate groups.
Opportunities for learning from best practice have been identified, particularly within the organisation
and management of courses. It also appears that the weaker relationship between scores around
assessment and feedback and overall satisfaction raise interesting questions about the perception of the
purpose of feedback and assessment within built environment courses. It seems that the considerable
effort directed at improving this aspect of the student experience over recent years may not meet the
expectation of the student body. The need for research into the mismatch of student expectations,
institutional performance indicators and improved learning in this area is highlighted by the results of this
analysis.
4
Introduction Higher education courses provide a crucial supply of future built environment professionals for the
wider construction industry. United Kingdom (UK) property, and surveying and construction
professionals are well regarded internationally. However, the image of property, surveying and
construction education is not so high within the UK population in general and the UK educational
community specifically. Increasingly, as university level qualifications become the norm within all
managerial roles, attracting the best talent into the building professions depends on the ability of built
environment courses to attract the best students and provide them with an excellent educational
experience. It is also incumbent on built environment courses to meet standards set by professional
bodies and to accommodate the diverse needs of the profession including a high demand for part-
time study, vocational training and work-based, and industry-focused teaching and learning.
There are many ways of measuring the success of built environment courses in achieving that aim and one that is increasingly important in the attraction of students is the output of the National Student
Survey (NSS). This survey is conducted annually for all subject areas and measures the satisfaction of
final year students with their course of study. The results are available for prospective students and
may be instrumental in their choice of institution but also of subject. Built environment courses have
consistently underperformed on this survey in relation to the “all subject” average and this causes
concern for heads of built environment departments and their institutions. It may also be worrying
for the wider built environment community which is keen for good students to be encouraged to
take built environment subjects.
Customer satisfaction is a subject which has received attention from many disciplines and
consequently has many different definitions and conceptual theories associated with it (Oliver, 1997).
However, there is consensus on the notion of satisfaction deriving from the meeting of expectations
(Gabbot and Hogg, 1998). Expectations are the yardstick by which a customer measures a service
experience, they are their perceived entitlement from a service encounter and may be realistic or
unrealistic. Expectations are related to, but subtly different from, the needs of the individual, which
derive from their lack of some desirable attribute, in this case knowledge, skills and qualifications.
Therefore, satisfaction is derived from customer components, particularly those affecting
expectations, but also some that affect needs and service provider components. Linking satisfaction
to those components can both explain differences in satisfaction levels and indicate where service
providers can most effectively improve their service to enhance satisfaction. While service providers
may not want, or be able to, change the customer needs, they may be able, by recognising underlying
expectations, to manage expectations of their customers at an early stage in order to improve the
final satisfaction level. These concepts are applicable to the outputs of the NSS because deliverers of
built environment courses need to recognise expectations, respond where possible, and sensibly
manage expectations where response is not possible.
While it is true that built environment courses have many challenges – which make the student
experience more difficult to manage than more traditional courses – this is not the entire picture.
Concentrating on the difficulties may prevent changes that could enhance student experience,
improve the education of built environment students and ultimately the competitiveness of the UK construction industry. It behoves the educators within built environment to heed the messages
provided by the NSS, but some analysis is necessary to extract the strategic lessons for action.
The combined NSS and KIS dataset is relatively new information for managers in built environment
education and has not been subject to detailed analysis within the subject area. Multilevel modelling of
the output of the NSS is carried out by Higher Education Funding Council for England (HEFCE),
(Surridge, 2008) and could be used for comparisons between institutions by allowing for adjustment
for differences in subject areas and other student demographics. However, although these outputs
are interesting, they are of lower relevance within the built environment: they concentrate on full-
time students in isolation (Surridge, 2009) and are designed to measure outputs rather than to
provide actionable insights. The HEA has also carried out detailed analysis of the NSS scores (Higher
5
Education Academy, 2012) and the Council of Heads of Built Environment (CHOBE) have previously
commissioned research to explore the lessons to be learned from the NSS data (Proverbs and
Lamond, 2008, Proverbs and Lamond, 2009). Some individual institutions have used the survey data
to analyse institution specific actions, for example Gaffney-Rhys and Jones (2008) compared the NSS
outputs with an internal survey of students in Newport Business School and case studies are available
from the Unistats website and HEA (Buckley, 2012). Reflections on the NSS are also available
regarding their use and consistency (see Machell and Saunders (2007) concluding that the data was
under-utilised and the potential for strategic analysis unappreciated.
Method The analysis in this report is based on the data publically available on the Unistats website and
downloadable for all courses provided by HEIs and FECs. The courses were limited to those offered at
undergraduate level. The downloadable dataset consists of results from the NSS, other KIS data provided by institutions and the output of the destination of leavers survey. The data is presented as an average
score for the NSS, and as percentages for the KIS and destination of leavers.
For this analysis, several key areas were identified as particularly relevant to service quality namely:
teaching quality, quality of feedback and student support and advice. Within the NSS, the questions
identified as close proxies for the three areas were: question 1 – staff are good at explaining things;
question 4 – the course is intellectually stimulating; question 9 – feedback has helped me clarify things I
did not understand; and question 10 – I have received sufficient support and advice with my studies.
These four questions were the focus of the analysis together with question 22 – overall I am satisfied
with the quality of the course. In what follows they will be referred to as the core aspects.
The following five analyses were performed on the datasets to explore the relationships between internal
and external factors on the satisfaction of students with the core aspects:
(i) a cross disciplinary correlation analysis of the results of the NSS scores to identify common areas of
strengths and weaknesses among four representative built environment courses namely: Construction
Management (CM); Building Surveying (BS); Quantity Surveying (QS) and Real Estate (RE). As the Joint
Academic Coding System (JACS) code does not uniquely identify these representative courses, the
courses were identified from their titles in the Unistats database using judgement and double checked by
two researchers. The category “all buildings” was also derived from the titles of courses and included a
broader definition of architecture, planning, civil engineering etc;
(ii) variability and ranking of built environment courses on the core questions was explored through
analysis of the range of different question scores and through a range analysis of the question scores and
a visual comparison of course rankings within the four reference courses;
(iii) a descriptive comparative analysis of key descriptive statistics for “all courses”, “all buildings” and the
four representative courses was followed by a cross-correlation analysis between the NSS questions and
overall satisfaction;
(iv) a strategic analysis of the opportunities for improving the student experience is based on the
importance and relative performance of the built environment courses for all 21 NSS questions;
(v) detailed analysis of the influence of internal and external factors affecting satisfaction was based on the
cross-correlation of selected items from the KIS data and destination of leavers survey. The most
commonly used measure of quality of university education is the proportion of students gaining firsts or
upper seconds (Gibbs, 2010). Process indicators are also important and of the four important indicators
identified by Gibbs (2010) the one represented in the KIS data is the amount of class contact scheduled.
Finally satisfaction is based on expectations that are shaped by motivation and therefore the expected
destination of leavers is a characteristic that may influence their satisfaction with courses (Tucker, 2008,
Bye et al., 2007).
6
Results The results are presented below. The first four sections relate to the NSS internal analysis and these are
followed a section on the comparison of NSS with the wider KIS dataset.
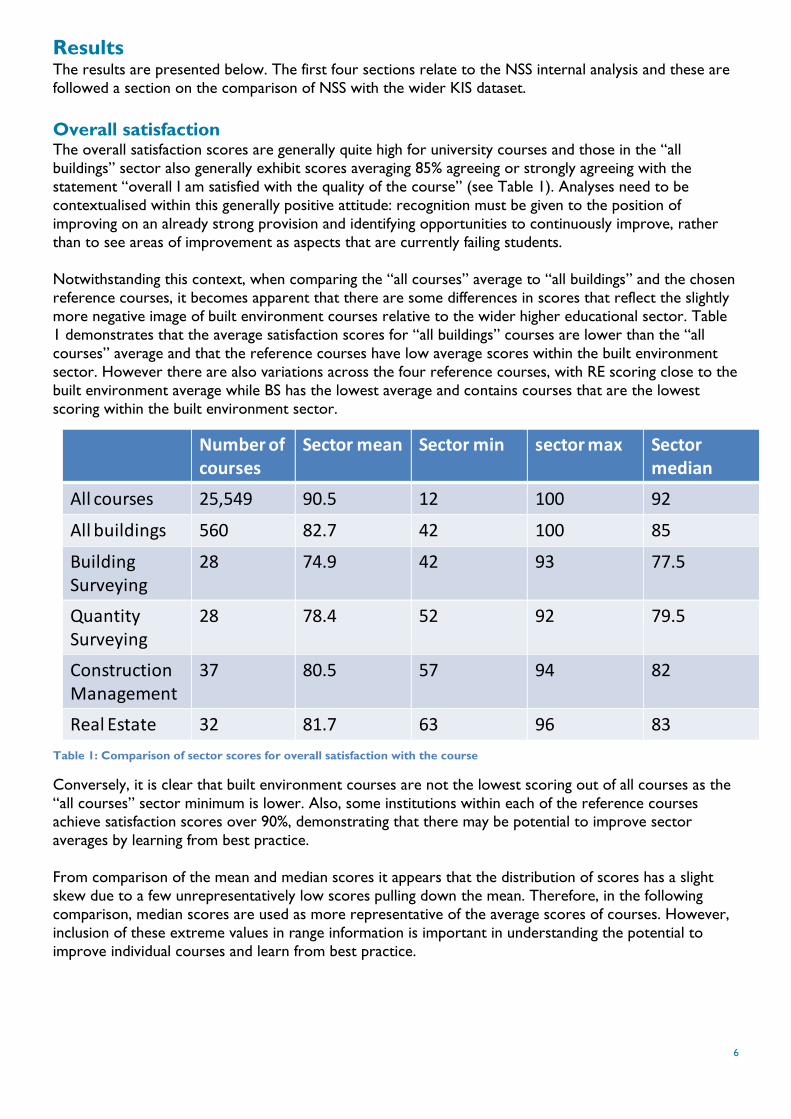
Overall satisfaction The overall satisfaction scores are generally quite high for university courses and those in the “all
buildings” sector also generally exhibit scores averaging 85% agreeing or strongly agreeing with the
statement “overall I am satisfied with the quality of the course” (see Table 1). Analyses need to be
contextualised within this generally positive attitude: recognition must be given to the position of
improving on an already strong provision and identifying opportunities to continuously improve, rather
than to see areas of improvement as aspects that are currently failing students.
Notwithstanding this context, when comparing the “all courses” average to “all buildings” and the chosen
reference courses, it becomes apparent that there are some differences in scores that reflect the slightly
more negative image of built environment courses relative to the wider higher educational sector. Table
1 demonstrates that the average satisfaction scores for “all buildings” courses are lower than the “all
courses” average and that the reference courses have low average scores within the built environment
sector. However there are also variations across the four reference courses, with RE scoring close to the
built environment average while BS has the lowest average and contains courses that are the lowest
scoring within the built environment sector.
Table 1: Comparison of sector scores for overall satisfaction with the course
Conversely, it is clear that built environment courses are not the lowest scoring out of all courses as the
“all courses” sector minimum is lower. Also, some institutions within each of the reference courses achieve satisfaction scores over 90%, demonstrating that there may be potential to improve sector
averages by learning from best practice.
From comparison of the mean and median scores it appears that the distribution of scores has a slight
skew due to a few unrepresentatively low scores pulling down the mean. Therefore, in the following
comparison, median scores are used as more representative of the average scores of courses. However,
inclusion of these extreme values in range information is important in understanding the potential to
improve individual courses and learn from best practice.
Number of courses
Sector mean Sector min sector max Sector median
All courses 25,549 90.5 12 100 92
All buildings 560 82.7 42 100 85
Building Surveying
28 74.9 42 93 77.5
QuantitySurveying
28 78.4 52 92 79.5
Construction Management
37 80.5 57 94 82
Real Estate 32 81.7 63 96 83

7
Question scores Examination of the median satisfactions scores across NSS questions (Figure 1) shows that areas of
strength and weakness in responses are not only similar across built environment courses but also for all courses. The lower average category scores are for assessment and feedback and the higher are for
learning resources and teaching quality.
Figure 1: Cross-disciplinary comparison of NSS question scores (sector median)
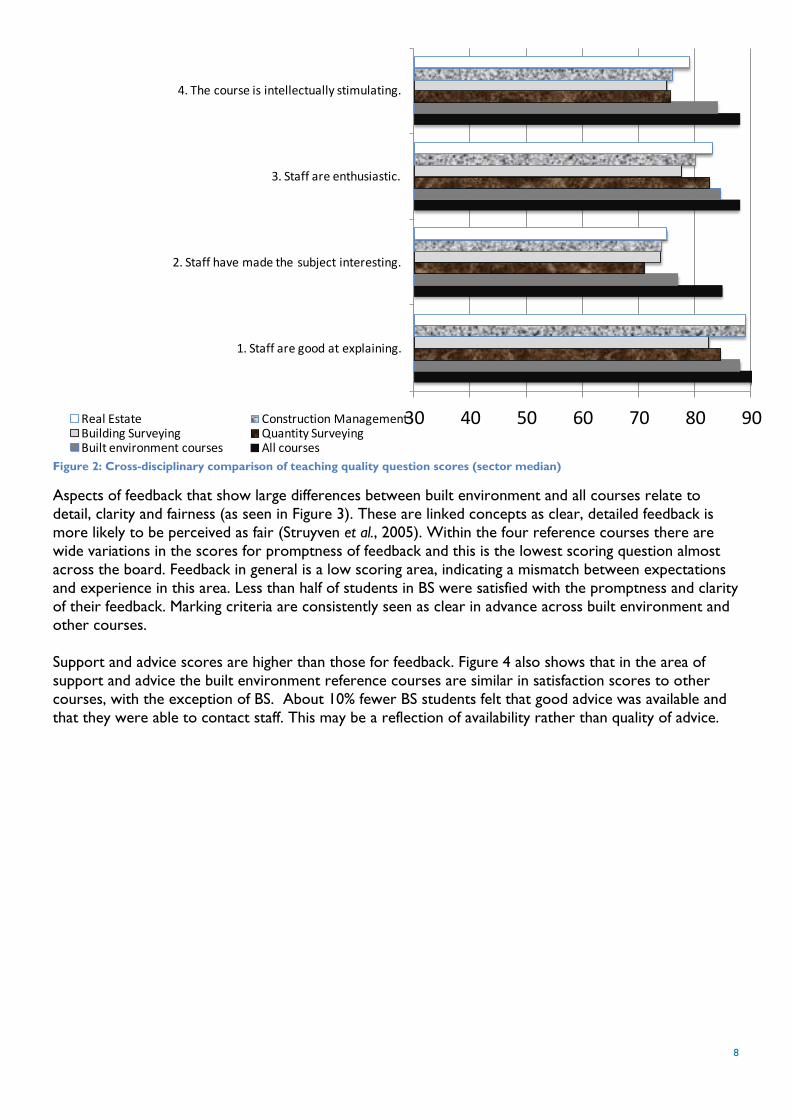
Grouping the questions by category shows more subtle differences and reveals where the built
environment courses are experiencing a greater mismatch of expectations and experience than other
courses. Figure 2 shows built environment courses have lower scores for all questions in the category of
teaching quality. The largest gaps exist for questions relating to interest in the subject matter with smaller
discrepancies in pedagogic delivery.
30 40 50 60 70 80 90
1. Staff are good at explaining.2. Staff have made the subject interesting.
3. Staff are enthusiastic.4. The course is intellectually stimulating.
5. The marking criteria clear in advance.6. Assessment fair.
7. Feedback prompt.8. I have received detailed comments.
9. Feedback has helped me clarify things.10. I have received sufficient advice and support.
11. I have been able to contact staff.12. Good advice was available.
13. The timetable works efficiently.14. Any changes have been communicated effectively.
15. The course is well organised and is running smoothly.16. The library resources and services are good.
17. I have been able to access IT resources.18. I have been able to access specialised equipment.19. The course has helped me to present myself with …
20. My communication skills have improved.21. I feel confident in tackling unfamiliar problems.
Real Estate Construction ManagementBuilding Surveying Quantity SurveyingBuilt environment courses All courses
8
Figure 2: Cross-disciplinary comparison of teaching quality question scores (sector median)
Aspects of feedback that show large differences between built environment and all courses relate to
detail, clarity and fairness (as seen in Figure 3). These are linked concepts as clear, detailed feedback is
more likely to be perceived as fair (Struyven et al., 2005). Within the four reference courses there are
wide variations in the scores for promptness of feedback and this is the lowest scoring question almost
across the board. Feedback in general is a low scoring area, indicating a mismatch between expectations
and experience in this area. Less than half of students in BS were satisfied with the promptness and clarity
of their feedback. Marking criteria are consistently seen as clear in advance across built environment and
other courses.
Support and advice scores are higher than those for feedback. Figure 4 also shows that in the area of
support and advice the built environment reference courses are similar in satisfaction scores to other
courses, with the exception of BS. About 10% fewer BS students felt that good advice was available and
that they were able to contact staff. This may be a reflection of availability rather than quality of advice.
30 40 50 60 70 80 90
1. Staff are good at explaining.
2. Staff have made the subject interesting.
3. Staff are enthusiastic.
4. The course is intellectually stimulating.
Real Estate Construction ManagementBuilding Surveying Quantity SurveyingBuilt environment courses All courses

9
Figure 3: Cross-disciplinary comparison of feedback question scores (sector median)
Figure 4: Cross-disciplinary comparison of support and advice question scores (sector median)
30 40 50 60 70 80 90
5. The marking criteria clear in advance.
6. Assessment fair.
7. Feedback prompt.
8. I have received detailed comments.
9. Feedback has helped me clarify things.
Real Estate Construction ManagementBuilding Surveying Quantity SurveyingBuilt environment courses All courses
30 40 50 60 70 80 90
10. I have received sufficient advice and support.
11. I have been able to contact staff.
12. Good advice was available.
Real Estate Construction ManagementBuilding Surveying Quantity SurveyingBuilt environment courses All courses
10
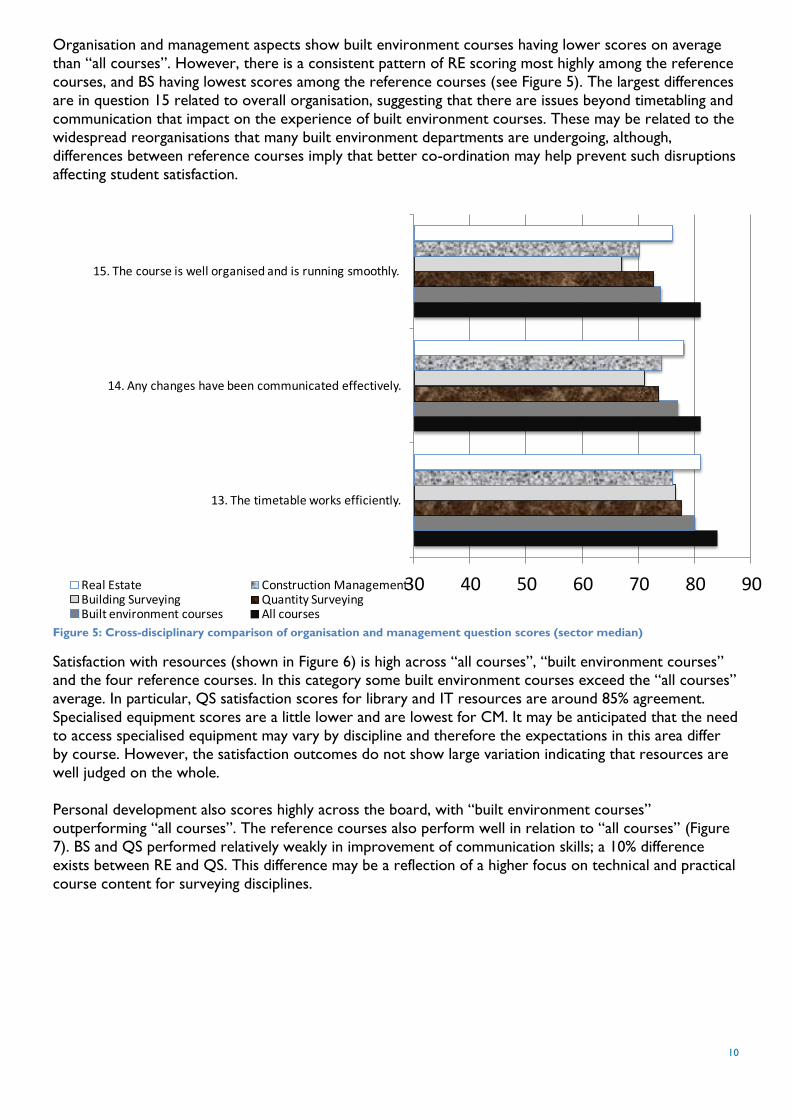
Organisation and management aspects show built environment courses having lower scores on average
than “all courses”. However, there is a consistent pattern of RE scoring most highly among the reference
courses, and BS having lowest scores among the reference courses (see Figure 5). The largest differences
are in question 15 related to overall organisation, suggesting that there are issues beyond timetabling and
communication that impact on the experience of built environment courses. These may be related to the
widespread reorganisations that many built environment departments are undergoing, although,
differences between reference courses imply that better co-ordination may help prevent such disruptions
affecting student satisfaction.
Figure 5: Cross-disciplinary comparison of organisation and management question scores (sector median)
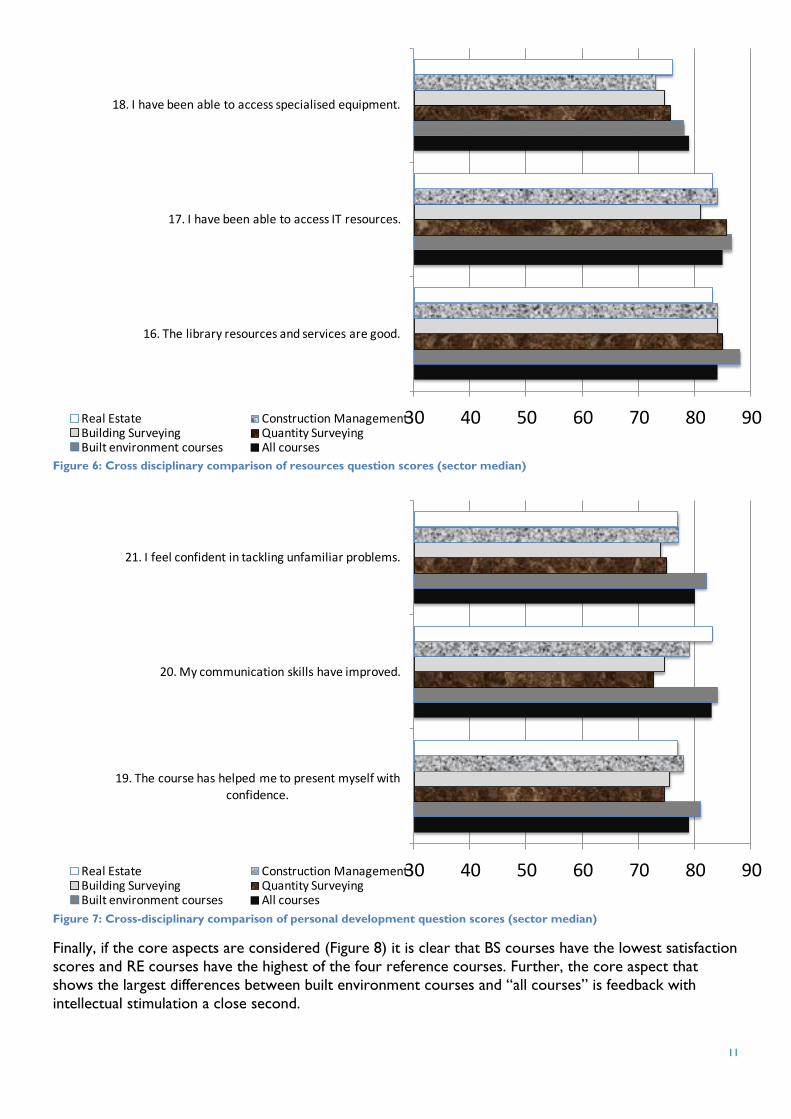
Satisfaction with resources (shown in Figure 6) is high across “all courses”, “built environment courses” and the four reference courses. In this category some built environment courses exceed the “all courses”
average. In particular, QS satisfaction scores for library and IT resources are around 85% agreement.
Specialised equipment scores are a little lower and are lowest for CM. It may be anticipated that the need
to access specialised equipment may vary by discipline and therefore the expectations in this area differ
by course. However, the satisfaction outcomes do not show large variation indicating that resources are
well judged on the whole.
Personal development also scores highly across the board, with “built environment courses”
outperforming “all courses”. The reference courses also perform well in relation to “all courses” (Figure
7). BS and QS performed relatively weakly in improvement of communication skills; a 10% difference
exists between RE and QS. This difference may be a reflection of a higher focus on technical and practical
course content for surveying disciplines.
30 40 50 60 70 80 90
13. The timetable works efficiently.
14. Any changes have been communicated effectively.
15. The course is well organised and is running smoothly.
Real Estate Construction ManagementBuilding Surveying Quantity SurveyingBuilt environment courses All courses
11
Figure 6: Cross disciplinary comparison of resources question scores (sector median)
Figure 7: Cross-disciplinary comparison of personal development question scores (sector median)
Finally, if the core aspects are considered (Figure 8) it is clear that BS courses have the lowest satisfaction
scores and RE courses have the highest of the four reference courses. Further, the core aspect that
shows the largest differences between built environment courses and “all courses” is feedback with
intellectual stimulation a close second.
30 40 50 60 70 80 90
16. The library resources and services are good.
17. I have been able to access IT resources.
18. I have been able to access specialised equipment.
Real Estate Construction ManagementBuilding Surveying Quantity SurveyingBuilt environment courses All courses
30 40 50 60 70 80 90
19. The course has helped me to present myself with confidence.
20. My communication skills have improved.
21. I feel confident in tackling unfamiliar problems.
Real Estate Construction ManagementBuilding Surveying Quantity SurveyingBuilt environment courses All courses

12
Figure 8: Cross-disciplinary comparison of core aspect question scores (sector median)
30 40 50 60 70 80 90
1. Staff are good at explaining.
4. The course is intellectually stimulating.
9. Feedback has helped me clarify things.
10. I have received sufficient advice and support.
Real Estate Construction ManagementBuilding Surveying Quantity SurveyingBuilt environment courses All courses
KEY:
Q1: staff good at explaining. Q2: staff make it interesting. Q3: staff are enthusiastic.
Q4: Intellectually stimulating. Q5: marking criteria clear. Q6: marking is fair.
Q7: Feedback prompt. Q8: received detailed comments. Q9: feedback has clarified things.
Q10: support and advice sufficient. Q11: able to contact staff. Q12: good advice available.
Q13: timetable works efficiently. Q14: changes communicated. Q15:course well organised.
Q16: library resources and services. Q17: General IT resources. Q18: special equipment.
Q19: helped with confidence. Q20: communication skills. Q21: confident with the unfamiliar.
X Axis – correlation of question score with overall satisfaction score (importance)
Y axis – Minimum question score across institutions (performance)
Size of bubble – range of question score across institutions (potential to learn from best practice)
13
Variation in individual question responses The spread of responses around the average is wide, indicating that students were experiencing very
different standards in different courses. Table 1 shows a range of overall satisfaction for “built environment courses” of 40%, meaning that the best performing courses had 40% more of their students
who responded to the survey agreeing with the statement “overall I am satisfied with the quality of my
course” than did the worst performing courses. The full range of scores is presented because, for the
purpose of this analysis, the variation within built environment courses is relevant. A wide range of scores
represents an opportunity for the lower, and particularly the lowest, scoring courses to take stock of
best practice and aspire to meet the higher scores of similar courses elsewhere. However, for this
potential to be realised, it is important to make comparisons among similar courses, and therefore this
analysis is performed at a reference course level.
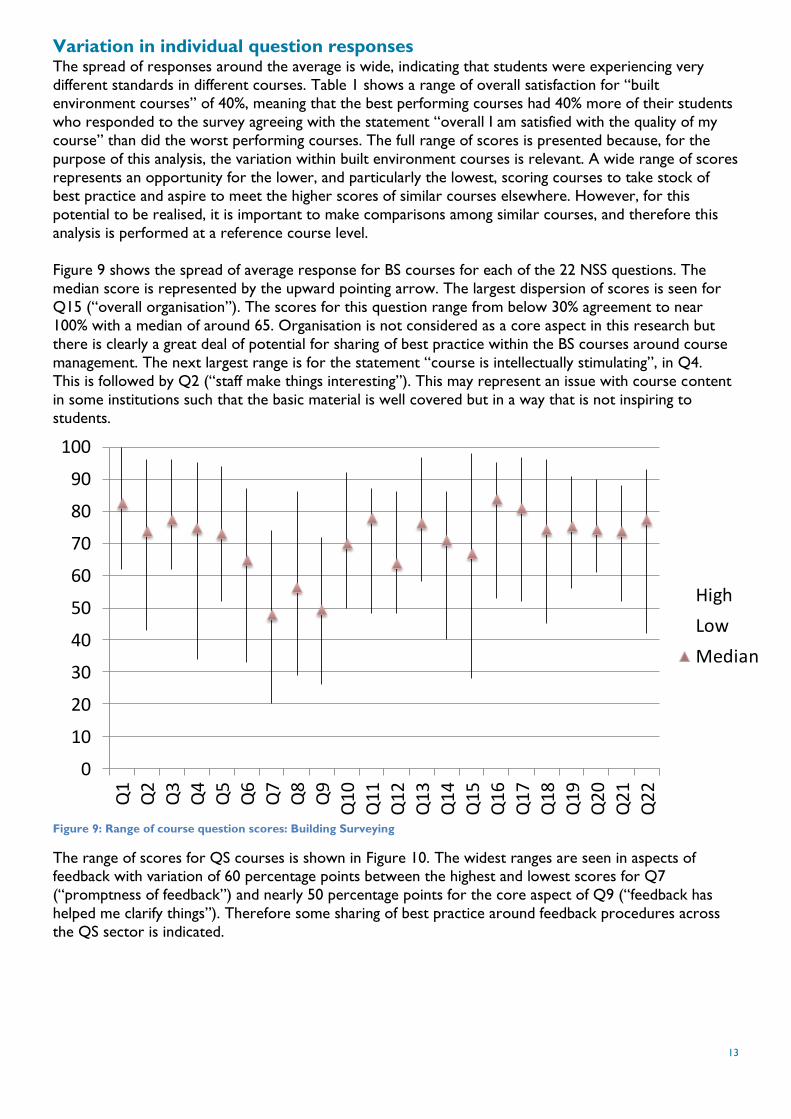
Figure 9 shows the spread of average response for BS courses for each of the 22 NSS questions. The
median score is represented by the upward pointing arrow. The largest dispersion of scores is seen for
Q15 (“overall organisation”). The scores for this question range from below 30% agreement to near
100% with a median of around 65. Organisation is not considered as a core aspect in this research but
there is clearly a great deal of potential for sharing of best practice within the BS courses around course
management. The next largest range is for the statement “course is intellectually stimulating”, in Q4.
This is followed by Q2 (“staff make things interesting”). This may represent an issue with course content
in some institutions such that the basic material is well covered but in a way that is not inspiring to
students.
Figure 9: Range of course question scores: Building Surveying
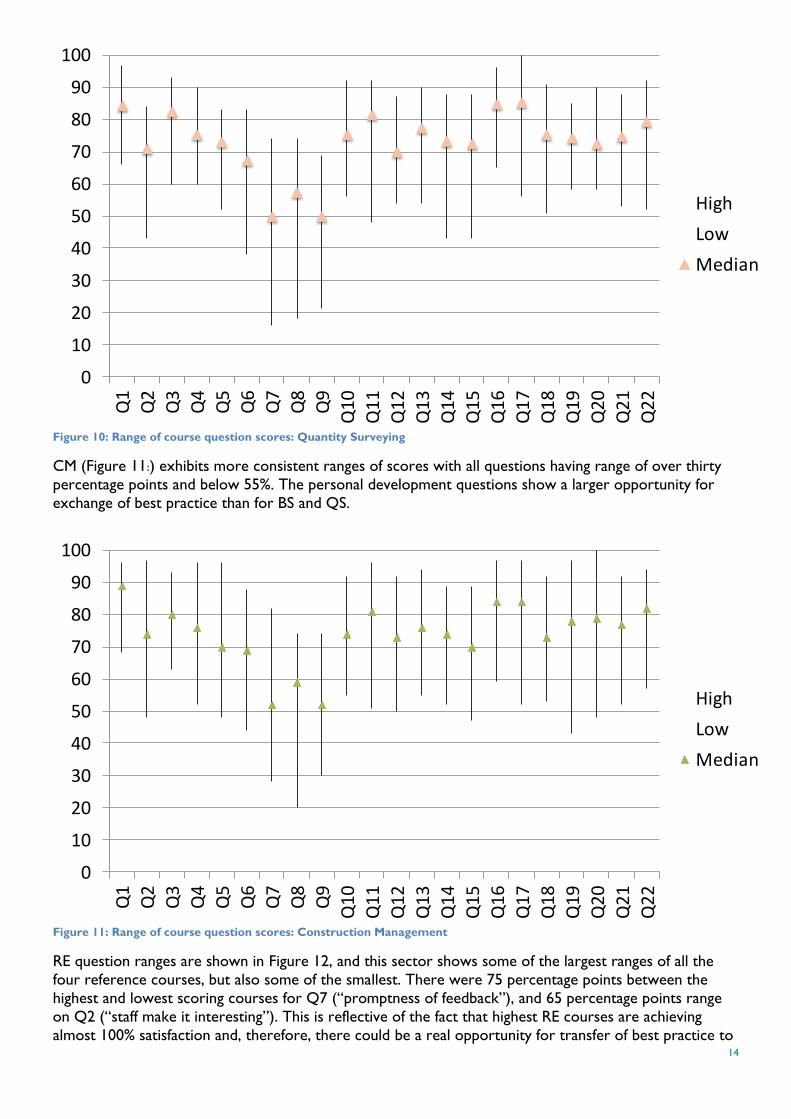
The range of scores for QS courses is shown in Figure 10. The widest ranges are seen in aspects of feedback with variation of 60 percentage points between the highest and lowest scores for Q7
(“promptness of feedback”) and nearly 50 percentage points for the core aspect of Q9 (“feedback has
helped me clarify things”). Therefore some sharing of best practice around feedback procedures across
the QS sector is indicated.
0
10
20
30
40
50
60
70
80
90
100
Q1
Q2
Q3
Q4
Q5
Q6
Q7
Q8
Q9
Q1
0
Q1
1
Q1
2
Q1
3
Q1
4
Q1
5
Q1
6
Q1
7
Q1
8
Q1
9
Q2
0
Q2
1
Q2
2
High
Low
Median
14
Figure 10: Range of course question scores: Quantity Surveying
CM (Figure 11:) exhibits more consistent ranges of scores with all questions having range of over thirty
percentage points and below 55%. The personal development questions show a larger opportunity for
exchange of best practice than for BS and QS.
Figure 11: Range of course question scores: Construction Management
RE question ranges are shown in Figure 12, and this sector shows some of the largest ranges of all the
four reference courses, but also some of the smallest. There were 75 percentage points between the
highest and lowest scoring courses for Q7 (“promptness of feedback”), and 65 percentage points range
on Q2 (“staff make it interesting”). This is reflective of the fact that highest RE courses are achieving
almost 100% satisfaction and, therefore, there could be a real opportunity for transfer of best practice to
0
10
20
30
40
50
60
70
80
90
100
Q1
Q2
Q3
Q4
Q5
Q6
Q7
Q8
Q9
Q1
0
Q1
1
Q1
2
Q1
3
Q1
4
Q1
5
Q1
6
Q1
7
Q1
8
Q1
9
Q2
0
Q2
1
Q2
2
High
Low
Median
0
10
20
30
40
50
60
70
80
90
100
Q1
Q2
Q3
Q4
Q5
Q6
Q7
Q8
Q9
Q1
0
Q1
1
Q1
2
Q1
3
Q1
4
Q1
5
Q1
6
Q1
7
Q1
8
Q1
9
Q2
0
Q2
1
Q2
2
High
Low
Median

15
improve the RE provision, but less opportunity for gains from improvements in the best practice
currently exhibited. However, one of the core aspects, Q9 (“feedback has helped me clarify things”),
scores relatively weakly for RE courses, and the median is also low at 50% representing a possible focus
for improvement efforts.
Figure 12: Range of course question scores: real estate
A common thread through the four reference courses is the wide range and low scores associated with
promptness of feedback. Students’ expectations of “prompt feedback” may be different from the typical
university policy of providing feedback within a number of weeks. Scores in this area might be improved
by managing student expectations of written feedback by clearly communicating the policy. It may also be
worthwhile to stress that, on occasions when instant verbal feedback is given, this process is part of the
feedback process.
0
10
20
30
40
50
60
70
80
90
100Q
1
Q2
Q3
Q4
Q5
Q6
Q7
Q8
Q9
Q1
0
Q1
1
Q1
2
Q1
3
Q1
4
Q1
5
Q1
6
Q1
7
Q1
8
Q1
9
Q2
0
Q2
1
Q2
2
High
Low
Median
KEY:
Q1: staff good at explaining. Q2: staff make it interesting. Q3: staff are enthusiastic.
Q4: Intellectually stimulating. Q5: marking criteria clear. Q6: marking is fair.
Q7: Feedback prompt. Q8: received detailed comments. Q9: feedback has clarified things.
Q10: support and advice sufficient. Q11: able to contact staff. Q12: good advice available.
Q13: timetable works efficiently. Q14: changes communicated. Q15:course well organised.
Q16: library resources and services. Q17: General IT resources. Q18: special equipment.
Q19: helped with confidence. Q20: communication skills. Q21: confident with the unfamiliar.
X Axis – correlation of question score with overall satisfaction score (importance)
Y axis – Minimum question score across institutions (performance)
Size of bubble – range of question score across institutions (potential to learn from best practice)

16
Correlation analyses The correlation of mean question scores with overall satisfaction score (Q22) for the four reference
courses are shown in Figure 13. Correlation can be cautiously interpreted as representing the importance of a question category to students. This is because high correlation (near to 1) implies that
students who responded more positively to a given question tended to be more satisfied overall, and low
correlation (near to 0) indicates that responding positively to a given question is not predictive of overall
satisfaction. However, no causal link has been established by this correlation score and, therefore, it does
not necessarily follow that improving the score of highly correlated questions will improve overall
satisfaction.
The overview shows that, in general, learning resources have the lowest correlation with overall
satisfaction, followed by feedback aspects. The highest correlations are with the organisation and teaching
aspects of courses. This pattern shows some consistency across the four reference courses but exhibits
less consistency than for the raw satisfaction scores. This may reflect the fact that high scores on most
questions are less subjective, requiring students to assess the standard of a service against expectations
rather than their individual needs and requirements. However, overall satisfaction could be experienced
more holistically as a combination of satisfying individual needs and meeting standards. As an example, all
students may objectively judge feedback to have been poor against stated or expected standards, but
their view regarding the relevance of feedback may be much more subjective and could relate to
discipline specific needs or student characteristics. This may be a factor in explaining the great difference
in correlation scores between CM and the other reference courses. In general CM correlations are much
lower than the rest in aspects related to logistics and resourcing, perhaps reflecting a student body that is
more likely to be part-time and mature that places greater emphasis on course content and teaching
support.
Figure 13: Cross disciplinary comparison of NSS questions (correlation with overall satisfaction)
0 0.5 1
1. Staff are good at explaining.2. Staff have made the subject interesting.
3. Staff are enthusiastic.4. The course is intellectually stimulating.
5. The marking criteria clear in advance.6. Assessment fair.
7. Feedback prompt.8. I have received detailed comments.
9. Feedback has helped me clarify things.10. I have received sufficient advice and support.
11. I have been able to contact staff.12. Good advice was available.
13. The timetable works efficiently.14. Any changes have been communicated effectively.
15. The course is well organised and is running smoothly.16. The library resources and services are good.
17. I have been able to access IT resources.18. I have been able to access specialised equipment.19. The course has helped me to present myself with …
20. My communication skills have improved.21. I feel confident in tackling unfamiliar problems.
Real Estate Construction Management
Building Surveying Quantity Surveying
17
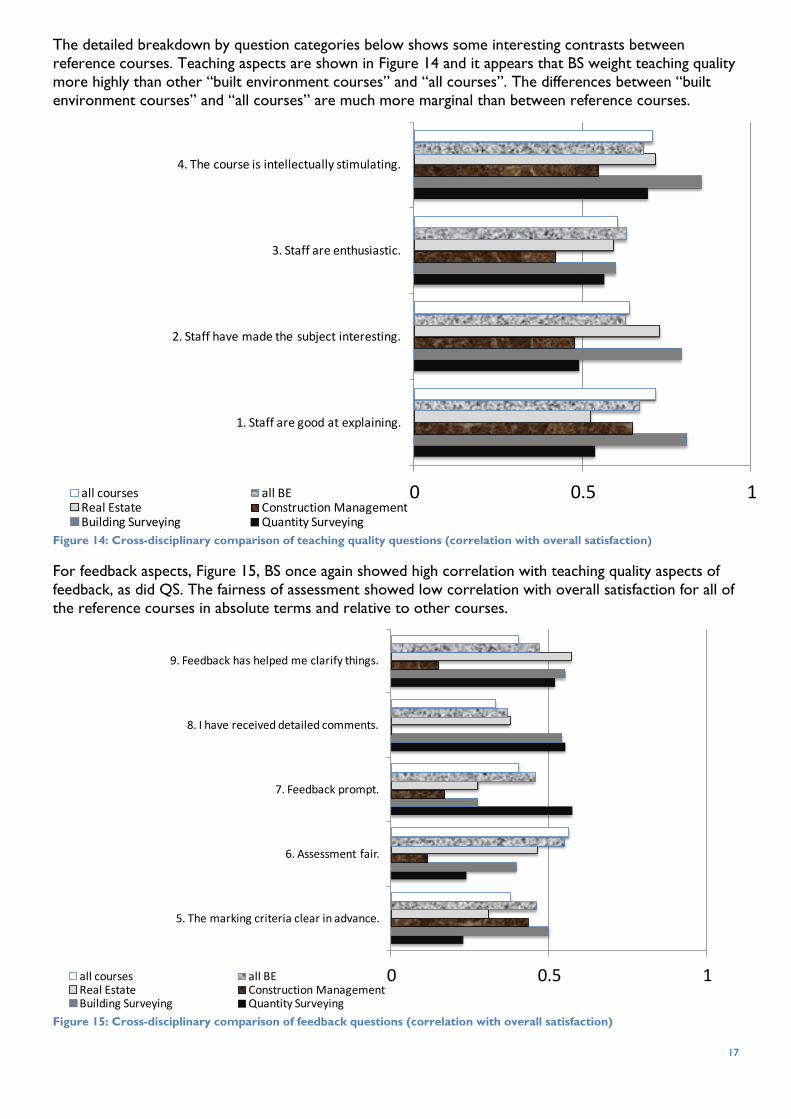
The detailed breakdown by question categories below shows some interesting contrasts between
reference courses. Teaching aspects are shown in Figure 14 and it appears that BS weight teaching quality
more highly than other “built environment courses” and “all courses”. The differences between “built
environment courses” and “all courses” are much more marginal than between reference courses.
Figure 14: Cross-disciplinary comparison of teaching quality questions (correlation with overall satisfaction)
For feedback aspects, Figure 15, BS once again showed high correlation with teaching quality aspects of
feedback, as did QS. The fairness of assessment showed low correlation with overall satisfaction for all of
the reference courses in absolute terms and relative to other courses.
Figure 15: Cross-disciplinary comparison of feedback questions (correlation with overall satisfaction)
0 0.5 1
1. Staff are good at explaining.
2. Staff have made the subject interesting.
3. Staff are enthusiastic.
4. The course is intellectually stimulating.
all courses all BEReal Estate Construction ManagementBuilding Surveying Quantity Surveying
0 0.5 1
5. The marking criteria clear in advance.
6. Assessment fair.
7. Feedback prompt.
8. I have received detailed comments.
9. Feedback has helped me clarify things.
all courses all BEReal Estate Construction ManagementBuilding Surveying Quantity Surveying

18
Figure 16 shows that support and advice is most important to RE students and that “built environment
courses” in general show higher correlation of support and advice with overall satisfaction than “all
courses”. For BS students being able to contact staff when required appears important whereas the
availability of good advice was more important to RE and QS.
Figure 16: Cross-disciplinary comparison of student support questions (correlation with overall satisfaction)
Organisation and management (Figure 17) is seen as universally important; all cohorts exhibiting correlation over 0.7. However, the importance of related logistical aspects of communication of changes
and timetabling varies a great deal with CM showing no correlation at all for timetabling and very low for
communication. RE are the most concerned about timetabling.
Figure 17: Cross-disciplinary comparison of organisation and management questions (correlation with overall satisfaction)
0 0.5 1
10. I have received sufficient advice and support.
11. I have been able to contact staff.
12. Good advice was available.
all courses all BEReal Estate Construction ManagementBuilding Surveying Quantity Surveying
0 0.5 1
13. The timetable works efficiently.
14. Any changes have been communicated effectively.
15. The course is well organised and is running smoothly.
all courses all BEReal Estate Construction ManagementBuilding Surveying Quantity Surveying
19
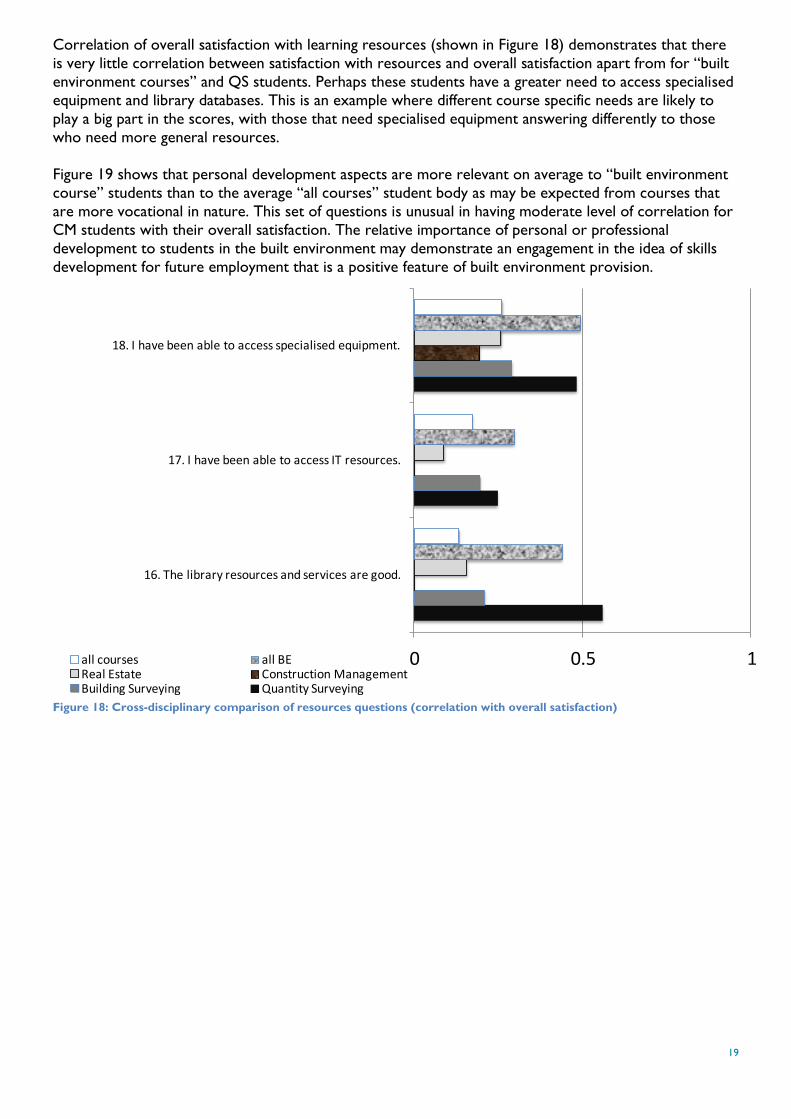
Correlation of overall satisfaction with learning resources (shown in Figure 18) demonstrates that there
is very little correlation between satisfaction with resources and overall satisfaction apart from for “built
environment courses” and QS students. Perhaps these students have a greater need to access specialised
equipment and library databases. This is an example where different course specific needs are likely to
play a big part in the scores, with those that need specialised equipment answering differently to those
who need more general resources.
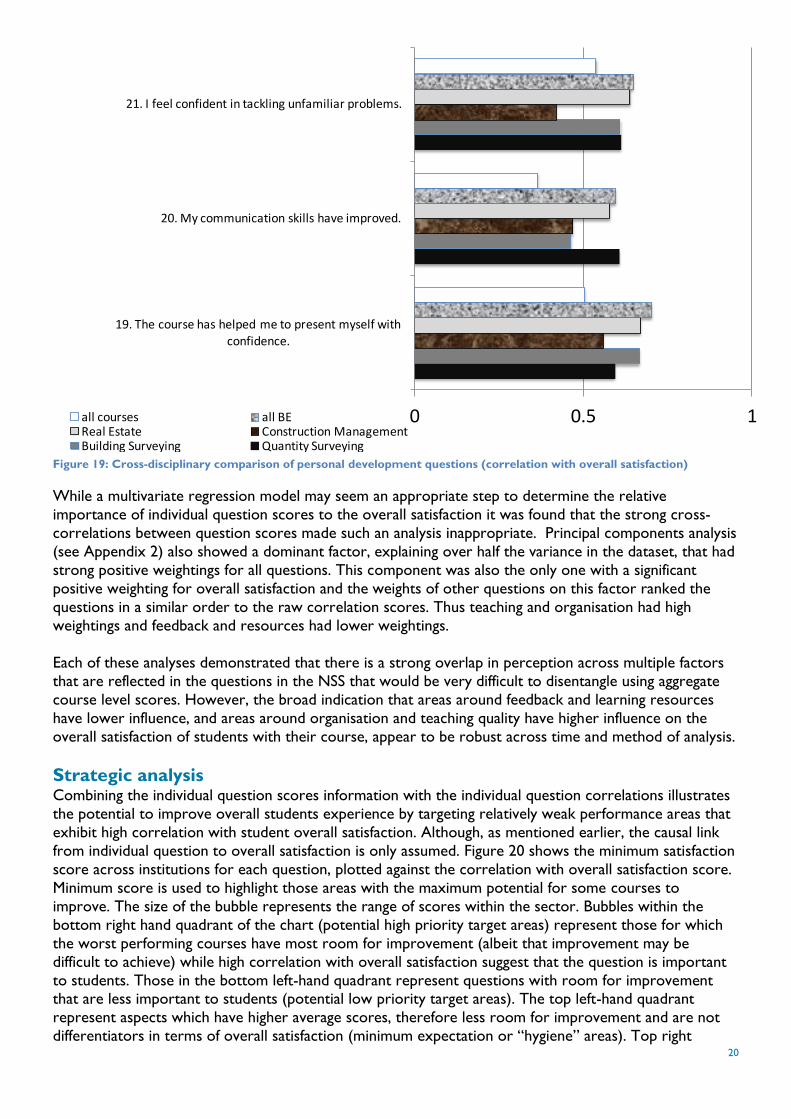
Figure 19 shows that personal development aspects are more relevant on average to “built environment
course” students than to the average “all courses” student body as may be expected from courses that
are more vocational in nature. This set of questions is unusual in having moderate level of correlation for
CM students with their overall satisfaction. The relative importance of personal or professional
development to students in the built environment may demonstrate an engagement in the idea of skills
development for future employment that is a positive feature of built environment provision.
Figure 18: Cross-disciplinary comparison of resources questions (correlation with overall satisfaction)
0 0.5 1
16. The library resources and services are good.
17. I have been able to access IT resources.
18. I have been able to access specialised equipment.
all courses all BEReal Estate Construction ManagementBuilding Surveying Quantity Surveying
20
Figure 19: Cross-disciplinary comparison of personal development questions (correlation with overall satisfaction)
While a multivariate regression model may seem an appropriate step to determine the relative
importance of individual question scores to the overall satisfaction it was found that the strong cross-
correlations between question scores made such an analysis inappropriate. Principal components analysis
(see Appendix 2) also showed a dominant factor, explaining over half the variance in the dataset, that had
strong positive weightings for all questions. This component was also the only one with a significant
positive weighting for overall satisfaction and the weights of other questions on this factor ranked the
questions in a similar order to the raw correlation scores. Thus teaching and organisation had high
weightings and feedback and resources had lower weightings.
Each of these analyses demonstrated that there is a strong overlap in perception across multiple factors
that are reflected in the questions in the NSS that would be very difficult to disentangle using aggregate
course level scores. However, the broad indication that areas around feedback and learning resources
have lower influence, and areas around organisation and teaching quality have higher influence on the
overall satisfaction of students with their course, appear to be robust across time and method of analysis.
Strategic analysis Combining the individual question scores information with the individual question correlations illustrates
the potential to improve overall students experience by targeting relatively weak performance areas that
exhibit high correlation with student overall satisfaction. Although, as mentioned earlier, the causal link
from individual question to overall satisfaction is only assumed. Figure 20 shows the minimum satisfaction
score across institutions for each question, plotted against the correlation with overall satisfaction score.
Minimum score is used to highlight those areas with the maximum potential for some courses to
improve. The size of the bubble represents the range of scores within the sector. Bubbles within the
bottom right hand quadrant of the chart (potential high priority target areas) represent those for which
the worst performing courses have most room for improvement (albeit that improvement may be
difficult to achieve) while high correlation with overall satisfaction suggest that the question is important
to students. Those in the bottom left-hand quadrant represent questions with room for improvement that are less important to students (potential low priority target areas). The top left-hand quadrant
represent aspects which have higher average scores, therefore less room for improvement and are not
differentiators in terms of overall satisfaction (minimum expectation or “hygiene” areas). Top right
0 0.5 1
19. The course has helped me to present myself with confidence.
20. My communication skills have improved.
21. I feel confident in tackling unfamiliar problems.
all courses all BEReal Estate Construction ManagementBuilding Surveying Quantity Surveying
21
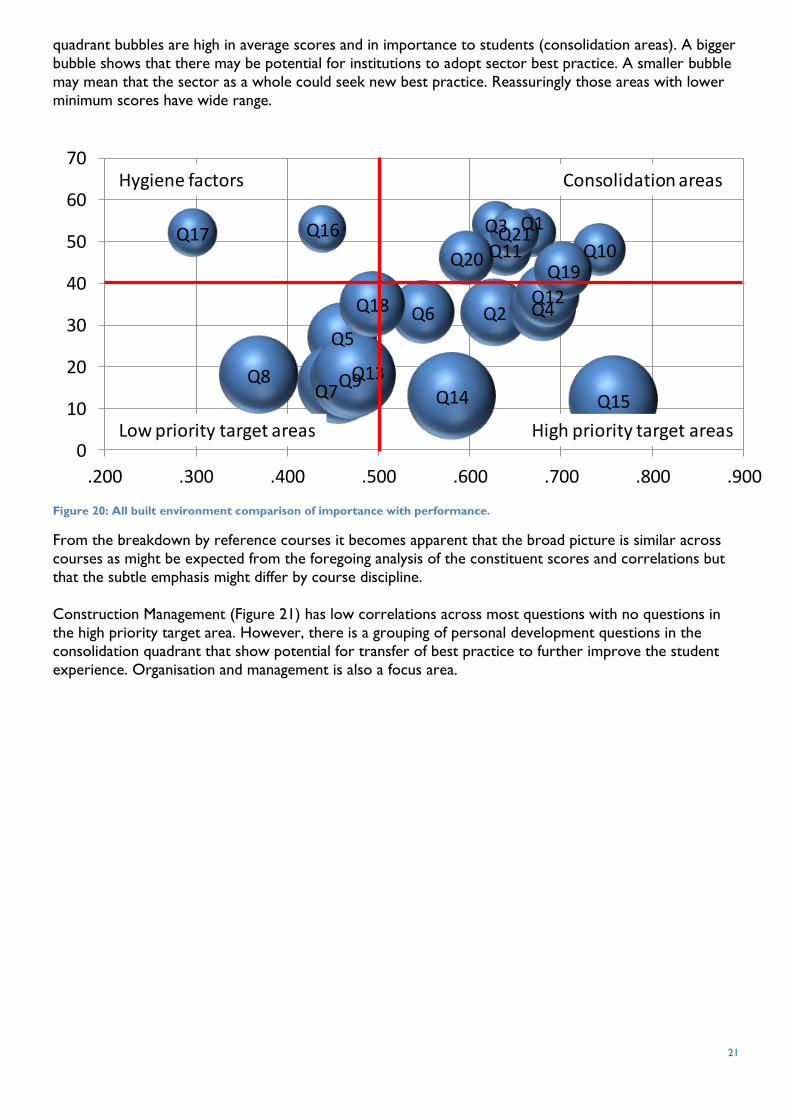
quadrant bubbles are high in average scores and in importance to students (consolidation areas). A bigger
bubble shows that there may be potential for institutions to adopt sector best practice. A smaller bubble
may mean that the sector as a whole could seek new best practice. Reassuringly those areas with lower
minimum scores have wide range.
Figure 20: All built environment comparison of importance with performance.
From the breakdown by reference courses it becomes apparent that the broad picture is similar across
courses as might be expected from the foregoing analysis of the constituent scores and correlations but
that the subtle emphasis might differ by course discipline.
Construction Management (Figure 21) has low correlations across most questions with no questions in
the high priority target area. However, there is a grouping of personal development questions in the
consolidation quadrant that show potential for transfer of best practice to further improve the student
experience. Organisation and management is also a focus area.
Q1
Q2
Q3
Q4
Q5
Q6
Q7Q8 Q9
Q10Q11
Q12
Q13Q14 Q15
Q16Q17
Q18
Q19Q20
Q21
0
10
20
30
40
50
60
70
.200 .300 .400 .500 .600 .700 .800 .900
High priority target areasLow priority target areas
Hygiene factors Consolidation areas

22
Figure 21: Construction management comparison of importance with performance
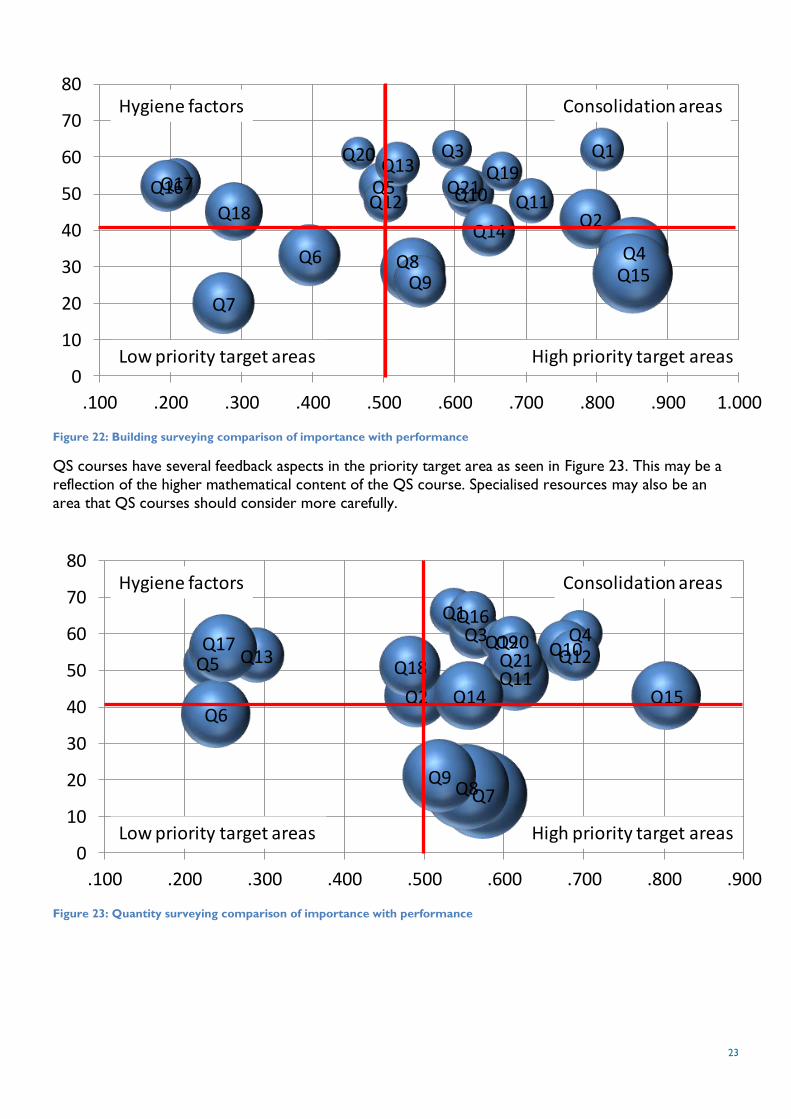
For BS courses (Figure 22) the highest priority targets would appear to be in intellectual course content
and organisation and management of courses. Other high priority targets are detailed and clear feedback.
Communication of changes is on the borderline of performance.
Q1
Q2
Q3
Q4Q5
Q6
Q7
Q8
Q9
Q10Q11Q12
Q13Q14
Q15
Q17
Q16 Q18
Q19Q20
Q21
0
10
20
30
40
50
60
70
80
-.500 -.400 -.300 -.200 -.100 .000 .100 .200 .300 .400 .500 .600 .700 .800 .900
High priority target areasLow priority target areas
Hygiene factors Consolidation areas
KEY:
Q1: staff good at explaining. Q2: staff make it interesting. Q3: staff are enthusiastic.
Q4: Intellectually stimulating. Q5: marking criteria clear. Q6: marking is fair.
Q7: Feedback prompt. Q8: received detailed comments. Q9: feedback has clarified things.
Q10: support and advice sufficient. Q11: able to contact staff. Q12: good advice available.
Q13: timetable works efficiently. Q14: changes communicated. Q15:course well organised.
Q16: library resources and services. Q17: General IT resources. Q18: special equipment.
Q19: helped with confidence. Q20: communication skills. Q21: confident with the unfamiliar.
X Axis – correlation of question score with overall satisfaction score (importance)
Y axis – Minimum question score across institutions (performance)
Size of bubble – range of question score across institutions (potential to learn from best practice)
23
Figure 22: Building surveying comparison of importance with performance
QS courses have several feedback aspects in the priority target area as seen in Figure 23. This may be a
reflection of the higher mathematical content of the QS course. Specialised resources may also be an
area that QS courses should consider more carefully.
Figure 23: Quantity surveying comparison of importance with performance
Q1
Q2
Q3
Q4
Q5
Q6
Q7
Q8Q9
Q10 Q11Q12
Q13
Q14
Q15
Q17Q16
Q18
Q19Q20
Q21
0
10
20
30
40
50
60
70
80
.100 .200 .300 .400 .500 .600 .700 .800 .900 1.000
High priority target areasLow priority target areas
Hygiene factors Consolidation areas
Q1
Q2
Q3 Q4
Q5
Q6
Q7Q8Q9
Q10
Q11Q12Q13
Q14 Q15
Q16
Q17Q18
Q19Q20Q21
0
10
20
30
40
50
60
70
80
.100 .200 .300 .400 .500 .600 .700 .800 .900
High priority target areasLow priority target areas
Hygiene factors Consolidation areas
24
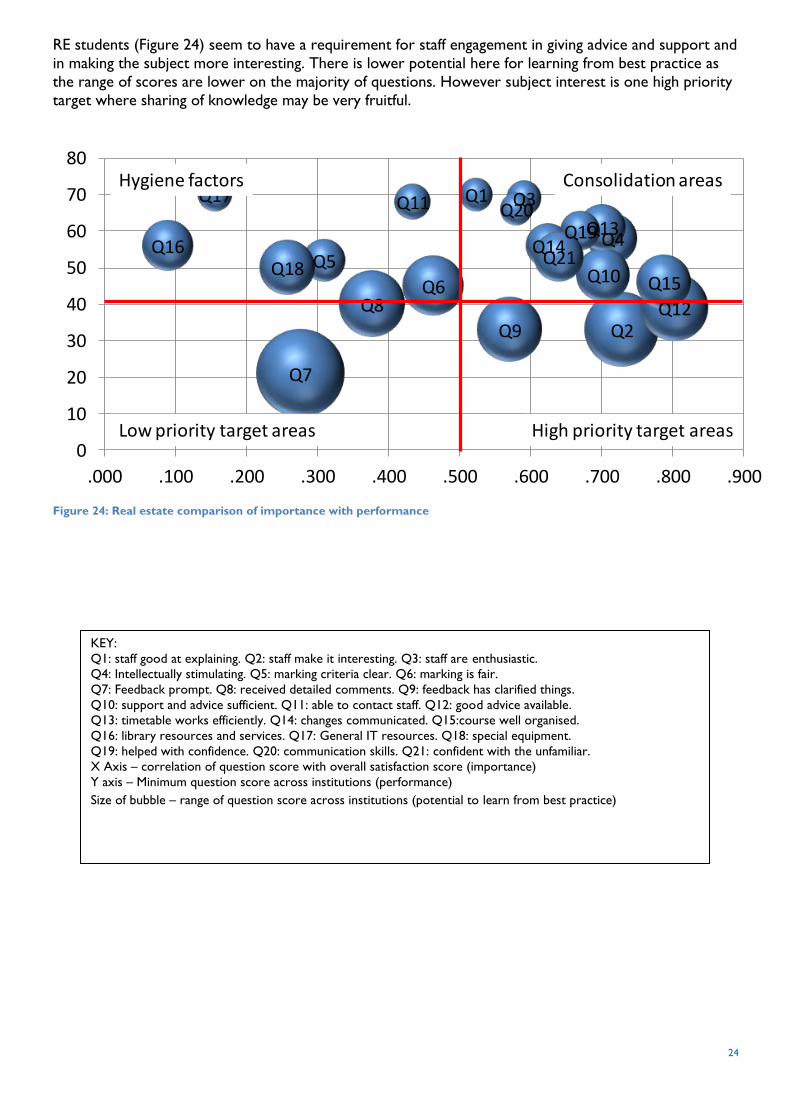
RE students (Figure 24) seem to have a requirement for staff engagement in giving advice and support and
in making the subject more interesting. There is lower potential here for learning from best practice as
the range of scores are lower on the majority of questions. However subject interest is one high priority
target where sharing of knowledge may be very fruitful.
Figure 24: Real estate comparison of importance with performance
Q1
Q2
Q3
Q4Q5
Q6
Q7
Q8
Q9
Q10
Q11
Q12
Q13Q14
Q15
Q17
Q16Q18
Q19Q20
Q21
0
10
20
30
40
50
60
70
80
.000 .100 .200 .300 .400 .500 .600 .700 .800 .900
High priority target areasLow priority target areas
Hygiene factors Consolidation areas
KEY:
Q1: staff good at explaining. Q2: staff make it interesting. Q3: staff are enthusiastic.
Q4: Intellectually stimulating. Q5: marking criteria clear. Q6: marking is fair.
Q7: Feedback prompt. Q8: received detailed comments. Q9: feedback has clarified things.
Q10: support and advice sufficient. Q11: able to contact staff. Q12: good advice available.
Q13: timetable works efficiently. Q14: changes communicated. Q15:course well organised.
Q16: library resources and services. Q17: General IT resources. Q18: special equipment.
Q19: helped with confidence. Q20: communication skills. Q21: confident with the unfamiliar.
X Axis – correlation of question score with overall satisfaction score (importance)
Y axis – Minimum question score across institutions (performance)
Size of bubble – range of question score across institutions (potential to learn from best practice)
25
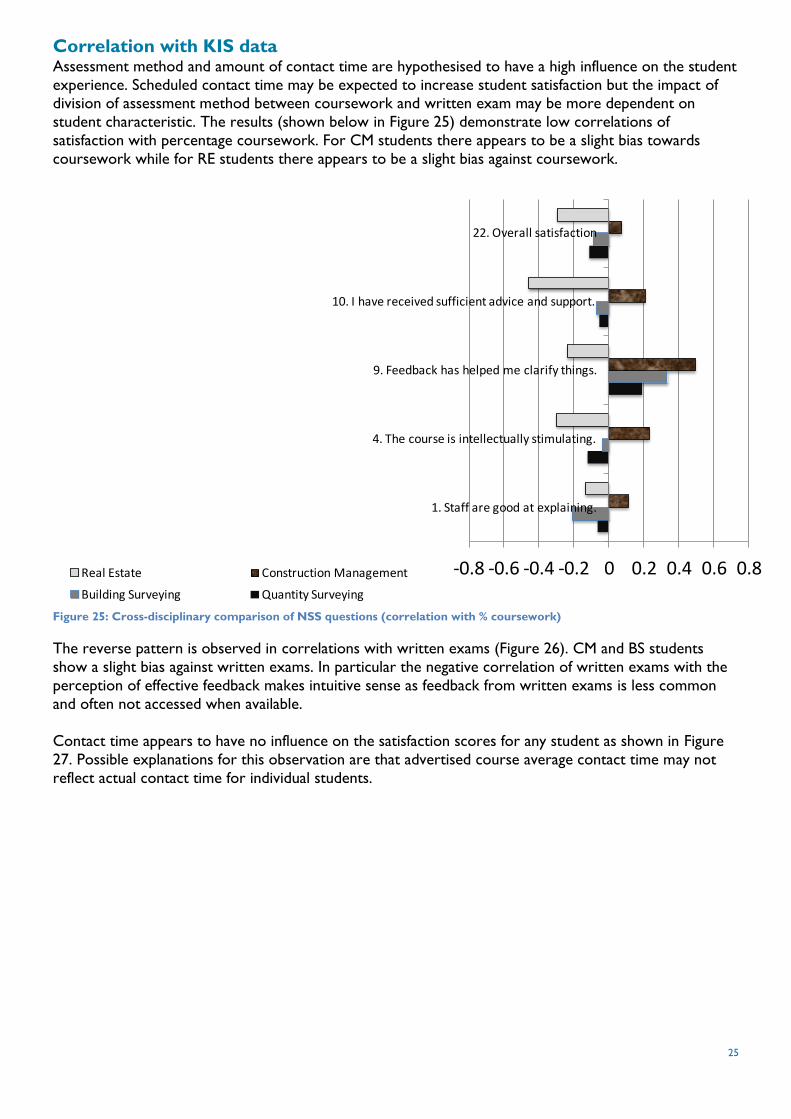
Correlation with KIS data Assessment method and amount of contact time are hypothesised to have a high influence on the student
experience. Scheduled contact time may be expected to increase student satisfaction but the impact of division of assessment method between coursework and written exam may be more dependent on
student characteristic. The results (shown below in Figure 25) demonstrate low correlations of
satisfaction with percentage coursework. For CM students there appears to be a slight bias towards
coursework while for RE students there appears to be a slight bias against coursework.
Figure 25: Cross-disciplinary comparison of NSS questions (correlation with % coursework)
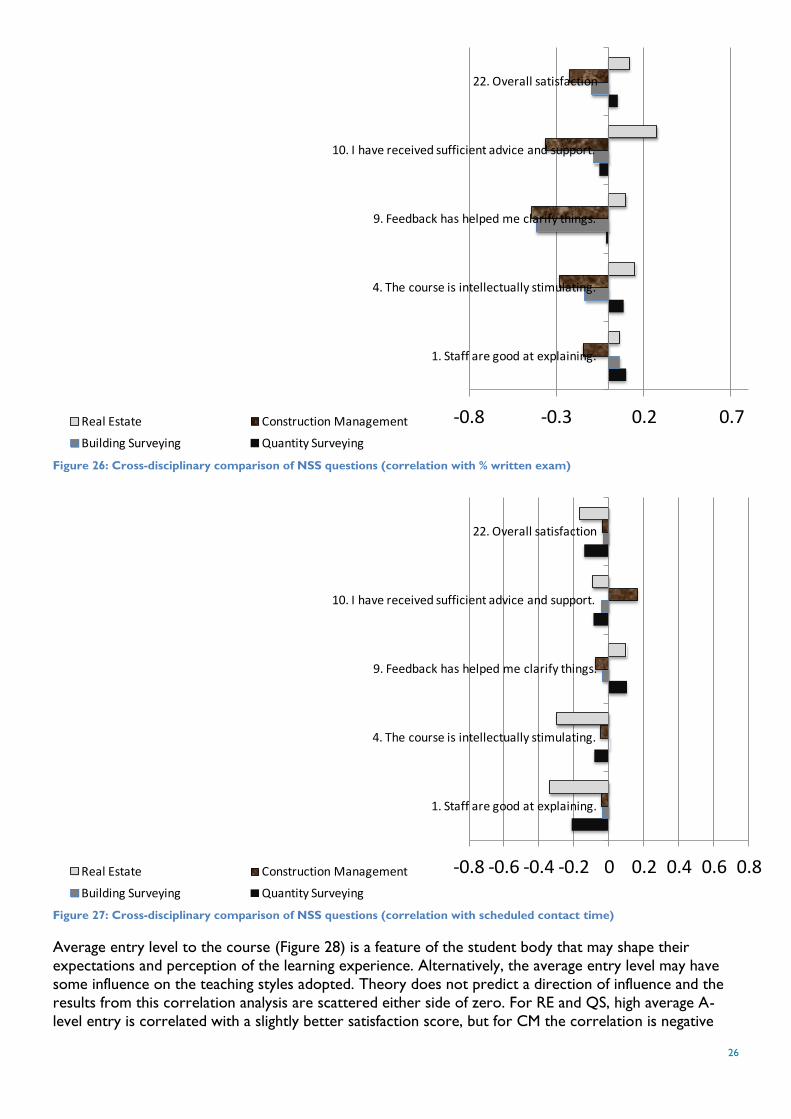
The reverse pattern is observed in correlations with written exams (Figure 26). CM and BS students
show a slight bias against written exams. In particular the negative correlation of written exams with the
perception of effective feedback makes intuitive sense as feedback from written exams is less common
and often not accessed when available.
Contact time appears to have no influence on the satisfaction scores for any student as shown in Figure
27. Possible explanations for this observation are that advertised course average contact time may not
reflect actual contact time for individual students.
-0.8 -0.6 -0.4 -0.2 0 0.2 0.4 0.6 0.8
1. Staff are good at explaining.
4. The course is intellectually stimulating.
9. Feedback has helped me clarify things.
10. I have received sufficient advice and support.
22. Overall satisfaction
Real Estate Construction Management
Building Surveying Quantity Surveying
26
Figure 26: Cross-disciplinary comparison of NSS questions (correlation with % written exam)
Figure 27: Cross-disciplinary comparison of NSS questions (correlation with scheduled contact time)
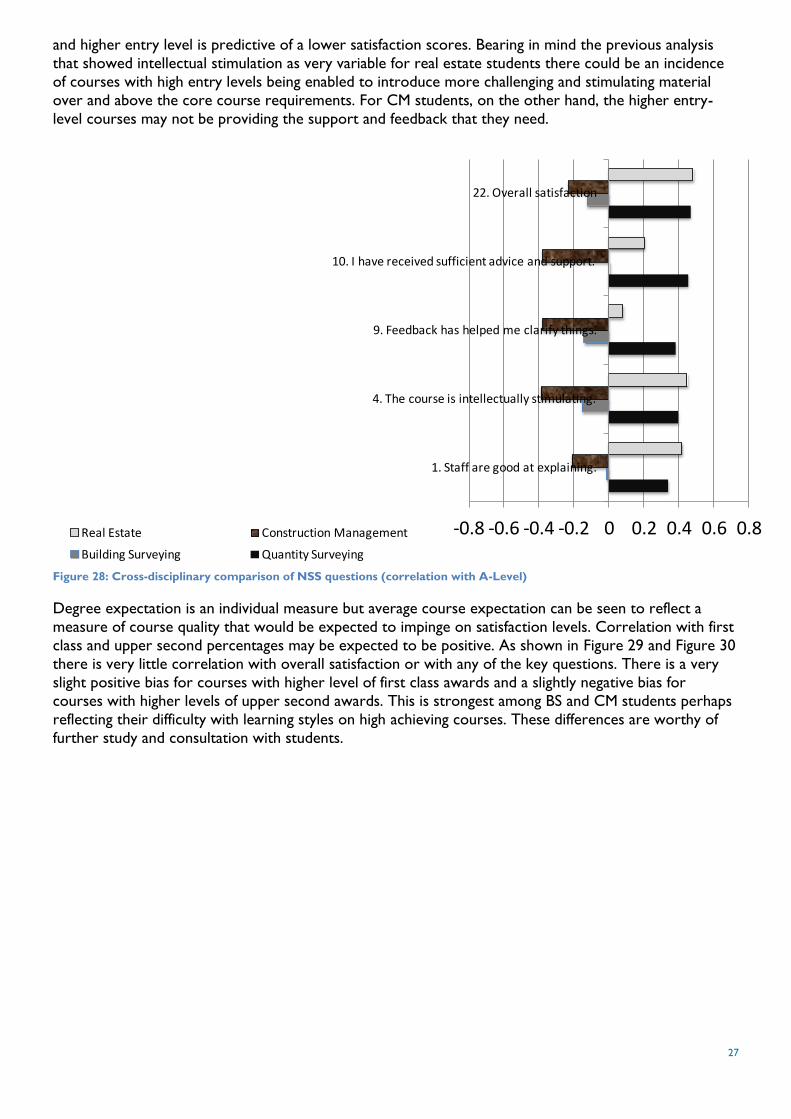
Average entry level to the course (Figure 28) is a feature of the student body that may shape their
expectations and perception of the learning experience. Alternatively, the average entry level may have
some influence on the teaching styles adopted. Theory does not predict a direction of influence and the
results from this correlation analysis are scattered either side of zero. For RE and QS, high average A-
level entry is correlated with a slightly better satisfaction score, but for CM the correlation is negative
-0.8 -0.3 0.2 0.7
1. Staff are good at explaining.
4. The course is intellectually stimulating.
9. Feedback has helped me clarify things.
10. I have received sufficient advice and support.
22. Overall satisfaction
Real Estate Construction Management
Building Surveying Quantity Surveying
-0.8 -0.6 -0.4 -0.2 0 0.2 0.4 0.6 0.8
1. Staff are good at explaining.
4. The course is intellectually stimulating.
9. Feedback has helped me clarify things.
10. I have received sufficient advice and support.
22. Overall satisfaction
Real Estate Construction Management
Building Surveying Quantity Surveying
27
and higher entry level is predictive of a lower satisfaction scores. Bearing in mind the previous analysis
that showed intellectual stimulation as very variable for real estate students there could be an incidence
of courses with high entry levels being enabled to introduce more challenging and stimulating material
over and above the core course requirements. For CM students, on the other hand, the higher entry-
level courses may not be providing the support and feedback that they need.
Figure 28: Cross-disciplinary comparison of NSS questions (correlation with A-Level)
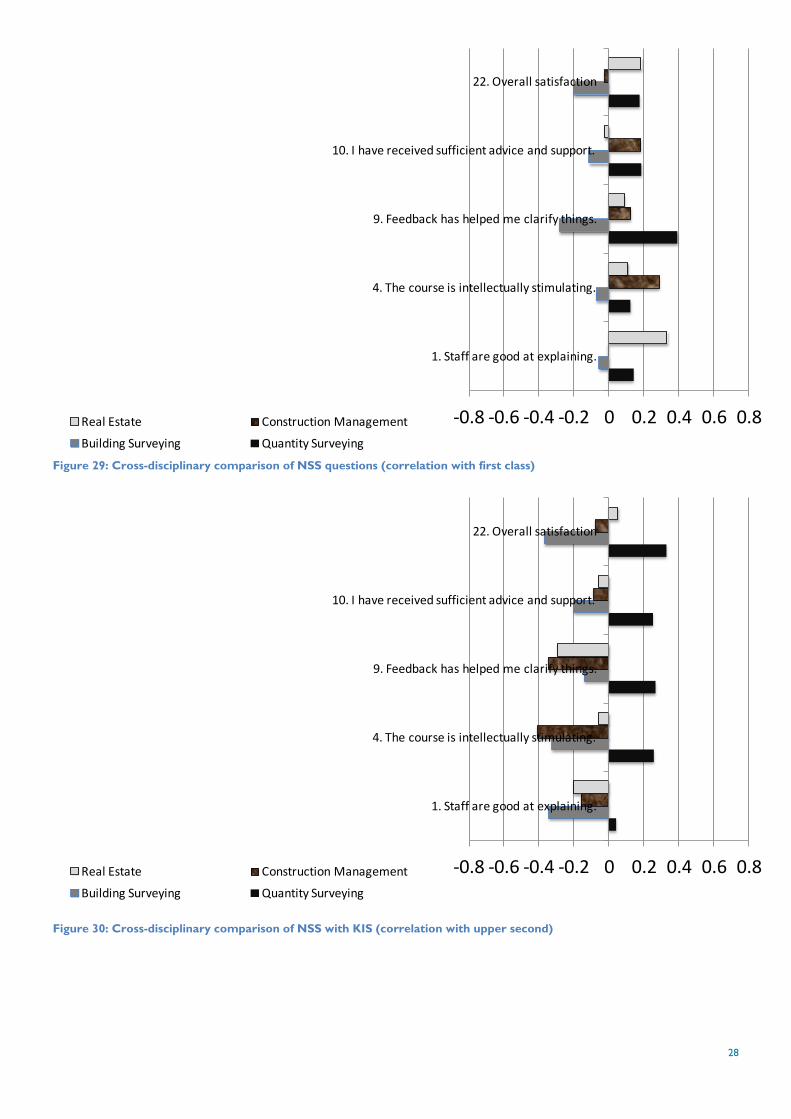
Degree expectation is an individual measure but average course expectation can be seen to reflect a
measure of course quality that would be expected to impinge on satisfaction levels. Correlation with first
class and upper second percentages may be expected to be positive. As shown in Figure 29 and Figure 30
there is very little correlation with overall satisfaction or with any of the key questions. There is a very
slight positive bias for courses with higher level of first class awards and a slightly negative bias for
courses with higher levels of upper second awards. This is strongest among BS and CM students perhaps
reflecting their difficulty with learning styles on high achieving courses. These differences are worthy of
further study and consultation with students.
-0.8 -0.6 -0.4 -0.2 0 0.2 0.4 0.6 0.8
1. Staff are good at explaining.
4. The course is intellectually stimulating.
9. Feedback has helped me clarify things.
10. I have received sufficient advice and support.
22. Overall satisfaction
Real Estate Construction Management
Building Surveying Quantity Surveying
28
Figure 29: Cross-disciplinary comparison of NSS questions (correlation with first class)
Figure 30: Cross-disciplinary comparison of NSS with KIS (correlation with upper second)
-0.8 -0.6 -0.4 -0.2 0 0.2 0.4 0.6 0.8
1. Staff are good at explaining.
4. The course is intellectually stimulating.
9. Feedback has helped me clarify things.
10. I have received sufficient advice and support.
22. Overall satisfaction
Real Estate Construction Management
Building Surveying Quantity Surveying
29
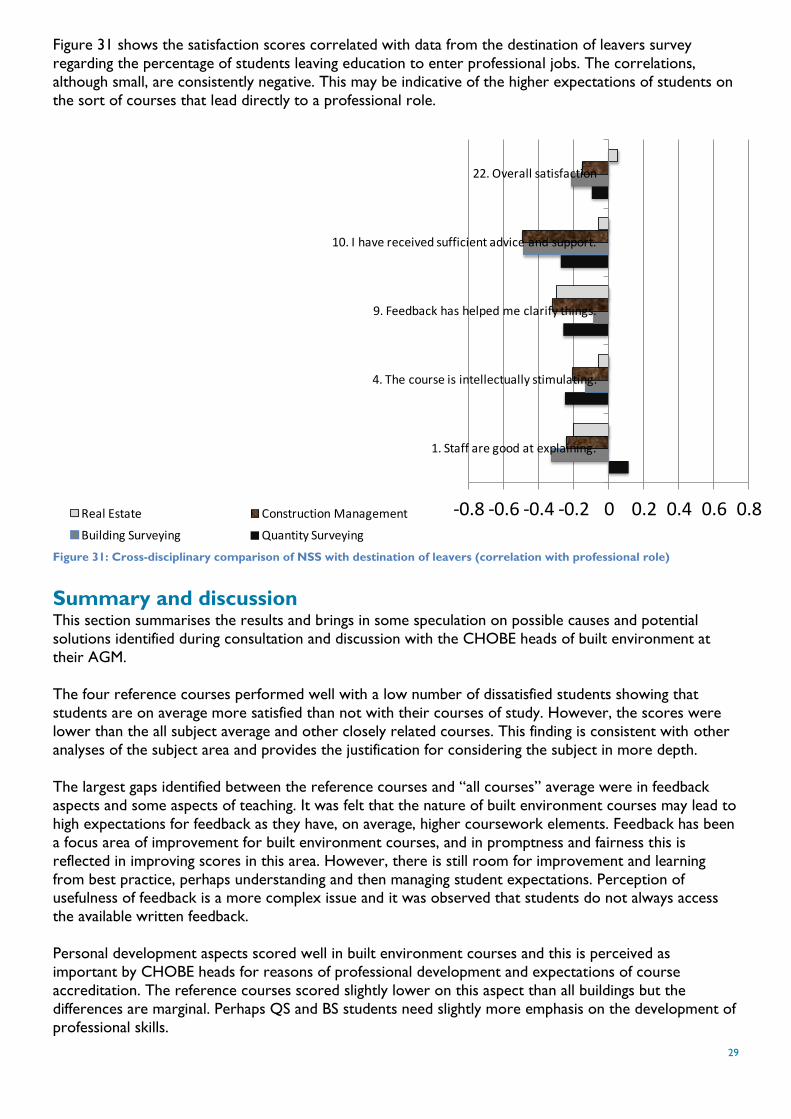
Figure 31 shows the satisfaction scores correlated with data from the destination of leavers survey
regarding the percentage of students leaving education to enter professional jobs. The correlations,
although small, are consistently negative. This may be indicative of the higher expectations of students on
the sort of courses that lead directly to a professional role.
Figure 31: Cross-disciplinary comparison of NSS with destination of leavers (correlation with professional role)
Summary and discussion This section summarises the results and brings in some speculation on possible causes and potential
solutions identified during consultation and discussion with the CHOBE heads of built environment at
their AGM.
The four reference courses performed well with a low number of dissatisfied students showing that
students are on average more satisfied than not with their courses of study. However, the scores were
lower than the all subject average and other closely related courses. This finding is consistent with other
analyses of the subject area and provides the justification for considering the subject in more depth.
The largest gaps identified between the reference courses and “all courses” average were in feedback
aspects and some aspects of teaching. It was felt that the nature of built environment courses may lead to
high expectations for feedback as they have, on average, higher coursework elements. Feedback has been
a focus area of improvement for built environment courses, and in promptness and fairness this is
reflected in improving scores in this area. However, there is still room for improvement and learning
from best practice, perhaps understanding and then managing student expectations. Perception of usefulness of feedback is a more complex issue and it was observed that students do not always access
the available written feedback.
Personal development aspects scored well in built environment courses and this is perceived as
important by CHOBE heads for reasons of professional development and expectations of course
accreditation. The reference courses scored slightly lower on this aspect than all buildings but the
differences are marginal. Perhaps QS and BS students need slightly more emphasis on the development of
professional skills.
-0.8 -0.6 -0.4 -0.2 0 0.2 0.4 0.6 0.8
1. Staff are good at explaining.
4. The course is intellectually stimulating.
9. Feedback has helped me clarify things.
10. I have received sufficient advice and support.
22. Overall satisfaction
Real Estate Construction Management
Building Surveying Quantity Surveying
30
On average RE students were most satisfied with BS students least satisfied among the reference courses.
This may be related to the demographics of the student body as RE students are typically more
“traditional” than those on the other reference courses. Previous research has demonstrated the impact
of high levels of part-time and mature students on satisfaction scores whereby part-time and mature
students are in general less satisfied than more “traditional” students (Proverbs and Lamond, 2008) and
this may have an impact on the reference courses. The present analysis was unable to test for these
factors as they were not represented in the dataset. With the introduction of higher fees and a move
away from part-time provision, this would be an interesting aspect to track over time.
The range of satisfaction scores among courses in different institutions is quite broad, showing that for
some courses there is a great deal of potential to improve the student experience. While RE has higher
average satisfaction and has courses achieving over 90% satisfaction for most questions (even feedback) it
also has the widest dispersion. QS has the most consistent satisfaction scores. Questions with lower
medians tend to have higher dispersion, although there are some exceptions.
Patterns of satisfaction across institutions revealed no strong leaders or followers. Different courses from
the same institution displayed wide variety in their overall satisfaction as well as in their scores for the
focus questions of teaching quality, student support and feedback. In discussion it was felt that some of
the lowest scores observed could be identified as associated with known, short term, problems and
reorganisation of certain courses. Analysis and tracking over the long term was seen as a sensible
approach to targeting improvement areas.
Differences in the question correlation between reference courses are greater than the differences in sector median scores. As noted, this may relate to student needs and characteristics being different in
different subjects.
Students on built environment courses appear most concerned with outcomes such as gaining confidence
and intellectual stimulation and interest, they also want a course to run smoothly. Relative to other
courses, built environment students appear more concerned about these aspects and particularly
personal development. This observation is consistent with the expectation that students on building
courses will enter a challenging professional environment on graduation. Personal and professional
development is also seen as important by CHOBE heads and training in professional skills is perceived to
be strong in built environment courses.
Built environment students are less concerned about feedback and learning resources and they share
these tendencies with other subject disciplines. It would appear that the expectations of students are
being met with regard to their resource requirements, and this may explain the lack of concern with
them.
Within feedback aspects, promptness is the least relevant consideration for students, while fairness and
clear marking criteria are more correlated with overall satisfaction. This raises the question of the
perception of the purpose of feedback from the student point of view. These findings suggest that
students look on feedback as explaining the summative mark rather than as a formative development
process. This is a perception gap that built environment staff may wish to target and, indeed, this is
reflected in courses more generally.
CM students show least correlation between individual question scores and overall satisfaction. They are
the most extreme in their requirement for student support, personal development and explanatory
teaching aspects. This may be related to student characteristics as CM students are seen as not
conforming to traditional routes into higher education.
The greatest opportunities to improve the student experience are in organisation and management of
courses. Good organisation should ideally be a hygiene factor but the challenge of complexity, upheavals
31
and reorganisation within the sector, and increasing student expectations, probably contribute to the
need to continuously improve in this aspect.
Teaching quality is good but needs to be better, some opportunity for sharing best practice around
making courses stimulating, particularly for RE and BS students.
Recommendations The following recommendations emerge from this study:
further research into the feedback expectations of students and opportunities to influence these. This could also come from sharing the results of this analysis with students and, in
discussion with them, developing approaches to meet these expectations through working
in partnership;
further research into the impact of student characteristics on satisfaction levels could be
carried out using multiple regression, discriminant analysis or principal components on
individual student scores. This would require more detailed data than the Unistats
downloadable data and could, for example, involve either access to more disaggregate
NSS/KIS data or a targeted survey of past and present built environment students;
built environment departments and programme teams to explore the high priority target improvement areas with a subject specific focus and develop appropriate plans to address
these issues at a programme specific level;
consider implementing further means to managing the expectations of students with a
clear line of communication about course provision in both directions;
departments to develop further means to improve the perception of professional development within their courses. This might involve greater use of the term “professional
development” in the rhetoric of course delivery to reinforce where and when this is taking
place and the involvement of employers and professionals in course delivery;
teaching quality remains key to student experience and therefore recruitment and
retention on built environment courses. Departments need to take additional steps to
recognise, celebrate and importantly to share best practice.
The following extract from a student nomination summarises what is important to students and
demonstrates that it is eminently achievable:
“He teaches us in lectures and tutorials which are always published on Blackboard before the lecture and tutorial,
which are always useful. He also emails us letting us know when he publishes various documents on the site. The
slides for the lectures mainly contain images which are relevant in describing the individual topics; consequently it
easily allows students to expand on the images with their own writing in order to show the point. The way in which
he teaches is never boring and he is never constantly 'just talking' to us which helps students within the class
concentrate. In addition to the excellent teaching and commitment to the university, he provided excellent support
for the coursework and gave excellent feedback on the work itself."
32
References
Buckley, A. 2012. Making it count: Reflecting on the National Student Survey in the process of
enhancement. York: Higher Education Academy.
Bye, D., Pushkar, D. & Conway, M. 2007. Motivation, interest, and positive affect in traditional and
nontraditional undergraduate students. Adult Education Quarterly 57, 141.
Gabbot, M. & Hogg, G. 1998. Consumers and Services, Chichester, John Wiley and Sons.
Gaffney-Rhys, R. & Jones, J. 2008. Reflections on the UK National Student Survey: a business and
management case study. Newport CELT Journal, 1, 3-14.
Gibbs, G. 2010. Dimensions of quality. York: The Higher Education Academy.
Higher Education Academy 2012. Built Environment, Architecture, Building, Planning and Landscape
Design. National Student Survey Discipline Report. The Higher Education Academy.
Machell, J. & Saunders, M. 2007. An exploratory evaluation of the se of the national Student Survey (NSS) results dissemination website. York: Department of Education Research, Lancaster
University/Higher Education Academy.
Oliver, R. L. 1997. Satisfaction: a behavioural perspective on the consumer, New York, McGraw-Hill.
Proverbs, D. G. & Lamond, J. 2008. National Student Survey of building courses: analysis of 2007 survey
responses. Unpublished: CHOBE/ University of Wolverhampton.
Proverbs, D. G. & Lamond, J. 2009. National Student Survey of building courses: analysis of 2008 survey
responses. Unpublished: CHOBE/ University of Wolverhampton.
Struyven, K., Dochy, F. & Janssens, S. 2005. Students’ perceptions about evaluation and assessment in
higher education: a review. Assessment & Evaluation in Higher Education, 30, 331-347.
Surridge, P. 2008. The National Student Survey 2005-2007: findings and trends. HEFCE.
Surridge, P. 2009. The National Student Survey three years on. What have we learned? York: The Higher
Education Academy.
Tucker, R. 2008. Learning Style Drift: Correlation between Built Environment Students’ Learning Styles
and the Learning Styles of their Teachers.
33
Appendix 1: The dataset The analysis in this report is based on the publically available Unistats downloadable data consisting of
information provided directly by higher education institutions (HEIs) and further education colleges
(FECs) combined with the destinations of leavers survey and the national student survey. This dataset
reports satisfaction at a course level subject to the reporting thresholds of a minimum of 23 responses
and 50% of eligible students responding.
This is a ‘living’ dataset in the respect that institutions are able to update the data at will and this report is
based on the latest version, downloaded on 19 February 2013. Further detailed information about the
data is available from the following link:
http://unistats.direct.gov.uk/media/48215/kis_guidance_documentation.pdf
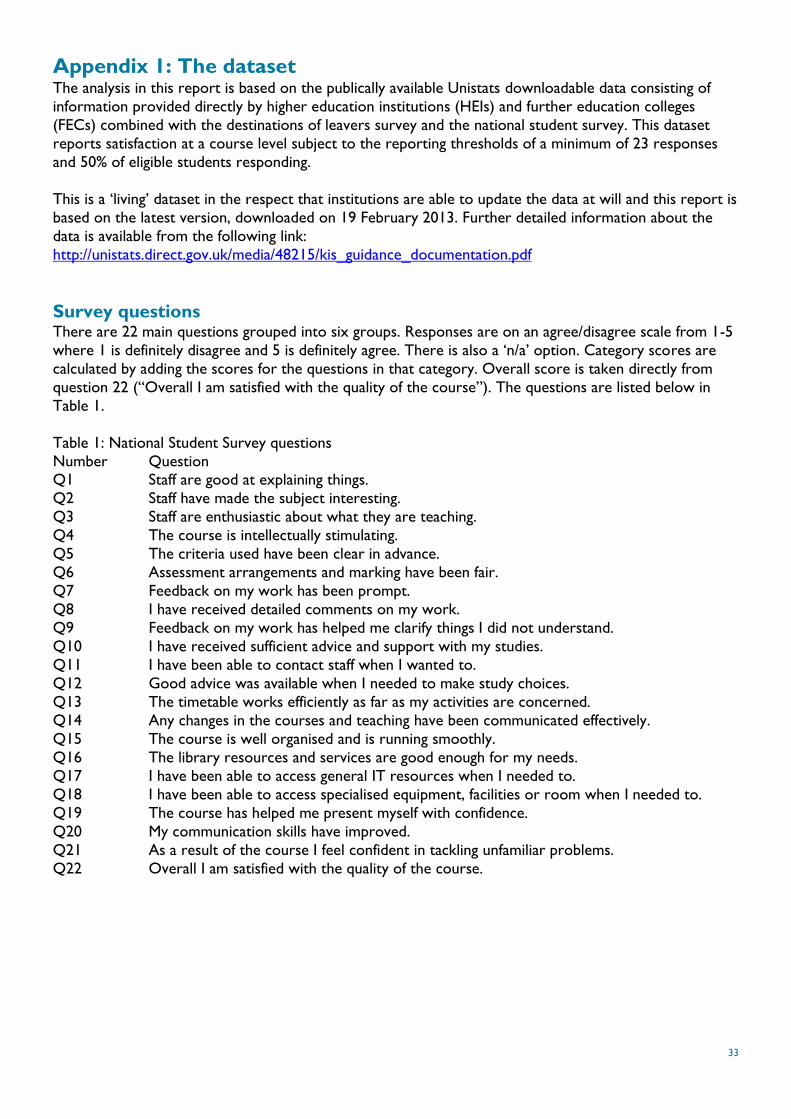
Survey questions There are 22 main questions grouped into six groups. Responses are on an agree/disagree scale from 1-5
where 1 is definitely disagree and 5 is definitely agree. There is also a ‘n/a’ option. Category scores are
calculated by adding the scores for the questions in that category. Overall score is taken directly from
question 22 (“Overall I am satisfied with the quality of the course”). The questions are listed below in
Table 1.
Table 1: National Student Survey questions
Number Question Q1 Staff are good at explaining things.
Q2 Staff have made the subject interesting.
Q3 Staff are enthusiastic about what they are teaching.
Q4 The course is intellectually stimulating.
Q5 The criteria used have been clear in advance.
Q6 Assessment arrangements and marking have been fair.
Q7 Feedback on my work has been prompt.
Q8 I have received detailed comments on my work.
Q9 Feedback on my work has helped me clarify things I did not understand.
Q10 I have received sufficient advice and support with my studies.
Q11 I have been able to contact staff when I wanted to.
Q12 Good advice was available when I needed to make study choices.
Q13 The timetable works efficiently as far as my activities are concerned.
Q14 Any changes in the courses and teaching have been communicated effectively.
Q15 The course is well organised and is running smoothly.
Q16 The library resources and services are good enough for my needs.
Q17 I have been able to access general IT resources when I needed to.
Q18 I have been able to access specialised equipment, facilities or room when I needed to.
Q19 The course has helped me present myself with confidence.
Q20 My communication skills have improved.
Q21 As a result of the course I feel confident in tackling unfamiliar problems.
Q22 Overall I am satisfied with the quality of the course.

34
Appendix 2: Factors derived from principal components analysis of
NSS question scores.
Building Surveying
Component matrixa
Component
1 2 3 4 5
Q1 .876 -.172 -.239 .209
Q2 .875 -.206 -.111 .218
Q3 .734 -.223 -.196 .518 .156
Q4 .833 -.365 -.296
Q5 .614 .371 -.336 .238
Q6 .664 .403 -.119 -.120 -.212
Q7 .515 -.216 .556 .471 -.243
Q8 .668 -.369 .549 .129
Q9 .729 -.244 .448 -.217
Q10 .843 .150 .153 -.185
Q11 .849 .240 -.114
Q12 .693 .132 .261 -.035 .428
Q13 .567 -.485 -.303
Q14 .710 -.229 -.155 -.243 .352
Q15 .942 -.124 .115
Q16 .364 .754 .248 -.004 .370
Q17 .482 .684 .023 .161 -.329
Q18 .493 .745 .113 .118
Q19 .820 -.155 -.374 -.136
Q20 .638 .344 .201 -.340
Q21 .749 .096 -.225 -.484
Q22 .869 -.193 -.210 .115
Extraction method: principal component analysis.
a. 5 components extracted.
35
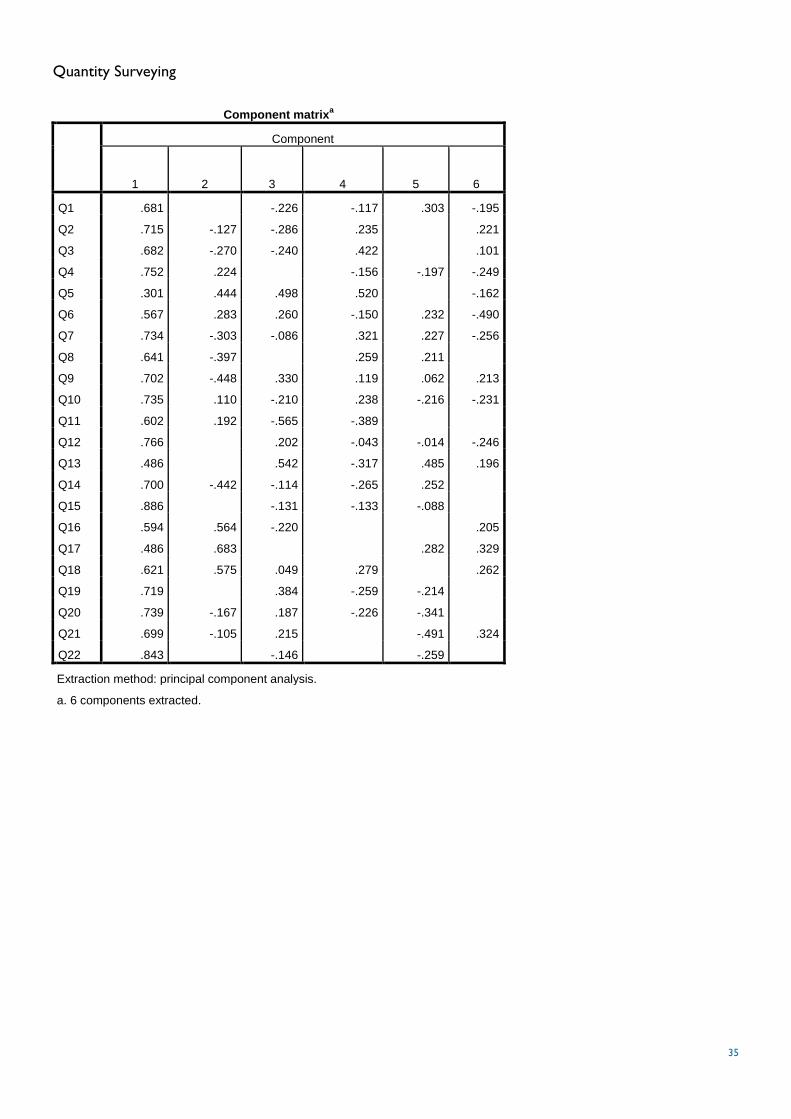
Quantity Surveying
Component matrixa
Component
1 2
3 4 5 6
Q1 .681 -.226 -.117 .303 -.195
Q2 .715 -.127 -.286 .235 .221
Q3 .682 -.270 -.240 .422 .101
Q4 .752 .224 -.156 -.197 -.249
Q5 .301 .444 .498 .520 -.162
Q6 .567 .283 .260 -.150 .232 -.490
Q7 .734 -.303 -.086 .321 .227 -.256
Q8 .641 -.397 .259 .211
Q9 .702 -.448 .330 .119 .062 .213
Q10 .735 .110 -.210 .238 -.216 -.231
Q11 .602 .192 -.565 -.389
Q12 .766 .202 -.043 -.014 -.246
Q13 .486 .542 -.317 .485 .196
Q14 .700 -.442 -.114 -.265 .252
Q15 .886 -.131 -.133 -.088
Q16 .594 .564 -.220 .205
Q17 .486 .683 .282 .329
Q18 .621 .575 .049 .279 .262
Q19 .719 .384 -.259 -.214
Q20 .739 -.167 .187 -.226 -.341
Q21 .699 -.105 .215 -.491 .324
Q22 .843 -.146 -.259
Extraction method: principal component analysis.
a. 6 components extracted.
36
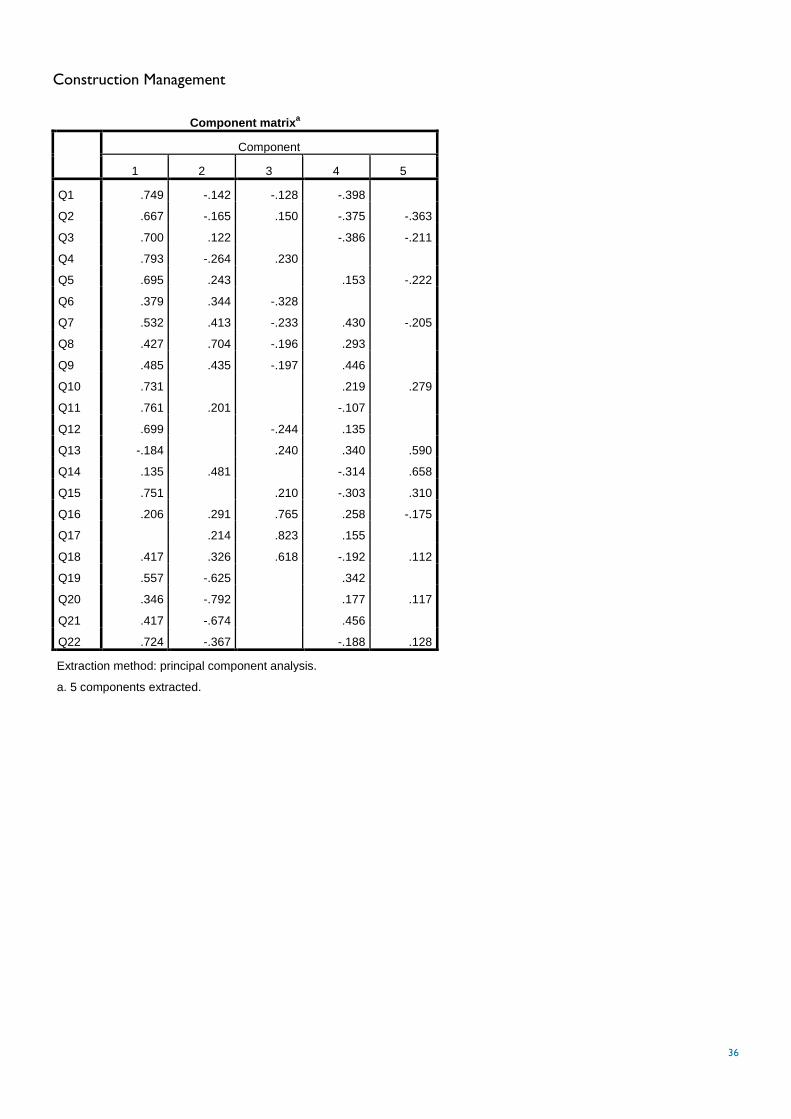
Construction Management
Component matrixa
Component
1 2 3 4 5
Q1 .749 -.142 -.128 -.398
Q2 .667 -.165 .150 -.375 -.363
Q3 .700 .122 -.386 -.211
Q4 .793 -.264 .230
Q5 .695 .243 .153 -.222
Q6 .379 .344 -.328
Q7 .532 .413 -.233 .430 -.205
Q8 .427 .704 -.196 .293
Q9 .485 .435 -.197 .446
Q10 .731 .219 .279
Q11 .761 .201 -.107
Q12 .699 -.244 .135
Q13 -.184 .240 .340 .590
Q14 .135 .481 -.314 .658
Q15 .751 .210 -.303 .310
Q16 .206 .291 .765 .258 -.175
Q17 .214 .823 .155
Q18 .417 .326 .618 -.192 .112
Q19 .557 -.625 .342
Q20 .346 -.792 .177 .117
Q21 .417 -.674 .456
Q22 .724 -.367 -.188 .128
Extraction method: principal component analysis.
a. 5 components extracted.

37
Real Estate
Component matrixa
Component
1 2 3 4 5
Q1 .717 -.185 .135 .462
Q2 .720 -.454 .128 -.202
Q3 .633 -.476 .144 .364
Q4 .731 -.260 -.288 -.178
Q5 .632 .356 .259 -.184 -.136
Q6 .799 .386 -.159
Q7 .652 .313 .500 .167
Q8 .532 .221 .674 -.331
Q9 .715 .174 .473 -.294
Q10 .849 .124 -.283
Q11 .763 .292 .124 .205 -.176
Q12 .829 -.259 -.155 -.359
Q13 .764 -.286 -.108 -.142 .359
Q14 .607 -.524 .271 .353
Q15 .730 -.501 .104 .258
Q16 .517 .581 -.215 .110 .137
Q17 .547 .456 .387 .465
Q18 .613 .550 -.248 .127
Q19 .830 -.367
Q20 .771 .256 -.368 -.318 .158
Q21 .797 -.358 -.214 .277
Q22 .783 -.443 -.307 -.148
Extraction method: principal component analysis.
a. 5 components extracted.
38
Contact us
The Higher Education Academy
Innovation Way
York Science Park
Heslington
York
YO10 5BR
+44 (0)1904 717500
ISBN: 978-1-907207-95-2
© The Higher Education Academy, 2013
The Higher Education Academy (HEA) is a national body for
learning and teaching in higher education. We work with
universities and other higher education providers to bring
about change in learning and teaching. We do this to improve
the experience that students have while they are studying,
and to support and develop those who teach them. Our
activities focus on rewarding and recognising excellence in
teaching, bringing together people and resources to research
and share best practice, and by helping to influence, shape
and implement policy - locally, nationally, and internationally.
The HEA supports staff in higher education throughout
their careers, from those who are new to teaching through
to senior management. We offer services at a generic
learning and teaching level as well as in 28 different
disciplines. Through our partnership managers we work
directly with HE providers to understand individual
circumstances and priorities, and bring together resources to
meet them. The HEA has knowledge, experience and
expertise in higher education. Our service and product range
is broader than any other competitor.
www.heacademy.ac.uk | www.twitter.com/heacademy
The views expressed in this publication are those of the
author and not necessarily those of the Higher Education
Academy. No part of this publication may be reproduced or
transmitted in any form or by any means, electronic or
mechanical, including photocopying, recording, or any storage
and retrieval system without the written permission of the
Editor. Such permission will normally be granted for
educational purposes provided that due acknowledgement is
given.
To request copies of this report in large print or in a
different format, please contact the communications office
at the Higher Education Academy: 01904 717500 or
This report is the result of research commissioned by the Higher Education Academy (HEA)
and the Council of Heads of the Built Environment (CHOBE). It was carried out by the
University of the West of England:
Jessica Lamond, David Proverbs, Teresa Wood
Construction and Property Research Centre
Faculty of Environment and Technology
University of the West of England
Frenchay Campus
Coldharbour Lane
Bristol BS16 1QY
