what happened to my margin? - schfma.orgschfma.org/...2015_ai_what_happened_to_my_margin.pdf ·...
TRANSCRIPT

What Happened to My Margin? Leveraging the Power of Data Integration and Analytics – Lessons from the Field Drive Sustainable Value and ROI
South Carolina HFMA Annual Conference, May 29, 2015, 0900-1000, Myrtle Beach, SC
How financial leaders leverage disparate clinical and financial data to create new insight and drive VALUE and ROI
Clinical Intelligence | www.clinical-intelligence.org or www.clinview.org | 888-341-1014
I. Evolving Analytics and the CFO/Financial Strategy • Leverage cloud technology to aggregate disparate hospital data • Analyze and interpret data in a whole new way • Frame potential benefit opportunity with a laser focus • Align right resources, right processes and right plans • Monitor and realize sustainable ROI and value
II. Hospital Case Study • Current State - Conducting the Assessment and Sizing the Benefit Opportunity • Ideal State - Getting from Here to There; Best Practice Workplan with Continuous
Performance Improvement approach • Future State – Effective Implementation with Sustainable Results to prove the Value
III. Closing/ Go Forward Thoughts
IV. Q&A
Session Agenda
2

Clinical Intelligence | www.clinical-intelligence.org or www.clinview.org | 888-341-1014
Session Speaker
Contact Name: Laurie A. Jaccard, President
Organization: Clinical Intelligence, LLC (“CI”)
Email: [email protected]
Logistics: South Carolina HFMA Annual Conference, May 29, 2015, 0900-1000, Myrtle Beach, SC
Clinical Intelligence: Founded in 2001, CI has collaborated with +100 hospitals in +40 states, providing consultancy/ advisory services to include Physician Advisory, Advanced Care Management, Clinical Business Intelligence, Quality System Design, Service Line Planning, and Interim Leadership.
Consultancy: CI’s sole purpose is to assist hospitals and healthcare systems to perform at peak effectiveness of quality patient care coordination and outcomes.
Analytics: CI’s computing platform ClinView® has aided healthcare providers with data discovery, action and results.
3

Clinical Intelligence | www.clinical-intelligence.org or www.clinview.org | 888-341-1014
Corporate Founded (2001); St. Louis, MO Headquarters in Hilton Head, SC
Care Management Redesign Expert
Solutions • Cloud Based SaaS Analytics • Advanced Care Management Consulting • Interim Leadership • Business Intelligence & Hospital Operations • Quality Improvement
A national consulting firm providing high-value solutions to hospitals and healthcare systems to perform at peak effectiveness of quality patient coordination and outcomes.
Business
Since 2001, we have assisted 150+ hospitals including small Critical Access Hospitals to large integrated health systems and academic medical centers.
Company Background
4

Clinical Intelligence | www.clinical-intelligence.org or www.clinview.org | 888-341-1014
I. Evolving Analytics and the CFO/Financial Strategy
• From Budgets to Value Creation • Business Case for Analytics – Clinical, Financial, Operational Value • Nothing Should Stop You From Staying Ahead of Change • A Stepwise Approach to Successful Implementation
5

Clinical Intelligence | www.clinical-intelligence.org or www.clinview.org | 888-341-1014
Business Challenges
What financial/business challenges concern you most in your organization?
6

Clinical Intelligence | www.clinical-intelligence.org or www.clinview.org | 888-341-1014
Those that are able to leverage their data, derive key business insights resulting in improved financials, confidence, compliance, competition, and more.
7
Enhance Clinical and
Financial Process and Outcomes
Improve Compliance
Cultivate Innovation &
Strengthen Competitive Advantage
Promote Self Discovery and New Insights
Making the Business Case for Analytics Why Does it Matter So Much?

Clinical Intelligence | www.clinical-intelligence.org or www.clinview.org | 888-341-1014
Capture Disparate Health Data from Source Systems
Actionable Clinical Information with Analytics
Data Mapping
Combine and standardize data
Hospital leaders are increasingly investing in data analytics to create clinical and operational value.
Translating Data into Actionable Information
Nothing Should Stop You From Staying Ahead of Change
8

Clinical Intelligence | www.clinical-intelligence.org or www.clinview.org | 888-341-1014
There are many options available to aggregate disparate data sets into a single source of truth; through internal IT or external resources
Evolving Analytics and the CFO/Financial Strategy
Healthcare Analytics Creates
New Insight
9

Clinical Intelligence | www.clinical-intelligence.org or www.clinview.org | 888-341-1014
A Stepwise Approach Data to Value
It all begins with ACTIONABLE DATA.
10
Hospitals are relying on business intelligence tools to drive workplans and ROI/Value to a new level

Don’t Be Shy, the More Elements the More Association. More Association, More Insight. More Insight, More Action and More Results
Concur on a comprehensive set of primary source data to operationally define process and outcome metrics.
Step 1: Obtain Primary Source DATA
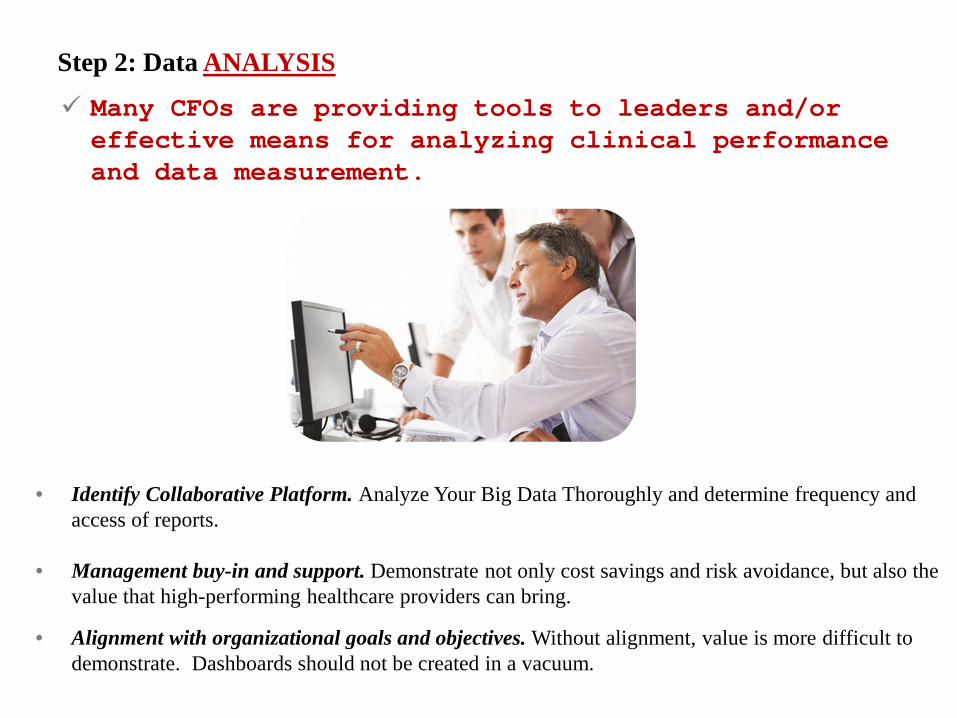
• Identify Collaborative Platform. Analyze Your Big Data Thoroughly and determine frequency and access of reports.
• Management buy-in and support. Demonstrate not only cost savings and risk avoidance, but also the value that high-performing healthcare providers can bring.
• Alignment with organizational goals and objectives. Without alignment, value is more difficult to demonstrate. Dashboards should not be created in a vacuum.
Many CFOs are providing tools to leaders and/or effective means for analyzing clinical performance and data measurement.
Step 2: Data ANALYSIS

Clinical Intelligence | www.clinical-intelligence.org or www.clinview.org | 888-341-1014
Assessment & Planning • Assessment Overview • Business Imperative • Study Methodology • Project Timeline
13

Clinical Intelligence | www.clinical-intelligence.org or www.clinview.org | 888-341-1014
Implement Game Changing Action with Confidence
1. Identify High Value Targets with Opportunity Analysis
2. Develop & Execute Value Driven Work Plans
3. Measure, Monitor and Realize Results
14
Conduct opportunity analysis on historical data and identify associations and special cause variation.
Improve daily workflow operational process and education to decrease practice pattern variation and outcomes.
Closely monitor process improvement and outcomes and ensure feedback loop with key stakeholders.
Structured, Actionable Analytics have promising potential to drive workplans, performance and operations

Ensuring a keen focus on effective development, implementation and evaluation of interdisciplinary corrective action plans is vital.
Step 3: Develop Robust ACTION Plans (ROAD-MAP for Change)
Case Management RedesignTasks Who Start End 12/1 1/1 2/1 3/1 4/1
Redesign of Care Management Department 12/1 3/1Redesign of Care Management Department PA 12/1 3/1Creating a departmental linkage between CM, HIM and Business Office DCM 12/3 2/1
Ongoing policy development and approval through UM CommitteePA 12/2 1/31
Strengthened focus and Physician Advisory and Medical Staff involvement of Utilization Management Committee PA 12/6 2/4Reduce LOS/ Improve Proactive DCP 12/1 3/1Continuing to strengthen the daily Interdisciplinary Team Conferences via documentation and scorecards PA 12/8 2/6Maintaining reduction in Medicare LOS PA 12/11 2/9Implementing proactive Discharge Planning to include High Risk Screening for complex discharge needs PA 12/7 2/5Ongoing weekly complex case meetings for LOS > 5 days PA 12/12 2/10Electronic capture of Avoidable Days with reason codes DCM 12/8 2/6Electronic capture of Important Message from Medicare letter delivery to ensure compliance with this requirement DCM 12/3 2/1Improve CDI 12/2 2/11Care Management and CDI Specialists’ working together to improve MD documentation CDI 12/8 2/6Improve Medical Necessity Admission Screens 12/3 2/11Working with Nursing Leadership to consolidate admission assessments DCM 12/4 2/2Implemented a new process for MD order to meet CMS requirement PA 12/3 2/1Developing a plan for implementation of Emergency Department Care Managers DCM 12/7 2/5Ensuring medical necessity screening at all portals of entry PA 12/12 2/10Develop Effective Readmission Readmission Strategy 12/3 2/6Implementing a multifaceted plan in an effort to further reduce readmissions PA 12/9 2/7Outcomes Monitoring 12/8 2/6Implemented daily and monthly CM scorecard for Key Performance Indicators PA 12/13 2/11
Target Game Changing Actions and Gains Dashboards without actions, improvements, and follow-up is futile. Go beyond collecting data for the sake of data. Deliver improved performance, reduced costs and increased physician value.
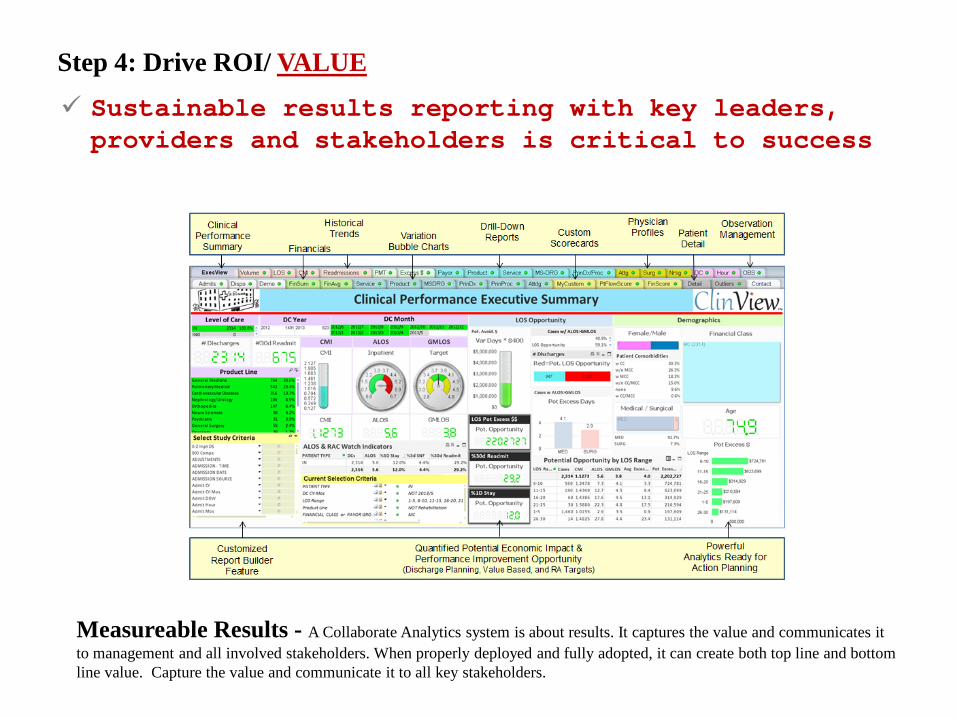
Sustainable results reporting with key leaders, providers and stakeholders is critical to success
Step 4: Drive ROI/ VALUE
Measureable Results - A Collaborate Analytics system is about results. It captures the value and communicates it to management and all involved stakeholders. When properly deployed and fully adopted, it can create both top line and bottom line value. Capture the value and communicate it to all key stakeholders.

What Aspects of Clinical Performance Are you Measuring?
Automate Daily and Monthly Scorecards
Indicator Name Goal 2013 Jan Feb Mar Apr May Jun Jul Aug Sept Oct Nov Dec
Inpatient Discharges 17,562 17,050 1,645 1,391 1,475 1,427 1,480 1,331 1,393 1,373 1,286 1,436 1,375 1,438
%Inpatient 1DS 11.70% 10.20% 11.50% 11.40% 11.80% 10.90% 13.20% 12.20% 13.00% 11.00% 12.60% 12.10% 10.90%
Case Mix Index (CMI) 1.72785 1.7191 1.6328 1.7356 1.7976 1.7316 1.7175 1.7332 1.6631 1.6995 1.7176 1.7496 1.7447 1.7172
ALOS 5.0 5.3 5.4 5.4 5.3 5.3 5.3 5.4 5.2 5 5.1 5 5 5.5
LOS Index 1.23 1.27 1.31 1.27 1.24 1.27 1.28 1.29 1.28 1.22 1.22 1.25 1.23 1.32
# Potential Excess Days 26,766 30,263 3,016 2,552 2,570 2,622 2,705 2,517 2,514 2,246 2,066 2,383 2,227 2,846
% Potential Excess Days 32.3% 33.80% 34.10% 34.20% 32.90% 34.40% 34.20% 35.30% 34.40% 32.40% 31.60% 33.00% 32.10% 35.70%
$ Potential Excess Days $10,706,398 12,105,290$ 1,206,399$ 1,020,629$ 1,028,114$ 1,048,935$ 1,081,883$ 1,006,654$ 1,005,478$ 898,368$ 826,311$ 953,200$ 890,920$ 1,138,400$
Metrics flow from performance expectations and are derived from and aligned with the hospital plans (i.e. UM and/or PI).
Clarity of hospital and UM goals should guide the development of performance metrics.

Source: Malcolm Baldrige
Segment Performance Metrics into Key Domains
Strategic Focus Performance Category
People Leadership, Workforce
Service Customer (Patient) Focus
Quality Processes, Knowledge Management
Finance Processes, Operations Focus
Growth Strategic Planning
Res
ults
Hospital leaders define the strategic focus for the patients and organization.

Quantify Economic Impact and Value
Examples Include: “True North” Patient Focused Measures
Organizational Process Measures
Organizational Outcome Measures
Readmission Reductions x
Mortality Rates x
Pain x
Infections as Complication x
Medical Necessity Denials x
Compliance Risk Exposure x
Staffing/ Labor Productivity x
Clinical Documentation/ CMI x
Preventable Admissions x
Length of Stay Reduction x
Contribution Margin x
They also define the vital few measures that truly matter to patients and the organization.

Clinical Intelligence | www.clinical-intelligence.org or www.clinview.org | 888-341-1014
Evolving Analytics and the CFO/Financial Strategy
Potential benefit opportunity is framed with a laser focused approach. Illuminate Opportunity to ACT!
20

Clinical Intelligence | www.clinical-intelligence.org or www.clinview.org | 888-341-1014
Monthly Scorecards Provided to Nursing Directors/Managers & Physicians
Monthly Data Discovery Scorecard Reviews Facilitate Workplan Strength and Measurable Change
21

Clinical Intelligence | www.clinical-intelligence.org or www.clinview.org | 888-341-1014
Evolving Analytics and the CFO/Financial Strategy
Scorecards monitor and measure realized sustainable ROI and VALUE; can be Hospital Specific or Enterprise
22

Clinical Intelligence | www.clinical-intelligence.org or www.clinview.org | 888-341-1014
Drill Downs into Cost Center Costs
23
CFOs and Financial Leaders Can Help Clinical Performance Teams Examine Resource Utilization Patterns to identify variation in practice, over and under utilization

Clinical Intelligence | www.clinical-intelligence.org or www.clinview.org | 888-341-1014
Hospital A brought new insight into the hidden financial opportunities that existed from improved operational efficiencies.
II. Hospital Case Study
24

Clinical Intelligence | www.clinical-intelligence.org or www.clinview.org | 888-341-1014
Opportunity: 300+ Bed community hospital experiencing a decline in margin and external
compliance pressures Opportunity: The Director of Case Management, CMO and hospital CFO sensed there was
a need to improve care management structure and process to drive performance to a new level. The CFO was motivated to sponsor clinical performance activities that would help improve financial performance.
25
Action: Assessment/Plan: Consultants conducted 30 day
assessment and quantified the potential benefit of improved performance.
Care Management Redesign: Redesign included model, staffing, acuity of patients, high risk stratification, palliative care screenings, interdisciplinary care coordination rounds, and evidence based care.
Case Study Hospital A Opportunity and Action Plan

Clinical Intelligence | www.clinical-intelligence.org or www.clinview.org | 888-341-1014 26
Case Study Hospital A Rapid Cycle Assessment 4 weeks Putting Intelligent Insights to work
Short Term Workplans help to frame the critical milestones and tasks of each phase of the project

Clinical Intelligence | www.clinical-intelligence.org or www.clinview.org | 888-341-1014
Case Study Hospital A Implementation Timeline Putting Intelligent Insights to work
Long Term Workplans pave the road and resources
27

Clinical Intelligence | www.clinical-intelligence.org or www.clinview.org | 888-341-1014 28
Result: Redesigned Structure/Model Productive Position Control with the RIGHT people doing the RIGHT functions Improved Interdisciplinary Teaming and Care Coordination Improved Decision support (debate over data veracity minimized) Improved clinical documentation resulting in increased case mix index Improved proactive discharge planning and patient flow (LOS decreased) Denials decreased Readmissions decreased Conditions of Participation compliance improved
Case Study Hospital A Benefit Realization

Clinical Intelligence | www.clinical-intelligence.org or www.clinview.org | 888-341-1014
Case Study Hospital A Current State
Consultants conducted the assessment and sized the benefit opportunity
Objectivity is the key to developing an effective approach to assessing and managing clinical and financial performance.
29
Clinical Intelligence | www.clinical-intelligence.org or www.clinview.org | 888-341-1014
Case Study Hospital A Clinical Performance Strategy and Operations
Overall, the organization identified the strategic changes that needed to occur, not just the operational changes.
Leaders realized that strategic and operational changes were interwoven and both were required to advance the hospital to the next level.
30

Clinical Intelligence | www.clinical-intelligence.org or www.clinview.org | 888-341-1014
Opportunity | $5M Potential Excess Dollars
Inpatient Discharges: 5,676 Average Length Of Stay: 5.2 days CMS Geometric LOS: 3.8 days Potential Excess Days: 11,259 days LOS Index 1.4 Potential Excess Days: 38.2% Potential Excess Dollars: $5,066,763*
* Based on $400 direct cost per last day
Case Study Hospital A Benefit Summary Potential Economic Impact
31

Clinical Intelligence | www.clinical-intelligence.org or www.clinview.org | 888-341-1014 32
58.9% with ALOS > GMLOS
Case Study Hospital A Baseline Performance Medicare Inpatient 11,259 potential excess days, $5M, 5.2 day ALOS

Clinical Intelligence | www.clinical-intelligence.org or www.clinview.org | 888-341-1014
Case Study Hospital A PRIORITY MAPPING
Type
• Medical $3.9M • Surgical $1.3K
DC Disposition
• Home $1.7M • SNF $1.4M
Financial Class
• Medicare PPS $4.2M • Medicare Managed $867K
MSDRG
• Septicemia $403K • Heart Failure $306K • Renal Failure $199K • Simple Pneumonia $206K • Respiratory Infection $111K
Attending
• Attending A $506K • Attending B $376K • Attending C $307K • Attending D $294K • Attending E $245K
DC Nursing Unit
• Unit A $1.4M • Unit B $1.3K • Unit C $1M • Unit D $978K • Unit E $179K
Segmented Opportunity by High Value Targets
33
Clinical Intelligence | www.clinical-intelligence.org or www.clinview.org | 888-341-1014
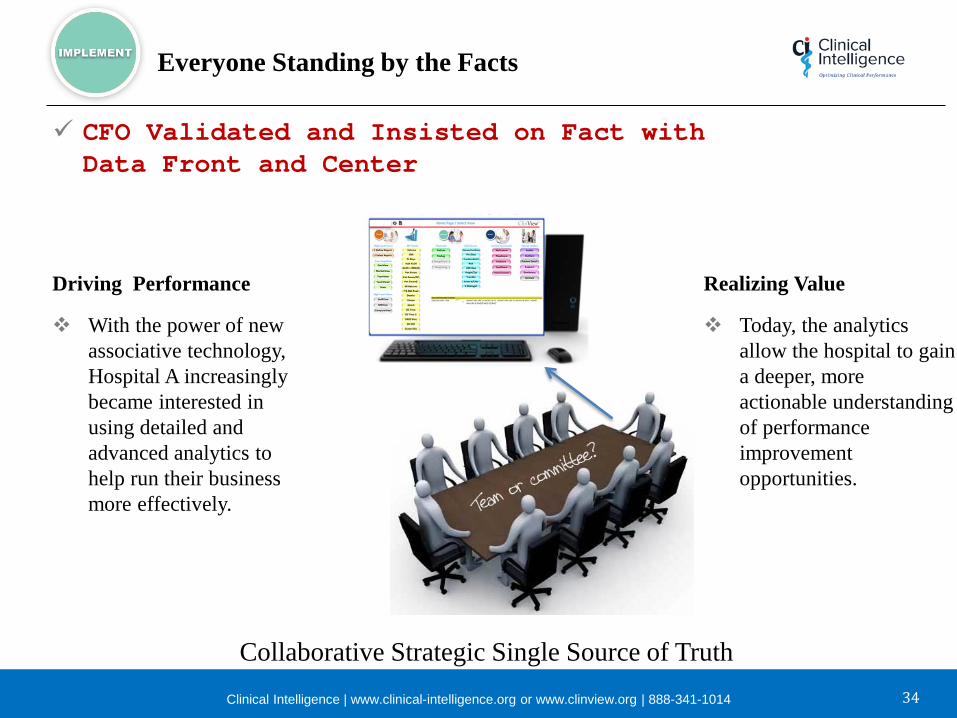
Everyone Standing by the Facts
34
Collaborative Strategic Single Source of Truth
Realizing Value
Today, the analytics allow the hospital to gain a deeper, more actionable understanding of performance improvement opportunities.
CFO Validated and Insisted on Fact with Data Front and Center
Driving Performance
With the power of new associative technology, Hospital A increasingly became interested in using detailed and advanced analytics to help run their business more effectively.
Clinical Intelligence | www.clinical-intelligence.org or www.clinview.org | 888-341-1014
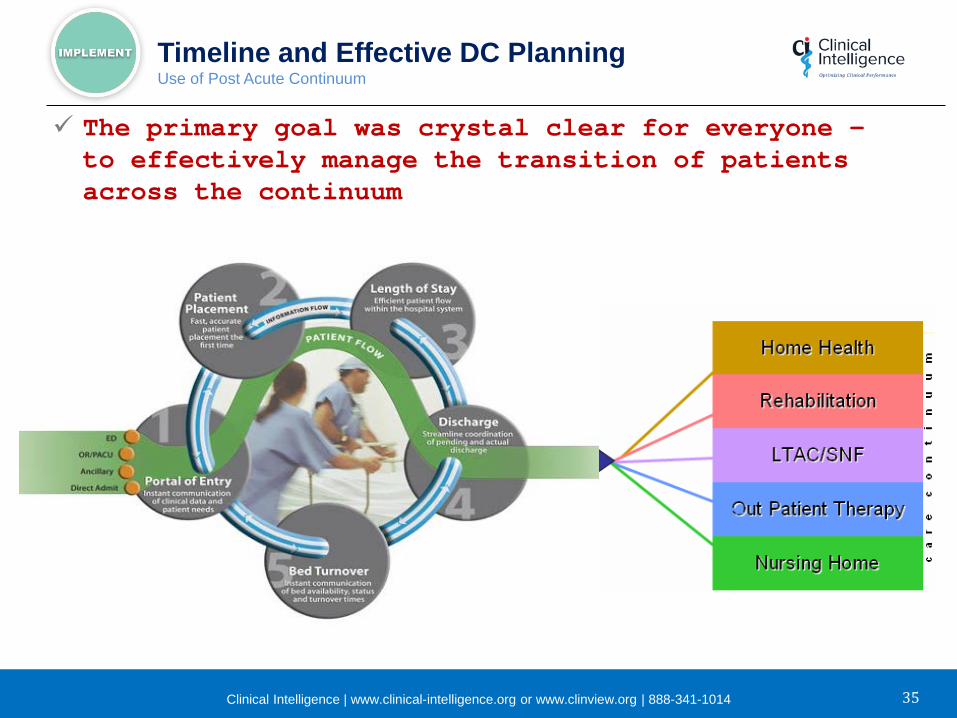
Timeline and Effective DC Planning Use of Post Acute Continuum
35
The primary goal was crystal clear for everyone – to effectively manage the transition of patients across the continuum

Clinical Intelligence | www.clinical-intelligence.org or www.clinview.org | 888-341-1014
Established the Right Team & Process Internal and External
36
Daily Interdisciplinary Team Conferences was key to the successful decrease in excess days and dollars
Standard work across the enterprise was key to reduce variation and improve quality Physician Advisor led

Discharges to Skilled Nursing Facilities represent 28% of the volume and 36% of the potential avoidable dollars ($2.4M/$6M)
Case Study Hospital A Segmented Data by Discharge Disposition Leaders identified discharge and care coordination opportunities with SNF ($2.4M). The data did not lie.

Discharge Nursing Unit A & B represent 30% of the volume (263/890) and 36% of the potential avoidable dollars ($842K/$2.4M)
Physicians validated the “Tuck them in” Weekend Pattern
Case Study Hospital A Segmented by Discharge Unit and Day of Week

They determined that prolonged length of stay was partially due to lack of timely discharges to Skilled Facilities on weekends. There were productivity opportunities, handoffs and care coordination opportunities identified, including weekend “tuck them in” patterns causing high LOS on Monday.
Case Study Hospital A Timely Discharge Planning Leaders studied discharges by Day of Week/Time of Day.

Clinical Intelligence | www.clinical-intelligence.org or www.clinview.org | 888-341-1014
Case Study Hospital A Financial Class Analysis
Medicare (PPS and Managed ) represented 65% of the total potential avoidable dollar opportunity ($3.8M of $5.9M) and 64% of the Operating Margin Loss.
40

Clinical Intelligence | www.clinical-intelligence.org or www.clinview.org | 888-341-1014
Case Study Hospital A MarketView Volume was carefully inspected
41

Clinical Intelligence | www.clinical-intelligence.org or www.clinview.org | 888-341-1014
Case Study Hospital A Top 10 MS DRGS
10 MSDRG Clusters represented 53% of the total potential avoidable dollar opportunity ($2M of $3.8M) and 59% of the Operating Margin Loss.
42

Clinical Intelligence | www.clinical-intelligence.org or www.clinview.org | 888-341-1014
Case Study Hospital A Drill Down by Attending
10 Physicians represented 40% of the total potential avoidable dollar opportunity ($1.5M of $3.8M) and 39% of the Operating Margin Loss.
43

Clinical Intelligence | www.clinical-intelligence.org or www.clinview.org | 888-341-1014
Case Study Hospital A Clinical Variation
Visualization helped identify high-value targets and special cause and common cause variation
44
Laser focused by Dx

Clinical Intelligence | www.clinical-intelligence.org or www.clinview.org | 888-341-1014
Case Study Hospital A Well Designed Visualizations Promote Actionable Data
Outlier - LOS Excess and %30 day Inpatient Readmission
45

Clinical Intelligence | www.clinical-intelligence.org or www.clinview.org | 888-341-1014
Case Study Results • Realized Benefit • Return on Investment • Continuous Improvement and Refinement
46

Clinical Intelligence | www.clinical-intelligence.org or www.clinview.org | 888-341-1014
Case Study Hospital A IMPLEMENTATION
FY13 • Length of Stay 5.2; GMLOS 3.4 • Potential Excess Days 11,259 • Potential Excess Dollars $5M • Case Mix Index 1.3647 • Inpatient 30 day Readmission Rate 16.4%
FY14 • Length of Stay 5.0; GMLOS 4.0 • Potential Excess Days 8,508 • Potential Excess Dollars $3.8M • Case Mix Index 1.4203 • Inpatient 30 day Readmission Rate 17%
47
Realized Significant Improvement and Results $1.2M per year

Clinical Intelligence | www.clinical-intelligence.org or www.clinview.org | 888-341-1014
Nothing was more essential than understanding our customer segmentation for driving bottom-line growth.
The analytics helped identify high-value targets and more effectively understand practice and behavior patterns.
The intense competition for improving high value performance underlined the importance of using analytic tools and help us get closer to the process.
Analytics tools identified the dollars potentially being left on the table because of the less than favorable pricing or agreements in place.
Leaders knew clearly which population segments were profitable and those that were opportunities.
48
Case Study Hospital A Population Segmentation Powerful Insights and Lessons Learned
Lessons Learned from the Leaders Voice

Clinical Intelligence | www.clinical-intelligence.org or www.clinview.org | 888-341-1014
Built and improved upon comprehensive analytics to better understand patient populations.
Built on a foundation of integrated administrative and clinical data.
Used previously siloed data sets to closely monitor cost, quality, and risk via analytics.
Leaders desire this to be the new normal for business.
49
Integrated Data Tells the Complete Story
Integrated administrative and clinical data

Clinical Intelligence | www.clinical-intelligence.org or www.clinview.org | 888-341-1014
Financial Dimensions
50
• Volume Management (market analysis, inpatient to outpatient shift)
• Payor Mix • Rising costs/lower margins • Taking on performance risk • Lower reimbursements • Federal penalties • Referral leakage • Insurance Denials (Technical) • Billing for Outpatient Services • Others
Focus on High Value Financial Targets

Clinical Intelligence | www.clinical-intelligence.org or www.clinview.org | 888-341-1014
Operational Dimensions
51
• Medical Necessity and Compliance (short stays, observation management)
• Insurance Denials (Clinical) • ED Revisits • Preventable Unnecessary Admissions • Service Line Performance • Clinical Documentation Improvement • Length of Stay Controls and Potential Excess
Days/Dollars • Resource Utilization/ Operational Cost Pressures • Use of Post Acute • Readmissions • Others
Identify High Value Operational Targets

Clinical Intelligence | www.clinical-intelligence.org or www.clinview.org | 888-341-1014
Service Line Performance
52
Leaders analyzed their core service lines. • To make the margin leaders analyzed their core service lines with a keen
focus on volume growth plus cost management and efficiency strategies. • They got a fresh handle on the cost of care in a given service line to determine
if they needed to eliminate the service line or implement operational changes to improve the financial performance of the service line.
• They also refocused their managed care contracting strategies in that service line.
Drill into Service Lines to Find Margin

Clinical Intelligence | www.clinical-intelligence.org or www.clinview.org | 888-341-1014
Clinical Quality Dimensions
53
Leaders analyzed their clinical performance. • To make the margin leaders analyzed their clinical performance with a keen
focus on medical necessity, compliance, and care management functions. • They engaged consultants to redesign their care management structure and
process to help realize margin and drive sustainable outcomes • They focused on high value care management strategies and VBP Penalties to
include length of stay controls, readmissions, and denial prevention. • Clinical Care Redesign • Clinical Variation • LOS Controls and use of Post Acute • “Value” improvement (Quality/Cost)
Clinical Performance Was Not Overlooked to Find Margin

Clinical Intelligence | www.clinical-intelligence.org or www.clinview.org | 888-341-1014
Current State Assessment Is your healthcare system performing optimally?
Are You:
Achieving positive financial margins?
Balancing the growing challenges of sustaining accurate and reliable public reporting, and financial, regulatory and clinical management demands?
Attaining the gold standard with your hospital’s service line strategies and department operational improvements?
If not, it may be a perfect time for you to conduct a clinical performance assessment to drive your bottom line.
54
Is Your Healthcare System Performing Optimally? Is there an opportunity to look more closely at clinical performance to Find Your Margin?

Clinical Intelligence | www.clinical-intelligence.org or www.clinview.org | 888-341-1014
III. Closing/ Go Forward Thoughts
55

Clinical Intelligence | www.clinical-intelligence.org or www.clinview.org | 888-341-1014
Start Here –Analytics to Results
Issues/Facts: What business problem are we trying to solve? What data can be leveraged to understand the business and improve performance?
Understanding Current State: What is currently happening or has happened related to our business and why? What should we do about it?
Actions for Future: How do we look to the future and build analytic insights directly into business processes?
56
Understand Current State
Envision Ideal State
Implement Future State

Clinical Intelligence | www.clinical-intelligence.org or www.clinview.org | 888-341-1014
Questions to Ask Yourself
57
Do you have the capabilities required to deliver analytic-driven improvements?
Yes No
Do we have the ability to pull and integrate data from multiple, disparate systems? Are we capturing and analyzing the proper data, the proper way? Can we triangulate to an answer when addressing an issue? Do we have the required people and organization in place? Do we have a process and results that will challenge conventional wisdom?
Go Ahead…..Own the analytics agenda to drive top and bottom-line growth.

It’s Not Just About the Perfect Scorecard
Repeat all steps to ensure performance monitoring is continuous.
It’s not just about getting a perfect scorecard indicating the best performance and outcomes at a given moment in time. It is about continuous performance improvement and monitoring the business needs and measuring the providers ability to meet those needs.

Clinical Intelligence | www.clinical-intelligence.org or www.clinview.org | 888-341-1014
Closing Thoughts
Look before you leap - Assess data from all dimensions of performance
Build a workplan or ROAD MAP for Change first
Understand what the doctors think. Cultural clashes may be undefeatable
Build a communication plan and involve the physicians and interdisciplinary team
Implementation will drive success or failure with sustainable outcomes
Continuously measure with communication and feedback loops
Celebrate and/or reward wins
59

IV. Q&A

Clinical Intelligence | www.clinical-intelligence.org or www.clinview.org | 888-341-1014 61
It’s a New Day!

Thank you
Contact Us Clinical Intelligence, LLC 29 Flagship Lane Hilton Head Island, SC 29926 (888) 341-1014 [email protected]