what drives the polonia spread in poland?; by yinqiu lu; imf
TRANSCRIPT

What Drives the POLONIA Spread in Poland?
Yinqiu Lu
WP/12/215

© 2012 International Monetary Fund WP/12/215
IMF Working Paper
European Department
What Drives the POLONIA Spread in Poland?
Prepared by Yinqiu Lu1
Authorized for distribution by Julie Kozack
August 2012
Abstract
Since the start of the 2008–09 financial crisis, the Polish Overnight Index Average (POLONIA) has persistently been below the policy rate, suggesting a limited influence of the NBP’s open market operations on the short-term interbank rate. In this regard, this paper analyzes the behavior of the POLONIA spread and explore several potential factors that could influence the spread. An empirical analysis confirms that the negative POLONIA spread is related to a few factors, which include the existence of the structural liquidity in the banking system; bank’s unwillingness to lock up liquidity in the NBP bills; the frontloading of banks’ fulfillment of the reserve requirements; and external market sentiment. The analysis also shows the effectiveness of the NBP’s responses to the financial crisis and structural liquidity surplus.
JEL Classification Numbers: E43, E44, E52, E58, and C22
Keywords: Poland, POLONIA, monetary policy, interbank market, and GARCH
Author’s E-Mail Address: [email protected]
1 European Department, International Monetary Fund. I am grateful for the very useful comments and suggestions received from Alexandre Chailloux, Julie Kozack, James Morsink, Krzysztof Senderowicz, and other seminar participants at the National Bank of Poland. The usual disclaimer applies.
This Working Paper should not be reported as representing the views of the IMF. The views expressed in this Working Paper are those of the author(s) and do not necessarily represent those of the IMF or IMF policy. Working Papers describe research in progress by the author(s) and are published to elicit comments and to further debate.

2
Contents Page
I. Introduction .................................................................................................................................3
II. POLONIA and its Deviation From the Policy Rate ...................................................................4
III. Determinants of the POLONIA Spread: Predictions ................................................................5
A. Liquidity Supply ............................................................................................................5
B. Liquidity Demand ..........................................................................................................7
C. External Factors .............................................................................................................8
D. Structure of the Interbank Market .................................................................................8
IV. Empirical Analysis ..................................................................................................................10
A. The Empirical Model ...................................................................................................10
B. Empirical Results .........................................................................................................12
V. Conclusion and Policy Implications ........................................................................................14
Appendix
I. Structural Liquidity .........................................................................................................17
References ......................................................................................................................................18
Tables
1. Predictions of the Impact of the Determinants ..............................................................10
2. Variables in the Mean and Volatility Equations ............................................................12
3. Estimated GARCH Parameters ......................................................................................16

3
I. INTRODUCTION
Poland has based its monetary policy on inflation targeting (IT) since 1998. Under IT, the National Bank of Poland (NBP) pursues monetary policy through the interest rate channel to influence the level of aggregate output and inflation. To make the monetary policy framework more effective, the zloty began to freely float in 2000, after the currency peg to a currency composite of euro and U.S. dollar was gradually abandoned. The current inflation target is 2.5 percent with a tolerance band for symmetrical deviations of one percentage point.
The NBP implements monetary policy by conducting open market operations (OMOs). These OMOs aim to keep the POLONIA, i.e., transaction value-weighted overnight interbank rate, in close proximity to the NBP’s policy rate. The NBP’s ability to influence the POLONIA rate is an initial step in the monetary policy transmission mechanism, as it can transmit the monetary policy signal to the cost of funding for banks and lending rates. The main instrument for OMOs is the seven-day NBP bill issued every Friday, for which the reference rate is the policy rate. The interest rates on Lombard credit and the NBP’s deposit facility determine the corridor for the POLONIA. The NBP’s choice of using the overnight POLONIA to replace the Warsaw Interbank Offered Rate Spot Week (WIBOR SW) as the operating target in 2008 was a response to the increasing concentration of overnight maturity of interbank activities, and the POLONIA’s being able to represent the true price of liquidity as it is transaction-based.
This paper explores determinants of the spread between the POLONIA and the policy rate, or the “POLONIA spread”. Since the start of the 2008–09 financial crisis, the POLONIA has persistently been below the policy rate, suggesting a limited influence of the NBP’s OMOs on the short-term interbank rate. This may alter the effectiveness of the monetary policy transmission mechanism. In this regard, we analyze the behavior of the POLONIA spread over the period January 2008-December 2011, which includes the 2008 financial crisis and extends into the ongoing euro area crisis. This timeframe also provides a unique opportunity to gauge the effectiveness of the NBP’s responses to the financial crisis. In addition, given the Polish banking system’s strong linkages with global financial institutions, it is interesting to test whether external factors spill over to the Polish interbank market.
The paper is organized as follows. Section II describes the behavior of the POLONIA and POLONIA spread. Section III introduces factors that may influence the POLONIA spread. Section IV introduces an empirical model to estimate the impact of these factors on the spread. Section V concludes.

4
II. POLONIA AND ITS DEVIATION FROM THE POLICY RATE
The POLONIA has closely followed the tightening and easing cycles of the monetary policies. As expected, the POLONIA moves within the corridor set up by the standing deposit facility and Lombard credit.
However, since 2009, the POLONIA has often stayed below the policy rate and has done so persistently.1 The mean of the spread can be characterized by an autoregressive process. There are also clear signs of volatility clustering, with significant persistence in the squared spread. This observation is consistent with Kliber and Płuciennik (2011), which shows that after the collapse of Lehman Brothers, the NBP has retained the influence over the POLONIA rate, however the degree of such influence is smaller than before.
Sources: Reuters; and IMF staff estimates. Note: with +/- 2 standard deviation band.
Sources: Reuters; and IMF staff estimates. Note: with +/- 2 standard deviation band.
Using a GARCH model,2 we can calculate the long-run mean and variance of the POLONIA spread. The long-run mean of the spread is -0.32 percentage points and the unconditional
1 There were ten, four, and 22 days of positive spreads in 2009, 2010, and 2011 respectively. 2 Following the GARCH specification in Panigirtzoglou and others (2000), the spread between the POLONIA
and policy rate ( can be modeled as: ; |Ψ
3 12 , with the long-run mean = ( 1/ 2 ; the persistence of the variance= 2 3, where the variance is
explosive if the value is greater than one; and, if 1, the unconditional variance = .
Persistence of the Spread—Autocorrelation Function Persistence of the Squared Spread—Autocorrelation Function
0 5 10 15-0.2
0
0.2
0.4
0.6
0.8
Lag
Sam
ple
Aut
ocor
rela
tion
Sample Autocorrelation Function
0 5 10 15-0.2
0
0.2
0.4
0.6
0.8
Lag
Sam
ple
Aut
ocor
rela
tion
Sample Autocorrelation Function
-2
0
2
4
6
8
10Reference rate Lombard rate Deposit ratePolonia Polonia spread
Policy Rates, POLONIA, and POLONIA Spread (percentage points)
Sources: NBP; Reuters; and IMF staff estimates.

5
variance is 0.46. The persistence of the variance is 0.92, which means that following an episode of high volatility, it is expected to remain high.
III. DETERMINANTS OF THE POLONIA SPREAD: PREDICTIONS
In this section, we explore several potential determinants of the POLONIA spread and predict their influence on the spread. The interaction of liquidity supply and demand determines the liquidity situation in the interbank market and hence the POLONIA spread. The NBP’s liquidity injection and withdrawal operations influence liquidity supply in the interbank market. Banks’ refinancing needs determine liquidity demand. External factors and the structure of the interbank market can also affect the direction and movement of the POLONIA spread.
A. Liquidity Supply
There is a structural liquidity surplus in the banking system. Measured by autonomous factors (defined as those beyond the control of the central bank in the very short run), Poland’s structural liquidity surplus3 has increased by 3.5 times since it adopted IT. The increase has been more pronounced since 2009, with the main contributing factor being the accumulation of net foreign assets (NFA), which is a result of the NBP’s purchase of foreign exchange (FX) associated with inflows of EU funds and Eurobond issuance receipts from the Ministry of Finance (MOF). To sterilize these FX inflows, the NBP expanded its OMOs by issuing a larger amount of seven-day NBP bills each Friday.
The NBP’s FX purchases from the MOF and the corresponding MOF’s zloty withdrawal from the NBP increase structural liquidity in the interbank market. If the NBP’s FX purchases are not accompanied by the MOF’s withdrawal, there will be no increase in the structural liquidity as the increase in NFA will be offset by the decline in NBP’s net credit to the government (see Appendix I). However, the corresponding MOF’s zloty
3 Structural liquidity= NBP net foreign assets+net credit to government-currency in circulation+other items net. See Appendix I for a more detailed explanation.
-300,000
-200,000
-100,000
0
100,000
200,000
300,000
400,000
500,000NFA Net credit to governmentCurrency in cirulation (-) Other items netStructural liquidity
Sources: NBP; and IMF staff estimates.
Structural Liquidity(in millions of zloty)
0
20,000
40,000
60,000
80,000
100,000
120,000
140,000
Jan-
07
May
-07
Sep-
07
Jan-
08
May
-08
Sep-
08
Jan-
09
May
-09
Sep-
09
Jan-
10
May
-10
Sep-
10
Jan-
11
May
-11
Sep-
11NBP bills issued Structural liquidity
Absorbance of Structural Liquidity(in millions of zloty)
Sources: NBP; and IMF staff estimates.

6
withdrawal from the NBP, particularly in the case of purchases occurring between two Fridays of OMOs, injects liquidity into the banking system.4 Since May 2011, the MOF has, at times, converted EU funds on the FX spot market, which does not influence structural liquidity. Recently, the MoF has indicated that it will (at least partly) abandon its practice of converting EU funds in the market, which would increase structural liquidity once again. Regarding the influence on the spread, we expect that the NBP’s FX purchases will cause the spread to widen if it is negative and to narrow if it is positive. The influence on the volatility is difficult to predict.
The NBP conducts fine-tuning operations to absorb liquidity in the interbank market. Two short-term fine-tuning operations were introduced in December 2010, followed by more such operations in 2011. Moreover, since June 2011, the NBP has started to conduct regular fine-tuning operations at the end of the reserve maintenance period by selling one-day NBP bills for banks to deposit extra funds. Our hypothesis is that these operations, particularly the regular ones, should help to narrow the negative spread and dampen its volatility.
Repo operations initiated by the NBP inject liquidity into the interbank market. They were initiated as part of the “Confidence Pact” that was introduced after the collapse of Lehman Brothers. Six repo operations were conducted in 2008 with maturities ranging from six days to three months, and six-month repo operations were added in May 2009. Both the three-month and six-month repo operations were conducted once a month with transaction dates pre-announced. As the liquidity situation eased and demand dried up, six-month repo operations were discontinued in April 2010 and three-month repo operations discontinued in October 2010. Therefore, currently there are no more repo operations. We expect that the repo operations would narrow the positive spread and dampen volatility. They may cause the spread to widen if the spread is negative.
4 Other transactions between the NBP and MOF that change the MOF zloty deposit positions at the NBP will influence the liquidity situation through the change in the net credit to the government (one autonomous factor). For example, when the MOF places zloty deposits on the markets (for reasons other than those underlying the FX sales) without the NBP’s sterilization, the position of structural liquidity will change. Nevertheless, given the focus on this paper and data unavailability, we will not further explore these transactions.
-25,000
-20,000
-15,000
-10,000
-5,000
0
5,000
10,000
15,000
20,000
25,000
10/1
/200
8
4/1/
2009
10/1
/200
9
4/1/
2010
10/1
/201
0
4/1/
2011
10/1
/201
1
Outstanding amount of repo operationOutstanding amount of fine-tuning operation
REPO and Fine-Tuning Operations (in millions of zloty)
Sources: NBP; and IMF staff estimates.

7
B. Liquidity Demand
Banks’ liquidity demand and participation in OMOs affects the POLONIA spread. When the market is calm and the NBP is able to project liquidity demand with reasonable accuracy, the allotment of NBP bills is met by demand from banks. However, when there is a liquidity problem or a perceived problem in the interbank market, the NBP faces difficulties in projecting liquidity demand as the demand for NBP bills is weaker. In these circumstances, banks prefer to manage liquidity position on an overnight basis rather than locking up liquidity in seven-day NBP bills. Indeed, in the wake of the collapse of Lehman Brothers, the NBP stopped announcing the allotment amount and let the market demand determine the amount, and when the market calmed down, it changed back to its usual practice in February 2009. To a lesser degree, during 2011, banks preferred to have a liquidity cushion and a majority of auctions were underbid (i.e., demand was less than supply). Our hypothesis is that underbidding should be associated with a wider negative spread, as a lower than expected participation in OMOs reinforces relatively abundant liquidity conditions. The impact on spread volatility is difficult to gauge.
The demand for liquidity is also affected by banks frontloading their fulfillment of the reserve requirement. The reserve maintenance period in Poland is one month, starting on the last day of each month and ending on the day before the last day of the following month. On a daily basis, banks’ deposits at the NBP can deviate from the reserve requirement, as long as banks’ monthly average deposits meet the requirement. This averaging of the reserve requirement gives banks some flexibility in conducting liquidity management. At the start of the reserve maintenance period, banks, being conservative, tend to hold excess reserves. Towards the end of the maintenance period, banks deposit excess funds in the interbank market or use NBP’s standing deposit facility to gain interest income.
This frontloading behavior reduces the POLONIA rate and increases its volatility toward the end of the maintenance period. At the beginning of the maintenance period, banks’ frontloading tightens the liquidity situation—a smaller negative spread or a larger positive spread can be observed.
-1.2
-1
-0.8
-0.6
-0.4
-0.2
0
0.2
1234567891011121314151617181920212223
Jan 2008-Dec 2011
June 2011-Dec 2011
Average POLONIA Spread (percentage points)
Sources: Reuters; and IMF staff estimates.Note: the x-axis represents the number of days until the next reserve maintenance period.
0.0
0.5
1.0
1.5
2.0
2.5
3.0
3.5
4.0
2008
-01-
0420
08-0
4-18
2008
-08-
0120
08-1
0-31
2008
-12-
1920
09-0
2-20
2009
-04-
2420
09-0
6-26
2009
-08-
2820
09-1
0-30
2009
-12-
3120
10-0
3-05
2010
-05-
0720
10-0
7-09
2010
-09-
1020
10-1
1-12
2011
-01-
1420
11-0
3-18
2011
-05-
2020
11-0
7-22
2011
-09-
2320
11-1
1-25
Allo
tmen
t am
ount
not
ann
ounc
ed
Demand/Supply Ratio of NBP Bill Auctions
Source: NBP.
8
At the end of the maintenance period, as excess liquidity is released, the POLONIA sinks further below the policy rate. These maintenance period effects are documented in interbank market literature (Perez Quiros and Mendizabal (2006) and Prati et. al. (2001)). The recently introduced regular fine-tuning operations at the end of maintenance period seem to have brought the POLONIA significantly closer to the policy rate for the last few days of the reserve maintenance period. We expect that the frontloading behavior is associated with the increasingly negative spread and higher volatility towards the end of the maintenance period.
C. External Factors
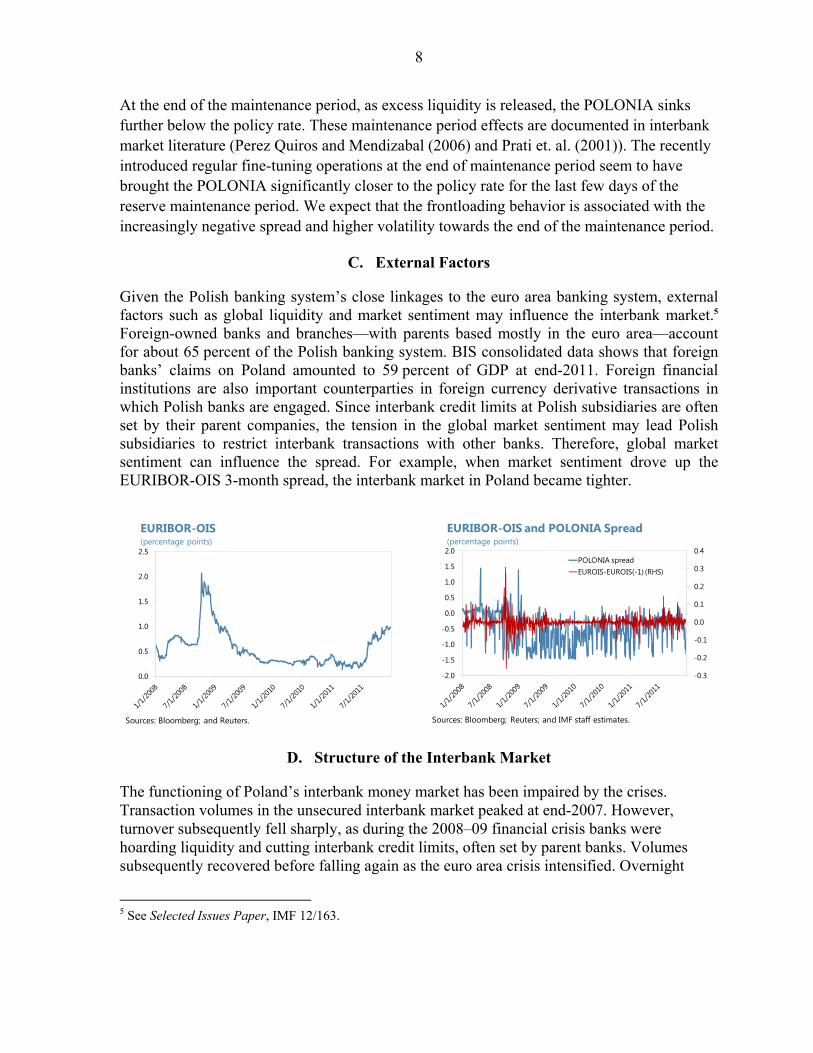
Given the Polish banking system’s close linkages to the euro area banking system, external factors such as global liquidity and market sentiment may influence the interbank market.5 Foreign-owned banks and branches—with parents based mostly in the euro area—account for about 65 percent of the Polish banking system. BIS consolidated data shows that foreign banks’ claims on Poland amounted to 59 percent of GDP at end-2011. Foreign financial institutions are also important counterparties in foreign currency derivative transactions in which Polish banks are engaged. Since interbank credit limits at Polish subsidiaries are often set by their parent companies, the tension in the global market sentiment may lead Polish subsidiaries to restrict interbank transactions with other banks. Therefore, global market sentiment can influence the spread. For example, when market sentiment drove up the EURIBOR-OIS 3-month spread, the interbank market in Poland became tighter.
D. Structure of the Interbank Market
The functioning of Poland’s interbank money market has been impaired by the crises. Transaction volumes in the unsecured interbank market peaked at end-2007. However, turnover subsequently fell sharply, as during the 2008–09 financial crisis banks were hoarding liquidity and cutting interbank credit limits, often set by parent banks. Volumes subsequently recovered before falling again as the euro area crisis intensified. Overnight
5 See Selected Issues Paper, IMF 12/163.
0.0
0.5
1.0
1.5
2.0
2.5
EURIBOR-OIS(percentage points)
Sources: Bloomberg; and Reuters.
-0.3
-0.2
-0.1
0.0
0.1
0.2
0.3
0.4
-2.0
-1.5
-1.0
-0.5
0.0
0.5
1.0
1.5
2.0POLONIA spreadEUROIS-EUROIS(-1) (RHS)
EURIBOR-OIS and POLONIA Spread (percentage points)
Sources: Bloomberg; Reuters; and IMF staff estimates.

9
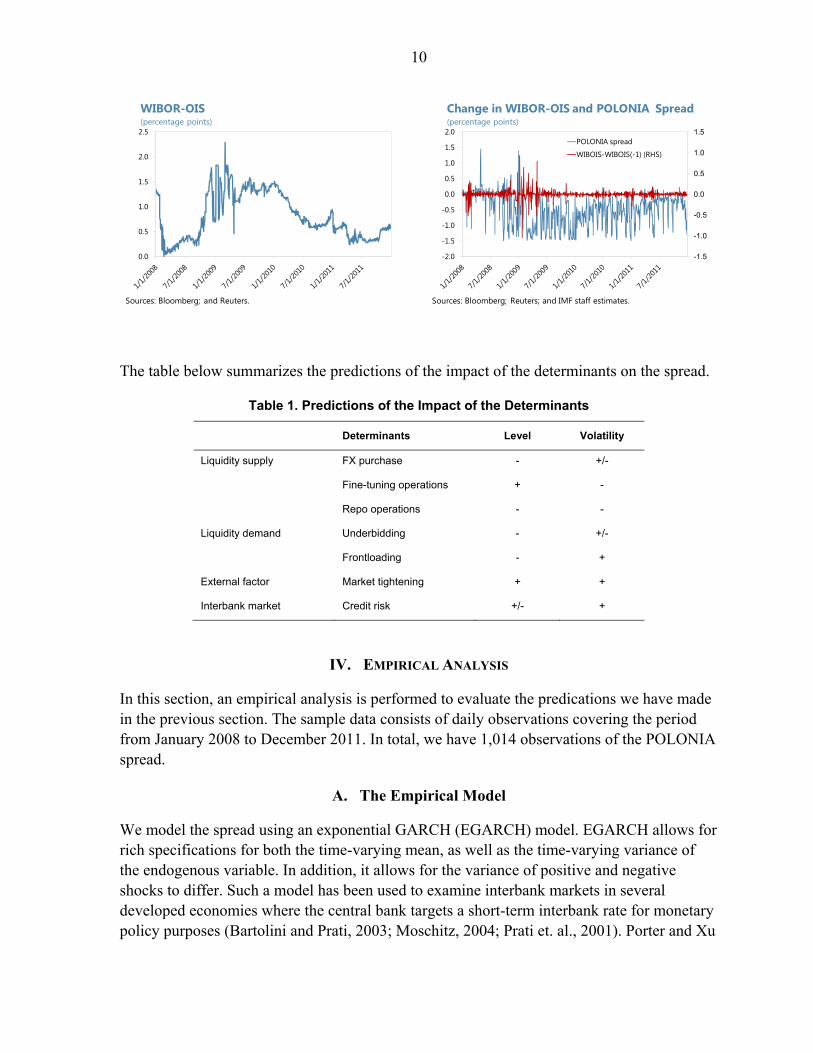
lending currently accounts for about 90 percent of trading, with little activity beyond one week. Risk-averse banks choose to place their liquidity with the NBP instead of in the interbank market when risks increase. For example, a sharp increase in excess reserves deposited at the NBP was observed at end-2008: the end of year effect was magnified by the collapse of Lehman Brothers and the 3-month WIBOR-OIS spread (a measure of interbank credit risk) widened considerably.
Poland’s interbank repo market remains underdeveloped, with trading volumes half the size of the unsecured interbank market. The liquidity of the government securities market has not been transferred to the liquidity of the repo market. The several billion zloty daily turnover in the interbank repo market is dwarfed by the average daily turnover of 24 billion zloty in the secondary market for treasury securities The lack of a widely-accepted master agreement, a lack of clarity in the terminologies between repo and sell-buy-back/buy-sell-back, and tax regulation that disadvantages repo transactions are the main factors that inhibit the market development.6
The overnight nature of the unsecured interbank market and banks’ limited reliance on repos for liquidity management have impaired the functioning of the interbank market. When facing short-term funding gaps, banks have to raise deposit rates to compete for deposits as they cannot rely on the interbank market to meet short-term funding gaps. For example, in November-December 2008, retail deposit rates at many banks increased from 4 percent to over 7 percent, as liquidity conditions tightened. We use the 3-month WIBOR-OIS spread to measure credit risk in the interbank market. Our hypothesis is that higher credit risk could lead to a wider negative spread as banks choose to hoard liquidity. At the same, higher credit risk could lead banks to charge higher rate for interbank borrowing, leading to an increase in the POLONIA rate.
6 National Bank of Poland (2007).
01,0002,0003,0004,0005,0006,0007,0008,0009,000
10,000
Daily Turnover in the Interbank Market (in millions of zloty)
Sources: Reuters; and IMF staff estimates.Note: Turnover data is based on the calculation for POLONIA rate. The dotted line is the 20 day moving average of the POLONIA turnover.
-40
-20
0
20
40
60
80
100
120
140
160
Jan-
08Fe
b-08
Mar
-08
Apr-
08M
ay-0
8Ju
n-08
Jul-
08Au
g-08
Sep-
08O
ct-0
8N
ov-0
8D
ec-0
8Ja
n-09
Feb-
09M
ar-0
9Ap
r-09
May
-09
Jun-
09Ju
l-09
Aug-
09Se
p-09
Oct
-09
Nov
-09
Dec
-09
Jan-
10Fe
b-10
Mar
-10
Apr-
10M
ay-1
0Ju
n-10
Jul-
10Au
g-10
Sep-
10O
ct-1
0N
ov-1
0D
ec-1
0Ja
n-11
Feb-
11M
ar-1
1Ap
r-11
May
-11
Jun-
11Ju
l-11
Aug-
11Se
p-11
Oct
-11
Nov
-11
Dec
-11
Excess Reserves (in millions of zloty)
Source: NBP.
10
The table below summarizes the predictions of the impact of the determinants on the spread.
Table 1. Predictions of the Impact of the Determinants
Determinants Level Volatility
Liquidity supply FX purchase - +/-
Fine-tuning operations + -
Repo operations - -
Liquidity demand Underbidding - +/-
Frontloading - +
External factor Market tightening + +
Interbank market Credit risk +/- +
IV. EMPIRICAL ANALYSIS
In this section, an empirical analysis is performed to evaluate the predications we have made in the previous section. The sample data consists of daily observations covering the period from January 2008 to December 2011. In total, we have 1,014 observations of the POLONIA spread.
A. The Empirical Model
We model the spread using an exponential GARCH (EGARCH) model. EGARCH allows for rich specifications for both the time-varying mean, as well as the time-varying variance of the endogenous variable. In addition, it allows for the variance of positive and negative shocks to differ. Such a model has been used to examine interbank markets in several developed economies where the central bank targets a short-term interbank rate for monetary policy purposes (Bartolini and Prati, 2003; Moschitz, 2004; Prati et. al., 2001). Porter and Xu
0.0
0.5
1.0
1.5
2.0
2.5
WIBOR-OIS (percentage points)
Sources: Bloomberg; and Reuters.
-1.5
-1.0
-0.5
0.0
0.5
1.0
1.5
-2.0
-1.5
-1.0
-0.5
0.0
0.5
1.0
1.5
2.0POLONIA spread
WIBOIS-WIBOIS(-1) (RHS)
Change in WIBOR-OIS and POLONIA Spread (percentage points)
Sources: Bloomberg; Reuters; and IMF staff estimates.

11
(2009) applied the EGARCH model to estimate the seven-day repo rate in China’s interbank market.
Our empirical model of the spread is
,
with
ln ln .
The first equation is the mean equation, in which is the POLONIA spread, i.e., POLONIA minus policy rate; is the autoregressive term incorporating the persistence of the spread; reflects the impact of exogenous factors on the spread; is the standard deviation;
and is the error term. In the second equation—conditional variance equation— is the constant term; is the GARCH term; is the ARCH effects; and shows the asymmetric impact of positive or negative innovation to the standardized residuals. If ≠0, the impact will be asymmetric. measures the impact of exogenous factors on volatility. Given the apparent “fat tails” exhibited by the spread, we assume that the error term follows a Student’s t-distribution.
Exogenous variables include the determinants of the POLONIA spread discussed above. For liquidity supply, the dates that the NBP purchased FX from the MOF are set as dummies. The dummies for both the dates that the NBP conducted regular fine-tuning operations and other ad-hoc fine-tuning operations are included. To capture the impact of repo operations, we include both the start dates and settlement dates of the operations as dummies. Usually settlements were completed two days after the start of repo operations. Regarding liquidity demand, dummies for the occurrences of NBP bill underbidding and overbidding are included. The dummies for the last several days of the reserve maintenance period are included as well. We also introduce the change in the EURIBOR-OIS spread—a proxy for the euro interbank market stress—to measure whether it has any impact on the spread. We use the change in the 3-month WIBOR-OIS spread to measure the credit risk in the interbank market. We use the same exogenous variables for the mean and volatility equations to analyze their impact on the level and volatility of the POLONIA spread.
The “general-to-specific” methodology is used to choose the lags of endogenous and exogenous variables and ARCH and GARCH effects. The GARCH model we choose is the GARCH (3, 4). Most of the variables become statistically insignificant after one lag. Regarding how many days constitute the last few days of the maintenance period, there is no consensus in the literature. We start from Day 1 (the last day of the maintenance period) and include day dummies that are statistically significant in at least one of the two equations and exclude the dummies that are irrelevant in both equations and dummies thereafter. Based on this method, we include dummies from Day 1 to Day 8.

12
Table 2. Variables in the Mean and Volatility Equations
Meaning Variable Index
Liquidity supply Dummies for NBP’s FX purchase when the spread is positive Buy_P
Dummies for NBP’s FX purchase when the spread is negative Buy_N
Dummies for the regular fine tuning operations DRFT
Dummies for the more ad-hoc fine tuning operations DOFT
Dummies for the settlement days of repo operations and its lag when the spread is positive
SREPO_P
Dummies for the start days of repo operations and its lag when the spread is positive
DREPO_P
Dummies for the settlement days of repo operations and its lag when the spread is negative
SREPO_N
Dummies for the start days of repo operations and its lag when the spread is negative
DREPO_N
Liquidity demand Dummies for the overbidding D/S>=1
Dummies for the underbidding D/S<1
Dummies for the last 8 days of reserve maintenance period D1-D8
External factor EURIBOR-OIS minus EURIBOR-OIS(-1) EUROIS-EUROIS(-1)
Interbank market WIBOR-OIS minus WIBOR-OIS(-1) WIBOIS-WIBOIS(-1)
B. Empirical Results
There are a few general observations. The spread is persistent as there is a large response to the previous day’s spread. Given that the variables other than the lag of spread have an impact on the spread, the martingale hypothesis that the interest rate tomorrow should equal to today’s expected level for tomorrow in the absence of market frictions (i.e., 0) does not hold in the case of POLONIA as well as some other empirical studies. 7 In addition, volatility clustering is confirmed with significant GARCH effects. The ARCH effect is significant, while the asymmetric term is not significant.
The estimates confirm the extent of fat tails in the spread. The estimated degrees of freedom for the error term are only 2.6, meaning that the innovation is far noisier than implied by a normal distribution. Such low degrees of freedom are normal in estimating interest rates (see Prati et. al., 2001 and Porter and Xu, 2009).
7 See Hamilton (1996) and Bartolini and Prati (2003). Due to the unavailability of the reliable data for the expected changes in the policy rate within a reserve maintenance period, the impact of the expected changes is not analyzed here.

13
For the mean equation, the impact of the identified determinants on the spread are as follows:
Liquidity supply. NBP’s purchases of FX from the MOF widen the spread when the spread is negative, which is consistent with our hypothesis. When the spread is positive, the impact of these purchases on the spread is insignificant.
Liquidity operations. Fine-tuning operations seem to be successful in reducing the negative spread, particularly in the case of the regular fine-tuning operations introduced recently. The repo operations reduce the spread when the spread is positive, in line with our expectation. When the spread is negative, their impact on the spread is relatively small. Among all the factors, fine-tuning operations (which withdraw liquidity), in particular the regular ones, have the largest impact on narrowing the spread if it is negative and widening the spread if positive. Repo operations (which inject liquidity) have the largest impact in the opposite direction.
Liquidity demand. As expected, the occurrence of underbidding is associated with a widening of the spread if the spread is negative or a narrowing of the spread if it is positive. Most of the dummies for the days of the reserve maintenance period have negative coefficients, meaning that at the end of maintenance period (particularly on the last day) the POLONIA tends to move further below the policy rate. This is consistent with banks’ frontloading reserve requirements.
External factor. The increasing stress in the euro interbank market seems to have led to the tightening of liquidity in the interbank market.
Interbank market. An increase in interbank credit risk is associated with a widening of the spread if the spread is negative or a narrowing of the spread if it is positive. Therefore, it seems that banks’ response to increased credit risk is to hoard liquidity and avoid trading in the interbank market. This is consistent with the increase in the frequency of negative POLONIA spread since the 2008–09 financial crisis.
For the variance equation, the impact of the identified determinants are as follows: Liquidity supply. When the spread is positive, the NBP’s FX purchases from the MOF
tend to reduce volatility. But, when the spread is negative, the impact of FX purchases on the volatility is insignificant.
-0.8
-0.6
-0.4
-0.2
0.0
0.2
0.4
0.6
0.8
1.0Wibois Eurois Front-loadingRepo Fine-tuning FX purchase
Contributions to POLONIA Spread(percentage points)
Source: IMF staff estimates.

14
Liquidity operations. Regular fine-tuning operations decrease the volatility of the spread, while, to a lesser extent, the non-regular ones increase the volatility. These operations have the largest impact among all the factors in dam ping spread volatility. Repo operations are associated with higher volatility, particularly when the spread is negative.
Liquidity demand. Volatility of the spread rises under both underbidding and overbidding auctions, likely associated with some market uncertainty during OMOs. Like their impact on the mean of the spread, most of the dummies for the last days of the reserve maintenance period are associated with higher volatility, especially the last day. The impact of frontloading on heightening volatility is the highest among all the factors. This high volatility is consistent with other analyses (see Prati et. al., 2001).
External factor. The change of the EURIBOR-OIS spread does not have an impact on volatility.
Interbank market. An increase in interbank credit risk does not have an impact on volatility.
V. CONCLUSION AND POLICY IMPLICATIONS
This paper analyzes the behavior and determinants of the POLONIA spread between January 2008 and December 2011. A persistently negative POLONIA spread since 2009 is observed. This is related to the existence of structural liquidity in the banking system and banks’ unwillingness to lock up liquidity in the seven-day NBP bills. The frontloading of banks’ fulfillment of the reserve requirements also plays a role, particularly during the last few days of the maintenance period. In addition, external market sentiment also has some influence on the spread.
The NBP’s response to the fluid liquidity situation has been effective. The repo operations initiated as a response to the financial crisis have played a positive role in steering the POLONIA towards the policy rate. The liquidity-absorbing fine-tuning operations seem to be successful in reducing both the level and volatility of the POLONIA spread, particularly in the case of the regular fine-tuning operations introduced recently. However, the persistently negative spread may have weakened the monetary policy transmission mechanism.
-3.0
-2.0
-1.0
0.0
1.0
2.0
3.0
4.0
5.0
6.0
7.0Front-loading RepoFine-tuning FX purchase
Contributions to Log of Variance
Source: IMF staff estimates.

15
It is challenging to keep the POLONIA close to the policy rate. Some factors are out of the control of the NBP, such as external environment, which needs to be stable to reduce banks’ incentive to hoard liquidity. Nevertheless, the NBP could have more influence on other factors. In the short term, the NBP should be provided with enough information to forecast liquidity as accurately as possible. To facilitate this, greater coordination between the MoF and the NBP is needed: it is important for the NBP to have advanced information regarding MOF’s anticipated exchanges of foreign currency inflows into zloty. In addition, the NBP could assess its instruments for liquidity management on regular basis, and, if needed, introduce new instruments on a trial basis to gauge market demand and expectation (e.g., the newly introduced fine-tuning operations) and assess their impact on interbank market activity. In the medium to long term, enhancing the activities of interbank market and developing long-term local currency funding could help banks to conduct better asset and liability management, a conduit for the improvement of the monetary policy transmission mechanism.

16
Dependent variable: Spread
Included observations: 1,013 after adjustments
Mean equation
Variable Coefficient Std. Error z-Statistic p value
SPREAD(-1) 0.972 0.007 131.518 0.000
BUY_P 0.011 0.009 1.250 0.211
BUY_N -0.028 0.008 -3.335 0.001
DRFT_EX 0.928 0.109 8.483 0.000
DOFT_UNEX 0.076 0.031 2.432 0.015
SREPO_P -0.222 0.076 -2.919 0.004
SREPO_P(-1) -0.298 0.164 -1.822 0.068
DREPO_P -0.070 0.070 -1.003 0.316
DREPO_P(-1) -0.305 0.047 -6.524 0.000
SREPO_N -0.019 0.020 -0.935 0.350
SREPO_N(-1) 0.062 0.039 1.597 0.110
DREPO_N 0.000 0.021 -0.019 0.985
DREPO_N(-1) -0.032 0.015 -2.173 0.030
D/S>=1 0.016 0.014 1.199 0.230
D/S<1 -0.106 0.013 -8.216 0.000
D1 -0.195 0.089 -2.205 0.027
D2 -0.057 0.017 -3.356 0.001
D3 -0.037 0.026 -1.419 0.156
D4 -0.058 0.018 -3.268 0.001
D5 -0.042 0.017 -2.516 0.012
D6 -0.016 0.020 -0.820 0.412
D7 -0.037 0.014 -2.568 0.010
D8 -0.012 0.014 -0.869 0.385
EUROIS-EUROIS(-1) 0.145 0.074 1.964 0.050
WIBOIS-WIBOIS(-1) -0.096 0.028 -3.398 0.001
Variance Equation
C_var -1.983 0.181 -10.967 0.000
ABS(RESID(-1)/SQRT(GARCH(-1)) 0.688 0.151 4.545 0.000
ABS(RESID(-2)/SQRT(GARCH(-2)) -0.246 0.128 -1.923 0.054
ABS(RESID(-3)/SQRT(GARCH(-3)) 0.300 0.109 2.755 0.006
RESID(-1)/SQRT(GARCH(-1)) 0.025 0.056 0.447 0.655
LN(GARCH(-1)) 1.162 0.077 15.078 0.000
LN(GARCH(-2)) -0.920 0.123 -7.477 0.000
LN(GARCH(-3)) 0.532 0.114 4.657 0.000
LN(GARCH(-4)) -0.111 0.065 -1.719 0.086
BUY_P -0.531 0.181 -2.933 0.003
BUY_N 0.155 0.110 1.406 0.160
DRFT_EX -2.055 0.681 -3.019 0.003
DOFT_UNEX 0.866 0.384 2.255 0.024
SREPO_P -1.081 2.469 -0.438 0.662
SREPO_P(-1) 2.532 1.716 1.476 0.140
DREPO_P -0.958 2.290 -0.418 0.676
DREPO_P(-1) 0.893 3.143 0.284 0.776
SREPO_N 0.784 0.482 1.625 0.104
SREPO_N(-1) 0.912 0.415 2.198 0.028
DREPO_N 0.792 0.344 2.302 0.021
DREPO_N(-1) -0.389 0.456 -0.854 0.393
D/S>=1 0.868 0.211 4.113 0.000
D/S<1 1.158 0.180 6.431 0.000
D1 3.784 0.390 9.693 0.000
D2 -0.472 0.456 -1.035 0.301
D3 0.823 0.545 1.509 0.131
D4 0.915 0.521 1.758 0.079
D5 -0.063 0.537 -0.118 0.906
D6 0.712 0.522 1.363 0.173
D7 0.199 0.464 0.428 0.669
D8 0.398 0.328 1.215 0.225
EUROIS-EUROIS(-1) -1.704 1.585 -1.075 0.282
WIBOIS-WIBOIS(-1) 0.147 0.482 0.305 0.760
T-DIST. DOF 2.625 0.301 8.720 0.000
R-squared 0.644
Adjusted R-squared 0.635
S.E. of regression 0.309
Sum squared resid 94.359
Log likelihood 374.157
Durbin-Watson stat 2.153
Mean dependent var -0.495
S.D. dependent var 0.512
Akaike info criterion -0.622
Schwarz criterion -0.336
Hannan-Quinn criter. -0.513
Table 3. Estimated GARCH Parameters

17
APPENDIX I. STRUCTURAL LIQUIDITY
This appendix defines structural liquidity and its components. Structural liquidity refers to the aggregate liquidity position of the banking system, which corresponds to the sum of autonomous factors that are beyond the control of the central bank in the very short run.
The supply of liquidity through autonomous factors can be derived from a simplified balance sheet of the central bank. By netting the external position of the central bank and the position against the government, and summarizing all other assets and liabilities (other items, net), a simplified balance sheet is shown as follows:
A Simplified Balance Sheet of the Central Bank
Assets Liabilities
Net foreign assets Currency in circulation
Net credit to government Minimum reserve requirements (MRR)
Lending to banks/OMOs Excess reserves
Other items, net
Accordingly, factors influencing the liquidity supply can be derived as:
Liquidity supply = Net foreign assets
+ net credit to government Autonomous factors
+ other items, net
- currency in circulation
+ lending to banks/OMOs Policy factor
Three situations related to structural liquidity are possible. When the structural liquidity exceeds the MRR, the banking system has a structural liquidity surplus with respect to the central bank, meaning that it does not need to obtain funding from the central bank. Instead, the central bank may conduct OMOs to absorb surplus liquidity from the banking system. Poland’s banking system is currently in a structural liquidity surplus position. When the structural liquidity is exceeded by the MRR, the banking system has an aggregate liquidity deficit with respect to the central bank, and lending to banks by the central bank may be needed to relieve the liquidity shortage. The third case is a balanced structural liquidity position, which means structural liquidity is equal to the MRR.

18
REFERENCES
Bartolini, Leonardo, and Alessandro Prati, 2003, “Cross-Country Differences in Monetary Policy Execution and Money Market Rates’ Volatility,” FRB of New York Staff Report No. 175 (New York: Federal Reserve Bank of New York).
Hamilton, James D., 1996, “The Daily Market for Federal Funds,” Journal of Political
Economy, Vol. 104, No. 1, pp. 26−56 (Chicago, Illinois: University of Chicago Press).
International Monetary Fund, 2012, Republic of Poland: Selected Issues,” Country Report
No. 12/163 (Washington: International Monetary Fund). Kliber, Agata, and Piotr Płuciennik, 2011, “An Assessment of Monetary Policy Effectiveness
in POLONIA Rate Stabilization During Financial Crisis,” Bank & Credit, 42, pp. 5–30 (Warsaw: National Bank of Poland).
Moschitz, Julius, 2004, “The Determinants of the Overnight Interest Rate in the Euro Area,”
European Central Bank Working Paper No. 393 (Frankfurt: European Central Bank). National Bank of Poland, 2007, “Financial System Development in Poland 2007”. Panigirtzoglou, Nikolaos, James Proudman, and John Spicer, 2000, “Persistence and
Volatility in Short-Term Interest Rates,” Bank of England Working Paper No. 116. Perez Quiros, Gabriel, and Hugo Rodriguez Mendizabal, 2006, “The Daily Market for Funds
in Europe,” Journal of Money, Credit and Banking, Vol. 38, No. 1, pp. 91−118 (Columbus, Ohio: The Ohio State University).
Porter, Nathan, and TengTeng Xu, 2009, “What Drives China’s Interbank Market?” IMF
Working Paper 09/189 (Washington: International Monetary Fund). Prati, Alessandro, Leonardo Bartolini, and Guiseppe Bertola, 2001, “The Overnight
Interbank Market: Evidence from the G-7 and the Euro Zone,” FRB of New York Staff Report No. 135 (New York: Federal Reserve Bank of New York).