what does the research say about... pop quiz!!!. what does “effect size” mean? effect size...
TRANSCRIPT
What does the Research Say About . . .
POP QUIZ!!!
What does “Effect Size” Mean?
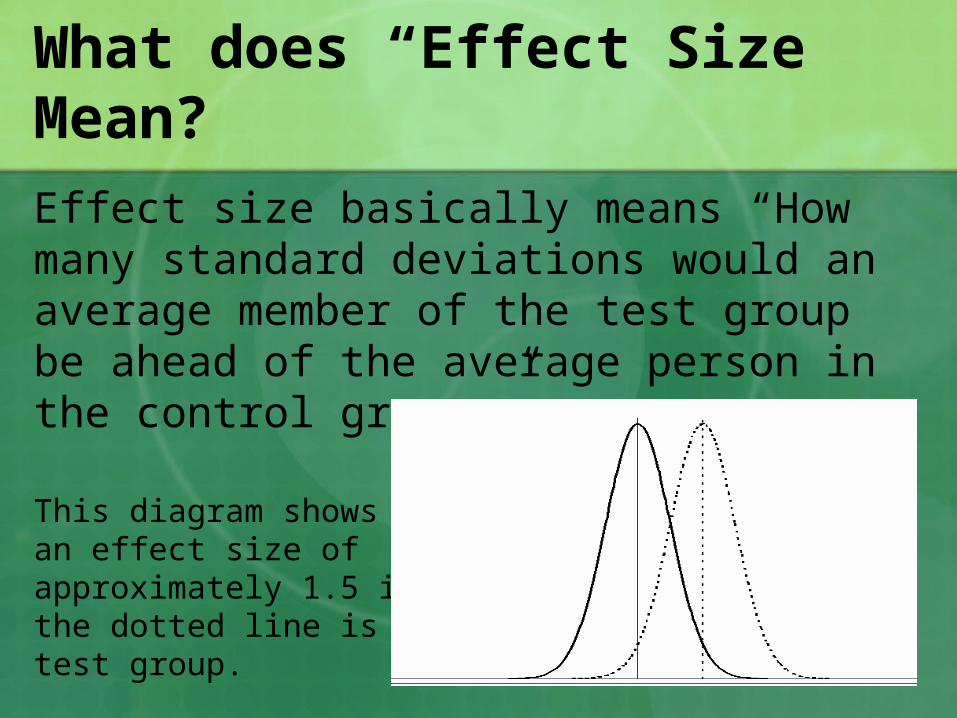
Effect size basically means “How many standard deviations would an average member of the test group be ahead of the average person in the control group.”
This diagram shows an effect size of approximately 1.5 if the dotted line is thetest group.
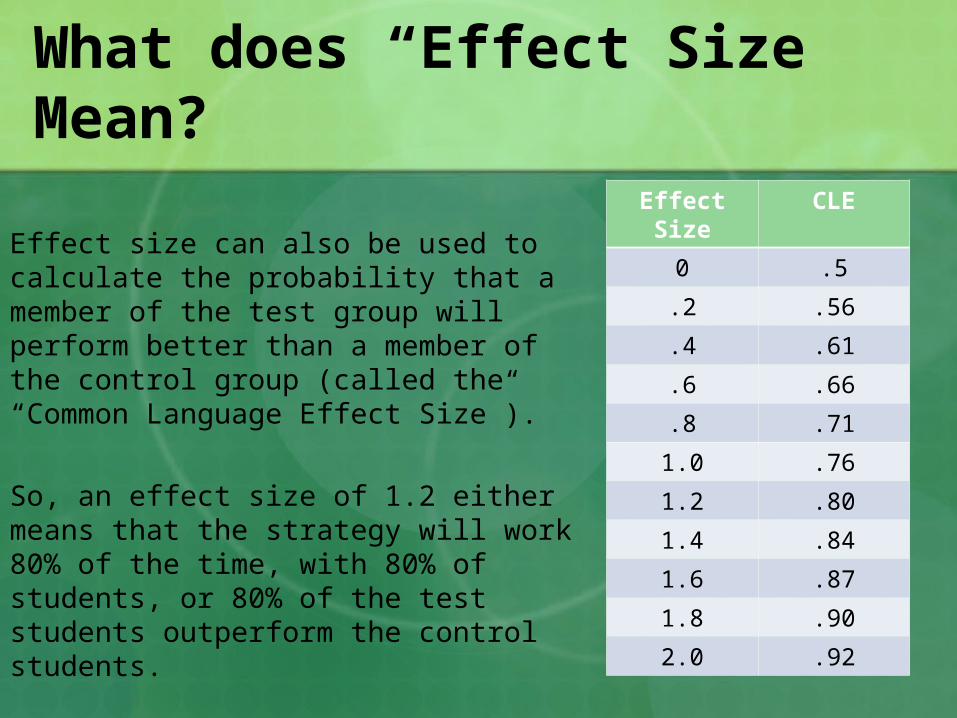
Effect size can also be used to calculate the probability that a member of the test group will perform better than a member of the control group (called the “Common Language Effect Size”).
So, an effect size of 1.2 either means that the strategy will work 80% of the time, with 80% of students, or 80% of the test students outperform the control students.
What does “Effect Size” Mean?
Effect Size CLE
0 .5
.2 .56
.4 .61
.6 .66
.8 .71
1.0 .76
1.2 .80
1.4 .84
1.6 .87
1.8 .90
2.0 .92

Another way to look at it is this: A student who drops out of school and grows a year older
will achieve an overall effect size of up to 0.15 (developmental effects).
The best teachers without using any special strategies achieve an effect size of 0.4 (teacher effects).
So, anything less than 0.15 is doing harm to students. Anything higher than 0.4 is accomplishing more than the best teacher possibly could without using that strategy.
When looking for highly successful strategies, we expect an effect size greater than 0.4.
What does “Effect Size” Mean?
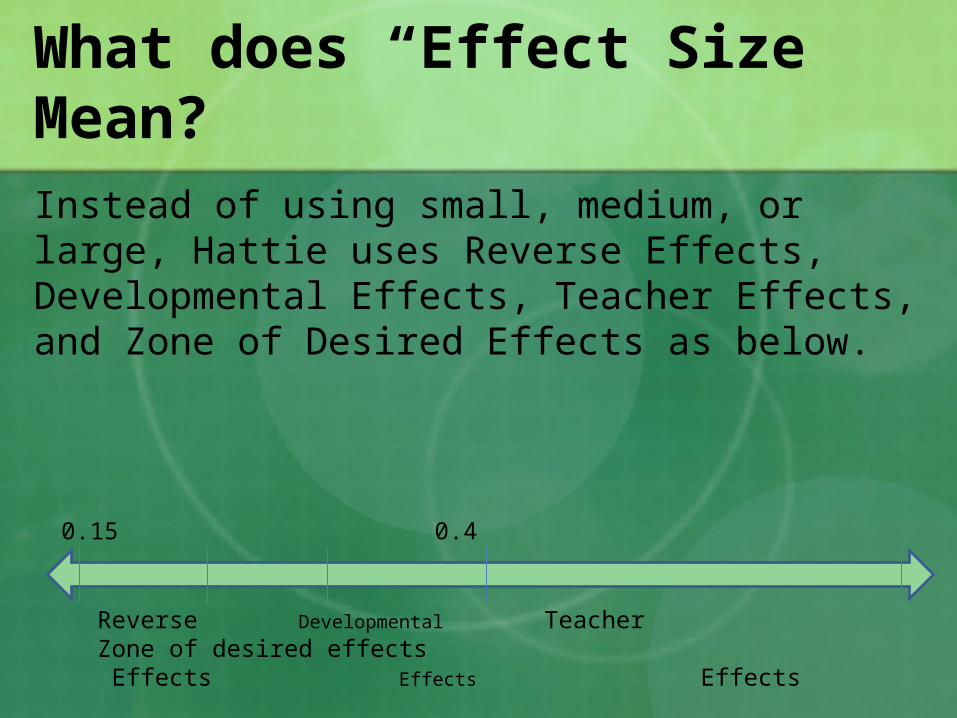
Instead of using small, medium, or large, Hattie uses Reverse Effects, Developmental Effects, Teacher Effects, and Zone of Desired Effects as below.
What does “Effect Size” Mean?
-0.2 0 0.15 0.4 1.2
Reverse Developmental Teacher Zone of desired effects Effects Effects Effects
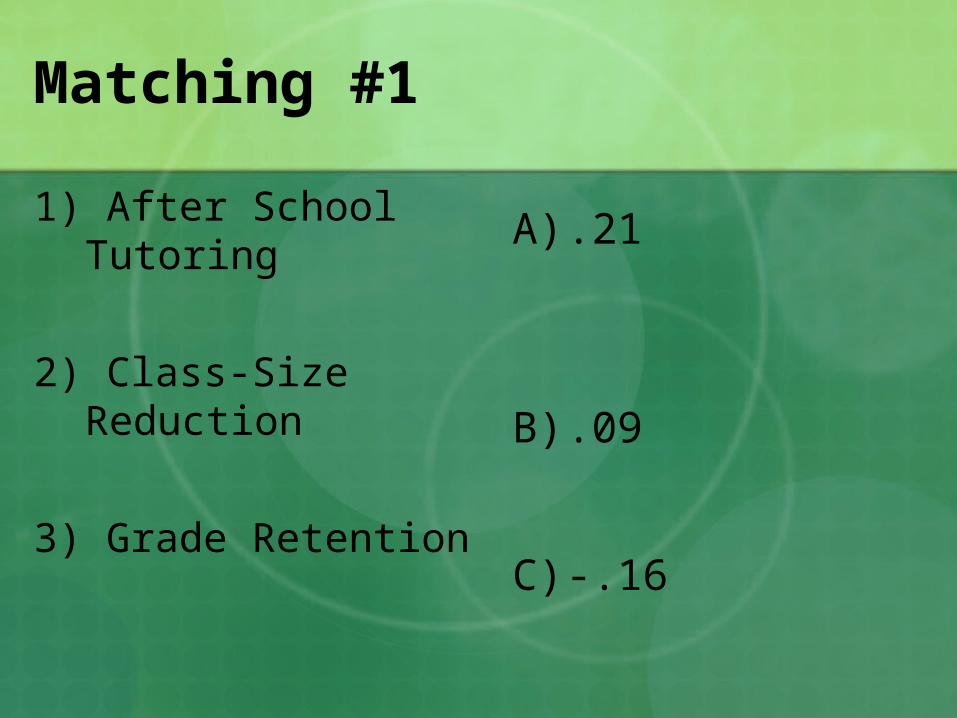
Matching #1
1) After School Tutoring
2) Class-Size Reduction
3) Grade Retention
A) .21
B) .09
C) -.16
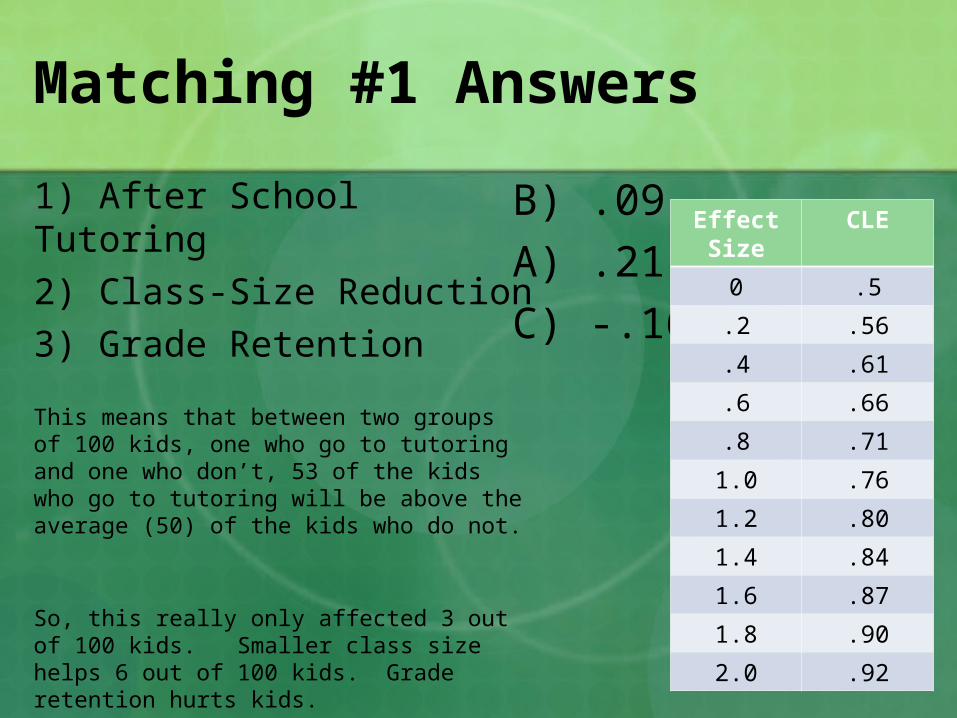
Matching #1 Answers
1) After School Tutoring
2) Class-Size Reduction
3) Grade Retention
This means that between two groups of 100 kids, one who go to tutoring and one who don’t, 53 of the kids who go to tutoring will be above the average (50) of the kids who do not.
So, this really only affected 3 out of 100 kids. Smaller class size helps 6 out of 100 kids. Grade retention hurts kids.
B) .09
A) .21
C) -.16
Effect Size
CLE
0 .5
.2 .56
.4 .61
.6 .66
.8 .71
1.0 .76
1.2 .80
1.4 .84
1.6 .87
1.8 .90
2.0 .92
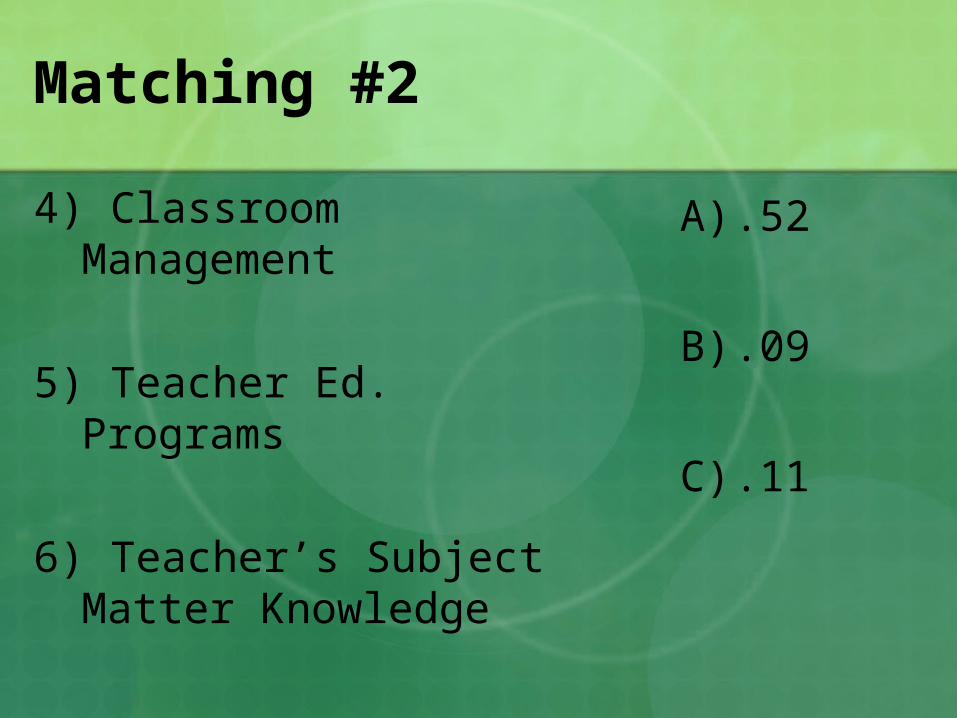
Matching #2
4) Classroom Management
5) Teacher Ed. Programs
6) Teacher’s Subject Matter Knowledge
A) .52
B) .09
C) .11

Matching #2
4) Classroom Management
5) Teacher Ed. Programs
6) Teacher’s Subject Matter Knowledge
This means that if you were to look at test scores and try to guess which teacher had more subject matter knowledge or more teacher ed. classes, you’d be correct about 52% of the time. Random chance would make you correct 50% of the time.
A) .52
C) .11
B) .09Effect Size CLE
0 .5
.2 .56
.4 .61
.6 .66
.8 .71
1.0 .76
1.2 .80
1.4 .84
1.6 .87
1.8 .90
2.0 .92
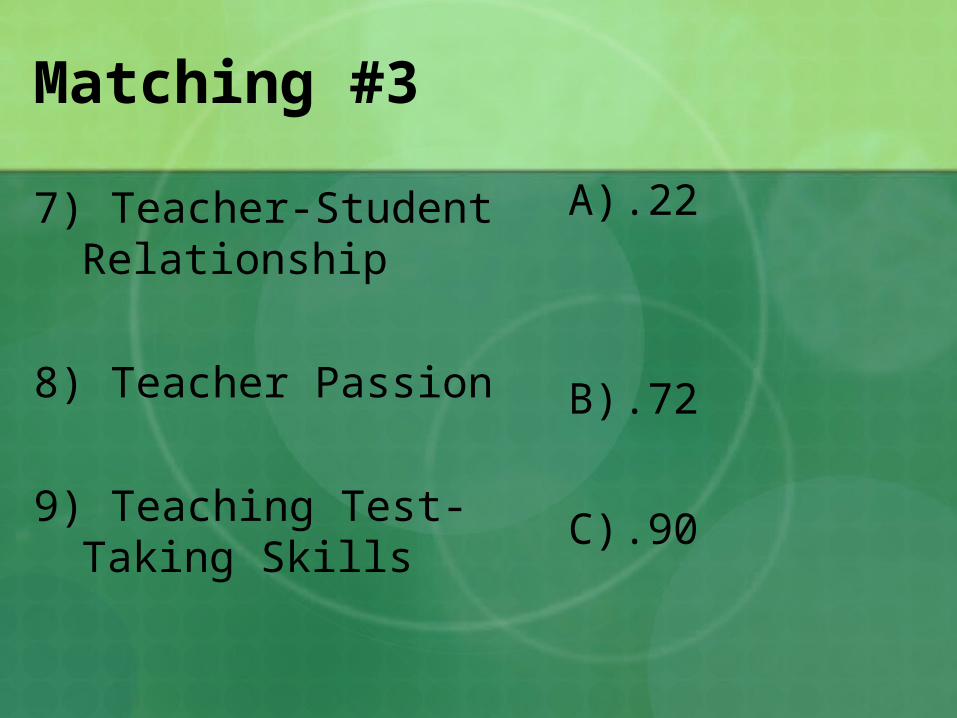
Matching #3
7) Teacher-Student Relationship
8) Teacher Passion
9) Teaching Test-Taking Skills
A) .22
B) .72
C) .90
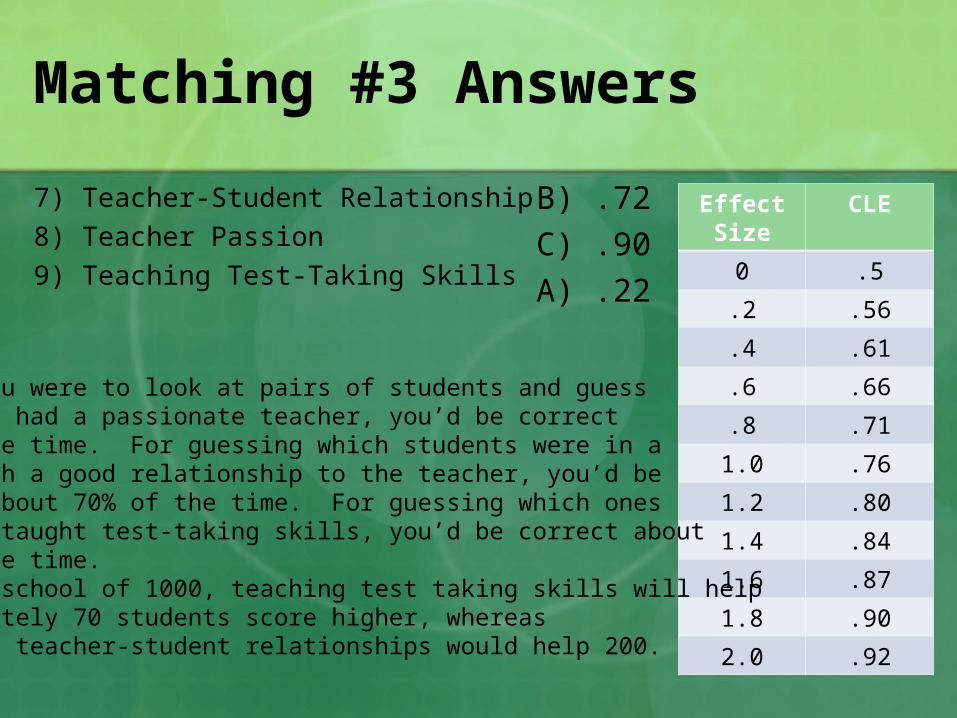
Matching #3 Answers
7) Teacher-Student Relationship
8) Teacher Passion
9) Teaching Test-Taking Skills
B) .72
C) .90
A) .22
Effect Size
CLE
0 .5
.2 .56
.4 .61
.6 .66
.8 .71
1.0 .76
1.2 .80
1.4 .84
1.6 .87
1.8 .90
2.0 .92
So, if you were to look at pairs of students and guess which one had a passionate teacher, you’d be correct74% of the time. For guessing which students were in a class with a good relationship to the teacher, you’d be correct about 70% of the time. For guessing which oneshad been taught test-taking skills, you’d be correct about57% of the time.Or, in a school of 1000, teaching test taking skills will help approximately 70 students score higher, whereas improving teacher-student relationships would help 200.
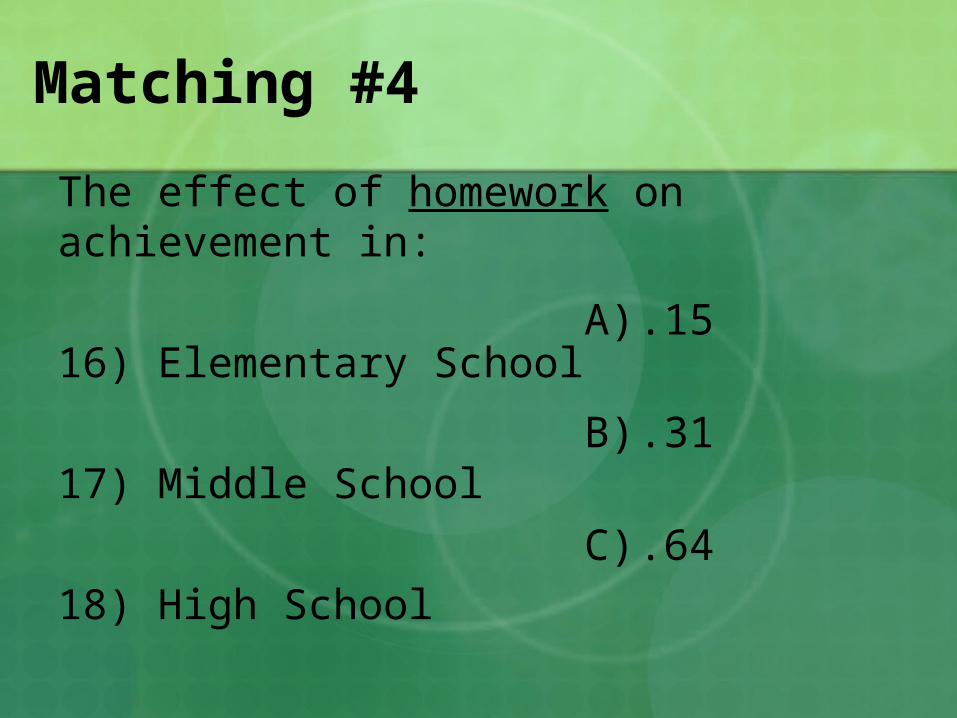
Matching #4
The effect of homework on achievement in:
16) Elementary School
17) Middle School
18) High School
A) .15
B) .31
C) .64
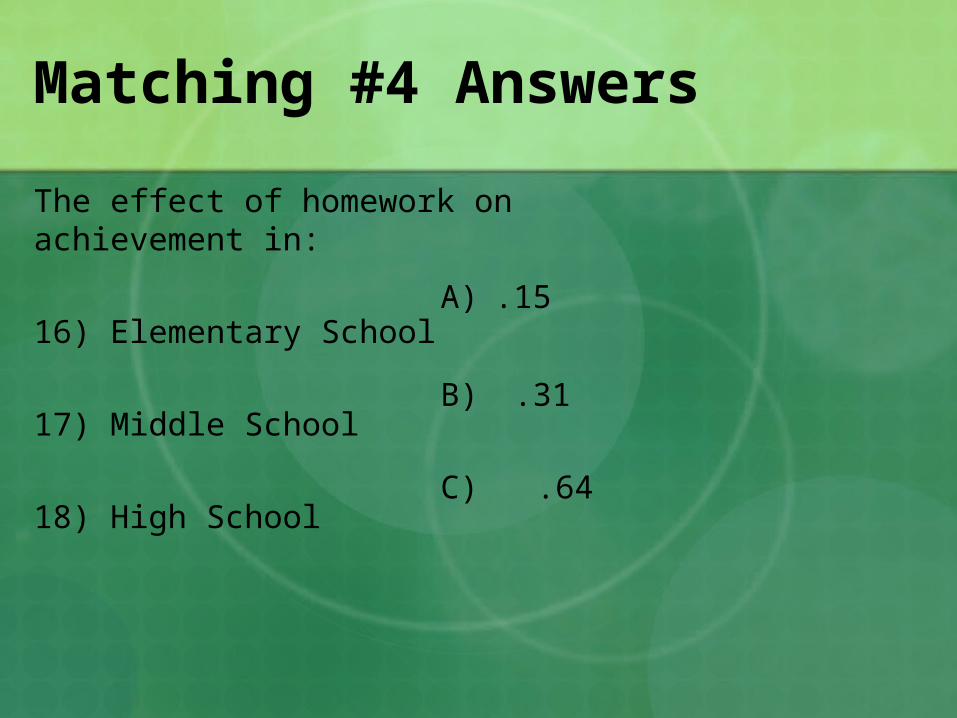
Matching #4 Answers
The effect of homework on achievement in:
16) Elementary School
17) Middle School
18) High School
A) .15
B) .31
C) .64

Tie Breaker, Put them Low to High
Overall effect on achievement from:
22) Teaching Strategies
23) Curriculum
24) Teacher Characteristics
25) School
26) Home
27) Student Characteristics
A) .60
B) .45
C) .49
D) .23
E) .31
F) .40

Highest
22) Teaching Strategies24) Teacher Characteristics 23) Curriculum27) Student Characteristics26) Home25) School
Lowest