what determines the use of capital budgeting methods? evidence
TRANSCRIPT

1
What Determines the Use of Capital Budgeting Methods?
Evidence from Swedish listed companies
Sven-Olov Daunfeldt¤
Fredrik Hartwig§
Abstract: The choice of capital budgeting methods used by companies
listed on the Stockholm Stock Exchange (SSE) is examined using
multivariate regression analysis on questionnaire data from 2005 and
2008. Both recommended and non-recommended methods are found to
be commonly used, with large companies using capital budgeting
methods more frequently than small firms. The choice of capital
budgeting methods is also influenced by leverage, growth opportunities,
dividend pay-out ratios, the choice of target debt ratio, the degree of
management ownership, foreign sales, industry, and individual
characteristics of the CEO. The total use of capital budgeting methods is
lower in Swedish companies compared to U.S. and continental European
companies.
Keywords: Investment decisions; project valuation; capital budgeting
techniques; Swedish listed companies.
JEL-codes: G3; G31.
¤ HUI Research, SE-103 29 Stockholm, Sweden, and Department of Economics, Dalarna University. Borlänge, Sweden. E-mail: [email protected]. Corresponding author. § Department of Education and Business, University of Gävle, Gävle, Sweden. E-mail: [email protected].
2
1. Introduction
Many methods are used to make investment decisions. The choice, however, is not arbitrary,
and textbooks in financial management often recommend the net present value method, while
discouraging the use of other techniques, such as the undiscounted payback method (Brealey
and Myers, 2003; Ross et al., 2005; Lumby and Jones, 2003; Smart, 2004).
We use multivariate regression analysis on questionnaire data from 2005 and 2008 to study
which factors determine the choice of capital budgeting methods in Swedish listed companies.
Our first question is to what extent the recommended methods actually are used, i.e., is there a
gap between theory and practise?
Second, we investigate the average total use of capital budgeting methods. Do Swedish listed
companies typically use just one method, or are two or even more used concurrently? Third,
we examine what factors determine the use of the methods. For example, does size matter as
suggested by Pike (1988, 1996), Stanley and Block, (1984), Graham and Harvey (2001),
Sandahl and Sjögren (2003), and Brounen et al. (2004)? The relation between size and eleven
other independent variables and eight capital budgeting methods are analysed.
Finally we compare our results to studies of U.S. (Graham and Harvey, 2001) and continental
European (Brounen et al., 2004) listed companies, which used data responding to the same
questionnaire as used here.
Capital budgeting decisions are very important for financial managers, since they determine
the choice of investment projects that will affect company value. The use of capital budgeting
methods by U.S. and European listed companies has been studied extensively (e.g., besides
those already mentioned, Pike, 1988, 1989, 1996; Pike and Sharp, 1989; Sangster, 1993;

3
Block, 2007; Hermes et al., 2007).1 There have also been some earlier studies of Sweden
(Renck, 1966; Tell, 1978; Yard, 1987; Andersson, 1994; Segelod, 1995; Sandahl and Sjögren,
2003; Holmén and Pramborg, 2009; Hartwig, 2011).
The present study differs in one important respect from previous similar studies, the majority
of which are based on purely descriptive statistics.2 Most studies thus explore only use or non-
use, or the frequency of use, of capital budgeting methods, and not the association between
use and independent variables. When relationships between use and independent variables
have been studied (e.g., Hartwig, 2011), only descriptive statistical methods such as
correlation analysis and independent-samples t-tests are utilised, so the results cannot be
interpreted causally.3
Our results confirm previous findings that larger companies tend to use capital budgeting
methods more often when deciding on investments. The choice of capital budgeting methods
is also influenced by financial leverage, growth opportunities, dividend pay-out policies, the
choice of target debt ratio, degree of management ownership, foreign sales, and the education
and other individual characteristics of the CEO. The total use of capital budgeting methods is
1 The use of capital budgeting method has also been studied in other parts of the world, including Australia (Truong
et al., 2008) and Asia (Kester et al., 1999; Kwong, 1986), but not to the same extent.
2 Hermes et al. (2007) is an exception, but was mainly interested in exploring country differences in the use of capital
budgeting methods. Silvola (2006) is another exception, but only investigated whether small high-tech companies in
Finland used other capital budgeting methods than did small companies in other industries. Finally, Holmén and
Pramborg (2009) used logit regression to investigate whether the use of capital budgeting methods for foreign direct
investments was related to the political risk in the host country.
3 Hartwig (2011) found a positive correlation between company size and use of the net present value method, with
two possible non-causal explanations: (i) the use of a more sophisticated methods such as net present value could
lead to better growth opportunities and thus to larger companies; or (ii) an omitted variable, such as CEO education,
could cause both better growth opportunities and choice of capital budgeting method.

4
lower in Sweden than in the U.S. (Graham and Harvey, 2001), and continental Europe
(Brounen et al., 2004).
The next section presents capital budgeting methods and explains why some of them are
recommended by textbooks and others not. Data and descriptive statistics on the use of capital
budgeting methods in Swedish listed companies are presented in Section 3. Section 4 then
presents the empirical method and hypotheses to be tested. Results are presented and
discussed in Section 5. Section 6 summarizes and draws conclusions.
2. The use of capital budgeting methods
When evaluating investments, top managers can choose among many capital budgeting
methods, some recommended in textbooks, others not.
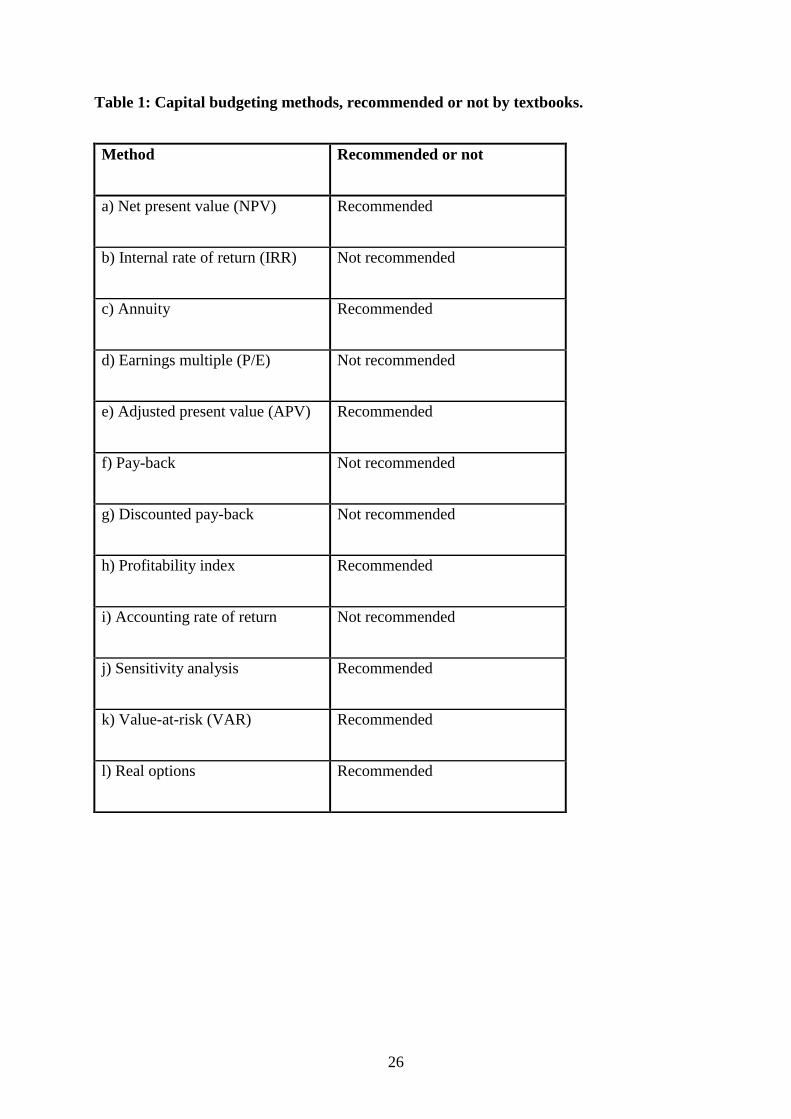
In accordance with Graham and Harvey (2001), we distinguish twelve capital budgeting
methods (Table 1).
[Table 1 about here]
As noted, methods such as net present value (NPV) that discount cash flows, are often
recommended in financial management textbooks. Brealey and Myers (2003), for example,
has a chapter on “why net present value leads to better investment decisions than other
criteria”. NPV is recommended since it incorporates all cash-flows that the investment
generates as well as the time value of money.
Other methods, such as the internal rate of return (IRR) and pay-back methods are often
criticized. IRR can be misleading when a choice must be made among mutually exclusive
projects, and also because of so-called multiple rates of return (Ross et al., 2005), yet it is
5
often used (Graham and Harvey, 2001; Brounen et al., 2004; Bennouna et al., 2010; Sandahl
and Sjögren, 2003).
Pay-back methods do not consider the time value of money, and also ignores cash-flows that
occur after the maximum pay-back time (as defined by management), yet it is also often used
(Graham and Harvey, 2001; Brounen et al., 2004; Bennouna et al., 2010; Sandahl and
Sjögren, 2003). Discounted pay-back does not ignore the time value of money, but still
ignores cash-flows after the maximum pay-back point.
The earnings multiple or price/earnings (P/E) method is a variation on pay-back methods
since it calculates how many years it will take until the initial investment (the share price) will
be paid back by earnings. It considers earnings instead of cash-flows and only considers one
earnings figure (instead of many), and again does not take the time value of money into
consideration. On the other hand, this relative valuation method has the advantage of letting
the more or less efficient capital market guide the decision.
The main disadvantage with the accounting rate of return-method is (as the name suggests)
that it uses accounting numbers (instead of cash-flows) and again does not consider the time
value of money (Ross et al., 2005). Note that management can affect accounting numbers
positively even though their actions may have negative effects on long-term value (Graham et
al. (2005).
In principal, sensitivity analysis has no drawbacks, and should be applied to see whether an
investment will still be profitable if one or more variables are changed. Another method with
no obvious drawbacks is real options. It has been suggested that the reason why many projects
which look unprofitable at first glance are made nevertheless is that management explicitly or
implicitly incorporated the possibility of making subsequent investments (conditioned on the
current project) in the project evaluation.
6
Value-at-risk (VAR), measuring “the worst expected loss over a given horizon under normal
market conditions at a given confidence level” (Jorion, 2006; page xxii), is a rather new
method. A disadvantage is that is does not estimate how bad the loss might be if market
conditions turn abnormal (such as happened widely in 2008-2009).
When the highest net present value per monetary unit of the initial outlay is calculated, a so-
called profitability index has been established. A potential limitation is that, if applied
carelessly and investment resources are constrained, it can give bad advice (Brealey and
Myers, 2003).
The adjusted present value (APV) method adds the value of any financial side-effects of an
investment to NPV, and should in principle have no drawbacks (Ross et al., 2005). The
annuity method is also a variant of NPV. If you know the annuity of an investment, and how
many years it should generate net cash-inflows or outflows, then you can easily calculate its
NPV by discounting the annuity with the relevant weighted average cost of capital.
3. Data and descriptive statistics
To analyse what determines the choice of capital budgeting methods in Sweden, a
questionnaire (Appendix 1) was sent in 2005 and 2008 to the CFOs of all Swedish companies
listed on the Stockholm Stock Exchange. To facilitate a comparison between the surveys, the
questions were the same as used by Graham and Harvey (2001) and Brounen et al. (2004).4 If
no executive had the title CFO, then the questionnaire was sent to another senior executive
(controller, treasurer, or CEO) responsible for financial management.
4 Graham and Harvey (2001) - declared the best paper published in the Journal of Financial Economics in 2001 – is
very often referred to in both academic journals and textbooks.

7
In 2005, the questionnaire was sent to 244 companies by postal mail three times, with
response deadlines 8 January, 14 March, and 23 May. Non-respondents by the first deadline
were contacted by phone to encourage them to respond. In the end, 112 questionnaires
(45.9%) were returned. However, seven were not useable and were dropped, leaving an
adjusted response rate of 43.0%.
In 2008, the questionnaire was sent to 249 companies by postal mail four times, with response
deadlines 18 February, 10 March, 3 April, and 16 June. Again, non-respondents by the first
deadline were contacted by phone. In the end, 92 (36.9%) questionnaires were returned. Four
were not useable, leaving an adjusted response rate of 35.3%. The total adjusted response rate
for the two surveys was thus 39.1%, compared to 9% for Graham and Harvey (2001) and 5%
for Brounen et al. (2004).
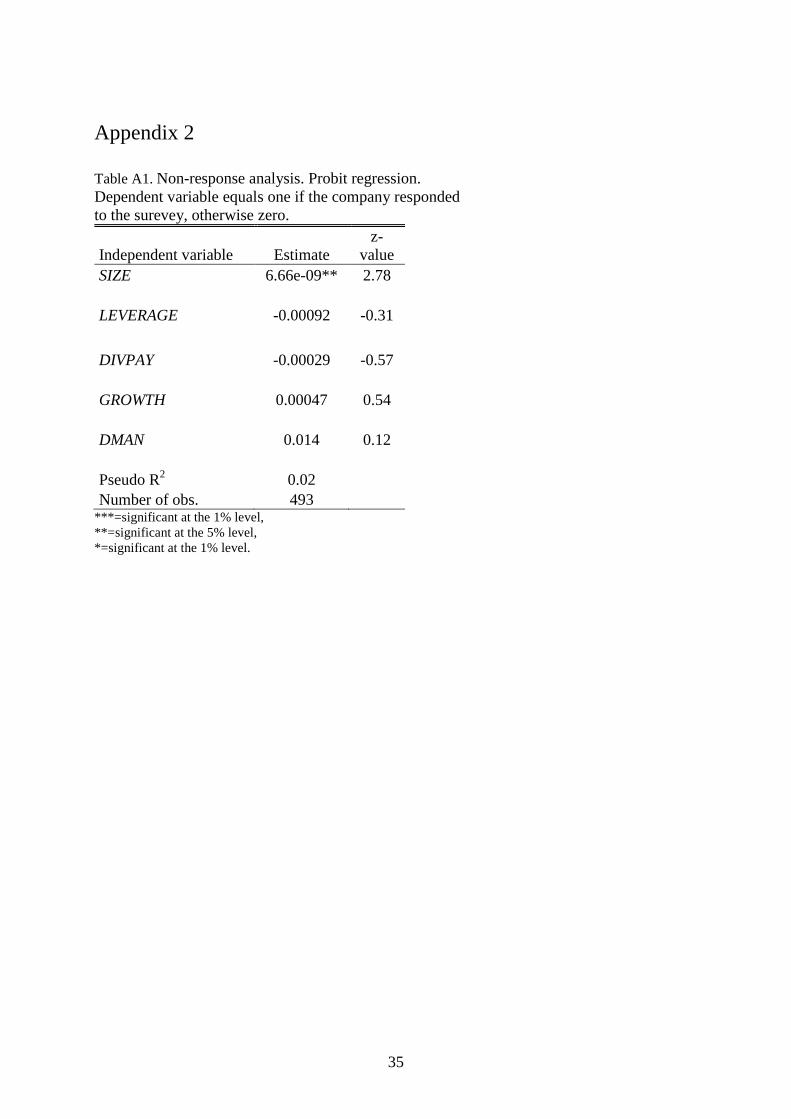
In simple probit analysis of the response rate the probability of response was statistically
significantly higher for larger companies, and the probability to answer the survey was higher
in 2005 compared to 2008. Industry classification, P/E-ratio, degree of leverage, and dividend
pay-out level did not have statistically significant effects on the probability of response (Table
A1 in Appendix 2).
The questionnaire made clear that questions regarding capital investment referred to all non-
routine capital investments accepted or rejected at group/parent-company level. The reason
for this framing was that otherwise, i.e., if questions were taken to refer to all investments in
the company (including investments accepted or rejected at subsidiary level), then the
respondents probably would not be able to give credible answers.
3.1 Dependent variables

8
The questionnaire (Appendix 1) consists of three main questions regarding the use of capital
budgeting methods and cost-of-capital estimation techniques.5 Data from question one, “How
often do you use the following capital budgeting methods (on a scale of 0 to 4, with 0 = never
and 4 = always)?”, was used to construct our dependent variables. The capital budgeting
methods asked about were:
(a) Net-present value
(b) Internal rate of return
(c) Annuity
(d) Earnings multiple
(e) The adjusted present value
(f) Pay-back
(g) Discounted pay-back
(h) Profitability index
(i) Accounting rate of return
(j) Sensitivity analysis
(k) Value-at-risk
(l) Real options
The number and share of respondents reporting that they occasionally or never use or
frequently or always use each method are reported in Table 2. Annuity, adjusted present value
5 The questionnaire also includes questions regarding financing decisions. Those answers are analysed in a
separate study.

9
(APV), value-at-risk, and real options were far less used than the other methods. We excluded
them from further analysis as not providing sufficient variation to analyze.
[Table 2 about here]
The recommended methods used frequently or always by the most listed companies in
Sweden were the net present value (61%) and sensitivity analysis (45%), but not
recommended pay-back method was used frequently or always by 54% of the respondents.
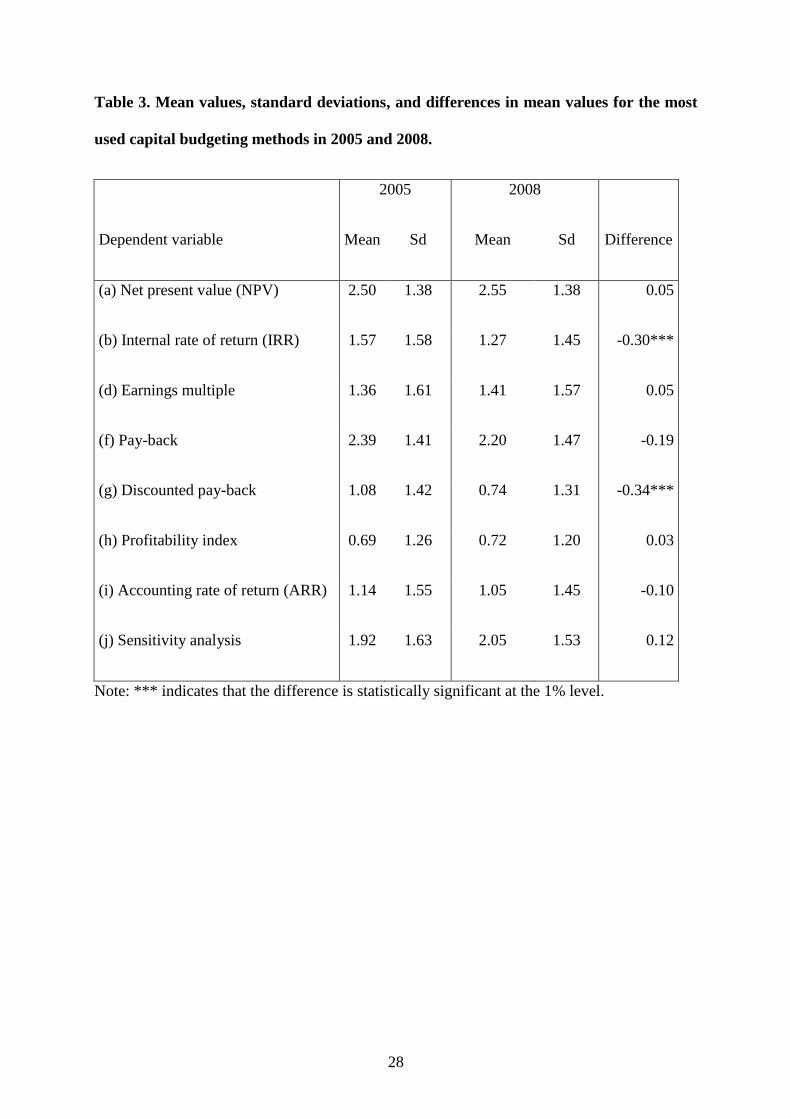
Mean values, standard deviations, and differences in mean values for the most used capital
budgeting methods in 2005 and 2008 are reported in Table 3. Higher mean values indicate
more extensive use of the method.
[Table 3 about here]
The differences between 2005 and 2008 are small, usually not significantly different from
zero. The biggest differences are that IRR and the discounted pay-back (both not
recommended) were less used in 2008 than in 2005.
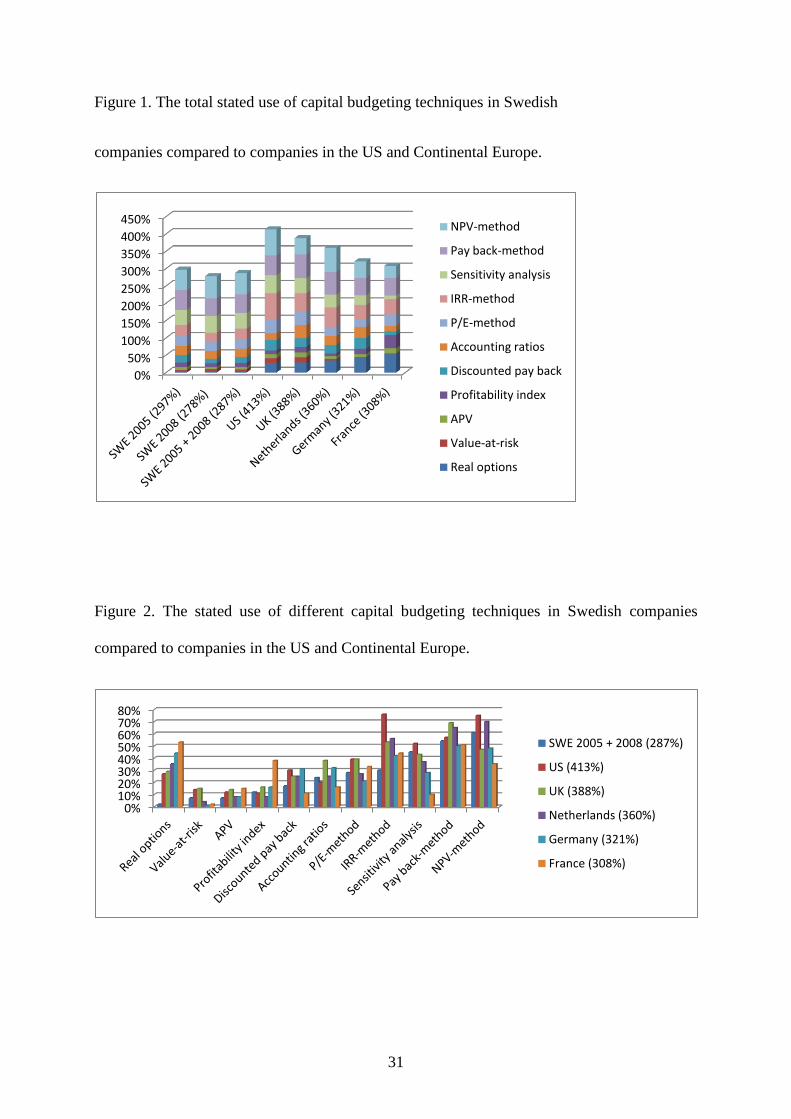
Figure 1 compares the total use of capital budgeting methods by listed Swedish companies
(287%) to U.S. results (413%, Graham and Harvey, 2001) and Continental European results
(308-388%, Brounen et. al, 2004). Total use was calculated as the sum of column 3 on Table
2, and was thus much lower in Sweden compared to the U.S. and Continental Europe.
The differences between Sweden and the U.S. or Continental Europe are surprising since our
data only is from listed companies, which should mean more use of capital budgeting
methods (since listed companies are presumably more sophisticated, gathering more
information before making investments).
[Figure 1 about here]
10
Figure 2 compares use of each method across countries. A recommended method that is very
uncommon in Sweden compared to the U.S. and continental Europe is incorporation of real
options. But other recommended methods as NPV and sensitivity analysis were used more
frequently by Swedish listed companies than by most continental European ones.
[Figure 2 about here]
2.2 Independent variables
We use information on company size, company leverage, growth opportunities, dividend
payout levels, industry classification (manufacturing or not), target debt ratio, proportion of
foreign sales, proportion of shares owned by the management, changes over time (a year
dummy), as well as the age, educational attainment and the tenure of the CEO to analyze
which variables influence the reported use of capital budgeting methods. Definitions, means,
and standard deviations are presented in Table 4. The variables included are further discussed
in Section 4.
[Table 4 about here]
Data on target debt-ratio, proportion of foreign sales, proportion of shares owned by
management, and characteristics of the CEO are obtained from the questionnaire, while data
on company size, growth opportunities, leverage, industry classification, and dividend
payments come from Datastream6. Data was intentionally obtained from Datastream for 2004
and 2007 to prevent a possible endogeneity problem, since previous year's values are
predetermined.
6 In a few instances, when data was not available from Datastream, it was obtained directly from the company.

11
Company size is approximated by revenues adjusted for inflation using the Swedish
Consumer Price Index published by Statistics Sweden. Growth opportunities are proxied by
the price-earnings (P/E) ratio because high P/E-ratios are thought to mean that the capital
market expects the company to have high future growth, and leverage is measured by the debt-
to-asset ratio. Even though it may be the CFO who chooses the capital budgeting method,
questions regarding the CEO were asked since the CFO is seen as the CEO’s agent.
The relationships among the independent variables were investigated using Pearson product-
moment correlation coefficients (Table A2 in Appendix 3), with multicollinearity found to be
limited. The highest correlation coefficient was 0.48, while most were far lower.
4. Empirical method and hypotheses
To analyze what determines the reported use of capital budgeting method, the following
equation is estimated using ordinary least square (OLS):
CBTjit=α0+ α1SIZEit + α2GROWTHit + α3LEVERAGEit + α4TARGET_DEBTit (1)
+α5DIVPAYit + α6FSALESit + α7MAN_OWNit + α8CEOEDUCit + α9CEOAGEit
+ α10CEOTENUREit + α11DMAN + α12DYEARt,+ it
where CBTjit is the reported use of capital budgeting method j (j=1,2,...,8) by company i
(i=1,2,...152) during year t (t=2005, 2008). As noted earlier, SIZEit is deflated revenues (for
company i during year t); LEVERAGE is the debt-to-assets ratio; GROWTH is the price-
earnings ratio; TARGET_DEBT reflects a survey question whether the company had a strict or
flexible debt target; MAN_OWN reflects a survey question on the proportion of shares owned by
management; CEOEDUC reflects the educational attainment of the CEO; CEOAGE reflects
12
CEO’s age; CEOTENURE reflects how long the CEO has had that position; DMAN is a dummy
taking the value one if the company can be classified as a manufacturing company, and zero
otherwise; DIVPAY is company i’s dividend payout ratio; FSALES reflects a survey question on
the proportion of foreign sales; and DYEAR is a dummy taking the value zero in 2005, and one
in 2008.
When estimating Equation (1), we expect size to be related to the use of recommended capital
budgeting methods (Verbeeten, 2006; Pike, 1988, 1996; Graham and Harvey, 2001; Brounen et
al., 2003; Sandahl and Sjögren, 2003) because large companies tend to deal with larger projects,
making the use of more sophisticated methods less costly (Payne et al., 1999; Hermes et al.,
2007).
We expect high leverage to be related to the use of the non-recommended pay-back method,
which has been found to be positively associated with economic uncertainty (Binder and
Chaput, 1996; Schall and Sundem, 1980). Simpler rules (such as pay-back) can be more
attractive in an uncertain setting, since the costs of accurately estimating the inputs for more
complicated discounting-based calculations are higher (Binder and Chaput, 1996). An
alternative explanation as to why high leverage companies might be expected to use pay-back
more often is that they are under more financial pressure and might therefore feel a need to find
investments that quickly “pay back” the initial investment.
We expect growth companies to use two recommended methods more frequently. First, finance
textbooks teach that IRR should not be used to rate mutually exclusive projects7, which growth
companies might have more of than mature companies. Growth companies might also be more
likely to calculate the profitability index, because if they have more potential new investment
7 Investment projects are said to be mutually exclusive if only one could be accepted.

13
projects8, and thus reject more, it would be important that the accepted ones give the highest
possible NPV per unit invested, and the only way to establish that is through calculating the
profitability index.
We expect companies with strict debt targets to use the non-recommended ARR method more
often. Companies which are closer to violating accounting-based debt covenants have been
found more likely to choose income enhancing accounting solutions which reduce the risk of
“costly” technical default (Watts and Zimmerman, 1990). The same thing might happen with
regard to “internal debt covenants” (i.e., debt targets); the higher the “cost” of violating the
accounting based debt target, the more the company might consider how an investment would
affect accounting numbers.9 Companies with a stricter target might thus tend to consider an
investment’s impact on the accounting debt-ratio to a higher extent (so that the target debt-ratio
is not “violated”). The accounting rate of return indicates how an investment is expected to
affect the debt ratio, and could therefore be employed more extensively in strict debt-target
companies.
We expect companies with greater management ownership to use recommended methods more
often. Ownership structure can have an impact on managerial decisions and company
performance (Warfield et al., 1995; Klassen, 1997), and companies with greater managerial
ownership have been found to be less likely to experience financial distress (Donker et al.,
2009), perhaps because managers then have more to lose if the company goes bankrupt.
Management ownership may thus reduce management opportunism and increase use of
recommended capital budgeting methods.
8 In mature companies, a larger portion of the total capital investment budget might consist of reinvestments. Since the business activities to a higher extent are given in a mature company (at least in the short to medium run), one could expect that the number of potential investment projects are fewer. 9 The cost of “violating” the target debt-ratio is considered to be higher in companies with a stricter target.

14
On the other hand, with greater separation of ownership (principals) and management (agents)
incentives can arise for managers to pursue non-value maximising behaviour (Jensen and
Meckling, 1976). To remedy this, contracts often stipulate that management’s remuneration
should be based on accounting numbers. Top managers’ discretion over both business activities
and accounting choices makes it possible for them to manage earnings upwards, to maximise
their own bonus payments (Healy, 1985). Managers can thus take either accounting actions or
real actions to manage earnings or other accounting figures (Dechow and Skinner, 2000).10
Managers focused on meeting accounting figures might reject a profitable investment (with
positive NPV) if the calculated accounting rate of return is too low.11
Graham et al. (2005)
showed that top management was willing to sacrifice long-term value just to meet accounting
targets12
. We believe that this focus on accounting numbers is more profound in companies with
low levels of management ownership, and we therefore expect that management owned
companies use ARR less frequent.
We expect more educated and younger CEOs to use recommended methods (Hermes et al.,
2007), with which they might be more familiar and to which they might be more open. We also
expect new CEOs to use more “socially acceptable” (often recommended methods), whereas
CEOs with more company-specific experience might be more relaxed and choose simpler
methods, perhaps viewing them as “good enough”. But more experienced CEOs might choose
more recommended methods if taught their value by experience.
There might also be industry-specific differences when it comes to the use of methods. We
expect manufacturing companies to use more recommended methods because they are often
larger, more capital intensive with higher sunk costs.
10 “Real actions” refers to actions that affect cash-flow. 11 Calculating accounting rate of return on investments gives an approximate estimate of how accounting ratios (like return on assets) would be affected. 12 The fact that top managers in general do not believe that the capital market is able to see through managed financial statements (Collison et al., 1996; Tzovas, 2006), is probably a contributing factor as to why they focus on accounting numbers.
15
We expect that companies with a higher dividend payout ratio use profitability index
calculations methods less often because (apart from expectations about future positive cash
flows and profits) a higher dividend payout indicates that the company is liquid, making capital
rationing less likely.
We expect a positive relation between foreign sales, presumably reflecting a higher proportion
of foreign investments, with attendent currency and political risks, and use of sensitivity
analysis. Moreover, we expect that foreign sales is positively associated with the pay-back
method13
. Holmén and Pramborg (2009) documented that the use of the payback method
increases with political risk. The suggested reason for the observed positive relation (between
political risk and the pay-back method) is that political risk is difficult to estimate (i.e. rendering
high deliberation costs).
Finally, we expect more use of recommended methods in 2008 than in 2005, because the use of
capital budgeting methods has become more sophisticated over time (Klammer and Walker,
1984; Pike, 1996; Ryan and Ryan, 2002; Sandahl and Sjögren, 2003; Bennouna et al., 2010).
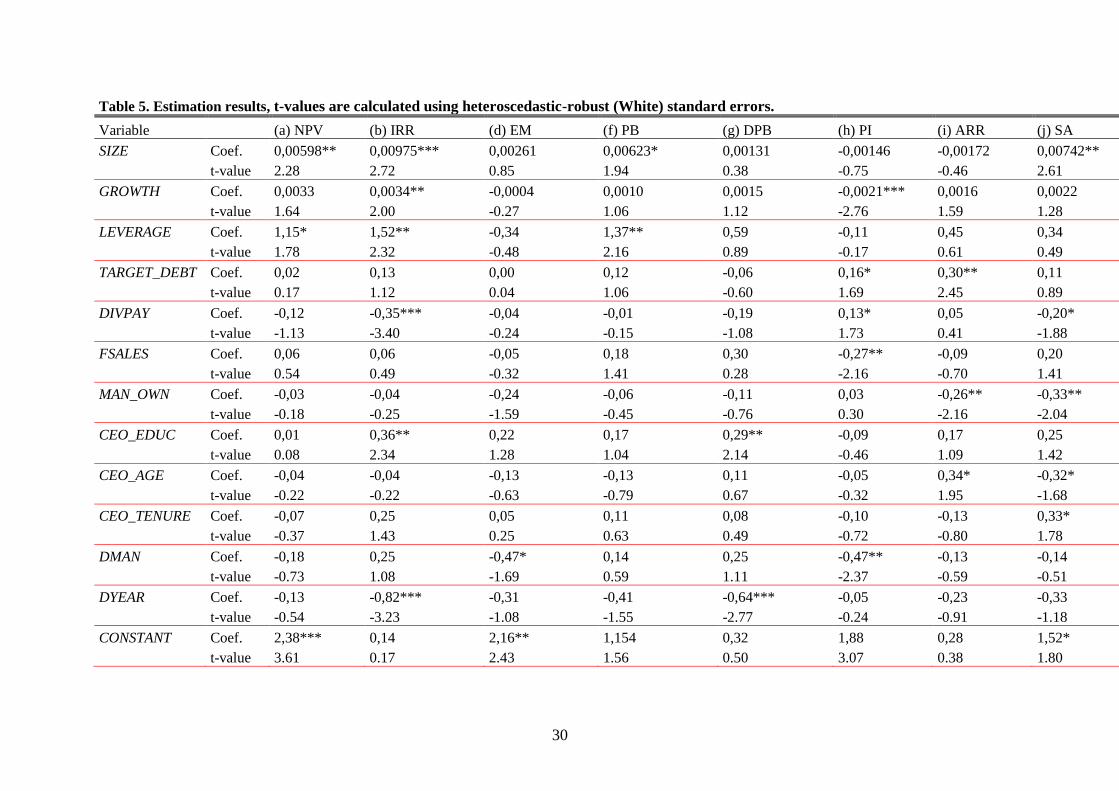
5. Results and discussion
Company size has generally been positively correlated with the use of recommended capital
budgeting methods (Graham and Harvey, 2001; Brounen et al., 2004). We find that large
companies use NPV (recommended), IRR (not recommended), pay-back (not recommended),
and sensitivity analysis (recommended) more than small companies; results for the other
methods were smaller and less statistically significant (Table 5).
13 Naturally, we do not know how much political risk companies with foreign sales (which is a proxy for foreign investments) are exposed to. It is, however, probable that companies with a lower proportion of foreign sales/investments, all other things held constant, are exposed to less political risk.
16
[Table 5 about here]
Contrary to our results, Graham and Harvey (2001) found a statistically significant negative
relation between size and pay-back in particular in the U.S., while Brounen et al. (2004) found
no statistically significant relation between size and pay-back in any of their four continental
European countries (Germany, France, Netherlands, and UK).
Contrary to our expectations, Swedish listed companies with higher growth opportunities
(which we measured by their P/E ratio) used IRR (not recommended) more often but
profitability index (recommended) less often. Possibly the P/E ratio is a bad proxy for growth
opportunities, or maybe “growth companies” actually have or assess fewer investment
opportunities than do mature companies.
High-leverage companies employed the pay-back method more frequent, confirming our
hypothesis that companies with a high level of financial risk are more likely to use the non-
reommended, and non-discounting based, pay-back method. However, high leveraged
companies also had a tendency to utilise NPV and IRR, which both are discounting based
methods, more extensively than low leveraged companies, supporting results presented
previously by Graham and Harvey (2001).
Confirming our expectations, companies with stricter debt targets used ARR (not
recommended) more. Companies with stricter debt targets also employed the profitability index
(recommended) more, a result also found by Graham and Harvey (2001).
Contrary to what we expected, companies with a higher dividend pay-out level utilised
profitability index more, as well as using IRR (not recommended) and sensitivity analysis
(recommended) more. Companies with more foreign sales used profitability index less.
Moreover, foreign sales was not significantly positively related to the use of the pay-back
method. The latter result thus fails to support the findings in Halmén and Pramborg (2009).

17
Management-owned companies used ARR (not recommended) and sensitivity analysis
(recommended) less often, supporting previous findings that ownership structure influence
management decisions (Gul et al., 2002; Hutchinson and Leung, 2007; Siregar and Utama,
2008). Management-owned companies might use ARR because of greater goal-congruence
between agent and principal, with owners more interested in the economic than accounting
returns of an investment. There may also be other (preferred) communicative and monitoring
tools than formal accounting numbers in companies with high management/inside ownership
(Eng and Mak, 2003), making an investment’s impact on accounting rate of return not as
important.
The reduced use of sensitivity analysis (recommended) by management-owned companies
could be interpreted as contradicting the argument that owner-managers would tend to use more
sophisticated methods. But it could also be that non-owner managers estimate how sensitive
ARR (rather than, say NPV) is to changes in the assumptions (thus not necessarily leading to
increased shareholder value). And it could be that non-owner managers make ARR estimations
“internally” (to see how the accounting numbers are affected), but show NPV-based sensitivity
analyses to other executives/board members to legitimise their investment choice (Dowling and
Pfeffer, 1975; Gray, 1996).
As expected, older CEOs used the accounting rate of return (not recommended) more often, but
sensitivity analysis (recommended) less. On the other hand, CEOs with long tenure used
sensitivity analysis more. Contrary to expectations, more educated CEOs used both IRR (not
recommended) discounted pay-back (not recommended) more. A positive association between
CEO education and use of IRR has also been found in the U.S. (Graham and Harvey, 2001),
and the Netherlands, Germany and France, though not in the UK (Brounen et al. 2004).

18
Confirming our expectations, manufacturing companies used earnings multiple approach (not
recommended) less, but also used profitability index (recommended) less, contradicting our
expectations. Finally, IRR (not recommended) and discounted pay-back (not recommended)
were used less in 2008 than in 2005. Thus, the use of recommended methods may not have
increased, but the use of non-recommended methods seems to have decreased.
6. Summary and conclusions
We analyzed what determined the use of capital budgeting methods in Swedish listed
companies in 2005 and 2008. Data on the use of capital budgeting methods were obtained
from a questionnaire sent out to all Swedish companies listed on the Stockholm Stock
Exchange, with the questionnaire a replica of that used by Graham and Harvey (2001) and
Brounen et al. (2004).
Previous studies have found size to be positively correlated with the use of some capital
budgeting methods. However, most of these studies were based on descriptive methods such
as correlation analysis and independent sample t-tests, which are not sufficient to establish
causality. Using multivariate regression analysis, we found that large companies used net
present value (recommended), internal rate of return (not recommended), pay-back (not
recommended), and sensitivity analysis (recommended) more than small companies.
Other company-specific variables that seemed to influence the choice of method were growth
opportunities of the firm, leverage, the dividend pay-out ratio, target debt ratio, the degree of
management ownership, foreign sales, industry and individual characteristics of the CEO. Our
results supported hypotheses that Swedish listed companies have become more sophisticated
over the years (or at least less unsophisticated); that companies with greater leverage used

19
payback more; and that companies with stricter debt targets and less management ownership
employed ARR more.
Surprisingly, companies with more educated CEOs used non-recommended methods such as
IRR and discounted pay-back more than others. Possibly it is the characteristics of the CFO
(not the CEO) that influence the choice of capital budgeting methods, which is thus a topic for
further study.
The reported use of capital budgeting methods was compared to U.S. and continental
European studies. Total use of capital budgeting methods was higher in the U.S. (Graham and
Harvey, 2001) and in continental Europe (Brounen et al., 2004) than in Sweden. This is
surprising since data only is from listed companies, whereas both non-listed as well as listed
companies were included in Graham and Harvey (2001) and Brounen et al. (2004). It can be
assumed that listed companies are more sophisticated, gathering more information before
making investments, which should mean more extensive use of capital budgeting methods.
Our study measured only reported use of capital budgeting methods, not actual use; i.e., we
measured beliefs rather than actions. We cannot be sure what methods were actually used. But
our survey nevertheless enabled a broad and rich overview of capital budgeting methods in
Sweden, facilitating comparisons between countries and over time.

20
References
Andersson, B. (1994), Investeringar och energianvändning. Doctoral Thesis, Göteborgs
Universitet, Sweden..
Bennouna, K., Meredith, G.G., and Marchant, T. (2010), “Improved capital budgeting
decision making: evidence from Canada”, Management Decision, Vol. 48 (2), pp. 225-247.
Binder, J.J., and Chaput, J.S. (1996), “A positive analysis of corporate capital budgeting
practices”, Review of Quantitative Finance and Accounting, Vol. 6 (3), pp. 245-257
Block, S. (2007), “Are real options actually used in the real world?”, The Engineering
Economist, Vol. 52 (3), pp. 255-267.
Brealey, R.A., and Myers, S.C. (2003), Principles of Corporate Finance (International
Edition), 7th
edition, McGraw-Hill, New York.
Brounen, D., De Jong, A., and Koedijk, K. (2004), “Corporate Finance in Europe:
Confronting Theory with Practise”, Financial Management, Vol. 33 (4), pp. 71-101.
Collison, D.J., Grinyer, J.R., and Russel, A. (1996), “U.K. Managers’ Decisions and Their
Perceptions of Capital Markets”, Journal of International Accounting & Taxation, Vol. 5 (1),
pp. 39-52.
Dechow, P.M., and Skinner, D.J. (2000), “Earnings management: reconciling the views of
accounting academics, practitioners, and regulators”, Accounting Horizons, Vol. 14 (2), pp.
235-250.

21
Donker, H., Santen, B., and Zahir, S. (2009), “Ownership structure and the likelihood of
financial distress in the Netherlands”, Applied Financial Economics, Vol. 19 (21), pp. 1687-
1696.
Dowling, J., and Pfeffer, J. (1975), “Organizational legitimacy. Social values and
organizational behavior”, Pacific Social Review, Vol. 18 (1), pp 122-136.
Eng, L.L., and Mak Y.T. (2003), “Corporate governance and voluntary disclosure”, Journal
of Accounting and Public Policy, Vol. 22 (4), pp. 325–345.
Graham, J.R., and Harvey, C.R. (2001), “The theory and practise of corporate finance:
evidence from the field”, Journal of Financial Economics, Vol. 60 (2-3), pp. 187-243.
Graham, J.R., Harvey, C.R., and Rajgopal S. (2005), “The economic implications of corporate
financial reporting”, Journal of Accounting and Economics, Vol. 40 (1-3), pp. 3-73.
Gray, R., Owen D., and Adams C. (1996), Accounting and Accountability. Changes and
challenges to corporate and environmental reporting, Prentice-Hall. London.
Gul, F.A., Lynn, S.G., and Tsui, J.S.L. (2002), “Audit Quality, Management Ownership, and
the Informativeness of Accounting Earnings”, Journal of Accounting, Auditing and Finance,
Vol. 17 (1), pp. 25-49.
Hartwig, F. (2011), “The use of investment appraisal methods and cost of capital estimation
techniques in Swedish listed companies”, Paper presented at the 34th
EAA Congress, Rome
20–22 April 2011.
Healy, P.M. (1985), “The Effect of Bonus Schemes on Accounting Decisions”, Journal of
Accounting & Economics, Vol. 7 (1-3), pp. 85-107.

22
Hermes, N., Smid, P., and Yao, L. (2007), “Capital budgeting practices: A comparative study
of the Netherlands and China”, International Business Review, Vol. 16 (5), pp. 630-654.
Holmén, M., and Pramborg, B. (2009), “Capital Budgeting and Political Risk: Empirical
Evidence”, Journal of International Financial Management & Accounting, Vol. 20 (2), pp.
105–134.
Hutchinson, M., and Leung, S. (2007), “An investigation of factors influencing the
association between top management ownership and earnings management”, Journal of
Contemporary Accounting and Economics, Vol. 3 (2), pp. 130-153.
Jensen, M.C., and Meckling, W.H. (1976), “Theory of the firm: Managerial behaviour,
agency costs and ownership structure”, Journal of Financial Economics, Vol. 3 (4), pp. 305-
360.
Jorion, P. (2006) Value at Risk – The New Benchmark for Managing Financial Risk, 3rd
edition, McGraw-Hill Higher Education.
Kester, G.W., Chang, R.P., Echanis, E.S., Haikal, S., M.M. Isa., Skully, M.T., Tsui, K.C., and
Wang, C.J. (1999), “Capital Budgeting Practices in the Asia-Pacific Region: Australia, Hong
Kong, Indonesia, Malaysia, Philippines, and Singapore”, Financial Practise and Education,
Vol. 9 (1), pp. 25-33.
Klammer, T.P., and Walker, M.C. (1984), “The continuing increase in the use of sophisticated
capital budgeting techniques”, California Management Review, Vol. 27 (1), pp. 137-148.
Klassen, K.J. (1997), “The impact of inside ownership concentration on the trade-off between
financial and tax reporting”, The Accounting Review, Vol. 72 (3), pp. 455-474.

23
Kwong, H.C. (1986), “The Sophistication of Capital Budgeting in Malaysian Companies”,
Omega, Vol. 14 (2), pp. 175-181.
Lumby, S., and Jones, C. (2003), Corporate Finance: Theory and Practise, 7th
edition,
Thomson Learning, London.
Pike, R. (1988), “An Empirical Study of the Adoption of Sophisticated Capital Budgeting
Practices and Decision-Making Effectiveness”, Accounting and Business Research, Vol. 18
(72), pp. 341-351.
Pike, R. (1989), “Do Sophisticated Capital Budgeting Approaches Improve Investment
Decision-Making Effectiveness?”, The Engineering Economist, Vol. 34 (2), pp 149-161.
Pike, R.H. and Sharp, J. (1989), “'Trends in the Use of Management Science Techniques in
Capital Budgeting”, Managerial and Decision Economics, Vol 10 (2), pp. 135-140.
Pike, R. (1996), “A longitudinal survey on capital budgeting practices”, Journal of Business
Finance & Accounting, Vol. 23 (1), pp. 79-92.
Renk, O. (1966), Investeringsbedömning i några svenska företag, P.A. Nordstedt & Söners
förlag, Stockholm.
Ross, S.A., Westerfield, R.W., and Jaffe, J. (2005), Corporate Finance (International
Edition), 7th
edition, McGraw-Hill, New York.
Ryan, P.A., and Ryan, G.P. (2002), “Capital budgeting practices of Fortune 1000: how have
things changed?”, Journal of Business and Management, Vol. 8 (4), pp. 355-364.
Sandahl, G., and Sjögren, S. (2003), “Capital budgeting methods among Sweden´s largets
groups of companies. The state of the art and a comparison with earlier studies”, Production
Economics, Vol. 84, pp. 51-69.

24
Sangster, A. (1993), “Capital investment appraisal techniques: a survey of current usage”,
Journal of Business Finance & Accounting, Vol 20 (3), pp. 307-332.
Schall, L.D., and Sundem, G.L. (1980), “Capital budgeting methods and risk: a further
analysis”, Financial Management, Vol. 9 (1), pp. 7-11.
Segelod, E. (1995), Resource Allocation in Divisionalized Groups. Aveburty, Aldershot,
England.
Silvola, H. (2006), “Low-intensity R&D and capital budgeting decisions in IT firms”,
Advances in Management Accounting, Vol. 15, pp. 21–49.
Siregar, S.V., and Utama, S. (2008), “Type of earnings management and the effect of
ownership structure, firm size, and corporate-governance practices: Evidence from
Indonesia”, The International Journal of Accounting, Vol. 43 (1), pp. 1–27
Smart, S. B., Megginson, W.L., and Gitman, L.J. (2006), Corporate Finance, 2nd
edition,
Thomson Learning, New York.
Stanley, M., and S. Block (1984), "A Survey of Multinational Capital Budgeting", Financial
Review, Vol. 19 (1), pp. 36-54.
Tell, B. (1978), Investeringsbedömning i praktiken, Studentlitteratur, Lund.
Truong, G., Partington, G., and Peat, M. (2008), “Cost-of-capital estimation and capital-
budgeting practice in Australia”, Australian Journal of Management, Vol. 33 (1), pp. 95-122.
Tzovas, C. (2006), “Factors influencing a firm’s accounting policy decisions when tax
accounting and financial accounting coincide”, Managerial Auditing Journal, Vol. 21 (4), pp.
372-386.
25
Verbeeten, F.H.M. (2006), “Do organizations adopt sophisticated capital budgeting practices
to deal with uncertainty in the investment decision? A research note”, Management
Accounting Research, Vol. 17 (1), pp. 106-120.
Warfield, T.D., Wild J.J. and Wild, K.L. (1995), “Managerial ownership, accounting choices,
and informativeness of earnings”, Journal of Accounting and Economics, Vol. 20 (1), pp. 61-
91.
Watts, R.L. and Zimmerman, J.L. (1990), “Positive Accounting Theory: A Ten Year
Perspective”, The Accounting Review, Vol. 65 (1), pp. 131-156.
Yard, S. (1987), Kalkyllogik och Kalkylkrav. Doctoral Thesis, Lund University Press, Lund.
26
Table 1: Capital budgeting methods, recommended or not by textbooks.
Method Recommended or not
a) Net present value (NPV) Recommended
b) Internal rate of return (IRR) Not recommended
c) Annuity Recommended
d) Earnings multiple (P/E) Not recommended
e) Adjusted present value (APV) Recommended
f) Pay-back Not recommended
g) Discounted pay-back Not recommended
h) Profitability index Recommended
i) Accounting rate of return Not recommended
j) Sensitivity analysis Recommended
k) Value-at-risk (VAR) Recommended
l) Real options Recommended

27
Table 2: Number and proportion of companies that used each capital budgeting
Method never or occasionally (0-2) vs frequently or always (3-4).
Capital budgeting method 0-2 % 3-4 %
(a) Net present value method 75 38.86% 118 61.14%
(b) IRR-method 135 69.95% 58 30.05%
(c) Annuity method 187 96.89% 6 3.11%
(d) Earnings multiple approach 139 72.02% 54 27.98%
(e) APV 180 93.26% 13 6.74%
(f) Pay-back method 88 45.60% 105 54.40%
(g) Discounted pay-back 160 82.90% 33 17.10%
(h) Profitability index 169 87.56% 24 12.44%
(i) Accounting rate of return 147 76.17% 46 23.83%
(j) Sensitivity analysis 106 54.92% 87 45.08%
(k) Value-at-risk 180 93.26% 13 6.74%
(l) Real options 189 97.93% 4 2,07%
28
Table 3. Mean values, standard deviations, and differences in mean values for the most
used capital budgeting methods in 2005 and 2008.
2005 2008
Dependent variable Mean Sd Mean Sd Difference
(a) Net present value (NPV) 2.50 1.38 2.55 1.38 0.05
(b) Internal rate of return (IRR) 1.57 1.58 1.27 1.45 -0.30***
(d) Earnings multiple 1.36 1.61 1.41 1.57 0.05
(f) Pay-back 2.39 1.41 2.20 1.47 -0.19
(g) Discounted pay-back 1.08 1.42 0.74 1.31 -0.34***
(h) Profitability index 0.69 1.26 0.72 1.20 0.03
(i) Accounting rate of return (ARR) 1.14 1.55 1.05 1.45 -0.10
(j) Sensitivity analysis 1.92 1.63 2.05 1.53 0.12
Note: *** indicates that the difference is statistically significant at the 1% level.

29
Table 4. Means, standard deviations, definitions and sources of independent variables.
Independent
variable Mean SD Definition and source
SIZE (millions) 13.1 31.8 Deflated revenues in SEK. Source: Datastream.
LEVERAGE 0.21 0.19 Total debt to total assets ratio. Source: Datastream.
DIVPAY 0.24 0.96 Dividend pay-out ratio. Dividend divided by net income.
Source: Datastream.
GROWTH 9.20 66.44 P/E ratio. Source: Datastream.
DMAN 0.40 0.49 Dummy taking the value one if the company could be
classified as manufacturing. Source: Datastream.
TARGET_DEBT 2.24 1.02 Whether the company had no (1) or a strict (4) target debt-
ratio. Source: Survey (question 9).
FSALES 3.30 0.98 The proportion of total sales that took place outside Sweden,
ranging from 0% (1) to > 50% (4). Source: Survey (question
12)
MAN_OWN 1.38 0.93 Share of the company that would be owned by the top three
officers if all options had been exercised, ranging from
< 5% (1) to > 20% (4). Source: Survey (question 12).
CEO_AGE
2.43
0.73
Age of the CEO ranging from < 40 years (1) to > 60 years (4).
Source: Survey (question 12).
CEO_EDUC
1.82
0.84
Dummy taking the value one if the CEO had a Masters in
Business and/or Economics. Source: Survey (question 12).
CEO_TENURE 1.61 0.75 Number of years the CEO had been CEO in the company,
ranging from < 4 year (1) to > 9 year (3). Source: Survey
(question 12).
DYEAR 0.46 0.50 Dummy, taking the value one in 2008, zero in 2005.
30
Table 5. Estimation results, t-values are calculated using heteroscedastic-robust (White) standard errors.
Variable (a) NPV (b) IRR (d) EM (f) PB (g) DPB (h) PI (i) ARR (j) SA
SIZE Coef. 0,00598** 0,00975*** 0,00261 0,00623* 0,00131 -0,00146 -0,00172 0,00742**
t-value 2.28 2.72 0.85 1.94 0.38 -0.75 -0.46 2.61
GROWTH Coef. 0,0033 0,0034** -0,0004 0,0010 0,0015 -0,0021*** 0,0016 0,0022
t-value 1.64 2.00 -0.27 1.06 1.12 -2.76 1.59 1.28
LEVERAGE Coef. 1,15* 1,52** -0,34 1,37** 0,59 -0,11 0,45 0,34
t-value 1.78 2.32 -0.48 2.16 0.89 -0.17 0.61 0.49
TARGET_DEBT Coef. 0,02 0,13 0,00 0,12 -0,06 0,16* 0,30** 0,11
t-value 0.17 1.12 0.04 1.06 -0.60 1.69 2.45 0.89
DIVPAY Coef. -0,12 -0,35*** -0,04 -0,01 -0,19 0,13* 0,05 -0,20*
t-value -1.13 -3.40 -0.24 -0.15 -1.08 1.73 0.41 -1.88
FSALES Coef. 0,06 0,06 -0,05 0,18 0,30 -0,27** -0,09 0,20
t-value 0.54 0.49 -0.32 1.41 0.28 -2.16 -0.70 1.41
MAN_OWN Coef. -0,03 -0,04 -0,24 -0,06 -0,11 0,03 -0,26** -0,33**
t-value -0.18 -0.25 -1.59 -0.45 -0.76 0.30 -2.16 -2.04
CEO_EDUC Coef. 0,01 0,36** 0,22 0,17 0,29** -0,09 0,17 0,25
t-value 0.08 2.34 1.28 1.04 2.14 -0.46 1.09 1.42
CEO_AGE Coef. -0,04 -0,04 -0,13 -0,13 0,11 -0,05 0,34* -0,32*
t-value -0.22 -0.22 -0.63 -0.79 0.67 -0.32 1.95 -1.68
CEO_TENURE Coef. -0,07 0,25 0,05 0,11 0,08 -0,10 -0,13 0,33*
t-value -0.37 1.43 0.25 0.63 0.49 -0.72 -0.80 1.78
DMAN Coef. -0,18 0,25 -0,47* 0,14 0,25 -0,47** -0,13 -0,14
t-value -0.73 1.08 -1.69 0.59 1.11 -2.37 -0.59 -0.51
DYEAR Coef. -0,13 -0,82*** -0,31 -0,41 -0,64*** -0,05 -0,23 -0,33
t-value -0.54 -3.23 -1.08 -1.55 -2.77 -0.24 -0.91 -1.18
CONSTANT Coef. 2,38*** 0,14 2,16** 1,154 0,32 1,88 0,28 1,52*
t-value 3.61 0.17 2.43 1.56 0.50 3.07 0.38 1.80
31
Figure 1. The total stated use of capital budgeting techniques in Swedish
companies compared to companies in the US and Continental Europe.
Figure 2. The stated use of different capital budgeting techniques in Swedish companies
compared to companies in the US and Continental Europe.
0% 10% 20% 30% 40% 50% 60% 70% 80%
SWE 2005 + 2008 (287%)
US (413%)
UK (388%)
Netherlands (360%)
Germany (321%)
France (308%)
0%
50%
100%
150%
200%
250%
300%
350%
400%
450% NPV-method
Pay back-method
Sensitivity analysis
IRR-method
P/E-method
Accounting ratios
Discounted pay back
Profitability index
APV
Value-at-risk
Real options

32
Appendix 1
The questionnaire Instruktioner: 1) Enkäten kretsar kring investerings- och finansieringsfrågor som beslutas på lednings- eller
styrelsenivå i moderbolaget/koncernen. Detta ”top management”-perspektiv innebär att enkätfrågorna inte gäller
små rutinbeslut. 2) När frågor ställs om investeringar nedan åsyftas såväl materiella (tex byggnader) och
immateriella (tex FoU) som finansiella investeringar (tex företagsförvärv). Frågorna som rör investeringar
handlar om alla icke-rutinmässiga investeringar som beslutas om på lednings eller styrelsenivå i
moderbolaget/koncernen.
OBS: Fyll nedan i en (1) ruta per rad
1. Hur ofta använder ert företag nedanstående metod/er när beslut fattas rörande vilka investeringar som ska
genomföras. Som stöd hittar ni den engelska versionen inom parantes.
Aldrig Alltid Aldrig Alltid
0 1 2 3 4 0 1 2 3 4
a) Nuvärde-metoden (Net Present Value) h) Lönsamhetsindex/kvotmått (Profitability index)
b) Internränte-metoden (Internal Rate of Return) i) Redovisningsmässig avkastning (Accounting Rate of Return) c) Annuitetsmetoden (Annuity method) j) Känslighetsanalys (Sensitivity Analysis) d) Vinstmulitpel-metoden (Earnings multiple approach) k) Value at Risk (Value at Risk)
e) Justerat nuvärde-metoden (Adjusted Present Value) l) Vi inkluderar “reala optioner” (Real Options) hos en f) Återbetalningstid (Pay back period) investering när vi utvärderar den g) Diskonterad återbetalningstid (Discounted payback m) Annan/andra metod/er; nämligen:
period)
2. Hur ofta använder ert företag nedanstående diskonteringsränta/räntor när nya investeringar ska genomföras
utomlands? När vi räknar på projekt som ska genomföras utomlands så använder vi…
Aldrig Alltid Aldrig Alltid
0 1 2 3 4 0 1 2 3 4
a) en diskonteringsränta som normalt används för d) en diskonteringsränta som är specifik såväl för det land där investeringar i Sverige projektet ska genomföras som för det speciella affärsområdet
b) en diskonteringsränta som är specifik för det land där e) en specifik diskonteringsränta för varje kassaflödeskompo-
projektet ska genomföras nent som har en egen riskexponering c) en affärsområdesspecifik diskonteringsränta som f) annan/andra diskonteringsränta/or; nämligen:
används för liknande inhemska (svenska) projekt
3. Estimeras kostnaden för eget kapital i ert företag? Ja Nej (Om ”NEJ”, gå direkt till fråga 4). Om ”JA”; hur
estimeras kostnaden för eget kapital i ert företag?
Aldrig Alltid Aldrig Alltid
0 1 2 3 4 0 1 2 3 4
a) Med genomsnittlig historisk avkastning på d) Vad våra investerare säger till oss att de kräver i avkastning företagets aktie bestämmer kostnaden för eget kapital
b) Med Capital Asset Pricing Model (CAPM) e) Genom (politiska) beslut där avkastningskravet regleras
c) Med CAPM plus några extra riskfaktorer f) Kostnaden för eget kapital härleds ur följande ekvation:
Pris = Utdelning / (kostnad eget kapital – tillväxt)
g) Annan/andra metod/er; nämligen:
4. När ni i ert företag beräknar en investerings värde, justerar ni diskonteringsräntan och/eller kassaflödena för
följande riskfaktorer?
VI JUSTERAR VI JUSTERAR diskon- kassa- båda ingen diskon- kassa- båda ingen terings- flöden terings- flöden ränta ränta
a) Risk för oväntad inflation f) Valutarisk
b) Ränterisk (förändring i den generella g) Konkursrisk (sannolikhet för konkurs)
räntenivån) h) Storlek (mindre företag är mer riskfyllda)
c) BNP eller konjunkturrisk i) Marknadsvärde i förhållande till bokfört värde
d) ”Term structure risk” (förändring i den långa (=marknadsvärde på totalt eget kapital + totala skulder
räntan i förhållande till den korta räntan) dividerat med bokfört värde på totala tillgångar) e) Råvaruprisrisk j) Aktiens (aktieprisets) utveckling den senaste tiden
k) Annan/andra faktor/er; nämligen

33
5. Vilka faktorer påverkar ert företags val mellan kort- och långfristiga skulder?
Mycket Mycket Ej viktigt viktigt Ej viktigt viktigt 0 1 2 3 4 0 1 2 3 4
a) Vi använder kortfristiga skulder när korta räntor är låga e) Vi förväntar oss förbättrad kreditvärdighet (högre rating);
där- jämfört med långa räntor för lånar vi kortfristigt till dess att vi får högre kreditvärdighet
b) Vi matchar löptiden på våra skulder med livslängden f) Låna kortfristigt minskar sannolikheten att vårt företag vill ta
på våra tillgångar på sig riskfyllda projekt c) Vi använder kortfristiga skulder när vi förväntar oss att g) Vi använder långfristiga skulder för att minimera risken
långa räntor skall falla att behöva ta upp nya lån under dåliga tider
d) Vi lånar kortfristigt så att avkastningen från investering- h) Annan/andra faktorer; nämligen: ar kommer aktieägarna till del istället för att förplikta oss att använda framtida vinster till att betala räntor till kreditgivarna
6. Har ert företag övervägt att ta lån (alternativt emittera obligationer) utomlands? Ja Nej (Om ”NEJ”, gå
direkt till fråga 7). Om ”JA”; vilka faktorer påverkar ett sådant beslut?
Mycket Mycket Ej viktigt viktigt Ej viktigt viktigt 0 1 2 3 4 0 1 2 3 4
a) Fördelaktig skattekonsekvens jämfört med Sverige, d) Utländska regleringar kräver att vi upptar skulder utomlands
dvs olika bolagsskattesatser e) Utländska räntenivåer kan vara lägre än svenska
räntenivåer b) Att kapitalanskaffningen ”source of funds” hålls nära f) Annan/andra faktorer; nämligen:
kapitalanvändningen ”use of funds” c) För att ge en ”naturlig hedge” (ex; om den utländska
valutan deprecierar slipper vi betala ränta i svenska kronor)
7. Har ert företag övervägt att ge ut konvertibla skuldebrev? Ja Nej (Om ”NEJ”, gå direkt till fråga 8). Om
”JA”; vilka faktorer påverkar ert företags beslut angående detta?
Mycket Mycket Ej viktigt viktigt Ej viktigt viktigt 0 1 2 3 4 0 1 2 3 4
a) Konvertibler ger möjlighet att emittera aktier fördröjt e) Vi vill undvika kortsiktig utspädning av eget kapital
till låg kostnad f) Vår aktie är för närvarande undervärderad
b) Konvertibler skyddar kreditgivare mot oönskat g) Med konvertibler går det att kräva lösen (konvertering)
beteende från ledning eller aktieägare av konvertiblerna om/när vi behöver c) Konvertibler har lägre kostnad än vanliga skulder h) För att locka investerare som är osäker på risknivån i vårt d) Andra företag i vår bransch använder konvertibler företag
framgångsrikt i) Annan/andra faktorer; nämligen:
8. Har ert företag övervägt en nyemission av aktier? Ja Nej (Om ”NEJ”, gå direkt till fråga 9). Om ”JA”; vilka
faktorer påverkar ditt företags beslut om att emittera aktier?
Mycket Mycket Ej viktigt viktigt Ej viktigt viktigt 0 1 2 3 4 0 1 2 3 4
a) Om aktiekursen stigit den senaste tiden, är priset vi h) Aktieemissioner ger investerare positivare uppfattning om
fö- kan emittera till ”högt” retagets framtidsprospekt än när vi lånar/emitterar
obligationer
b) Aktier är vår ”minst riskfyllda” kapitalkälla i) Våra investerares skattesats på reavinst (relativt skatte-
c) För att motivera personalen i bonus/optionsprogram satsen på utdelning) påverkar benägenheten att emittera aktier
d) Aktier är vår billigaste kapitalkälla j) Urholkning/utspädning av vissa aktieägares röstinflytande e) Vi emitterar aktier för att hålla målet att ha soliditeten k) Graden av marknadens undervärdering eller övervärdering
(eller om man så vill skuldsättningraden) på en viss nivå av aktien påverkar benägenheten att emittera aktier att behöva ta upp nya lån under dåliga tider
f) Vi emitterar aktier för att ha en lika stor egetkapital- l) Oförmåga att erhålla tillräcklig finansiering via lån, andel som andra företag i vår bransch konvertibler eller andra skuldformer
g) Huruvida vår vinst senaste tiden har varit tillräcklig m) Utspädning av vinst per aktie för att finansiera våra aktiviteter, påverkar vår benäg- i) Annan/andra faktorer; nämligen:
enhet att emittera aktier
9. Har ert företag ett mål för soliditeten (eller om man så vill skuldsättningsgraden)? Fyll i ett av alternativen.
nej, inget mål
Ja, ett flexibelt mål (=målet är att soliditeten/skuldsättningsgraden ska hålla sig inom ett relativt brett intervall)

34
Ja, ett ganska strikt mål (=målet är att soliditeten/skuldsättningsgraden ska hålla sig inom ett relativt snävt intervall)
Ja, ett strikt mål (=målet är att soliditeten/skuldsättningsgraden ska ligga på, eller väldigt nära, en viss procentsats)
10. Vilka faktorer påverkar hur ni i ert företag väljer lämplig nivå på skulderna?
Mycket Mycket Ej viktigt viktigt Ej viktigt viktigt 0 1 2 3 4 0 1 2 3 4
a) Skattefördelen med avdragsgill ränta i) Vi begränsar skulderna så att våra kunder/leverantörer
b) Olika typer av kostnader som uppstår i samband inte oroar sig för att vi skall gå i konkurs med att konkurs inträffar eller riskerar att inträffa j) Vi försöker ha tillräckligt med skulder så att vi inte är
c) Skuldsättningsgraden hos andra företag i vår bransch attraktiva för uppköp d) Vår kreditrating (bedömd av ratinginstitut) k) Om vi ökar skulderna vet våra konkurrenter att vi sannolikt e) Transaktionskostnader och avgifter för att ta nya lån inte minskar output
eller emittera skuldebrev l) Hög skuldsättningsgrad underlättar i förhandling med fack-
f) Den personliga skattekostnad som våra investerare föreningar/personal
(=långivarna, eller de som köper obligationer) får m) För att säkerställa att högsta ledningen arbetar hårt och
bära när de erhåller ränteinkomster från oss effektivt, ser vi till att hålla tillräckligt hög skuldsättningsgrad
g) Finansiell flexibilitet (vi håller nere skulderna så vi har (vid en ”tillräckligt hög” skuldsättningsgrad är en stor del av
tillräckliga interna medel tillgängliga för att kunna kassaflödena låsta till räntebetalningar)
genomföra nya projekt när de dyker upp) n) Vi begränsar låneandelen så att vinsterna från nya/framtida
h) Volatiliteten i vår vinst och våra kassaflöden projekt kan fångas fullt ut av aktieägarna istället för att
betalas ut som ränta till kreditgivarna
o) Annan/andra faktorer; nämligen:
11. Vilka andra faktorer påverkar ert företags lånepolicy?
Mycket Mycket Ej viktigt viktigt Ej viktigt viktigt 0 1 2 3 4 0 1 2 3 4
a) Vi lånar/emitterar obligationer när vår senaste vinstut- e) Vi dröjer med att låna/emittera obligationer på grund av veckling (operativt kassaflöde) inte är tillräckligt för att transaktionskostnader och avgifter finansiera våra aktiviteter f) Vi dröjer med återbetalning av skulder på grund av
b) Användande av skulder ger investerarna en positivare återfinansieringskostnader och avgifter
uppfattning om företagets framtid än om aktier emitteras g) Förändring i aktiekursen c) Vi lånar/emitterar obligationer när räntenivåerna är h) Vi ökar skulderna när vi har samlat på oss rejäla vinster
särskilt låga i ) Annan/andra faktorer; nämligen: d) Vi lånar/emitterar obligationer när vår aktie är under-
värderad av marknaden
12. Var vänlig att efter bästa förmåga nedan fylla i en ruta för varje kategori som bäst beskriver ert företag.
Andel av företagets Om alla optioner löstes, hur stor kapital- VD:s akademiska Annan akademisk VD:s ålder Hur länge VD har
totala försäljning som andel av aktierna (ej röstandel) skulle då examen i ekonomi examen som VD har < 40 år suttit på sin VD-stol
sker utanför Sverige totalt ägas av företagets tre högsta chefer? < Kandidatexamen < Kandidatexamen 40-49 år i detta företag
0% < 5% Kandidatexamen Kandidatexamen 50-59 år < 4 år
1-24% 5-10% Magisterexamen Magisterexamen > 60 år 4-9 år
24-49% 10-20% Licentiatexamen Licentiatexamen > 9 år
> 50% > 20% Doktorsexamen Doktorsexamen
TACK SÅ MYCKET för att ni har fyllt i
denna enkät! Den ifyllda enkäten skickar ni till oss med det bifogade frankerade kuvertet senast måndagen den 16:e JUNI.
35
Appendix 2
Table A1. Non-response analysis. Probit regression.
Dependent variable equals one if the company responded
to the surevey, otherwise zero.
Independent variable Estimate
z-
value
SIZE 6.66e-09** 2.78
LEVERAGE -0.00092 -0.31
DIVPAY -0.00029 -0.57
GROWTH 0.00047 0.54
DMAN 0.014 0.12
Pseudo R2
0.02
Number of obs. 493
***=significant at the 1% level,
**=significant at the 5% level,
*=significant at the 1% level.

36
Appendix 3 Table A2. Pearson correlation coefficients of independent variables used in the empirical analysis.
SIZE LEVERAGE GROWTH TARGET_DEBT MAN_OWN CEOEDUC CEOAGE CEOTENURE DMAN DIVPAY FSALES
DYEAR
SIZE
1
LEVERAGE
0,058 1
GROWTH 0,026 0,026 1
TARGET_DEBT
-0,038 0,240*** 0,197*** 1
MAN_OWN -0,161** 0,023 -0,049 -0,122 1
CEOEDUC 0,002 0,077 -0,037 -0,060 0,040 1
CEOAGE 0,210*** -0,003 0,054 -0,016 0,113 -0,228*** 1
CEOTENURE -0,006 0,105 -0,064 -0,035 0,426*** -0,150** 0,277*** 1
DMAN 0,112 0,028 0,014 -0,099 -0,048 -0,053 -0,074 0,098 1
DIVPAY 0,165** 0,046 0,321 0,089 -0,111 0,065 0,045 0,007 0,058 1
FSALES 0,166 -0,0125 -0,149 -0,129* 0,001 -0,095 0,020 0,118 0,378***
0,026
1
DYEAR
0,090 0,086 -0,073 -0,002 -0,010 0,480*** -0,118 -0,061 0,035 0,037
-0,111
1
***=significant at the 1% level, **=significant at the 5% level, *=significant at the 1% level.

37