what determines services tfp growth: services trade … der marel.pdf · what determines services...
TRANSCRIPT

What Determines Services TFP Growth:
Services Trade or Services-Trade Regulation?
Erik van der Marel* Groupe d’Économie Mondiale
Department of Economics Sciences Po Paris
This draft: May 1, 2010
Abstract
What determines services TFP: Is it services trade or services-trade regulation? To respond to this question I use four indicators of international trade in services since 1990 to 2005 – namely FDI inward stock, services imports, domestic sales of foreign affiliates (FATS) and FDI inflows – to examine what type of services trade directly affects services TFP. Such analysis is done both for the level and growth rate of TFP for each of the 14 selected services sectors. Subsequently, I analyze what type of trade-related regulation with respect to each indicator of services trade has played an inhibiting effect on both the level and growth of services TFP. Contrary to economy-wide indicators of regulation that are often used, I examine this question by using sector-specific regulation that could have an effect on services trade directly. Such analysis contrasts with former studies in which mainly factor intensities are used to explain services TFP growth. My conclusions are that services trade has a direct effect on the level of services TFP, but this effect is inhibited as soon as the regulatory variables are included. Entry regulation, regulation “behind the border” and FDI restrictions then become negative determinants of the level of services TFP. As for services TFP growth, I find that not trade but services regulation again forms a significant negative determinant and that this effect is more pronounced for services sectors that are more distant from the technology frontier. Contrary to these findings, restrictions that target Mode 3 trade, i.e. FDI, seem to have a larger effect for services sectors that are closer to the technology frontier – presumably because spill-over effects from high-skilled labor are hindered to create higher TFP growth.
* Research fellow at the Groupe d’Economie Mondiale at Sciences Po Paris. Please send comments to
[email protected]. The author wishes to thank Bernard Hoekman, Patrick Messerlin, Aaditya Mattoo, Ben Shepherd and Sébastien Miroudot for very valuable comments and suggestions when writing this paper. Furthermore, the author wishes to thank Stephen Golub for sharing data.
2
1 Introduction
It’s a stylized fact of economic development that the share of services in GDP and
employment rises as per capita income increases. Today services represent the biggest share of the developed OECD economies, around 70 to 75 per cent of their national GDP. At the same time services are being considered as the major driver of overall productivity growth.1 Productivity growth differences in services across countries mirrors to a great extent aggregate growth differences. Multi-factor productivity (TFP) in services is shown to be an essential factor in explaining these productivity growth differences across countries.2 This marks services sectors and their TFP growth as a central element in the development of a national economy.
It is therefore important to know the sources of TFP growth differences in services across
countries. Generally one favors the conclusion that factor intensities, such as ICT investments are the major determinants to explain TFP growth difference. Many services today have experienced a concentration of ICT in their production process which would have increased TFP growth.3 A second often mentioned factor is the growth share of high-skilled labor that would stimulate technological innovation as opposed to imitation. (Vandenbussche, J., P. Aghion and C. Meghir (2006). In a recent study by Inklaar, Timmer and Ark (2008) these factors, however, cannot sufficiently explain TFP growth across countries as shown in various econometrical works. There is, however, minor support for other factors such as entry-barriers although the results are not very clear-cut.
Other factors may thus play a decisive role in explaining TFP growth differences in services.
First, trade may form a channel to transmit efficiency forces, and hence be a major explanatory variable for services TFP growth. Trade conveys factors that include changes in returns to scale, increased competitive pressure, a lower use of inputs, organizational transformations and management innovations brought in by foreign companies.4 Such a link might even be more important for services than for goods: the delivery which requires simultaneous production and consumption and non-storability constitutes the competitive element for a service in which the aforementioned efficiency factors are more intensively exercised than in producing goods.
However, services are to a great extent inhibited by domestic regulation through various modes
of supply affecting international trade in services and eventually a higher productivity. Therefore,
services-trade related regulation inhibiting international transactions could constitute a second source to explain TFP. In order to distinguish between economy-wide regulation and regulation specifically targeted to services, this study takes the sectoral trade-related regulatory measures,
1 For lowest-income countries services to GDP is substantially lower, around 35 percent of their national GDP, but still considerate. Standard explanations of the services to GDP ratio revolve around both demand and supply side factors. See e.g. Baumol (1967), Fuchs (1968, 1981), Kravis, Heston and Summers (1983), Inman (1985) and Francois and Reinert (1996).
2 See van Ark, Inklaar and McGuckin, (2003), Blanchard (2004) and van Ark, Timmer and Inklaar (2008). 3 However, the increase of productivity growth in general due to increased use of IT could also have only a temporarily nature
as suggested by Gordon (2002). 4 See Financial Times (2009) for an example in postal communication services.
3
such as entry regulation and regulation behind the border, as well as specific regulations targeted to commercial presence of foreign firms, mode 3 trade. In sum, the question in this paper is to what extent TFP growth in services is determined by international services trade or by services
trade-related regulation, next to factor accumulation. The link between services trade and productivity is particularly important as it is supposed that
personal services such as health and education show a productivity lag as a consequence of their unfeasibility to substitute labor for other more productive factors of production. If trade and/ or trade-related regulation directly affect the sectors’ TFP growth rate, one would expect large gains from the tradability and deregulation of these personal services sectors.5
This paper shows that not trade but regulation is the main significant determinant of services
TFP, both for the level and growth – even corrected for endogeneity. Furthermore, I find that that the effect of entry regulation and regulation behind the border on TFP growth is more pronounced for services sectors that are more distant from the technology frontier.6 However, restrictions in mode 3 trade seem to play a larger effect for services sectors that are closer to the technology frontier – most likely because spill-over effects from high-skilled labor would be held up to create higher TFP growth. This last hypothesis is strongly confirmed when FDI restrictions are interacted with the growth share of high-skilled labor in services.
The paper is structured as follows. The next section provides a literature overview of the
productivity issues in services together with some descriptive productivity statistics. Section 3 describes the data sources and explanations together with their limitations for the econometrical specification. Section 4 and 5 presents the estimation results for trade and regulation respectively. Finally, section 6 offers concluding remarks.
2 Productivity and Services
2.1 Services and their “Perceived” Productivity Problem There has been a long-standing concern about a perceived trade-off between the size of the
services sector within an economy and the level of productivity because services suffer from an perceived productivity lag (Baumol and Bowen, 1966; Baumol, 1976)7. This so-called Baumol disease implies that the production process of services is more costly relative to the
5 However, when analyzing TFP one should be careful for intermediate input use since manufacturing and most business services as opposed to personal services use a higher share of inputs, which necessarily increases TFP. The quality of a service provided is not easy to measure, but may have improved considerably for personal services and therefore have affected their productivity. See, for instance, Berndt et. al. (1998) for the quality improvement in health care sector. Furthermore, one may wonder whether therefore TFP is the relevant variable when dealing with services that are essentially about labor productivity and the quality of labor, i.e. the quality of the service provided.
6 Technology frontier is calculated here as those services sectors that experiences relatively higher TFP than a chosen
benchmark, i.e. the US. This concept is based on Inklaar, Timmer and van Ark (2008). See data description in the annex for further details.
7 See for recent empirical contributions Nordhaus (2006) and Hartwig (2008).
4
manufacturing sector, which causes them to experience a lower output and higher prices in the long run. These costs would stem from the difficulty of substituting labor into more productive factors of production compared to manufacturing where wages are tied to their productivity. The
limited scope for labor productivity improvements causes services to represent an ever growing part of the economy. This eventually results in an decreasing overall economic growth.
Many services perform an intermediary role in the production process. Francois (1990a) notes
that the growth of these services sectors is an important determinant of facilitating overall economic growth and development because they allow specialization to occur.8 A growing firm leads to specialization of tasks, which in turn means that more factors are devoted to organize and coordinate the firm’s activities. This leads to an increase of the firm’s productivity. These “unproductive” coordinating activities play a separate role in the production processes to generate more differentiated goods or services and to realize scale economies. The associated organizational innovations and growing coordination (network) services yields productivity gains that should affect economy-wide growth performance (Hoekman and Francois, 2008). In addition to these reallocation forces, services also form a mechanism to diffuse knowledge and spill-overs, creating innovative production and organizational techniques within firms that would in turn allow for even further productivity increase.
The diversity of services characteristics may help explain their differing rate of productivity.
Even if one looks within the category of business services (a sector that is half the size of the whole manufacturing sector), large TFP growth differences remain observable. For instance, the nature of a telecommunication service is different than a transport service. The former has experienced a fundamental change in efficiency due to ICT investments whilst the latter is much less receptive to such innovation. This is perhaps best shown by Triplett and Bosworth (2004)
who demonstrate that both labor productivity and TFP for several US services have been growing – notably in financial and distribution services. However, the authors conclude that next to these ICT developments, TFP growth may actually be due to the use of managerial innovations and new concepts of doing business.
2.3 Services Productivity: Does Services Trade Play a Role?
Intuitively, one would expect that the expansion of services trade in the last two decades should have played at least a role in the reallocation forces of specialization due to competition or the transmission of knowledge and ideas in services that foreign firms bring in.
8 See also Burgess and Venables (2004) on the importance of a variety of services “inputs” that support specialization, creation and diffusion of knowledge, and exchange.
5
An early strand of literature deals with the link between services trade and productivity in the manufacturing sectors.9 In a case study Arnold, Javorcik and Mattoo (2007) find that the performance of domestic manufacturing firms relying on services inputs in the Czech Republic is
much associated with FDI ( a proxy for mode 3 trade) in services.10 They conclude that the establishment of foreign services firms is a very strong and robust variable for explaining the level of TFP in domestic firms in downstream manufacturing sectors.11 Francois and Woerz (2008) particularly examine the role of services as inputs to manufacturing and the latter’s pattern of exports. One important result they find is the significant and strong positive effect from increased services business openness in the form of services trade and FDI flows in skill and technology intensive industries. They further find that such positive link would stem from off-shoring of business services, which promotes the competitiveness of these higher-end services industries.
A subsequent question arises whether openness also affect the performance of domestic services sectors as opposed to only manufacturing sector. In this respect, some sector-specific studies particularly support the link between services productivity and domestic services openness. Fink, Mattoo and Rathindran (2003) have analyzed the impact of specific policy changes during the process when telecommunications became less state-supplied. They find that both privatization and creating domestic competition leads to significant improvements in labor productivity. Furthermore, a case study by Cammins and Rubio-Misas (2006) show significant growth in TFP for the Spanish insurance industry during the 1990s after the introduction of an EU insurance Directive. This productivity growth was largely due to domestic firm-growth through M&A that took place within Spain, rather than to “managerial attention on cost-minimization” or “through technical improvements”, which could also be brought in by foreign firms.
Next to these domestic reallocation effects, international trade may play as much an important
role in determining TFP. This channel of TFP corresponds to how factors such as skills and ICT
9 Major new evidence for gains from trade through access to new imported inputs rather than existing ones for manufacturing firms has recently been provided by Goldberg, Khandelwal, Pavcnik and Topalova (2009). The authors show that through input import liberalization the range of products manufactured by the firm increases, which is an important component of TFP. Within the broader literature on trade liberalization and productivity changes, this study is placed next to Melitz (2003) and Pavcnik (2002) that put forward evidence of productivity improvements stemming from reallocation effects due to output tariff liberalization. As noted in the previous section, the empirical part of this paper focuses on the effects of services imports on the services sectors themselves whilst considering services either as further inputs to other manufacturing or services production or as final-end consumer services. Recent empirical work that focus on the link between trade liberalization and TFP is given by e.g. Kasahara and Rodrigue (2008) and Amiti and Konings (2007). The fact that Goldberg, Khandelwal, Pavcnik and Topalova (2009) do not use TFP is much related to identification problems of a clear link between trade liberalization and using firm’s revenue to calculate TFP when using firm-level data.
10 A related paper from Eschenbach and Hoekman (2006) assesses the positive link at the aggregate level between the level of services liberalisation and economic growth (and thus implicitly productivity) for transition economies for the period 1990-2004. Furthermore, Mattoo, Rathindran and Subramanian (2006) provide evidence that openness in the financial and telecommunications sectors influences long-run growth performance using a sample of 60 countries over the 1990-1999 period.
11 Also, developing country-specific studies analyzing the link between services liberalization and manufacturing firm productivity. Arnold, Mattoo and Narciso (2006) found evidence for a positive and significant link between African manufacturing firms and their access to and performance in communications, electricity and financial services. Arnold, Javorcik, Lipscomb and Mattoo (2008) found similar evidence for banking, telecommunication and transport services liberalization reforms on Indian manufacturing firms for the period 1993-2005.

6
are utilized and exploited, such as the efficient operation of returns to scale, lower use of foreign input after receiving foreign investment, or organization transformations and management innovations brought in by foreign companies.12 International trade as a transmitter of efficiency-
enhancing ideas, skills and ICT would then turn into a determinant of TFP growth. In contrast to goods the nature of services may require these measures more intensively, mainly stemming from their features of joint consumption and production and non-storability, precisely because of their skill intensity. The competitive element of services centers on its delivery, which in turn is to a great extent associated with more advanced activities that deal with coordination, organization and network management. TFP gains in services would then spring from how efficiently these activities are exploited with help from high-skilled labor or ICT investments through international trade.
However, as noted in Hoekman and Mattoo (2008), Francois and Hoekman (2009), Nicoletti
(2001) and Nicoletti and Scarpetta (2003), insofar most countries are similar in regard to openness to foreign competition, regulatory policies in services trade that segments markets may become a major determinant of diverging productivity performance. What’s important here is to know whether sector-specific trade-related regulation inhibits the growth of TFP. The work of Inklaar, Timmer and van Ark (2008) partly deal with this question and find that entry barriers are, however, only to some extent negatively associated with services TFP growth.13
3 Descriptive Statistics on Services Productivity
Data from the EUKlems should shed some light on simple productivity statistics. This database has a TFP measure that is calculated by subtracting the cost-share weighed share in
hours worked by different types of high, low and medium skilled workers, different types of capital (ICT or non-ICT) and corrects for intermediate inputs use from the share of gross output at constant prices.14 Analyzing simple output-based TFP levels in index form for services for 20 countries staring in 1990 shows large differences between countries for business services.15 High increases of TFP level are visible for Korea, Hungary, Finland and the UK whereas Australia France and Germany show moderate increase. Others show a decrease.
12 As explained in Inklaar, Timmer en Ark (2008), Hulten, (2001) the level and growth of TFP can be caused by several factors. Under the neo-classical framework it strictly includes technological change and innovation, but several other important factors might comprise TFP such as organizational and institutional change and newly developed managerial innovations, plus chances in returns to scale. TFP also includes the effects from unmeasured inputs, such as research and development and other intangible assets.12 Lastly, industry level TFP also reflects increased competitive market pressures that eventually measures a higher output through for example liberalization or a lower input use through privatization of public firms.
13 The possibility of foreign services firms as a channel of technology diffusion and other positive dynamic effects from trade liberalization and regulatory reform has been documented by Nielson and Taglioni (2003). It supports the idea that this would increase the efficiency and competitiveness of the domestic economy. However, their focus is mainly on the manufacturing.
14 Details of this database and how TFP is calculated can be seen in appendix A. TFP calculation in the EUKlems database is according to calculations explained by Timmer, O’Mahony and Ark (2008). The EUKlems database shows a combination of 2-digit and 3-digit sectors. This descriptive section concentrates on the unweighted averages of the 3-digit sector levels.
15 Slovenia is excluded in this section. Indexes that show TFP level developments starting in a later year are according to their data availability in the EUKlems database.

7
Figure 1: TFP annual average growth rate for 16 OECD countries. -.
50
.51
1.5
annu
al a
vera
ge g
row
th r
ate
TFP average growth rate (1990-2005) per category
Manufacturing Busines sservicesPersonal services
-.5
0.5
11.
52
annu
al a
vera
ge g
row
th r
ate
TFP average growth rate (1995-2005) per category
Manufacturing BusinessservicesPersonal services
Source: Author’s calculations based on EUKlems data.
The trend of productivity levels are reflected in their growth rate. The figures presented in Figure 1 in the text above gives the annual average growth rate in TFP for manufacturing, business services and personal services for both from 1990-2005 and 1995-2005.16 It clearly shows that manufacturing has experienced high TFP growth of around 1.5 per cent, but this is mere a reference to the services categories. Business services have on average experiences positive TFP growth since 1990 of around 0.7 per cent. This would confirm the notion that despite the lower growth rate of services compared to manufacturing, they can still be seen as direct contributors to overall economic growth. This is opposed to the view that services could only provide an indirect contribution to the overall productivity growth through their input use in the manufacturing sector, even when their productivity growth is stagnant.
Figure 1 furthermore clearly shows that the personal services are the great laggards. Their
annual average growth rate is far lower than the business services sectors. For many countries these services sectors show a negative trend and when averaged they show a -0.5 per cent growth rate for both time periods. Similar conclusions are found in Eichengreen and Gupta (2009) in where the authors calculate an annual average growth rate of -0.5 to -1.0 for personal services using similar data source.
The differences in average TFP growth among manufacturing, business and personal services also become visible in extended cross-country analysis from 1995 to 2005. Figure 2 shows that productivity growth rate is positively associated with real output growth and negatively associated with the price index growth, as economic theory predicts. The graph reveals
furthermore that within both business services and manufacturing a linear relationship is
16 Business services in this figure include Hotels and Restaurants, which might have reduced the annual average growth rate for the business sector. Extra countries for time period 1995-2005 include Czech Republic, Hungary, Ireland, Portugal and Slovenia. Furthermore, Authors of the EUKlems database (Timmer, Inklaar en Ark, 2008) mention that figures for these “non-market” services should be considered with care. TFP data in business services are considered to be reliable.

8
observable whilst that of personal services is not.17 It implies that some factors over the years have affected several business services sectors to experience a higher output with lower prices as a result of higher productivity growth. Unsurprisingly, the graphs also reveal that TFP growth for
personal services largely clusters around zero or becomes even negative. Figure 2: TFP and real output growth (1995-2005) annual averages
-10
010
2030
Real
out
put a
vera
ge
grow
th
-10 0 10 20 30TFP average growth
Manufacturing Business servicesPersonal services Fitted values
TFP and real output growth (1995-2005) per category
-20
-10
010
20P
rice
ave
rage
gro
wth
-10 0 10 20 30TFP average growth
Manufacturing Business servicesPersonal services Fitted values
TFP and Price growth (1995-2005) per category
Source: Author’s calculations with EUKlems data.
These figures, however, disguise some caveats and one should be careful interpreting them. A first issue is related to how one accounts for the use of intermediate inputs. Not surprisingly, the higher TFP growth is found in sectors that use a high level of intermediate inputs i.e. manufacturing, and the lower TFP growth decreases in sectors that use less intermediate inputs, such as health care and other personal services.18 In this regard, the interpretation of TFP for the personal sectors should be done with extreme care. In the empirical parts, these sectors will be left out, also because hardly any trade or regulatory variables are available for personal sectors.
4 Services Trade as a Determinant for Services Productivity?
This section asks the following empirical questions: First, how can services sectors themselves can experience higher TFP growth? Second, can this higher TFP growth come from the tradability of services? And third, could such causal link between trade and TFP be inhibited by services trade regulation? After the variable description, this section first provides some cross-sectoral patterns of the relationship between TFP, trade and regulation. Subsequently, the
econometrical specification of the panel analysis and detailed description of the data used are
17 See for further information van der Marel (2009) and similar relationships with panel data analysis 18 Although the EUKlems database states that it corrects the TFP measure for intermediate inputs by subtracting them from the
level of output, it remains unclear whether business services themselves are part of the inputs. Generally, only material inputs are usually taken into account. This difference is important as services use compared to the manufacturing a relatively much higher proportion of inputs from other services sectors.
9
presented along with the estimation results. Although this paper has so far largely focused on TFP growth, this empirical part of the paper deals with both the level and growth of TFP.
4.1 Data Description
Sectoral TFP data is taken from the EUKlems database.19 TFP is adjusted for the share of high-skill, mid-skilled and low-skilled labor and the amount of ICT services and intermediate input use, which is then a so-called “sophisticated” type of TFP according to the database, instead of a more crude measure. This is important as countries differ in their input use. TFP data in the EUKlems database is constructed on a value-added basis and output basis. Value added does only measure intermediate input use and might miss some of the features of the structure of commodity or services output (Nordhaus, 2006). Accordingly, this article uses output-based TFP.
Four indicators of services trade are taken, which are FDI inward stock, FDI inward flows,
services imports, and sales of foreign affiliates in the domestic economy, called FATS. Generally, the FDI data is taken as a proxy for mode 3 services trade. Whilst FATS is actually a better measure for this mode of trade, as it directly measures the imports through foreign commercial establishments, data is notoriously limited. Therefore, most studies take FDI to measure mode 3 services trade. However, both FDI and FATS will be used in this paper. Furthermore, services imports stand for trade through mode 1 and 2.
All trade data is taken from the OECD database. Both FDI inward stock data as well as
inflows have also been collected from the UNCTAD database. Yet, the OECD gives more observations and in greater detail and is therefore used in the empirical section below. The
countries for which we have services trade matches perfectly with the countries for which we have TFP data, but only encompasses developed OECD countries. This is not only due to trade data as TFP data and regulatory data is extremely difficult to obtain in harmonized form among countries. Trade is furthermore collected for the period 1990-2005,20 except FATS which starts from 1995.21 (See variable table and description for further details on the data).22
19 See annex for main explanations on the EUKlems database and its sector level specification. 20 Except for Czech Republic, Portugal, Slovenia and Ireland which shows data from 1995; Sweden which shows
data from 1993; and Luxembourg which shows data from 1992. FATS data starts in 1995. 21 Depending on the sectors, some data is missing for earlier years, but become better after 1993 for all four trade
variables – especially for FATS. 22 OECD data does not clearly distinguish between the service sectors Public Administration, Health and
Education. Trade data of Government services in the database is used for all three sectors, which might seem not in line with the TFP data for each personal sector and could perhaps give biased results. However, trade observations on these sectors are rather limited and this problem will be resolved in the robustness checks.

10
4.2 Cross-sectoral Patterns Trade as a transmitter of efficiency enhancing skills and ICT could be to some extent cross-
sectoral as skill and ICT can cross borders from one sector to another. Skills and investment in ICT would not specifically be tied to one sector as production factors are not only mobile across countries, but also across sectors. This is not necessarily the case, however, if there are large up-front investments to be made which is not uncommon for high-skilled labor (i.e. investments made in education and training). Because of these fixed costs, there is an element of being lock-in to a specific sector, which could eventually inhibit cross-sectoral movement (Copeland and Mattoo, 2008). On the other hand, one may expect a higher cross-sectoral mobility within more homogenous sectors, say between the insurance and banking sectors, or certain type of management skills that are rather generic and should not be specific to only one sector.
To verify this idea, I use cross-sectional data on the average TFP growth across all service
sectors against the sum of services imports (or the average FDI stock) cross all sectors in a specific year. Figure 2 in annex clearly shows that for most services trade indicators there is a positive relationship between services TFP growth and trade in services. However, for FATS this is not the case which can be due to the limited number of observations. Among the countries selected, those that have a higher growth rate in services trade generally also experience a higher growth rate in their overall services TFP. This positive relationship is offset by a negative effect stemming from the increase in services trade regulation on the TFP growth in services. A somewhat broad regulatory variable of barriers to trade and investment in figure 3 in the annex reveals a negative relationship. Other indicators such as entry barriers and conduct regulation also show that a decrease of these regulations is associated with a higher productivity growth across all services sectors in a particular economy.
4.3 Baseline Model Specifications for Panel Analysis The following sub-sections in this paper perform regression analyses of TFP in the services
sectors on the four indicators of international trade. This will be done in panel dimension for both the level and growth of TFP. Contrary to the previous analysis, the regressions include trade and FDI variables that are sector-specific. The baseline specification dictates that each of the trade indicators are regressed separately so as to see what their individual marginal effect is on services TFP, although the trade variable are also taken together into a full model. To avoid omitted variable bias we include both the share of high-skilled labor and ICT capital as these variables observations differ per year in the panel.23 Taking into account the fixed effects for country, sector and year the following econometrical model will be estimated:
23 One caveat relating to these factor variables should be mentioned. The TFP variable in the EUKlems database is calculated on the basis of a growth accounting method that includes high-skilled labor and ICT capital. TFP in this case is a variable that is a residual once accounted for different factors of production. Yet, this problem may be partly solved by the use of growth rates, which is next to their levels. Following Inklaar, Timmer and van Ark (2008), however, this paper will treat these factor

11
TFP ijt = α + β1 Techgap ijt + β2 High-skill ijt + β3 High-Skill*Techgap ijt +
β4 ICT-Cap ijt + β5 ICT-Cap*Techgap ijt + β6 Trade ijt +
β7 Trade*Techgap ijt + γ i + δ j + θ t + ε ijt (4.1) where all variables in (Δ ln) when dealing with growth terms. TFP ijt denotes Total Factor
Productivity in either level or growth in country i, in services sector j, in year t. A convergence gap (Techgap) variable is only included in the regression when dealing with TFP growth, following standard practice in the growth literature. This variable controls for the fact that services sector further away from the technology frontier exhibit higher TFP growth as part of their catching up process. Both production factors high-skilled labor and ICT capital are also included as shares of total labor and capital respectively, and interacted with the technology gap. However, these variables are not of interest since these results have already been presented in Inklaar et al. (2008).
The key-parameters of interest are β6 and β7 , which represent respectively the direct effect of
services trade on TFP. For TFP growth, β7 which is the interaction of trade with the technology gap is positive when services trade has a larger effect on TFP growth for industries that are farther away from the technology frontier. If negative, it reflects that services trade has a larger effect on TFP growth for industries that are closer to the technology frontier.24 In the regression the trade indicators are taken separately and together. Furthermore, θt is the time fixed effects since we deal with panel data for 15 years, plus γ i and δ j are the fixed effects for both country and sector respectively. These last two fixed effects control for unobserved country and sector heterogeneity which may be correlated with one of the services trade indicators over time.
One difficulty when regressing the effect of trade on productivity is endogeneity. A reversed
causality for FDI is expected in so far foreign firms only invest internationally in those countries that already perform better. There is also substantial evidence that more productive firms are more likely to become importers. This is not only true for goods sectors (Bernard, Jensen, Redding and Schott, 2007), but also for services. Services importers are more productive and are more likely to experience foreign ownership or be part of a foreign multinational firm (Breinlich and Criscuolo, 2009). To correct for any possible endogeneity I apply a two-year lag on all trade variables in Table 10. However, the results do not change substantially when applying these lags compared to the regressions without any lags for both the level and growth of TFP.
The baseline regressions are first estimated for both the level (Table 9) and growth (Table 10)
of TFP without any interaction terms with the technology gap. As said, for the growth rate, a
variables as exogenous since they are merely included to avoid omitted variable bias. However, using the lag on these variables to avoid endogeneity issues does not change the outcomes in any significant way.
24 See annex for definition and explanatory note on the technology gap. Following Inklaar, Timmer and van Ark (2008) the US’ TFP is set as the overall benchmark and thus the technology frontier for all services sector. For instance, ountries that exhibit a lower degree of TFP relative to the US are thus though to lie behind the technology frontier.
12
technology gap is included whilst for the level this term is dropped. It becomes clear from Table 9 that especially a higher level of FDI instock and services imports cause a higher TFP level in services. Such conclusion however is not supported by using FATS, although a this trade
indicator plays a significant role when applying the full model as given in column 5. Surprisingly, however, FDI instock becomes negatively significant in this full model which may be because its correlated with FATS. For TFP growth none of the trade variables have a significant impact.
This insignificance of the trade variables on TFP growth remains so when the interaction
variables of the technology gap are included. There is, however, a small positive direct effect of FDI inward stock in column 5 of Table 11 when all trade variables are taken together. This seems to be more important for services industries closer to the technology frontier. By dong this the R-squared increases considerably. These results remain constant when applying cluster robustness checks by country, sector and year and even under a stricter form of endogeneity by applying country-sector pair fixed effects. However, doing this will also take away substantial variation in the data. Therefore I stick to country, sector and year fixed effects.25 The results furthermore show that both services imports and FATS have a positive sign as expected when applied individually.
5 Entry Barriers and Regulation “behind the border” More often than in goods sectors, services sectors are to a large extent affected by national
regulation whether on a discriminatory or non-discriminatory basis. This prevents foreign suppliers not only from entering domestic services markets, but may also deter foreign suppliers from undertaking any further investment activities once established in the market, i.e. so-called
regulation behind the border. Regulation appears in many forms that are not always trade-related but cover economy-wide factors such as involvement in business operations (state-control) or administrative burdens on entrepreneurship as opposed to explicit barriers to trade an investment.
In literature regulation is often linked to the quantity of trade so that more regulation in
services creates higher fixed or variable costs inhibiting exports or imports.26 Regulation is often proxied by taking economy-wide regulation covering all sectors which then shows a negative relationship on the volume on service trade. Frequently, this is done with in a gravity-type of framework (e.g. Francois, Fillat-Castejón and Woerz, 2008; Nicoletti et al., 2003a and 2003b; and Kox and Lejour, 2005). However, Kox and Nordas (2007) is a good example where sector-specific regulation has an effect on services trade, but only in finance.27
25 All regressions are also performed under country-sector pair fixed effect, plus taking the lag of two years on all trade variables. However, the main conclusions do not change, also when the regulatory variables are put into the regression. Results can be obtained from author.
26 See for the heterogeneity of regulation between countries that affects sunk costs Nordas and Kox (2009) . 27 However, as the authors state their results rather explain the correlations between regulation and trade instead of a clear causal
effect between the two variables. Furthermore, Schwellnus (2007) analysis and criticizes these studies and more that deal with the causal link between PMR and trade (exports) in greater detail. An important critique here is that this causal link may be endogenous because of political economy pressures that push for further lower regulatory barriers as a result of initial export

13
The effect of sectoral regulation on TFP growth has initially been analyzed by Inklaar, Timmer and van Ark (2008). The authors use but one indicator of the national market regulation database for services (NMR), – namely entry-barriers – developed by Conway and Nicoletti
(2006). What they find it that such entry barriers are only somewhat significant in post and telecommunications under the assumption that all countries in their sample are similar in regard to openness to foreign competition.28 This article goes a step further by way of including a full set of regulatory barriers based on the NMR restrictions targeted for mode 3 trade developed by Golub (2003 and 2009).
This first set of regulatory barriers that I include in the regressions are both entry barriers and
what I call conduct regulation. Conduct regulation represents all types of regulation measures that takes place “behind the border” as opposed to regulation “at the border”. Examples of such conduct regulation include for example price controls in the retail services sector or public ownership in the electricity sector. It represents rules and regulation that a firm faces once established in the market. Other examples of regulation that takes place behind the border in professional services are given in the variable table.29
Based on estimation equation (4.1) the following econometric specification can be estimated:
TFP ijt = α + β1 Techgap ijt + β2 High-skill ijt + β3 High-Skill*Techgap ijt + β4 ICT-Cap ijt + β5 ICT-Cap*Techgap ijt + β6 Trade -2 ijt + β7 Trade*Techgap -2 ijt + β8 Entreg -2 ijt + β9 Entreg*Techgap -2 ijt + β10 Conreg -2 ijt + β11 Conreg*Techgap -2 ijt + γ i + δ j + θ t + ε ijt (5.2)
where again all variables are given in (Δ ln) for the growth terms. All regulatory variables are interacted with the technology gap when TFP growth is the dependant variable. Trade -2 ijt now stands for each of the four indicators of services trade with a two years lag. Entreg -2 ijt and Conreg -2 ijt denote entry and conduct regulation respectively also with a two year lag in sector j in country i in year t. The usual country (γ i), sector (δ j) and year (θ t) fixed effects apply.
The results are presented in Table 12 for the TFP level first. Clearly, the trade variables become significant anymore and are taken over by both entry and conduct regulation. Entry
increase thanks to technological progress that made services trade possible in the first place. I avoid such issue by (i) having both trade and regulation as independent variables; and by (ii) using imports trade so that any political economy pressure from domestic industries which might lower trade has a direct effect of lowering imports and thus lower productivity; and (iii) by using the simple lag of each regulatory variable to avoid further problems of endogeneity, as will be explained later in the text.
28 This means that the authors did not include trade as a separate variable preventing to ask the question analyzed in this paper if trade itself becomes a determinant for TFP.
29 Although the name of “conduct” regulation is originally only used in professional services by Conway and Nicoletti (2006), the authors also analyse other sector-specific regulation next to entry regulation for other services sectors such as retail and network services. For convenience purposes all these type of regulation for all sectors other than entry regulation is called “conduct” regulation. See footnote 6 and 7 of Table 2 for further details.

14
regulation has a large negative effect for all trade variables. Conduct regulation shows a somewhat lower coefficient, but remains rather significant for services imports, FATS and services inflows. Again, looking at the full model in column 5 does not give any meaningful
insights.30 Table 13 shows the regression results for TFP growth including the interactions with the
technology gap. The variables conduct regulation for FDI inward stock and flows is significant with the expected signs: a one-percent point growth in regulation behind the border decreases TFP growth by 0.12 per cent inward stock. This effect is more pronounced for industries lying further away from the technology frontier, which would decrease TFP growth by 0.14 per cent. Furthermore, cluster robustness by country and sector reveal that also for FATS conduct regulation becomes greatly significant with the expected signs. (Output for these cluster robustness check are omitted, but their significance is grey-shaded in Table 13 and subsequent regression tables). Clustering further reveals that entry barriers only become significant for services imports. (Also grey shaded in Table 13 and subsequent regression tables). As such, the results demonstrate the interesting fact that a different set of regulations target a specific type of services trade. Regulation behind the border does not seem to affect services imports through mode 1 and 2 so much as it does for FDI or FATS.
5.1 Lowering Mode 3 Regulation that Matters at the Technology Frontier
Other types of regulation that specifically target mode 3 trade, i.e. FDI investments are not measured by entry and conduct regulation. These discriminative restrictions are developed by Golub (2009)31 which are complementary in this study: they measure e.g. restrictions on
percentage of foreign ownership, screening and approval procedures and various operational restriction in the form of nationality requirements for workers and board members or limitations on duration of work permits for expatriates. Importantly, according to Golub (2009) “barriers on labor and production markets and other barriers to entry” are not considered in this index, which in effect should be covered by entry and conduct regulation in the regression before.32
When estimating the effects of FDI restrictions in connection with each type of services trade – complementary to the information captured by entry and conduct regulation – I accordingly develop the following extended equation:
30 Presumably, there are several colliniarity problems since taking out for example one of the trade variables in column 5, e.g. FATS makes FDI instock highly significant, but services imports negatively significant as well as conduct regulation.
31 The author greatly acknowledges his support for sharing the data. 32 Examples that Golub (2009) gives on what is not included are domestic content requirements, price ceilings and prudential
regulation. Exactly topics that partly included in the variable conduct regulation.
15
TFP ijt = α + β1 Techgap ijt + β2 High-skill ijt + β3 High-Skill*Techgap ijt +
β4 ICT-Cap ijt + β5 ICT-Cap*Techgap ijt + β6 Trade -2 ijt +
β7 Trade*Techgap -2 ijt + β8 Entreg -2 ijt + β9 Entreg*Techgap -2 ijt + β10 Conreg -2 ijt + β11 Conreg*Techgap -2 ijt + β12 FDIRest -2 ijt + β13 FDIRest*Techgap -2 ijt + γ i + δ j + θ t + ε ijt (5.3)
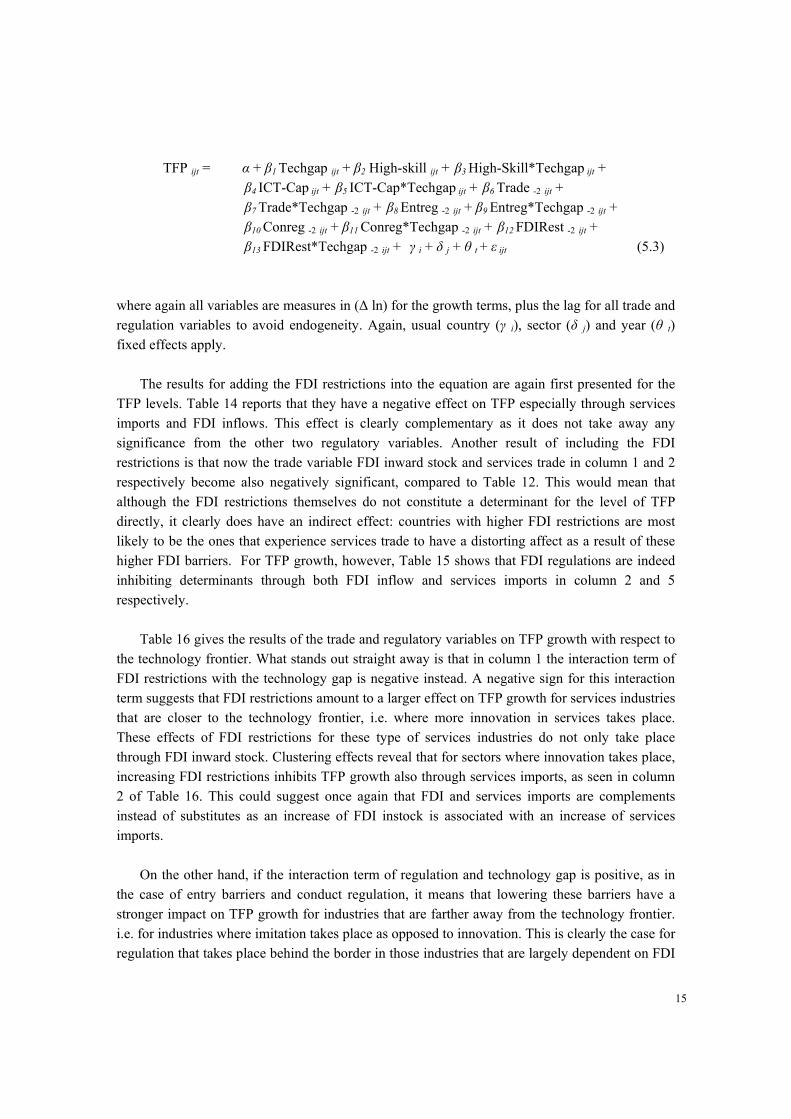
where again all variables are measures in (Δ ln) for the growth terms, plus the lag for all trade and regulation variables to avoid endogeneity. Again, usual country (γ i), sector (δ j) and year (θ t) fixed effects apply.
The results for adding the FDI restrictions into the equation are again first presented for the TFP levels. Table 14 reports that they have a negative effect on TFP especially through services imports and FDI inflows. This effect is clearly complementary as it does not take away any significance from the other two regulatory variables. Another result of including the FDI restrictions is that now the trade variable FDI inward stock and services trade in column 1 and 2 respectively become also negatively significant, compared to Table 12. This would mean that although the FDI restrictions themselves do not constitute a determinant for the level of TFP directly, it clearly does have an indirect effect: countries with higher FDI restrictions are most likely to be the ones that experience services trade to have a distorting affect as a result of these higher FDI barriers. For TFP growth, however, Table 15 shows that FDI regulations are indeed inhibiting determinants through both FDI inflow and services imports in column 2 and 5 respectively.
Table 16 gives the results of the trade and regulatory variables on TFP growth with respect to the technology frontier. What stands out straight away is that in column 1 the interaction term of FDI restrictions with the technology gap is negative instead. A negative sign for this interaction term suggests that FDI restrictions amount to a larger effect on TFP growth for services industries that are closer to the technology frontier, i.e. where more innovation in services takes place. These effects of FDI restrictions for these type of services industries do not only take place through FDI inward stock. Clustering effects reveal that for sectors where innovation takes place, increasing FDI restrictions inhibits TFP growth also through services imports, as seen in column 2 of Table 16. This could suggest once again that FDI and services imports are complements instead of substitutes as an increase of FDI instock is associated with an increase of services imports.
On the other hand, if the interaction term of regulation and technology gap is positive, as in
the case of entry barriers and conduct regulation, it means that lowering these barriers have a stronger impact on TFP growth for industries that are farther away from the technology frontier. i.e. for industries where imitation takes place as opposed to innovation. This is clearly the case for regulation that takes place behind the border in those industries that are largely dependent on FDI
16
inward stock, as column 1 shows. This result is furthermore confirmed by the fact that in column 3 and 4 both through FATS and FDI inflows conduct regulation interacted with technology gap become significant – although somewhat weakly. Clustering effects by country and industry show
that entry barriers have mainly an effect on industries that are more distant from the technology frontier and that are at the same time rather dependent on services imports, as column 2 reports in Table 16. What essentially counts is that when industries move up the technology ladder FDI restrictions become a significant negative determinant for TFP growth. Most likely this is due to the impediments of spill-over effects that take place through FDI, which presumably have a bigger impact on innovative industries and hence their TFP growth.
5.2 The Effect of Mode 3 restrictions in High-Skilled Service Sectors A negative link between higher FDI regulation and TFP growth, which is observable in
services industries that are situated closer to the technology frontier, may suggest that such restrictions have a profound effect in services sectors that have experienced larger growth increase in their high-skilled labor share. This effect would come as no surprise as foreign investments may bring along new concepts of doing business and logistics that typically need high-skilled labor in order to be developed or implemented. FDI restrictions that include measures that prohibit or limit such free movement of skills and ideas could therefore have a more detrimental effect on TFP growth. Such effect would be even more destructive to services that are relatively intense of high-skilled labor, such as business services, but possibly also the current so-called non-tradable personal services such as health and education. Consequently, interacting FDI regulation with the growth share of high-skilled labor in services sectors should give interesting results when including such interaction effects in the regression equation (5..3).
Table 17 confirms such expectation to a very significant level for both FDI inward stock and
FATS statistics suggesting that these restrictions of inhibiting the free flow of skills match trade in mode 3 quite well. Both coefficients are greatly negative implying that an additional increase of these “skill intensive” restrictions yields a lower TFP growth for services sectors that have experienced larger growth of their shares in high-skilled labor. The fact that these type of restrictions are inhibiting TFP growth through FATS substantiates the thought that it is especially mode 3 trade brings along spill-over effects that are much associated with high-skilled labor. In other words, holding back such transfer of spill-over effects has large detrimental consequences for the sector’s TFP growth, specifically for the skill-intensive sectors that are in particular dependent on these spill-over effects. Logically, this is especially true for services approaching the technology frontier, which is shown by interacting FDI restrictions with the technology gap. Yet again it clearly gives a negative significance.
For services imports, the interaction terms of the growth shares of high-skilled labor with
entry and conduct regulation do not become significant. However, a similar negative result for entry barriers interacted with high-skilled labor is found again for FATS suggesting that initial

17
barriers that completely deters commercial presence explains negative TFP growth rate those sectors that have experiences higher growth rates of high-skilled labor. The negative and (weakly) significant coefficient for interacting the technology gap variable with entry barriers suggest that
this type of barriers are a determinant of lower TFP growth for services sectors that are rather close to the technology frontier whilst trading through mode 3. Conduct regulation in combination with high-skilled stays insignificant for all types of trade. This is not surprising as this type or regulation would target other measures which are not specifically related to a certain level of labor skills.
The results are very robust when clustered by country, sector and year. These robustness
checks also mark entry barriers in combination with services imports as an important negative determinant for TFP growth (with the expected coefficient signs grey-shaded in the table). Furthermore, an extra robustness check is included in Table 18 where only Business services sectors are included.
5.3 Policy Implications for Personal Services Sectors: Could Trade Increase The Productivity in the Personal Services Sector?
Although personal services sector output are hard to measure and therefore figures on TFP in
these services should be taken with care, a reasonable proposition based on the descriptive data in section 3 suggest that personal services have lower TFP growth than other market services or manufacturing. Whether this eventually causes lower economic growth as the Baumol theory predicts is a long-term question. Nevertheless, to ask how productivity in these sectors can be increased is a legitimate question. For it is a well-recognized fact that especially in the health care
sector prices and expenditures express in GDP are continuing to grow at a fast rate. (OECD, 2009a)33
The results of the econometric analysis in this paper widely advocate that regulation is largely
responsible for the varying TFP growth figures in services sectors among countries over time. Especially regulation which is tied to FDI and FATS (mode 3 trade), in combination with a growing share of high-skilled labor in services sectors, constitutes a negative determinant for TFP growth in services. This is particularly true for services sectors that are well advanced, i.e. situated closer to the technology frontier. These conclusions imply important policy implications for the personal services sector.
To date personal services are especially surrounded by regulation and other restrictive
policies for international trade. Furthermore, these services, such as health and education, show
33 The ratio health expenditure as part of GDP is often taken as an indicator that, in a macroeconomic context, summarizes the financing needs of a national health system. Although variation in this ratio can come from fluctuations in GDP, most OECD countries demonstrate that the increase of this ratio is in large part due to the increasing health care expenditures (OECD, 2009a).
18
low commitment of relaxing restrictions on cross-border transactions and commercial establishment within the GATS framework. At the same time, personal services sectors such as health care and education exhibit large shares of high-skilled labor as shown in Table 19 – around
26 and 47 per cent respectively.34 These figures are comparable with some other market services, such as finance or business services. Higher levels of regulation in these services sectors and especially restrictions inhibiting the free flow of “skill intensive” ideas suggests to represent a significant explanatory predictor for TFP growth rates to differ among countries. It would imply that relaxing such restrictions could increase productivity growth in these personal sectors.
It’s important, however, to emphasize that relaxing regulation in this context would not only
increase TFP growth as a consequence of merely importing competition, as the results partly put forward. Typically, as FDI regulation seems to be the main driver of shaping productivity (and not trade), it would suggest that participation of foreign skills that bring along spill-over effects together with innovative work procedures and skills, organizational novelties and “logistics” improvements would especially improve TFP growth in these sectors. FDI regulation included in this paper covers restrictions on foreign participation from third parties. This would hence have a greater effect on sectors with higher shares of high-skilled labor as in the case of many personal sectors.
Last, to reduce regulation by way of increasing mode 3 trade so as to increase TFP growth in
the health sector is different than trade through mode 2 that gradually takes place in the health sector and that is encouraged by policy analysts (see e.g. OECD, 2009b). Health care trade through mode 2 takes place when patients move to low-income countries that experience a cost-advantage in performing often standardized (labor) intensive health services. However, introducing trade through mode 3 by way of loosening FDI restrictions predicts that high-income
economies are most likely to become each others’ trading partners. Indeed, health care (and the education) sector in developed countries are skill and technology intensive relative to developing countries. This suggests that these sectors are closer to the technology frontier. Specializing according to each country’s comparative advantage might then bring along horizontal specialization to increase productivity.
5.4 Political Economy Aspects of Personal Services Liberalization in light of the Empirical Results
Governments may face many stakeholders inside the domestic economy that oppose reform
implementation in services sectors that aim at either increasing trade or reshape regulation. Opposition from stakeholders may stem from different reasons. Generally, one of these opposing forces in services liberalization can be expect from final consumers who challenge liberalization
34 One needs to take into account here that this concept of shares of high-skilled labor in a sector is rather narrow as most probably educational attainment is taken into account and working experiences is rather hard to measure.

19
because of concerns of geographical coverage (transport) or frequency treatment (post, telecom). In the case of personal services extra reservation by final consumers can be expected because of concerns that evolve around the principle of universal access or ensured quality of personal
services which is thought to be lower or inferior in the case of foreign supply. Furthermore, the fact that some personal services are provided by governments (i.e. public services) may put an extra strain on the regulatory reform implementation as prices of these services are often be kept artificially low by national governments. Final consumers are then worried that once competition is introduced prices would rise without any further compensation.
To trade-off these constraints of implementing reforms that would benefit society at large,
international trade agreements offer governments a way for breaking domestic deadlocks by mobilizing groups to support their reforms. This mobilization should generally be found on the export side. However, export interests in services are generally weak and if any efforts would be done to mobilize merchandise exporters because of their use of many services as inputs into further goods production, they are likely to be absent in the case of pursuing regulatory reforms in personal services.35 Personal services are so-called ‘final-good’ services where mostly not producers, but consumers form the final point of consumption.
Another political economy force that could mobilize export interest of personal services is
formed by potential direct investors that have been a strong factor during the GATT negotiations. Given that regulatory reform in mode 3 appears to be the main source of productivity growth, this mode would appear to be a logical candidate for governments to generate support for regulatory reform in personal services seen their relative lack of productivity growth – especially for OECD economies that have developed advanced personal services sectors that are likely to be situated closer to the technology frontier. Again, regulatory reform in mode 3 is distinct from regulatory
reform in mode 2, which forms an increasingly popular mode for health (medical tourism) and education (students going abroad). However, if commercial presence is the preferred mode of supply to deregulate, regulatory reform will be associated with transfer of ownership. This could give incentives to stakeholder with non-economic concerns to further complicate the liberalization process of personal service as these services have had a long tradition of public supply and embedded trust.
International trade agreements can furthermore provide extra attributes to succeed in the
regulatory reform implementation by way of providing templates for domestic policy measures or identifying good regulatory practices and principles (Hoekman and Kostecki, 2001). This would be especially useful in the case of personal services since these services include very complex regulation with much government interference, and when efforts to liberalize these services are undertaken government could face difficulties that deal with ensured quality, asymmetric
35 The argument of the apparent lack of interest by industries to support WTO negotiations on services is also put forward in Hoekman, Mattoo and Sapir (2007). One important explanatory factor they describe is the extent of unilateral reforms that have been implemented by many countries. In connection to this, Hoekman and Messerlin (2000) provide more insights why unilateral liberalization in services is more likely to occur than unilateral liberalization in goods.
20
information or the universal access of the personal service. Of special importance here is the need to distinguish between regulation that is discriminatory and prohibits market access, and complementary regulatory capacity in personal services that would be required by governments.
For the same (non-) economic reasons mentioned above, such extra regulatory capacity is likely to be more important for health and education than for other business or professional services. International trade negotiation forums where agreements are developed should therefore give more weight in the mutual evolution of regulatory regimes and the development of focal points in regulatory reform of each trading partners.
Furthermore, empirical literature shows that declining transaction costs in services are largely
associated with increasing skill intensity of the service (Miroudot, Sauvage and Shepherd, 2010). This suggests a higher mobility of factors and increasing international trade could be rather expected in high-skilled services, which are for the most part supplied by developed OECD economies as they have developed a comparative advantage in these services due to their high-skilled labor force. As said, Table 19 shows that for the OECD countries not only business services include a greater share of high-skilled labor, but that this advantage is also shared by the health and educational sectors. Capitalizing on their comparative advantage, these countries are then most likely to be found to commit their high-skilled service during negotiation process (Roy, 2009). However, comparison of EU GATS commitments after the Uruguay Round and current commitments proposals shows no substantial move towards this direction yet for personal services.
6 Conclusion
This paper has asked the empirical question whether trade or trade-related regulation – corrected for omitted variable bias and endogeneity – determines the level and growth of services TFP. Although trade is a significant positive determent for the level of TFP, which is to a large extent inhibited through trade-related regulation, surprisingly this paper does not find any significant indications for services trade to be a positive determinant on TFP growth. On the other hand, there are generally few variables that can explain TFP growth. Nevertheless, the main reason may be that such services trade is to a large extent inhibited by regulation. In the regressions of this paper, regulation that is strongly targeted at services trade through mode 3 has shown to be a powerful and significant explanatory factor that is negatively associated with services TFP growth. Especially in service sectors that are high-skill intense this negative effect is substantial.
However, another important result of this paper is that different types of regulation cover
different measures of trade restrictions, which in turn has different effects on each form of services trade. Entry regulation is largely negatively significant on TFP growth in connection with services imports through mode 1 and 2. Regulation “behind the border” is a significant negative determinant in relation with mainly FDI inward stock and FATS statistics, which

21
represents trade through mode 3 – foreign establishment. As such, these variables measure the inhibiting nature of regulation on services TFP growth quite well.
Furthermore, I find that the effect of entry barriers and conduct regulation is more pronounced for services sectors that are more distant from the technology frontier. One possible reason for this is that countries that have service sector closer to the technology frontier are usually already well integrated and further TFP growth in these sectors through services trade then becomes dependant on other forms of regulation. In relation to this last statement, FDI restrictions that target mode 3 trade seem to have a very large effect for services sectors that are closer to the technology frontier – most likely because spill-over effects from high-skilled labor would be hindered to create higher TFP growth.
This last explanatory factor of diverging TFP growth among countries over time becomes
specifically visible when FDI restrictions are interacted with the growth share of high-skilled labor in services. This means that the establishment of commercial presence in foreign countries contains specific factors such as spill-over effects that target productivity improvements through introducing new concepts and work procedures developed by the higher-skilled or just simply through the movement of high-skilled labor. It would suggest that such effect would be more pronounced in sectors that require a bigger share of high-skilled labor that are hence relatively close to the technology frontier. Examples of the latter are most likely business sectors, but also the health sectors and education.

22
References Aitken, B. and A. Harrison (1999) “Do Domestic Firms Benefit from Direct Foreign
Investment? Evidence from Venezuela”, American Economic Review, Vol. 89, No. 3, pp. 605-618.
Amitri, M. and J. Konings (2007) “Trade Liberalization, Intermediate Inputs and
Productivity”, American Economic Review, Vol. 97, pp. 1611-1638. Ark, B. van, R. Inklaar and R.H. McGuckin (2003) “ICT and Productivity in Europe and the
United States, Where do the Differences Come From? CESifo Economic Studies, Vol. 49. No. 3, pp. 295-318.
Arnold, J.M., A. Mattoo and G. Narciso (2006) “Services Inputs and Firm Productivity in
Sub-Saharan Africa: Evidence from Firm-Level Data”, World Bank Policy Research Working Paper, No. 4048, World Bank.
Arnold, J.M., B. Javorcik and A. Mattoo (2007) “The Productivity Effects of Services
Liberalization: Evidence from the Czech Republic”, World Bank Policy Research Working Paper, No. 4109, World Bank.
Baumol, W. (1967) “Macroeconomics of Unbalanced Growth”, American Economic Review,
Vol 57, pp. 415-26. Bernard, A.B., J.B. Jensen, S.J. Redding and P.K. Schott (2007) “Firms in International
Trade” Journal of Economic Perspectives, Vol. 21, No. 3, pp. 105-130. Bosworth, B.P. and J.E. Triplett (2003) “Productivity Measurements Issues in Services
Industries: “Baumol’s Disease” Has Been Cured”, The Brookings Institution. Breinlich, H. and C. Criscuolo (2008) “Services Traders in the UK” CEP Discussion Paper,
No. 901, December, Centre for Economic Performance, LSE. Conway, P. and G. Nicoletti (2006) “Product Market Regulation in the Non-Manufacturing
Sector of OECD Countries: Measuring and Highlights”, OECD Economics Department Working Papers No. 530.
Conway, P., D. De Rosa, G. Nicoletti and F. Steiner (2006) “Regulation, Competition and
Productivity Convergence”, OECD Economics Department Working Paper 509. Conway, P., V. Janod and G. Nicoletti (2005) “Product Market Regulation in OECD
Countries: 1998 to 2003”, OECD Economics Department Working Papers, No. 419, OECD.

23
Eichengreen, B. and P. Gupta (2009) “The Two Waves of Services Sector Growth”, NBER
Working Paper, No. 14968, National Bureau of Economic Research.
Eschenbach, F. & B. Hoekman (2006) “Services Policy Reform and Economic Growth in
Transition Economies, 1990-2004”, CEPR Discussion Papers 5625, Centre for Economic Policy Research.
EU KLEMS Database (2008), see Timmer, M., M. O’Mahony and B. van Ark (2008) “The
EU KLEMS Growth and Productivity Accounts: An Overview”, University of Groningen and University of Birmingham, downloadable at www.euklems.net.
European Commission (2008) “The EU-US Total Factor Productivity Gap: An Industry
Perspective”, Economic Paper, No. 339, by Havik, K. K. McMorrow, W. Roger and A. Turrini. Financial Times (2009) “The Knocked Postman”, Financial Times Analysis, Thursday
October 22, pp. 9. Francois, J. and B. Hoekman (2009) “Services Trade and Policy”, Economics Working Paper
2009-03, Department of Economics, Johannes Kepler University Linz. Francois, J.F. (1990) “Producer Services, Scale and Division of Labour”, Oxford Economic
Papers, No. 42, pp. 715-29. Francois, J.F. and J. Woerz (2008) “Producer Services, Manufacturing Linkages, and Trade”,
Journal of Industry, Competition and Trade, No. 3, Vol. 8, pp. 199-229. Francois, J.F. and K. Reinert (1996) “The Role of Services in the Structure of Production and
Trade: Stylized Facts from Cross-Country Analysis”, Asia-Pacific Economic Review, Vol. 2, pp. 35-43.
Fuchs, V. (1968) The Service Economy, Columbia University Press, New York. Goldberg, P., Khandelwal, A., Pavcnik, N. and P. Topalova (2009) “Imported Intermediate
Inputs and Domestic Product Growth”, http://www.princeton.edu/~pennykg/#_Working_Papers Golub, S.S. (2003) “Measures of Restrictions on Inward Foreign Direct Investment for
OECD Countries”, OECD Economic Studies, No. 36, pp. 85-116. Golub, S.S. (2009) “Openness to Foreign Direct Investment in Services: An International
Comparative Analysis”, World Economy, Vol. 32, Issue, 8, pp. 1245-1268.

24
Harrison, A. and A. Rodríguez-Clare (2009) “Trade, Foreign Investment and Industrial Policy for Developing Countries”, NBER Working Paper, No. 15261.
Hartwig, J. (2006) “What Drives Health Care Expenditure? Baumol’s Model of ‘Unbalanced Growth’ Revisited,” Working papers 06-133, KOF Swiss Economic Institute, ETH Zurich.
Hoekman, B. and M. Kostecki (2001) “The Political Economy of the World Trading System:
The WTO and Beyond”, Oxford University Press, Oxford. Hoekman, B. and A. Mattoo (2008) “Services and Growth”, World Bank Policy Research
Working Paper, No. 4461, World Bank. Hoekman, B., A. Mattoo and A. Sapir (2007) “The Political Economy of Services Trade
Liberalization: A Case for International Regulatory Cooperation?” Oxford Review of Economic Policy, No. 23, Vol. 3, pp. 367-91.
Hoekman, B. and P. Messerlin (2000) “Liberalizing Trade in Services: Reciprocal
Negotiations and Regulatory Reform,” in P. Sauvé and R. Stern (eds.), Services 2000: New Directions in Services Trade Liberalization, Washington D.C.: Brookings Institution, 487-508.
Inklaar, R., M.P. Timmer and B. van Ark (2008) “Market Services Productivity Across
Europe and the US”, Economic Policy, Vol. 23, pp. 141-94. Kasahara, H. and J. Rogrigue (2008) “Does the Use of Imported Intermediates Increase
Productivity?”, Journal of Development Economics, Vol. 87, pp. 106-118.
Kox, H. (2003) “The Contribution of Business Services to Aggregate Productivity Growth”,
CPB Netherlands’ Bureau for Economic Policy Analysis. Kox, H. and A. Lejour (2005) “Regulatory Heterogeneity as Obstacles for International Trade
in Services”, Discussion Paper No. 49, CPB Netherlands’ Bureau for Economic Policy Analysis Kox, H. and H.K. Nordas (2007) “Services Trade and Domestic Regulation”, OECD Trade
Policy Working Papers, No. 49.
Mattoo, A. & R. Rathindran & A. Subramanian (2006) “Measuring services trade liberalization and its impact on economic growth: An Illustration”, Journal of Economic Integration, vol. 21, pp. 64-98.
Melitz, M. (2003) “The Impact of Trade on Intra-Industry Reallocations and Aggregate
Industry Productivity”, Econometrica, Vol. 71, No. 6, pp. 1695-1725.

25
Miroudot, S., J. Sauvage and B. Shepherd (2010) “Measuring the Cost of International Trade in Services”, earlier publication can be found at Miroudout, S. and B. Shepherd “Shepherd, Ben, Miroudot, Sébastien, “Leveraging Trade in Services to Consolidate Global Economic Recovery:
An Agenda for the G-20”, GEM Policy Brief, September 2009. Nordhaus, W.D. (2006) “Baumol's Diseases: A Macroeconomic Perspective”, NBER
Working Papers, No. 12218, National Bureau of Economic Research. OECD (2009a) “The Challenge of Financing Health Care in The Current Crisis: An Analysis
Based on OECD Data”, OECD Health Working Papers, No. 49, OECD, Paris.
OECD (2009b) “Tracking The Growth in Medical Tourism: OECD Helps Ministers Shape The Debate”, Written Statement to Ministers’ Round Table, Medical Tourism and Global Health Congress, Los Angeles, OECD, Paris: http://www.oecd.org/dataoecd/33/47/43952547.pdf
Oulton, N. (2001) “Must the Growth Rate Decline? Baumol’s Unbalanced Growth
Revisited”, Oxford Economic Papers, No. 53, pp. 605-27. Pavcnik, N. (2002) “Trade Liberalization, Exit, and Productivity Improvements: Evidence
from Chilean Plants”, Review of Economic Studies, Vol. 69, No. 1, pp. 245-276. Pugno, M. (2006) “The Service Paradox and Endogenous Economic Growth”, Structural
Change and Economic Dynamics, Vol. 17, pp. 99-115. Roy, M. (2009) “Endowment, Power and Democracy: The Political Economy of Multilateral
Commitment in Trade in Services”, WTO Staff Working Papers, ERSD 2009-07, WTO, Geneva. Sasaki, H. (2007) “The Rise of Services Employment and its Impact on Aggregate
Productivity Growth”, Structural Change and Economic Dynamics, December. Schwelnuss, C. (2007) “The Effects of Domestic Regulation on Services Trade Revisited”,
CEPII Working Paper, No. 2007-08. Stock, J.H. and M.W. Watson (2008) “Heteroskedasticity-robust standard errors for fixed-
effects panel-data regression”, Econometrica, Vol. 76, pp. 155-174. Vandenbussche, J. P. Aghion and C. Meghir (2006) “Growth, Distance to the Frontier and
Composition of Human Capital”, Journal of Economic Growth, Vol. 11, pp. 97-127. Wölfl, A., I. Wanner, T. Kozluk and G. G. Nicoletti (2009) “Ten Years of Product Market
Reform in OECD Countries – Insights From a Revised PMR Indicator”, OECD Economics Department Working Papers, No. 695, OECD.
26
Data Sources
EUKlems Database The EUKlems database covers 28 countries of which most of them are OECD countries.
Depending on the variable, the data series spans a wide time period from roughly 1970 for mainly Western European countries, Korea and Japan and from the 1990s from non-Western European countries.36 In this database information is given for totally 107 categories of industries of which 37 categories form head categories on a 2-digit level of which one is a 1-digit level for total industries. The coverage for services counts 45 sectors in which both 3-and 2-digit category levels are included. Within the business services category 12 out of totally 32 represent head categories on a 2-digit level. The personal services category have in total 7 head categories on 2-digit level of which two services sector are practically no data given.37 No data for 3-digit services sectors are given.
Multi Factor Productivity (EUKlems)
Sectoral TFP as calculated by Timmer, O’Mahony and Ark (2008). This TFP measure is calculated by subtracting the (cost-share weighted) share in hours worked by different types of workers, different types of capital and intermediate inputs from share of gross output at constant prices. Although the EUKlems database shows output-based TFP data on both 3-digit and 2-digit sector level,d ata on 2-digit level is rather scarce. Where TFP data on this level is missing, a weighted TFP is calculated based on nominal output. This TFP data can then be matched with the trade data. Acquiring information on both digits levels will turn out to be convenient as for some countries trade data is only available on a 2-digit level, as shown in the variable table. Data is collected for the time period 1990-2005. The 3-digit sectors include: (a) Transport, Storage and Communication, (b) Finance, Insurance and Real Estate and Business Services, (c) Real Estate,
Renting and Business Services. Moreover, depending on the trade variables, not all sector are included as data is not always given.
Technology gap (Inklaar, Timmer and van Ark, 2008) Calculations are made following the methodology outlined by Inklaar, Timmer and van Ark
(2008) based on the TFP data described above. The authors measure technology gap as TFP gaps even though TFP measures also reflect other factors besides technology. The relative TFP levels corrected for price differences between countries are used in this variable. The US is used as a benchmark and therefore represents the technology frontier. Explanations about this variable and additional papers on this subject can be found at http://ggdc.net/databases/levels.htm
FDI Inward Stock / Inward Flows (OECD) Inward FDI position, industry sector based ISIC3 (and NACE). A direct investment
enterprise is defined as an incorporated or unincorporated enterprise in which a foreign investor
36 Exceptions are Ireland and Portugal which show data only from the 1990s for some variables. 37 These two personal services categories are Private households with employed persons and Extra-territorial organizations and
bodies.

27
owns 10 per cent or more of the ordinary shares or voting power of an incorporated enterprise or the equivalent of an unincorporated enterprise. The numerical guideline of ownership of 10 per cent of ordinary shares or voting stock determines the existence of a direct investment
relationship. An effective voice in the management, as evidenced by an ownership of at least 10 per cent, implies that the direct investor is able to influence or participate in the management of an enterprise; it does not require absolute control by the foreign investor.
In Table 5, the standard error for FDI inward stock in Business and Renting seems too high,
which may largely be due to Denmark’s extreme high inward stock in the period 1991-1998. The reason for this high number is unknown. The mean growth rate of FDI inward stock for construction and Tourism are fairly low, which may be explained by the fact that countries only started to collect services trade data after liberalizing monopoly markets halfway the 1990s.
In Table 8, FDI inflows show similar amount of observations as for FDI inward stock, but the
standard errors are much higher reflecting the high volatility in this type of trade. Tourism shows a negative mean growth rate which probably indicates that other modes of trade are more important (e.g. Mode 2) for this sector. In terms of mean growth rate, Transport Storage and Communication show high figures. They also show high mean FDI inflow values, but mainly caused by Communications.
Services Imports (OECD) OECD Statistics on International Trade in Services: Volume I: Detailed Tables by Service
Category. The types of services are presented according to the services classification of the 1993 Fifth edition of the Balance of Payments Manual of the International Monetary Fund (BPM5) and its detailed extension, the Extended Balance of Payments Services (EBOPS) Classification. Data
are submitted directly to the OECD by the non-EU OECD member countries and are published without any further changes.
In Table 6, for some services sectors such as Gas, Electricity and Water, and Real Estate, the
OECD does not report any data. The most important sectors which report high trade flows (not reported here) are Tourism, Transport, and Business and Renting. Construction, Communication and Community, Social and Personal services report unsurprisingly low value of trade. The mean growth rate in Communications is however significantly higher than in other services.
FATS (OECD) FATS Statistics Sales (turnover) for inward activity of the OECD Inward activity of
Multinationals in ISIC Rev 3 (services). No further meta data is given is the OECDStat. In Table 7, A strong anomaly in the FATS data is in the Distribution sector. Data
investigation reveal that Japan’s wholesale trade, as opposed to retail trade and repair of personal goods sector, shows substantial high values in USD, but it remains unclear what lies behind this data. Generally, the trade values for FATS are much higher than for FDI inward stock suggesting

28
that FATS are a much better proxy for services trade in Mode 3 than FDI inward stock. The mean growth figures in Table 7 are well balanced, but the number of observations remains very low.
Entry regulation (OECD) Data is part of PMR and are on discrete basis but are also intrapolated to make them
continues. Head categories (sector) are unweighted averages. Real Est. Rent. Business; Real Estate & Business and Renting similar PMRs. They include Licensing, Educational Requirements, Quotas and Economic needs test for Professional services; Registration in commercial register, Licenses or permits needed to engage in commercial activity and Specific regulation of large outlets for Distribution services; and sector specific entry barriers for Transport and Communication services. Slovenia is not included. Head categories of services sector as unweighted averages. Index is rescaled from 0 to 1.
Conduct regulation (OECD) Data is part of PMR and are on discrete basis but are also intrapolated to make them
continuous. Head categories (sector) are unweighted averages. Real Est. Rent. Business; Real Estate & Business and Renting similar PMRs. They include Regulation on prices and fees, Regulation on Advertising and Regulation on forms of business and inter-professional cooperation for Professional services; Operational restrictions (protection of existing firms and regulation concerning opening hours) and Price controls for Distribution; and Public ownership, Market structure, Vertical integration and Price controls for Transport and Communication services. Slovenia not included. Head categories of services sector as unweighted averages. Index is rescaled from 0 to 1.
FDI restrictions (Golub, 2009) Data is provided by Stephen Golub and explained in Golub (2009). Initially the FDI
restrictiveness indicator has also been used for the PMR as sector specific variables as part of Barriers to Trade and Investments. The FDI restriction scoring method include measures on the broad categories, namely (a) foreign ownership (foreign equity allowance), (b) screening and approval procedures and (c) operational restrictions such as national or residential requirements for board of director/ managers, duration of work permits for expatriates and other restrictions. Services industries and their subsectors are weighted by their FDI instead of GDP. However, an average of FDI and trade weights has been employed using OECD data taken from Golub (2003) to mitigate endogeneity issues. Index ranges from 0 to 1.

29
Tables and Figures

Figure 1: Total Factor Productivity (TFP) levels developments for 1990-2005
8010
012
014
0
1990 1995 2000 2005year
aul_bus aul_pers
8010
012
014
0
1990 1995 2000 2005year
aut_bus aut_pers
8010
012
014
0
1990 1995 2000 2005year
bel_bus bel_pers
8010
012
014
0
1990 1995 2000 2005year
cz_bus cz_pers
8010
012
014
0
1990 1995 2000 2005year
dnk_bus dnk_pers
8010
012
014
0
1990 1995 2000 2005year
fin_bus fin_pers
8010
012
014
0
1990 1995 2000 2005year
fra_bus fra_pers
8010
012
014
0
1990 1995 2000 2005year
ger_bus ger_pers
8010
012
014
0
1990 1995 2000 2005year
hun_bus hun_pers
8010
012
014
0
1990 1995 2000 2005year
irl_bus irl_pers
8010
012
014
0
1990 1995 2000 2005year
ita_bus ita_pers
8010
012
014
0
1990 1995 2000 2005year
jpa_bus jpa_pers
8010
012
014
01990 1995 2000 2005
year
kor_bus kor_pers
8010
012
014
0
1990 1995 2000 2005year
lux_bus lux_pers
8010
012
014
0
1990 1995 2000 2005year
nld_bus nld_pers
8010
012
014
0
1990 1995 2000 2005year
prt_bus prt_pers
8010
012
014
0
1990 1995 2000 2005year
esp_bus esp_pers
8010
012
014
0
1990 1995 2000 2005year
sw e_bus sw e_pers80
100
120
140
1990 1995 2000 2005year
uk_bus uk_pers
8010
012
014
0
1990 1995 2000 2005year
us_bus us_pers

31
Table 2: Variable table
TFP level
(output)
(1)
FDI Inflow OECD source
(2)
FDI Instock OECD source
(2)
Services Import OECD source
(3)
FATS OECD source
(4)
PMR (Discr. &
Cont)
(5)
Entry Regulation
(Discr. & Cont)
(6)
Conduct Regulation
(Discr & Cont.)
(7)
FDI Restrictions
(Discr. & Cont.) (10)
Electr Gas Water 1990-2005 1993-2005 1993-2005 - 1995-2005 1990-2005 1990-2005 1990-2005 1991-2005 Construction 1990-2005 1990-2005 1990-2005 1990-2005 1995-2005 - - - 1991-2005 Distribution 1990-2005 1990-2005 1990-2005 - 1995-2005 1996-2005 1996-2005 1996-2005 1991-2005 Tourism 1990-2005 1990-2005 1990-2005 1990-2005 1995-2005 - - - 1991-2005 Transp Stor Com 1990-2005 1990-2005 1990-2005 1990-2005 1995-2005 1990-2005 1990-2005 1990-2005 1991-2005 Transp 1990-2005 1999-2005 1999-2005 1990-2005 1995-2005 1990-2005 1990-2005 1990-2005 1991-2005 Communications 1990-2005 1990-2005 1990-2005 1990-2005 1995-2005 1990-2005 1990-2005 1990-2005 1991-2005 Fin Ins Real Bus 1990-2005 1990-2005 1990-2005 1990-2005 1995-2005 - - - 1991-2005 Finance 1990-2005 1990-2005 1990-2005 1990-2005 1995-2005 - - - 1991-2005 Real Est. Rent. Business 1990-2005 1993-2005 1993-2005 - 1995-2005 1996-2005 1996-2005 1996-2005 1991-2005 Real Estate 1990-2005 1993-2005 1993-2005 - 1995-2005 1996-2005 1996-2005 1996-2005 1991-2005 Business & Renting 1990-2005 1993-2005 1993-2005 1990-2005 1995-2005 1996-2005 1996-2005 1996-2005 1991-2005 Com Soc Perso 1990-2005 1990-2005 1990-2005 1990-2005 1995-2005 - - - - Publ Adm 1990-2005 - - 1990-2005 - - - - - Education 1990-2005 - - 1990-2005 - - - - - Health 1990-2005 - - 1990-2005 - - - - - Other Personal services 1990-2005 - - - 1995-2005 - - - - No of countries included* 21 21 21 21 21 20 20 20 20 Variable specifics Index Normal Normal Normal Normal Index (0-6) Index (0-6) Index (0-6) Index (0-1)
(1) Data available from 1980 onwards for most countries, except CZ, PRT, SVN IRL, HUN from 1995; SWE from 1993; LUX from 1992. Head categories of services sector as weighted
averages by their nominal output. Source: EUKlems (2) Many zero trade flows in early 1990s but from 1993 better for Electr. Gas Water; Toerism; Real Est. Rent. Business; Real Estate; Poor data for Transport. Actual data continues to 2006/2007. (3) Many zero trade flows in early 1990s but from 1993 better for Communications. Public Adm. And, Health and Education idem data. Actual data continues to 2006/2007. (4) Only from 1995 onwards available. Quite some countries missing in data. (5) PMRs are on discrete basis but are also intrapolated to make them continues. Head categories (sector) are unweighted averages. Real Est. Rent. Business; Real Estate & Business and Renting
similar PMRs. Slovenia not included. Head categories of services sector as unweighted averages. (6) Entry regulation are part of PMR and are on discrete basis but are also intrapolated to make them continues. Head categories (sector) are unweighted averages. Real Est. Rent. Business; Real
Estate & Business and Renting similar PMRs. They include Licensing, Educational Requirements, Quotas and Economic needs test for Professional services; Registration in commercial register, Licenses or permits needed to engage in commercial activity and Specific regulation of large outlets for Distribution services; and sector specific entry barriers for Transport and Communication services. Slovenia excluded. Head categories of services sector as unweighted averages.
(7) Conduct regulation are part of PMR and are on discrete basis but are also intrapolated to make them continues. Head categories (sector) are unweighted averages. Real Est. Rent. Business; Real Estate & Business and Renting similar PMRs. They include Regulation on prices and fees, Regulation on Advertising and Regulation on forms of business and interprofessional cooperation for Professional services; Operational restrictions (protection of existing firms and regulation concerning opening hours) and Price controls for Distribution; and Public ownership, Market structure, Vertical integration and Price controls for Transport and Communication services. Slovenia not included. Head categories of services sector as unweighted averages.
(8) Received data from Stephen Galob and also used for UNCTAD and OECD studies. PMRs are partly based on this information. FDI regulation index is sector specific and are available from 1981 onwards! Korea, Czech Republic and Hungary only time-series from 1996 onwards. Head categories of services sector as unweighted averages.
* Countries for which data is researched. Trade data too dispersed to indicate the number of countries for which I have good data.

Table 3: Summary table of the selected variables (in Δ ln)
Variable Obs Mean Std. Dev. Min Max
TFP (output-based) 5083 .0007143 .0256652 -.2090377 .1829378
Technology gap 4930 .9450209 .2849236 .3044278 3.871316
High-skilled labor share 5015 .0282278 .0878922 -.7425235 1.12815
ICT-capital share 5049 .0132097 .2604589 -4.337976 4.067055
FDI inward stock 1723 .1472768 .4967 -5.889042 6.183538
Services imports 3016 .0835928 .3885326 -3.970282 4.842437
FATS sales 910 .1419413 .4636052 -4.691095 3.123531
FDI inward flows 1759 .1820892 1.41939 -5.779026 8.184199
Entry barriers 1791 -.0672223 .1958363 -2.282382 .3626719
Conduct regulation 1876 -.0387651 .0772732 -.7884574 .438255
FDI restrictions 2940 -.0551982 .1057739 -1.882731 1.122143
Table 4: Correlation Matrix
Variable tfpgrth_out_ tfpg_out_ gr_hhs_ gr_capit_ gr_fdi_
in_st_o_ gr_serv_ imp_o_
gr_ fats_o_
gr_fdi_ in_fl_o_
gr_ent reg_c_rc_
gr_con reg_c_rc_
gr_fdi rest_c_
TFP (output based) 1.0000
Technology gap 0.3206 1.0000
High-skilled labor share 0.0029 -0.0689 1.0000
ICT-capital share -0.4512 -0.1294 0.0193 1.0000
FDI inward stock -0.0511 -0.1196 0.0785 0.0853 1.0000
Services imports 0.1956 0.0685 0.1520 -0.2574 0.1402 1.0000
FATS sales -0.0251 0.0031 0.1850 0.1563 0.0227 0.0067 1.0000
FDI inward flows 0.0239 -0.0277 0.0311 0.0811 0.4670 0.0377 -0.1489 1.0000
Entry barriers -0.1028 0.1006 -0.0801 -0.0692 0.1150 -0.0758 -0.0279 -0.1416 1.0000
Conduct regulation -0.0661 0.0239 0.0187 0.0186 0.0977 0.2729 0.0702 -0.0728 0.2694 1.0000
FDI restrictions -0.2868 0.0956 0.0495 -0.0552 -0.1294 0.2946 -0.0134 -0.2227 0.1104 0.5066 1.0000
Variable gr_fdi_in_st_o_ gr_serv_imp_o_ gr_fats_o_ gr_fdi_in_fl_o_ Variable gr_entreg_c_rc_ gr_conreg_c_rc_ gr_fdirest_c_
FDI inward stock 1.0000 Entry barriers 1.0000
Services imports 0.1277 1.0000 Conduct reg 0.1398 1.0000
FATS sales 0.0429 0.0190 1.0000 FDI restrictions 0.0846 0.0985 1.0000
FDI inward flows 0.4159 0.1039 -0.0711 1.0000
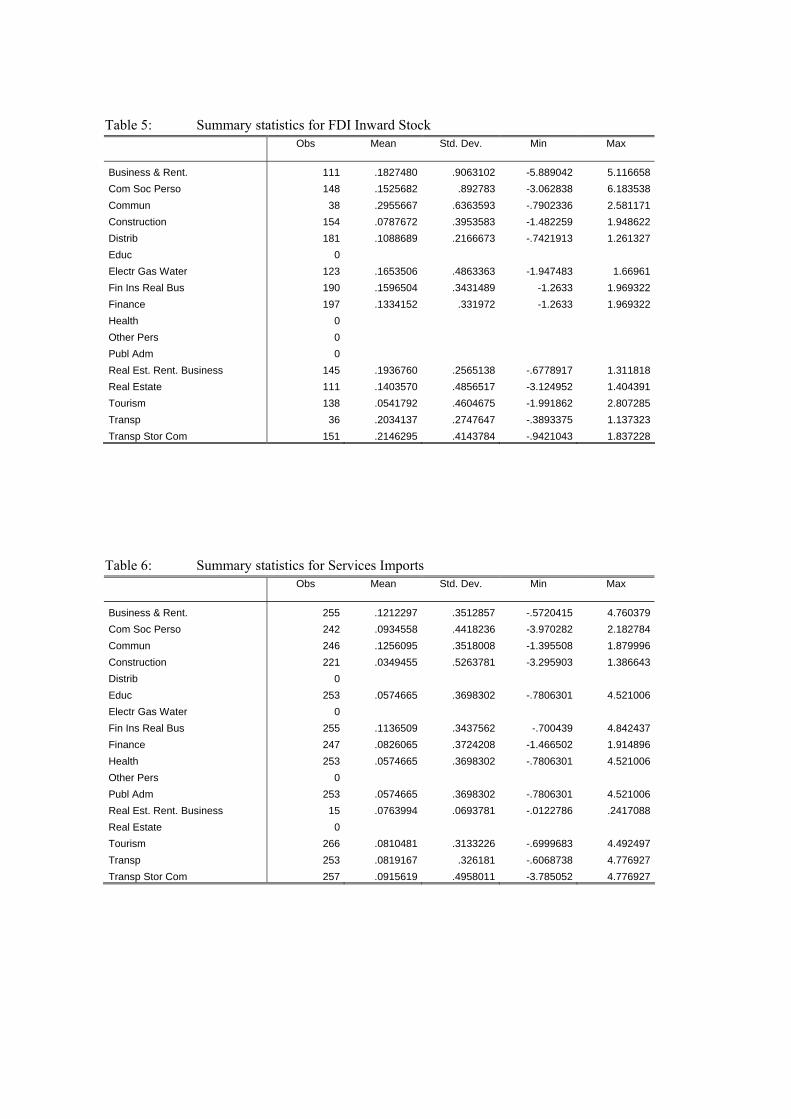
Table 5: Summary statistics for FDI Inward Stock
Obs
Mean
Std. Dev.
Min
Max
Business & Rent. 111 .1827480 .9063102 -5.889042 5.116658
Com Soc Perso 148 .1525682 .892783 -3.062838 6.183538
Commun 38 .2955667 .6363593 -.7902336 2.581171
Construction 154 .0787672 .3953583 -1.482259 1.948622
Distrib 181 .1088689 .2166673 -.7421913 1.261327
Educ 0
Electr Gas Water 123 .1653506 .4863363 -1.947483 1.66961
Fin Ins Real Bus 190 .1596504 .3431489 -1.2633 1.969322
Finance 197 .1334152 .331972 -1.2633 1.969322
Health 0
Other Pers 0
Publ Adm 0
Real Est. Rent. Business 145 .1936760 .2565138 -.6778917 1.311818
Real Estate 111 .1403570 .4856517 -3.124952 1.404391
Tourism 138 .0541792 .4604675 -1.991862 2.807285
Transp 36 .2034137 .2747647 -.3893375 1.137323
Transp Stor Com 151 .2146295 .4143784 -.9421043 1.837228
Table 6: Summary statistics for Services Imports
Obs
Mean
Std. Dev.
Min
Max
Business & Rent. 255 .1212297 .3512857 -.5720415 4.760379
Com Soc Perso 242 .0934558 .4418236 -3.970282 2.182784
Commun 246 .1256095 .3518008 -1.395508 1.879996
Construction 221 .0349455 .5263781 -3.295903 1.386643
Distrib 0
Educ 253 .0574665 .3698302 -.7806301 4.521006
Electr Gas Water 0
Fin Ins Real Bus 255 .1136509 .3437562 -.700439 4.842437
Finance 247 .0826065 .3724208 -1.466502 1.914896
Health 253 .0574665 .3698302 -.7806301 4.521006
Other Pers 0
Publ Adm 253 .0574665 .3698302 -.7806301 4.521006
Real Est. Rent. Business 15 .0763994 .0693781 -.0122786 .2417088
Real Estate 0
Tourism 266 .0810481 .3133226 -.6999683 4.492497
Transp 253 .0819167 .326181 -.6068738 4.776927
Transp Stor Com 257 .0915619 .4958011 -3.785052 4.776927

34
Table 7: Summary statistics for FATS
Obs
Mean
Std. Dev.
Min
Max
Business & Rent. 69 .1330776 .388682 -1.212581 2.134002
Com Soc Perso 70 .1343024 .6962608 -3.472218 2.601134
Commun 56 .2567978 .5400673 -1.435817 2.699958
Construction 68 .0879892 .2493449 -.4107776 1.501836
Distrib 84 .1084448 .1566535 -.2136707 .8433838
Educ 26 .0667553 .3836826 -.7989206 1.061917
Electr Gas Water 51 .2318939 .5965762 -1.339866 3.123531
Fin Ins Real Bus 48 .1191475 .4820354 -1.253403 2.148449
Finance 45 .1394075 .2808196 -.5774021 .8294315
Health 0
Other Pers 47 .1223017 .8613643 -4.691095 1.426543
Publ Adm 0
Real Est. Rent. Business 72 .1066362 .49693 -1.906598 2.83667
Real Estate 60 .1602786 .4142041 -1.394153 1.181077
Tourism 77 .1056251 .2460542 -.5212955 1.342676
Transp 55 .2179383 .5450603 -.9585915 2.126571
Transp Stor Com 82 .1511299 .3320268 -1.047323 1.202575
Table 8: Summary statistics for FDI inflows
Obs
Mean
Std. Dev.
Min
Max
Business & Rent. 123 .2176967 1.257101 -4.431576 4.007068
Com Soc Perso 144 .1503893 1.378764 -3.755772 5.545673
Commun 82 .3230221 1.719161 -3.358193 3.574217
Construction 143 .1561955 1.557348 -5.653074 6.848822
Distrib 186 .0634414 1.225852 -4.868565 4.861478
Educ 0
Electr Gas Water 98 .3695075 2.219211 -3.951061 8.184199
Fin Ins Real Bus 220 .1413195 1.099108 -4.020417 4.295833
Finance 203 .1011590 1.454639 -5.779026 4.489973
Health 0
Other Pers 0
Publ Adm 0
Real Est. Rent. Business 163 .2372677 1.153038 -4.557771 5.593092
Real Estate 98 .2651849 1.318531 -4.152494 4.020665
Tourism 114 -.0178500 1.348766 -3.905887 5.259189
Transp 33 .2981839 1.598633 -2.831948 4.067742
Transp Stor Com 152 .3350861 1.532808 -5.206096 5.851419

35
Figures 2: Cross-sectoral TFP Growth and FDI inward stock, Services imports
TFP Growth and FDI instock TFP Growth and Services imports
90
95
10
01
05
11
0T
FP
Gro
wth
(a
vg a
ll se
cto
rs)
6 8 10 12 14FDI instock (avg all sectors)
cross-sectoral Fitted values
9
09
51
00
10
51
10
TF
P G
row
th (
avg
all
sect
ors
)
8 9 10 11 12 13Services imports (sum all sectors)
cross-sectoral Fitted values
Figures 3: Cross-sectoral TFP Growth and Overall Regulation TFP Growth and Barriers to Trade and TFP Growth and Product Market Regulation Investment
90
95
10
01
05
11
0T
FP
Gro
wth
(a
vg a
ll se
cto
rs)
0 1 2 3Barriers to Trade and Investment (avg all sectors)
cross-sectoral Fitted values
90
95
10
01
05
11
0T
FP
Gro
wth
(a
vg a
ll se
cto
rs)
.2 .4 .6 .8 1Entry regulation (avg all sectors)
cross-sectoral Fitted values
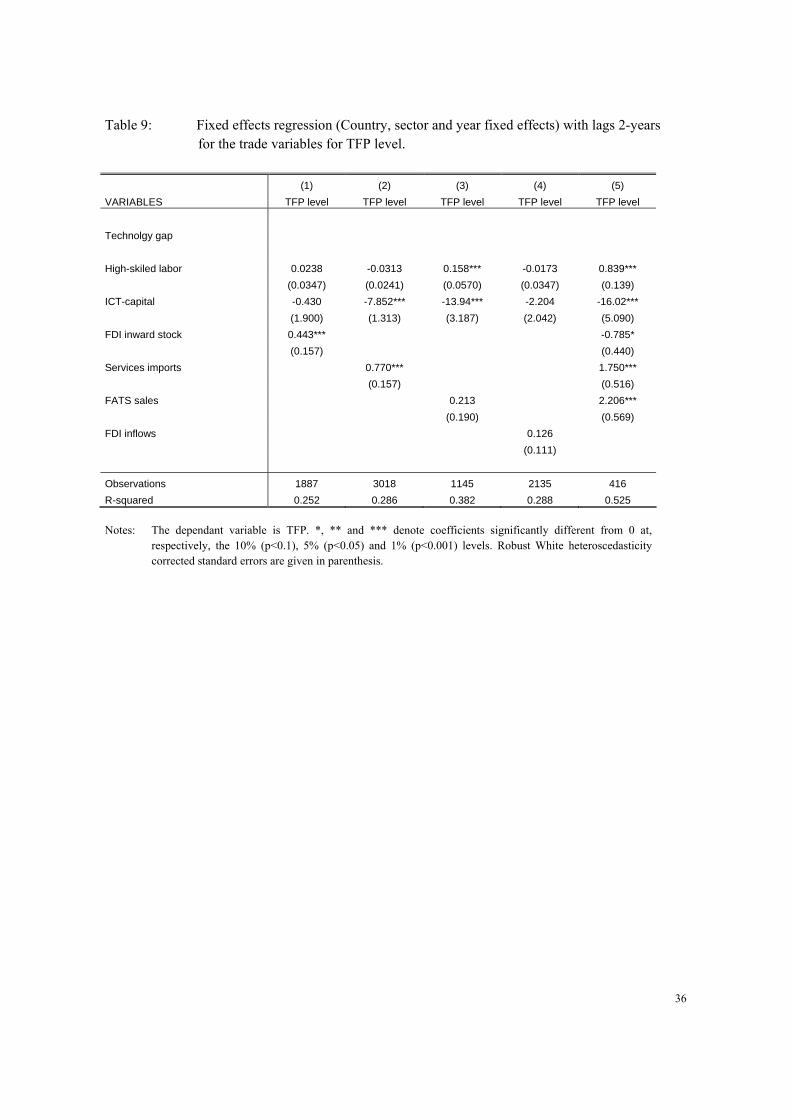
36
Table 9: Fixed effects regression (Country, sector and year fixed effects) with lags 2-years for the trade variables for TFP level.
(1) (2) (3) (4) (5)
VARIABLES TFP level TFP level TFP level TFP level TFP level
Technolgy gap
High-skiled labor 0.0238 -0.0313 0.158*** -0.0173 0.839***
(0.0347) (0.0241) (0.0570) (0.0347) (0.139)
ICT-capital -0.430 -7.852*** -13.94*** -2.204 -16.02***
(1.900) (1.313) (3.187) (2.042) (5.090)
FDI inward stock 0.443*** -0.785*
(0.157) (0.440)
Services imports 0.770*** 1.750***
(0.157) (0.516)
FATS sales 0.213 2.206***
(0.190) (0.569)
FDI inflows 0.126
(0.111)
Observations 1887 3018 1145 2135 416
R-squared 0.252 0.286 0.382 0.288 0.525
Notes: The dependant variable is TFP. *, ** and *** denote coefficients significantly different from 0 at,
respectively, the 10% (p<0.1), 5% (p<0.05) and 1% (p<0.001) levels. Robust White heteroscedasticity corrected standard errors are given in parenthesis.
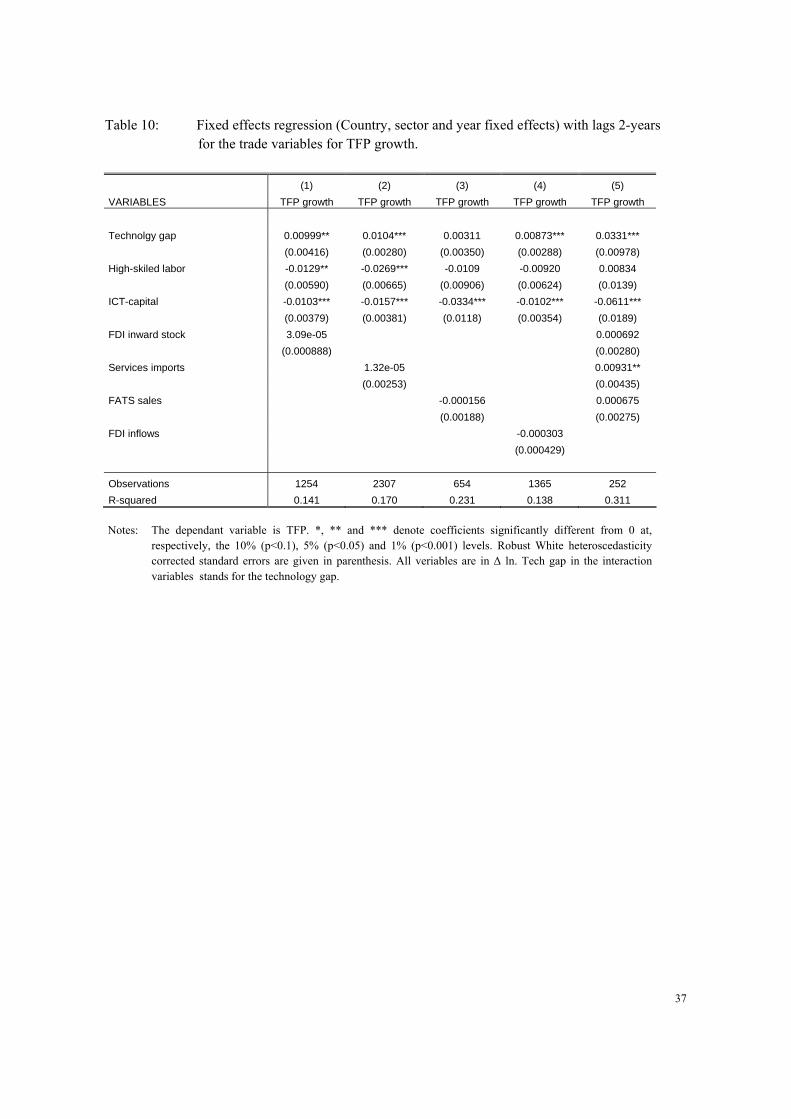
37
Table 10: Fixed effects regression (Country, sector and year fixed effects) with lags 2-years for the trade variables for TFP growth.
(1) (2) (3) (4) (5)
VARIABLES TFP growth TFP growth TFP growth TFP growth TFP growth
Technolgy gap 0.00999** 0.0104*** 0.00311 0.00873*** 0.0331***
(0.00416) (0.00280) (0.00350) (0.00288) (0.00978)
High-skiled labor -0.0129** -0.0269*** -0.0109 -0.00920 0.00834
(0.00590) (0.00665) (0.00906) (0.00624) (0.0139)
ICT-capital -0.0103*** -0.0157*** -0.0334*** -0.0102*** -0.0611***
(0.00379) (0.00381) (0.0118) (0.00354) (0.0189)
FDI inward stock 3.09e-05 0.000692
(0.000888) (0.00280)
Services imports 1.32e-05 0.00931**
(0.00253) (0.00435)
FATS sales -0.000156 0.000675
(0.00188) (0.00275)
FDI inflows -0.000303
(0.000429)
Observations 1254 2307 654 1365 252
R-squared 0.141 0.170 0.231 0.138 0.311
Notes: The dependant variable is TFP. *, ** and *** denote coefficients significantly different from 0 at,
respectively, the 10% (p<0.1), 5% (p<0.05) and 1% (p<0.001) levels. Robust White heteroscedasticity corrected standard errors are given in parenthesis. All veriables are in Δ ln. Tech gap in the interaction variables stands for the technology gap.

38
Table 11: Fixed effects regression (Country, sector and year fixed effects) with 2-years lag for the trade variables on TFP growth
(1) (2) (3) (4) (5)
VARIABLES TFP growth TFP growth TFP growth TFP growth TFP growth
Technology gap 0.00846** 0.00831*** 0.00144 0.00703** 0.0310***
(0.00407) (0.00321) (0.00426) (0.00316) (0.0102)
High-skiled labor -0.0578*** -0.0813*** -0.0392 -0.0426** -0.113*
(0.0204) (0.0250) (0.0292) (0.0185) (0.0611)
High-skiled labor*Tech gap 0.0505** 0.0571** 0.0308 0.0351* 0.121*
(0.0240) (0.0251) (0.0349) (0.0204) (0.0667)
ICT-capital 0.0127 -0.0229 -0.0228 0.00327 -0.108*
(0.0146) (0.0153) (0.0311) (0.0137) (0.0615)
ICT-capital*Tech gap -0.0282 0.00857 -0.0105 -0.0169 0.0424
(0.0203) (0.0156) (0.0391) (0.0184) (0.0677)
FDI inward stock -0.000496 0.0270*
(0.00610) (0.0153)
FDI inward stock*Tech gap 0.000426 -0.0309*
(0.00710) (0.0178)
Services imports 0.00774 -0.0265
(0.00560) (0.0340)
Services imports*Tech gap -0.00822 0.0362
(0.00537) (0.0345)
FATS sales 0.00127 -0.00724
(0.00646) (0.00949)
FATS sales*Tech gap -0.00155 0.00835
(0.00749) (0.00999)
FDI inflows -0.00107
(0.00160)
FDI inflows*Tech gap 0.000799
(0.00164)
Observations 1254 2307 654 1365 252
R-squared 0.153 0.174 0.233 0.142 0.342
Notes: The dependant variable is the level of TFP. *, ** and *** denote coefficients significantly different from 0
at, respectively, the 10% (p<0.1), 5% (p<0.05) and 1% (p<0.001) levels. Robust White heteroscedasticity corrected standard errors are given in parenthesis. All veriables are in Δ ln. Tech gap in the interaction variables stands for the technology gap.

39
Table 12: Fixed effects regression (2) (Country, sector and year fixed effects) with 2-years lag for the trade and regulation variables on TFP level.
(1) (2) (3) (4) (5)
VARIABLES TFP level TFP level TFP level TFP level TFP level
Technology gap
High-skiled labor 0.0118 -0.166 -0.0115 -0.198*** 0.898***
(0.0575) (0.102) (0.0631) (0.0620) (0.256)
ICT-capital -4.288 -11.81*** -15.88*** -6.821** -22.61***
(3.432) (3.043) (4.539) (3.362) (8.142)
FDI inward stock -0.152 -3.049***
(0.341) (0.647)
Services imports 0.154 -3.105
(0.647) (2.044)
FATS sales -0.789** 0.266
(0.387) (1.115)
FDI inflows -0.0609
(0.189)
Entry Barriers -12.42*** -15.86*** -10.81*** -8.644*** -8.337
(2.129) (2.367) (2.692) (2.106) (6.482)
Conduct Regulation -0.345 -5.415** -6.646** -6.079** 5.083
(2.675) (2.707) (2.959) (2.446) (6.507)
Observations 771 914 620 923 151
R-squared 0.560 0.549 0.542 0.501 0.837
Notes: The dependant variable is TFP. Definitions of Entry and Conduct regulations can be found in the footnotes
6 and 7 of Table 2. *, ** and *** denote coefficients significantly different from 0 at, respectively, the 10% (p<0.1), 5% (p<0.05) and 1% (p<0.001) levels. Robust White heteroscedasticity corrected standard errors are given in parenthesis.

40
Table 13: Fixed effects regression (2) (Country, sector and year fixed effects) with 2-years lag for the trade and regulation variables on TFP growth
(1) (2) (3) (4) (5)
VARIABLES TFP growth TFP growth TFP growth TFP growth TFP growth
Technology gap 0.00999 0.0120* 0.00149 0.0145** 0.0120
(0.00634) (0.00685) (0.00521) (0.00683) (0.0314)
High-skiled labor -0.0341 -0.128*** -0.0277 -0.0316* 0.0251
(0.0224) (0.0396) (0.0419) (0.0186) (0.0931)
High-skiled labor*Tech gap 0.0260 0.105*** 0.0108 0.0317 -0.0694
(0.0256) (0.0398) (0.0514) (0.0216) (0.106)
ICT-capital 0.0199 0.0211 -0.00701 0.0377** -0.0484
(0.0196) (0.0293) (0.0374) (0.0175) (0.142)
ICT-capital*Tech gap -0.0355 -0.0492 -0.0241 -0.0634** -0.0532
(0.0301) (0.0371) (0.0413) (0.0264) (0.148)
FDI inward stock 0.00199 0.0253
(0.00757) (0.0261)
FDI inward stock*Tech gap -0.00316 -0.0275
(0.00907) (0.0296)
Services imports -0.00253 -0.0321
(0.00805) (0.109)
Services imports*Tech gap -0.00193 0.0424
(0.00976) (0.117)
FATS sales -0.00159 0.0150
(0.00604) (0.0213)
FATS sales*Tech gap 0.00331 -0.00483
(0.00659) (0.0174)
FDI inflows -0.000497
(0.00303)
FDI inflows*Tech gap 0.000308
(0.00322)
Entry barriers 0.00554 -0.0263 0.0113 -0.0107 0.0967
(0.0233) (0.0164) (0.0208) (0.0159) (0.0852)
Entry barriers*Tech gap 0.00185 0.0206 -0.0192 0.0160 -0.105
(0.0242) (0.0161) (0.0183) (0.0167) (0.0926)
Conduct regulation -0.118** -0.000799 -0.115 -0.0826* -0.165
(0.0468) (0.0456) (0.0774) (0.0473) (0.252)
Conduct regulation*Tech gap 0.142*** -0.00838 0.124 0.0689 0.196
(0.0533) (0.0477) (0.0838) (0.0517) (0.233)
Observations 455 664 335 532 78
R-squared 0.279 0.286 0.324 0.251 0.538
Notes: The dependant variable is the level of TFP Definitions of Entry and Conduct regulations can be found in
the footnotes 6 and 7 of Table 2. *, ** and *** denote coefficients significantly different from 0 at, respectively, the 10% (p<0.1), 5% (p<0.05) and 1% (p<0.001) levels. Robust White heteroscedasticity corrected standard errors are given in parenthesis. Boxes in grey stand for their significance in cluster robustness checks by either sector or country. All veriables are in Δ ln. Tech gap in the interaction variables stands for the technology gap.

41
Table 14: Fixed effects regression (Country, sector and year fixed effects) with 2-years lag for the trade and regulation variables and FDI restrictions on TFP level
(1) (2) (3) (4) (5)
VARIABLES TFP level TFP level TFP level TFP level TFP level
Technology gap
High-skiled labor -0.0971* -0.302*** -0.0183 -0.244*** 0.946***
(0.0576) (0.106) (0.0632) (0.0696) (0.244)
ICT-capital -3.860 -10.88*** -16.10*** -6.126* -21.29***
(3.456) (2.968) (4.582) (3.405) (7.752)
FDI inward stock -0.978*** -2.962***
(0.279) (0.621)
Services imports -1.293** -3.923*
(0.585) (2.129)
FATS sales -0.739* 0.418
(0.400) (1.085)
FDI inflows -0.158
(0.193)
Entry Barriers -9.669*** -14.16*** -10.54*** -7.151*** -9.522
(1.872) (2.322) (2.687) (2.050) (6.219)
Conduct Regulation -1.168 -5.808** -5.607* -5.552** 5.049
(2.948) (2.712) (3.071) (2.611) (6.307)
FDI Restrictions -2.543 -8.602** -6.751* -6.180*** 13.91*
(2.118) (3.567) (3.911) (2.274) (8.191)
Observations 739 829 612 886 151
R-squared 0.620 0.599 0.544 0.515 0.841
Notes: The dependant variable is TFP. Definitions of Entry and Conduct regulations can be found in the footnotes
6 and 7 of Table 2. *, ** and *** denote coefficients significantly different from 0 at, respectively, the 10% (p<0.1), 5% (p<0.05) and 1% (p<0.001) levels. Robust White heteroscedasticity corrected standard errors are given in parenthesis.

42
Table 15: Fixed effects regression (Country, sector and year fixed effects) with 2-years lag for the trade and regulation variables and FDI restrictions on TFP growth
(1) (2) (3) (4) (5)
VARIABLES TFP growth TFP growth TFP growth TFP growth TFP growth
Technology gap 0.00249 0.0128*** -0.00144 0.00704 -0.0117
(0.00544) (0.00480) (0.00488) (0.00574) (0.0212)
High-skiled labor -0.0124 -0.0323*** -0.0191** -0.00547 -0.0314
(0.00790) (0.0121) (0.00926) (0.00743) (0.0252)
ICT-capital -0.00399* -0.0132* -0.0282*** -0.00419* -0.107***
(0.00235) (0.00751) (0.00987) (0.00245) (0.0365)
FDI inward stock -0.000385 -3.15e-05
(0.00142) (0.00603)
Services imports -0.00515 0.00969
(0.00399) (0.0218)
FATS sales 0.00160 0.0109*
(0.00208) (0.00568)
FDI inflows -0.000223
(0.000582)
Entry Barriers 0.00268 -0.00463 -0.00743 0.00472 -0.00459
(0.00634) (0.00553) (0.00790) (0.00611) (0.0167)
Conduct Regulation 0.00200 -0.00247 0.00486 -0.0197 0.0452
(0.0126) (0.0134) (0.0172) (0.0133) (0.0484)
FDI Restrictions -0.00465 -0.0651** -0.0193 -0.0215** -0.00655
(0.0110) (0.0261) (0.0207) (0.0101) (0.0536)
Observations 449 609 335 517 78
R-squared 0.271 0.300 0.312 0.273 0.515
Notes: The dependant variable is TFP. Definitions of Entry and Conduct regulations can be found in the footnotes
6 and 7 of Table 2. *, ** and *** denote coefficients significantly different from 0 at, respectively, the 10% (p<0.1), 5% (p<0.05) and 1% (p<0.001) levels. Robust White heteroscedasticity corrected standard errors are given in parenthesis.

43
Table 16: Fixed effects regression (Country, sector and year fixed effects) with 2-years lag for the trade and regulation variables and FDI restrictions
(1) (2) (3) (4) (5)
VARIABLES TFP growth TFP growth TFP growth TFP growth TFP growth
Technology gap 0.00713 0.0105 -0.000436 0.0143** 0.00442
(0.00639) (0.00747) (0.00554) (0.00674) (0.0313)
High-skiled labor -0.0302 -0.0938*** -0.0307 -0.0309* 0.0400
(0.0222) (0.0357) (0.0426) (0.0176) (0.101)
High-skiled labor*Tech gap 0.0223 0.0665* 0.0129 0.0290 -0.0873
(0.0256) (0.0349) (0.0521) (0.0206) (0.114)
ICT-capital 0.0245 0.0540* -0.00592 0.0475*** -0.0128
(0.0190) (0.0275) (0.0373) (0.0178) (0.152)
ICT-capital*Tech gap -0.0415 -0.0911** -0.0262 -0.0749*** -0.0990
(0.0292) (0.0358) (0.0409) (0.0264) (0.160)
FDI inward stock 0.00228 0.0227
(0.00748) (0.0265)
FDI inward stock*Tech gap -0.00382 -0.0246
(0.00887) (0.0300)
Services imports -6.78e-05 -0.0277
(0.0155) (0.109)
Services imports*Tech gap -0.00700 0.0371
(0.0213) (0.116)
FATS sales -0.000219 0.0141
(0.00588) (0.0218)
FATS sales*Tech gap 0.00132 -0.00433
(0.00630) (0.0177)
FDI inflows 0.00136
(0.00251)
FDI inflows*Tech gap -0.00182
(0.00282)
Entry barriers -0.00586 -0.0218 0.00613 0.00185 0.0824
(0.0253) (0.0155) (0.0224) (0.0170) (0.0884)
Entry barriers*Tech gap 0.0173 0.0177 -0.0125 0.00420 -0.0859
(0.0274) (0.0142) (0.0207) (0.0174) (0.0962)
Conduct regulation -0.139*** -0.0285 -0.124* -0.0984** -0.175
(0.0472) (0.0387) (0.0747) (0.0439) (0.256)
Conduct regulation*Tech gap 0.170*** 0.0284 0.139* 0.0861* 0.208
(0.0534) (0.0419) (0.0803) (0.0496) (0.236)
FDI restrictions 0.0505* -0.0161 0.0335 -0.00550 0.0985
(0.0285) (0.0435) (0.0502) (0.0336) (0.112)
FDI restrictions*Tech gap -0.0744** -0.0461 -0.0701 -0.0147 -0.158
(0.0313) (0.0340) (0.0618) (0.0336) (0.158)
Observations 449 609 335 517 78
R-squared 0.300 0.322 0.329 0.293 0.543
Notes: The dependant variable is the level of TFP Definitions of Entry and Conduct regulations can be found in the footnotes 6 and 7 of Table 2. *, ** and *** denote coefficients significantly different from 0 at, respectively, the 10% (p<0.1), 5% (p<0.05) and 1% (p<0.001) levels. Robust White heteroscedasticity corrected standard errors are given in parenthesis. Boxes in grey stand for their significance in cluster robustness checks by either sector or country. The coefficient in the orange box has been corrected for mean effects in the main text. All veriables are in Δ ln. Tech gap in the interaction variables stands for the technology gap.

44
Table 17: Fixed effects regression (3) with 2-years lag for the trade and regulation variables and FDI regulation. High-skilled labor interactions included. Output for High-skilled labor and ICT (plus their interaction with Technology gap) capital omitted but corrected in the regression
(1) (2) (3) (4) (5)
VARIABLES TFP growth TFP growth TFP growth TFP growth TFP growth
Output TFPgap, hhs and ICT-capit omittted
FDI inward stock 0.000742 -0.00332
(0.00754) (0.0276)
FDI inward stock*Tech gap -0.00222 0.00402
(0.00893) (0.0309)
Services imports -0.00115 -0.129
(0.0157) (0.124)
Services imports*Tech gap -0.00519 0.222
(0.0215) (0.145)
FATS sales -0.000513 0.00522
(0.00583) (0.0232)
FATS sales*Tech gap 0.00125 0.00180
(0.00628) (0.0189)
FDI inflows 0.00111
(0.00258)
FDI inflows*Tech gap -0.00151
(0.00292)
Entry barriers -0.00679 -0.0233 0.0433* 0.00254 0.0557
(0.0284) (0.0171) (0.0262) (0.0165) (0.103)
Entry barriers*Tech gap 0.0165 0.0201 -0.0394* 0.00575 -0.0549
(0.0324) (0.0144) (0.0218) (0.0175) (0.111)
Entry barriers*High-skilled labor 0.0255 0.00836 -0.117** -0.0125 -0.197
(0.0434) (0.0434) (0.0465) (0.0219) (0.268)
Conduct regulation -0.136*** -0.0212 -0.147* -0.0990** 0.0114
(0.0457) (0.0400) (0.0782) (0.0441) (0.209)
Conduct regulation*Tech gap 0.171*** 0.0217 0.159* 0.0868* 0.0272
(0.0520) (0.0425) (0.0824) (0.0501) (0.190)
Conduct reg.*High-skilled labor -0.0436 -0.205 -0.0600 0.000972 -0.673
(0.0944) (0.151) (0.123) (0.116) (0.619)
FDI restrictions 0.0621** -0.00863 0.0416 -0.00477 0.0794
(0.0280) (0.0421) (0.0477) (0.0339) (0.119)
FDI restrictions*Tech gap -0.0831*** -0.0460 -0.0589 -0.0139 -0.0636
(0.0302) (0.0356) (0.0610) (0.0339) (0.149)
FDI restrictions*High-skilled labor -0.157*** -0.181 -0.526*** -0.0242 -1.585***
(0.0594) (0.187) (0.162) (0.0680) (0.508)
Observations 449 609 335 517 78
R-squared 0.306 0.331 0.370 0.295 0.632
Notes: The dependant variable is the level of TFP Definitions of Entry and Conduct regulations can be found in the footnotes 6 and 7 of Table 2. *, ** and *** denote coefficients significantly different from 0 at, respectively, the 10% (p<0.1), 5% (p<0.05) and 1% (p<0.001) levels. Robust White heteroscedasticity corrected standard errors are given in parenthesis. Boxes in grey stand for their significance in cluster robustness checks by either sector or country. The coefficient in the orange box has been corrected for mean effects in the main text. All variables are in Δ ln. Tech gap in the interaction variables stands for the technology gap.

45
Table 18: Extra robustness checks for only Business services fixed effects regression (3) with 2-years lag for the trade and regulation variables and FDI regulation. High-skilled labor interactions included. Output for High-skilled labor and ICT (plus their interaction with Technology gap) capital omitted but corrected in the regression
(1) (2) (3) (4) (5)
VARIABLES TFP growth TFP growth TFP growth TFP growth TFP growth
Output TFPgap, hhs and ICT-capit omittted
FDI inward stock 0.00220 0.000994
(0.0103) (0.0277)
FDI inward stock*Tech gap -0.00351 -0.000364
(0.0115) (0.0310)
Services imports -0.00116 -0.129
(0.0157) (0.121)
Services imports*Tech gap -0.00517 0.214
(0.0215) (0.143)
FATS sales -0.00281 0.0118
(0.00724) (0.0248)
FATS sales*Tech gap 0.00677 -0.00291
(0.00744) (0.0200)
FDI inflows 0.00116
(0.00300)
FDI inflows*Tech gap -0.00179
(0.00327)
Entry barriers -0.00674 -0.0230 0.0409 0.00774 0.0695
(0.0294) (0.0171) (0.0274) (0.0172) (0.104)
Entry barriers*Tech gap 0.0186 0.0200 -0.0352 0.00204 -0.0643
(0.0335) (0.0144) (0.0226) (0.0187) (0.112)
Entry barriers*High-skilled labor 0.00474 0.00709 -0.0962* -0.0156 -0.192
(0.0446) (0.0434) (0.0502) (0.0234) (0.270)
Conduct regulation -0.140*** -0.0215 -0.134* -0.106** -0.0185
(0.0524) (0.0399) (0.0758) (0.0493) (0.216)
Conduct regulation*Tech gap 0.167*** 0.0219 0.129 0.0909* 0.0446
(0.0565) (0.0424) (0.0786) (0.0544) (0.195)
Conduct reg.*High-skilled labor 0.00907 -0.206 0.00833 -0.0143 -0.584
(0.102) (0.151) (0.140) (0.128) (0.638)
FDI restrictions 0.0640* -0.00951 0.0292 0.00514 0.0941
(0.0329) (0.0420) (0.0566) (0.0386) (0.122)
FDI restrictions*Tech gap -0.0771** -0.0454 -0.0254 -0.0238 -0.0863
(0.0343) (0.0354) (0.0707) (0.0375) (0.155)
FDI restrictions*High-skilled labor -0.129* -0.174 -0.520*** -0.00755 -1.456**
(0.0663) (0.187) (0.175) (0.0747) (0.545)
Observations 333 602 258 389 73
R-squared 0.265 0.328 0.348 0.276 0.643
Notes: The dependant variable is the level of TFP Definitions of Entry and Conduct regulations can be found in the footnotes 6 and 7 of Table 2. *, ** and *** denote coefficients significantly different from 0 at, respectively, the 10% (p<0.1), 5% (p<0.05) and 1% (p<0.001) levels. Robust White heteroscedasticity corrected standard errors are given in parenthesis. Boxes in grey stand for their significance in cluster robustness checks by either sector or country. The coefficient in the orange box has been corrected for mean effects in the main text. All veriables are in Δ ln. Tech gap in the interaction variables stands for the technology gap.

46
Table 19: Average Share of High-skilled labor of total labor force per service sector
Service sector
Share of High-skilled labor of total labor force
Business & Renting 29,82
Com Soc Personal services 27,53
Communication services 11,64
Construction 8,05
Distribution services 9,56
Education 47,08
Electr Gas Water 14,97
Fin Ins Real Bus 28,49
Finance 26,03
Health 26,49
Other Personal services 16,90
Public Administration 24,96
Real Est. Rent. Business 29,35
Real Estate 25,96
Tourism 7,21
Transport services 7,81
Transp Storage & Communication 8,63
Source: EUKlems, author’s calcualtions