what are eu trade preferences worth for sub...
TRANSCRIPT

Chapter 3
What Are EU Trade Preferences Worth for Sub-Saharan Africa and Other Developing
Countries?
Fabien CANDAU Sébastien JEAN#
# Fabien Candau was a PhD Student with the CATT, University of Pau. Sébastien Jean was Senior Economist with CEPII (Paris) when this study was written. This study has benefited from partial financial support by the World Bank. It also received partial financial support under the “Agricultural Trade Agreements (TRADEAG)” project, funded by the European Commission (Specific Targeted Research Project, Contract No. 513666). We thankfully acknowledge Lionel Fontagné's contribution to an earlier stage of this work. We are grateful to the European Commission services for giving us access to the customs data. We especially thank Reinhard Binder, Xavier Pichot, David Laborde, Jacques Gallezot for their help and comments, Stefano Inama and Louise Curran for useful suggestions, and Will Martin for guidance. Corresponding author: Sébastien Jean (laure.boivin @ cepii.fr).

What Are EU Trade Preferences Worth for Sub-Saharan Africa and Other Developing Countries?
As then-EU Trade Commissioner Pascal Lamy (2002, p.1403) put it, “in the days before we had a Common Foreign and Security Policy, […] the principal instrument of EU foreign policy was trade preferences”. This has led to a situation where “the EC maintains preferential trade arrangements with virtually all countries” (Sapir, 1998, p. 717), the only exception being North Korea and a handful of non-European developed countries. In a context where the EU is by far the largest market for developing countries’ agricultural exports in general, and is especially important for most former colonies, the EU’s trade preferences are thus important in a development perspective. This is undoubtedly what the Ministers of Trade of the Member States of the African Union had in mind when they recognised, in the Grand-Baie Declaration (June 20th, 2003), "the vital importance of long standing preferences for African countries", and subsequently expressed in three occasions their concerns about the erosion of preferences; these concerns are echoed by specific provisions in the draft modalities for market access liberalisation in the Doha Round (WTO, 2008a and b).
As a matter of fact, preferential trade arrangements (PTAs), whether reciprocal or not, play a central role in shaping trade opportunities for numerous developing countries, notably for the poorest ones. This is especially the case for sub-Saharan African countries, due to the non-reciprocal preferences they are granted, in particular through the Cotonou Partnership Agreement (CPA). The prospect of multilateral liberalisation thus raises serious concerns about the erosion of these preferences and its possible consequences (Bouët et al., 2005).
This work studies how effective EU's1 preferential agreements are in granting developing countries improved market access. How far are preferences indeed utilised by exporters, when entering the EU's market? What is their value for receiving countries? The EU case raises several methodological issues due to the complexity of European trade policy, with numerous, frequently overlapping preferential arrangements. Our analysis focuses on non-reciprocal preferences granted to developing countries, and particularly on sub-Saharan African countries.2 Still, the empirical work will cover all agreements and all partners, both to give a complete picture, and because of the difficulty to analyse some schemes separately from others.
Analysts typically assess the consequences of these trade preferences on the basis of statutory protection, i.e. of the preferential access exporters are eligible for. This, however, does not necessarily reflect the protection level faced in practice. Indeed, benefiting from a preferential scheme requires complying with several requirements, technical, administrative, or Rules of
1 Formally, trade policy is conducted by the European Community. For ease of exposition, we will only refer in what follows to the European Union (EU).
2 From a pure trade policy point of view, it is customary to consider sub-Saharan African countries together with Caribbean and Pacific countries, due to the importance of EU-ACP preferential agreements. Still, these country groups are far from homogenous in other respects. In particular, Sub-Saharan African countries’ external trade exhibit a higher dependency with regards to the EU, while the US make up for a large part Caribbean countries’ exports, as Australia and New-Zealand do for Pacific ACP countries.

2
Origin. Given the cost and sometimes the complexity of these constraints, the benefit of preferential agreements cannot be considered as automatic, costless nor unconditional. On the contrary, recent studies suggest that EU preferences are systematically under-utilised by exporters (Brenton and Manchin, 2003; Brenton, 2003) with an especially thin utilisation of the EBA initiative. This finding is not uncontroversial, however. Inama (2003) shows that utilisation of LDC-ACP preferences has been "above 70 per cent on average for the whole period 1998-2002", and emphasises that utilisation depends on a number of factors, such as the extent of the preference, supply capacity and rules of origin implications. Gallezot (2003) finds that a large proportion of the EU’s agricultural imports use a preferential rate.
These results might seem contradictory at first glance. However, they do not deal exactly with the same problem. For instance, Brenton (2003) focuses on the utilisation of the EBA initiative (including the year when it was first implemented, 2001), while Gallezot takes a broader measure, by studying the utilisation of any of the preferential agreements the exporter is eligible for. Indeed, EU's trade policy is fairly complex, and numerous trade partners benefit from various preferential agreements, as it is the case for sub-Saharan Africa LDCs with the EBA initiative and the Cotonou agreement. The analysis of preference utilisation must therefore be adapted to this specific context, where, in addition to the administrative requirements, the rules of origin vary from one agreement to the other. The utilisation of a given preferential scheme cannot be properly studied without taking into account whether an alternative preferential scheme is offered to the exporter. This is an important premise of our analysis, which will take a broad view of all preferential agreements offered by the EU, whether reciprocal or not.
We also argue that the level of the preferential margin (i.e., the difference between the preferential and the MFN applied duty) should be accounted for. The economic significance of a given scheme (and of its possible under-utilisation) is obviously higher, the higher the preferential margin. This is why we also make use of detailed data about EU's statutory protection, in association with customs declarations.
While all partners are covered, our analysis devotes special attention to sub-Saharan African countries, for which the trade relationship with the EU is of particular relevance, and for which most concerns have been voiced about the erosion of preferences resulting from future multilateral liberalisation. Our study makes use of 2001 data. Not using more recent data is frustrating, but this is the most recent year for which complete statutory and customs data is available to us at the tariff line level. More recent anecdotal evidence suggests in addition that the situation did not dramatically change during the recent years.
1 European trade policy: The scope and depth of preferential agreements
The EU is by far the largest contributor to the proliferation of trade agreements worldwide, with more than 50 RTAs notified to the WTO up to 2003. As illustrated by Figure 1, even a simplified overview of the EU's trade policy remains quite intricate. The political economy roots of this proliferation of agreements belong to the heterogeneity of the EU, to the specific role played by its trade policy –for long the only Community competence in terms of foreign policy-, and by the strong demand from trading partners, as is described in Sapir (1998, see also Lamy 2002, and Panagariya 2002).
Besides partners’ diversity, two kinds of schemes must be distinguished from the outset: free-
3
trade agreements (FTAs) are bilaterally agreed, reciprocal commitments between the parties; non-reciprocal schemes are unilaterally granted by the EU to developing countries. While the former are intended to be a tool of regional economic integration (with legal basis in the multilateral arena under GATT's Article XXIV), the latter grant developing countries more favorable treatment (as authorised either under the Enabling Clause, or through specific WTO waivers). The non-contractual nature of several non-reciprocal schemes (the GSP, in particular) also involves uncertainty as to their future (except for the EBA initiative, see below), since they can be unilaterally changed.
These numerous agreements can be classified into a few categories. A first set includes close neighbourhood, reciprocal agreements within Europe, including the EU-EFTA agreement, bilateral free-trade agreements with Central and Eastern European Countries (CEECs), and a few additional bilateral agreements. Some of these are now defunct but this categorisation is relevant for year 2001.
The other agreements concern developing countries. The most inclusive is the GSP, which grants a non-reciprocal, preferential access for a large scope of products, although with a limited preferential margin for so-called “sensitive products”. The GSP is also characterised by its temporary nature, and is subject to periodic revisions. Graduation measures (i.e. exclusion of some or all products from the scheme) are taken when "beneficiary countries may have reached, in certain sectors, a level of competitiveness which ensures further growth even without preferential access to the EU market" (European Commission). The GSP is associated with relatively stringent rules of origin. No diagonal cumulation3 is allowed among beneficiaries of the GSP scheme, except under a handful of regional agreements (among which ASEAN and SAARC4). A special and more beneficial regime has in the past been granted to countries fighting drugs (in 2001, only Central American and Andean Pact countries were concerned).5 The latest GSP revised this approach and provides very generous preferences to countries which demonstrate a commitment to sustainable development through ratification of key international treaties and conventions.
3 Diagonal cumulation means that intermediate inputs originating from other countries benefiting from the schemes can be taken into account as local in order to fulfil the conditions required ton confer origin to the exported product.
4 South Asian Association for Regional Cooperation.
5 Pakistan has subsequently benefited from this regime. Note in addition that two additional incentive clauses, linked to fundamental social rights and environment protection, were unused in 2001.

Figure 1: EU's trade policy in 2001
GuatemalaAustralia
Bulgaria
Canada
Estonia
Hong Kong
Hungary
Israel
Japan
Korea, Rep.
Macao
Mongolia
New Zealand
Poland
Romania
Singapore
Turkey
Swaziland
Lithuania
Taiwan
Korea, Dem. Rep.
Algeria
Cyprus
Egypt
Lebanon
MaltaMorocco
SyriaTunisia
Micronesia
ArmeniaAzerbaijan
Belarus
Bosnia & HerzegovinaChina
Iran
Iraq
Kyrgyzstan
Libya
Moldova
Palau
Russia
Saudi Arabia
Tajikistan
Turkmenistan
Ukraine
Vietnam
Yemen
Uzbekistan
Marshall Isl.
Oman
Nauru
Albania
ArgentinaBahrain
Brazil
Brunei
Ivory Coast
Croatia
Cuba
Georgia
GuyanaIndonesia
JordanKazakhstan
Malaysia
Mali
Mexico
Namibia
Pakistan
Paraguay
Philippines
Qatar
St. Kitts
Slovenia
South Africa
Sri Lanka
Thailand
UruguayIndia
Dominican Rep.
Kuwait
Laos
Afghanistan
Nepal
Bhutan
Cambodia
Maldives
MyanmarBangladesh
Bahamas
Cape Verde
Comoros
Congo Dem.Rep.
Eq. Guinea
Eritrea
Ethiopia
Kiribati
Liberia
Samoa
Seychelles
Somalia
Sudan
Tonga
Tuvalu
Vanuatu
Sao Tome
Antigua
Belize
Benin
Botswana
Burkina Faso
Burundi
Cameroon
Barbados
Ctrl. Afr. Rep.
Chad
Congo
Djibouti
Dominica
Fiji
Gabon
Gambia
Ghana Grenada
Guinea
Guinea-BissauHaiti
Jamaica
Kenya
Lesotho
Madagascar
Malawi
Mauritania
Mauritius
Mozambique
NigeriaPapua
St. Lucia
St. Vincent
Sierra Leone
Tanzania
Togo
Trinidad
Uganda
Zambia
Zimbabwe
W.T.O.
G.S.P
Andean Group
A.C.P. C.A.C.M.
L.D.C.
Euromed
E.F.T.A.
Chile
Rwanda
Angola
E.E.A.
Czech Rep.
Bermuda
Senegal
Niger
Slovakia
YugoslaviaMacedonia
Suriname
Latvia
East Timor
Solomon Isl.
Greenland
Montserrat
Aruba
Anguilla
Gibraltar
Niue
Tokelau
Cook Isl.
Costa RicaNicaragua
HondurasEl Salvador Panama
Norway
LiechtensteinIceland
Switzerland
Peru
Bolivia
VenezuelaEcuador Colombia
U.A.E
U.S.
Andorra
Palestinian auth.
C.F.D..
Source: authors' revision, based on Bouët et al., 2002.
Note: An underlined country's name signals a bilateral agreement with the EU. This figures is simplified representation of EU's trade agreements in 2001. It does not pretend to be exhaustive, and it does not show the variation across country of the product coverage of agreements.
In addition, starting from March 2001, the EBA initiative grants duty-free, quota-free access to LDCs for all products but arms, with a delayed implementation for sugar, rice and bananas. Although embedded in the GSP scheme and thus associated to the same general rules, EBA is not restricted by any limitation on duration, coverage or protection measure.
The last set of agreements includes a number of bilateral and regional agreements (like those with Mediterranean countries, South Africa and Chile), offering deeper preferences than those which they would have been entitled to under the GSP. The Cotonou Partnership Agreement between the EU and ACP countries, following upon former Lomé conventions, is especially noteworthy: this non-reciprocal agreement grants duty-free access to the EU market to most ACP products (as well as important preferential tariff quotas), and is of particular relevance to benefiting countries.6 The Cotonou Agreement allows full cumulation, whereby all operations carried out in the participating countries are taken into account in conferring origin. This is far
6 The WTO waiver for this agreement is due to expire by the end of 2007, and reciprocal Economic Partnership Agreements by group of countries are being negotiated to replace it. Although we do not deal directly with this perspective here, this should of course be an essential element of any prospective outlook.
4

more liberal than the GSP rules of origin, which only allows for bilateral or (in the above mentioned specific cases) diagonal cumulation.7 In addition, the "general tolerance rule”, permitting manufacturers to use non-originating materials up to a specific percentage value of the ex-works price is higher under the Cotonou agreement than under the GSP (15% instead of 10%; see Brenton, 2003, for more details).
Table 1: Protection faced in Quad markets in 2001, by partner and sector
Panel A. Average AVE protection by sector and by partner (%)
Importer: Agric. Manuf. Textile Rich DCs LDCsCanada 14.4 1.6 12.6 3.7 3.1 6.3 3.5European Union (15) 16.2 1.8 6.4 3.6 2.9 0.8 3.2Japan 28.7 0.6 9.9 3.9 3.4 1.9 3.7United States 5.2 1.4 10.4 2.4 2.6 5.9 2.4
By sector By partner Total
Panel B. Average AVE protection by sector, for each partner (%)
Partner:Importer: Agric. Manuf. Textile Agric. Manuf. Textile Agric. Manuf. TextileCanada 18.1 2.0 11.5 5.8 0.7 13.4 0.4 0.0 16.2European Union (15) 18.5 2.5 6.6 14.7 0.8 6.5 2.8 0.0 1.0Japan 33.0 0.7 10.2 18.1 0.4 10.1 11.6 0.2 0.1United States 5.8 1.6 9.7 3.7 0.8 10.9 5.2 0.1 13.0
Non-LDC developing coun.Developed Countries LDCs
Source: Bouët et al. (2004b), based on MAcMap.
Note: "Agric." refers to agriculture and agrofood. "Textile" refers to textile, clothing, leather and leather products.
Compared to other Quad markets, the preferential margin offered to developing countries appears relatively high in the EU (Table 1). This especially clear for LDCs, for which the AVE protection faced appears to be close to zero, as a result of the EBA initiative. For non-LDC developing countries, the average preferential margin in the EU market is small (0.8 percentage points), but still better than what is available in other Quad markets. In manufacturing, protection is low, but is virtually zero for developing countries, apart from textiles and clothing. In textiles and clothing, non-LDC developing countries do not benefit from any significant preferential margin. In agriculture, the margin is almost 4 points for non-LDCs, and as much as 15.7 percentage points for LDCs. Note however that the average
7 In contrast to full cumulation, diagonal cumulation requires that intermediate inputs be themselves granted originating status.
5

6
preferential margin offered to developing countries (either LDC or not) for agricultural products is higher in Canada and in Japan, while it is almost zero in the US for LDCs.8
In setting the stage, it is also worth emphasising the particular importance of the European market for developing countries. The case of agricultural products is especially relevant, given both the high level of trade barriers in this sector, and the overwhelming importance of these products in developing countries’ exports. As illustrated by Table 2, the EU-25 imports of agricultural products from developing countries were significantly higher in 2001 than the sum of US and Japanese imports. Among providers, developing countries (and especially LDCs) accounted for a far larger share of agricultural imports in the EU than they did in the US or in Japan. These figures emphasise the potential importance of EU’s trade preferences to developing countries. It is therefore worth assessing what their use is in practice.
Table 2: Agricultural imports in the Triad countries in 2001, by groups of exporters EU25 US Japan
Value (M $) Share
(%) Value (M $) Share
(%) Value (M $) Share
(%)
Developed 15,918 30.5 24,532 56.5 20,982 69.3 Developing except G-90 27,708 53.1 17,409 40.1 8,750 28.9 G-90 8,566 16.4 1,444 3.3 542 1.8 Total 52,192 43,384 30,273
Source: Calculations based on CEPII's BACI database.
Note: the G-90 (Group of 90) is composed of all LDCs and of all members of the African Union (which itself includes virtually all African countries).
2 The use of EU preferences: prima facie evidence Since conditions are attached to the benefit of trade preferences, their value is not only a question of statutory advantages, but also of benefits reaped in practice. In this section, we reconsider the evidence about the utilisation of EU's preferential schemes, based on detailed customs declarations. Given the existence of competing preferences for several partners, this is done for the most beneficial scheme available to each exporter, but also by considering whether at least one preferential scheme is used.
2.1 Related literature
Benefiting from a preferential scheme requires complying with several requirements: purely administrative issues, technical requirements, other specific conditions, and, in particular,
8 How far this is due to the partial enforcement of AGOA in 2001 remains an open question.
7
rules of origin (RoOs). Given the cost and sometimes the complexity of these constraints, the benefit of preferential agreements cannot be considered as automatic, costless nor unconditional. Hence there is a need to assess to what extent EU trade preferences are indeed used by exporters, and what their value is.
RoOs specify criteria required for commodities to be considered as originating in the country, and therefore to be eligible for preferential treatment. Local content requirements (usually expressed as a minimum share of local value added) and sufficient transformation (as witnessed for instance by a change in classification heading) are the most common criteria used in practice. RoOs are justified by the need to avoid trade deflection, i.e. re-exporting through the preference-receiving country of goods essentially produced in a third country. RoOs avoid misuse of preference schemes, arguably reinforcing the benefit of the scheme for the preference-receiving country to the extent that they create an incentive to invest in the preference-receiving country in order to benefit from preferential market access.
However, there is a direct cost associated with meeting RoOs. Required administrative paperwork is potentially cumbersome and costly if it requires operating a parallel accounting system differing in definition and scope from the system required by domestic laws.9 RoOs also constrain the sourcing of intermediate inputs. These costs have been the subject of close scrutiny, because of the widespread suspicion that requirements associated with preferential agreements, and especially RoOs, are used as protective measures that undermine the benefit of preferential access (Krueger 1993, Krishna and Krueger, 1995, Falvey and Reed, 1998). Falvey and Reed (2002) show that RoOs allow the importing country's terms of trade to be improved in both final and intermediate goods, and can be a complementary tool to the optimal tariff. It has also been argued that RoOs are used in some instances as export subsidies, insofar as restrictive rules can create an incentive for the preference-receiving country to source its inputs in the preference-granting country (Cadot et al. 2004). The effect of RoOs depends however on their nature, on the time period of the analysis (short run versus long run) and on market structure (see Krishna and Krueger, propositions 1 and 2). Moreover, the impact is not necessarily a monotonic function of the rule’s restrictiveness.10
The magnitude of these costs is difficult to assess. Based on indirect evidence, several studies estimate the administrative compliance costs of preferential schemes to be between 1 and 5 percent of the value of exports (see Herin, 1986; Anson et al., 2003), depending on the precise nature of the requirements and on the technical capacity of exporters to comply with them. Non-administrative costs, linked in particular to the constraint on sourcing imposed by RoOs, vary even more across products and countries. They depend in particular on the existing possibilities to split the value-added chain for the product, and on the status of competitive input providers with regard to the agreements. In addition, different types of RoOs are used (see e.g. Estevadeordal and Suominen, 2003), the restrictiveness of which differs widely. Based on the detailed work undertaken by Estevadeordal (2000), several studies have focused on NAFTA and found that RoOs hamper Mexican exports to the US, in particular in the
9 See for example UNCTAD (2003b, p. 54) and Inama (2003).
10 Ju and Krishna (2002, 2005) demonstrate that if the exporting intermediate sector is more protected than the final sector, then the effect of RoOs in the two sectors goes in opposite direction i.e. intermediates price (and final good imports) follow a bell-curve with the increase in the RoO’s restrictiveness, while final good price (and intermediate imports) follows a U-curve. The top and down of these curves are reached when firms prefer to disregard RoOs, import inputs and pay the MFN.
8
automotive and textile-clothing sector (Cadot et al. 2002, Anson et al. 2004). Their cost varies with the nature of the rule, but the overall cost seems to be close to the preferential margin itself, suggesting that the value of the agreement would be very low for Mexican exporters. Studying FTAs between the EU and CEECs, Brenton and Manchin (2003) also conclude that the rules associated with the agreement preclude exporters from reaping any substantial benefit, as evidenced by the very poor utilisation of these agreements.11
Non-reciprocal preferences face the same kind of issues, but the above-mentioned results need not apply in this case because of the differences in rules applied, product specialisation, and in the income levels of exporters. Recent studies suggest that preferences are systematically under-utilised by exporters. Brenton and Manchin (2003) found that only 35% of CEECs’ exports enter the EU using the lowest tariff for which they are eligible. Reporting that the EBA initiative was very poorly utilised by LDC exporters to the EU in 2001, Brenton (2003) cast doubts on the actual benefit of this preferential scheme, and pointed to the stringency of rules of origin as the main culprit. Mattoo et al. (2003) make a similar point as far as AGOA is concerned, showing that rules of origin, in particular, strongly undermine the "generosity" of this scheme. Using a general equilibrium model, they argue that the benefit of AGOA would have been five times greater without RoOs ($540 million instead of 140 million).
Gallezot (2003), in contrast, found that a large proportion of the EU’s agricultural imports benefited from a preferential rate. Inama (2003), found that 62% of imports of Quad countries from all beneficiaries of GSP schemes were actually covered by preferences in 2002. But only 39% of the eligible imports were shipped under such schemes. Turning to LDCs only, 64% of imports were covered but preferential treatment was successfully requested for no more than 43% of eligible imports. Regarding the EU, the utilisation rate was 40% for LDCs, to be compared with 30% for Japan, in 2001. Under the AGOA scheme, the utilisation rate was 67% for mineral products, which account for 90% of total imports receiving preferential treatment in the US, with a very tiny preference margin; for textiles and clothing, however, the utilisation rate was only 36% (for a more specific assessment of US preferences, see the Chapter by Dean and Wainio).
Studying the utilisation of various preferential schemes separately may be misleading. When a country is eligible for several preferential schemes (and this is the case with numerous developing countries, as far as access to the EU or the US market is concerned), an under-utilisation of a given scheme can merely mean that another scheme is judged more beneficial by the exporter. In this case, under-utilisation may not be a problem, since the exporter still enjoys the benefit of preferential access, although the preference margin available under the chosen scheme may be lower than under the one with more restrictive rules. The very low utilisation rate of EBA among ACP LDC countries might well mean that exporters prefer to use the preferential access offered through the Cotonou agreement, which they have used for a long time12 and which has less restrictive rules of origin (Inama, 2003). Gallezot and Bureau (OECD, 2005) show that when due account is taken of these competing preference schemes, EU and US non-reciprocal trade preferences are around 90 percent utilised in agricultural
11 They found that only 35 percent of CEECs’ exports enter the EU using the lowest tariff for which they would be eligible.
12 The EU's non-reciprocal preferences to ACP countries were intiated with the Yaoundé's Convention in 1964, and followed up until year 2000 by four "Lomé Conventions".

9
products. They also show that the existence of an alternative preferential regime considerably lowers the utilisation of a given preferential scheme, and that this explains the poor utilisation of the EBA initiative by sub-Saharan African countries. This is paralleled by Wainio and Gibson's (2003) analysis of US non-reciprocal preferential regimes for agricultural products, which also found them to be utilised by more than 90% of eligible imports.
In summarising four case studies carried out on Botswana, Kenya, Lesotho and Mauritius, Stevens and Kennan (2004) report that very few exports (1 to 6 percent) from these countries to the EU do not benefit from any preference (or from zero MFN duty). As they put it, it is "inherently implausible that for the countries and product studied preferences have not been well utilised", given the magnitude of preferential margins, and the place they take in the long-standing structure of these countries exports. In addition, Stevens and Kennan report that a detailed analysis does not point to product coverage significantly limiting the benefit of the Cotonou agreement (except due to quantitative limitations linked to preferential tariff quotas). Indeed, no significant exports are made to the EU, nor to other Quad markets, of products for which preferences were not available (Stevens and Kennan 2004, p. 8).
2.2 The data
The main source available to study the utilisation of preferences in EU's market is the Single Administration Declarations (SAD), collected by national customs, and put together by Eurostat.13 This database makes it possible to know, for each tariff line, the value and volume of imports by requested preference regime. Seasonal tariffs are treated using several lines (one for each period of time), additional information is available about the use of a quota, and about tariff suspensions. The analysis is carried out here based on summer 2003's release of the 2001data.14
It should be emphasised at the outset that the preference regime notified in the data is the regime requested by the exporter, not the regime finally used. In other words, no information is available about the determination made by custom officers. This explains why a significant proportion of the declarations are inconsistent: this occurs for instance when an exporter requests a regime for which he is not eligible. Obvious inconsistencies need to be corrected during the statistical treatment.
In order to judge the consistency of custom declarations, detailed information is required about the regime for which exporters are eligible. This includes the countries covered by each agreement, but also the product coverage of each agreement, given that this product coverage varies in some instances from one partner to the other, due to product exclusions. An important example is graduation measures under the GSP, for which countries and sectors concerned are determined each year.
13 The EU notifications concerning the use of their GSP scheme also allows GSP imports to be disentangled from other preferential imports.
14 Compared to previous releases, the quality of the database has been strongly improved in this version, both in terms of consistency for countries covered, and through the inclusion of the Netherlands, which were previously missing. The number of inconsistencies in the database is approximately halved in this release, compared to previous ones.
10
In the dataset used, the frequency of inconsistent declarations is about 15%. We exclude these declarations from the calculations of utilisation rates of preferences (and of AVE requested duties, see below).
2.3 The coverage and utilisation rates of EU preferences
The above-described data allows the coverage and utilisation of EU trade preferences to be characterised. This is usually made by first calculating the coverage ratio, i.e. the ratio of imports eligible for the preference regime to dutiable imports, for the (group of) partners and the (group of) sectors considered. The utilisation rate of a given preferential regime is calculated as the share of imports eligible for this regime, that indeed (request to) use it. Inama (2003) also calculates the utility ratio of a preference regime, referring to the share of dutiable imports that actually use a given preference regime.15
This simple arithmetic might be misleading when various preference regimes are available to the exporter. From the comparison of the results obtained respectively by Brenton (2003) and Gallezot (2003), in particular, it follows that while EBA is very poorly utilised in sub-Saharan Africa, the Cotonou agreement is heavily used. This suggests that many LDC African countries continue to use the Cotonou regime, even though EBA would grant them higher preferential margin for some products, notably because 20 years of use made them familiar with the formalities requested under the Cotonou agreement, in particular the "Form EUR I" certificate of origin (Inama, 2003). It is useful to understand why this is the case, but it is also necessary to take stock of the fact that these countries still benefit from a preferential regime.
A preferential regime never covers all products, and product coverage varies widely across agreements. However, for products covered, a preferential agreement generally provides a larger preference margin in comparison to the GSP. The only exception is for LDCs: they are eligible for the EBA initiative as a special clause of the GSP scheme, and the EBA is the best regime available to them in terms of statutory tariff duties, even when they are eligible for another preferential agreement, as is the case with ACP LDCs. The latter case is intricate since EBA is nevertheless associated with tighter RoOs, so that the “best” preferential regime in terms of tariff duty is not necessarily the best one in terms of associated constraints.
This implies that measuring the utilisation rate of a preference regime that is not the most favourable in terms of tariff duties does not always make sense: this regime ought not be largely utilised if a better one exists in terms of RoOs/cumulation. For sub-Saharan African LDCs, for instance, the utilisation rate of the Cotonou regime is, to some extent inappropriate,16 as is the utilisation of the GSP for a non-LDC that also benefits from a preferential agreement, as for instance Morocco or Tunisia.
Taking into account this hierarchy between preferential schemes, we calculate two kinds of utilisation and coverage rates for each type of partners: the rates corresponding to the most
15 The utility ratio is thus the product of the coverage ratio by the utilisation ratio.
16 This statement might seem contradictory with the practice, given the high utilisation of the Cotonou agreement. Still, it would be logical, in theory to use EBA instead of Cotonou on products where the former offers additional preferences. In such a case, not using the Cotonou preference should not be interpreted as "under-utilisation" of this preference scheme.
11
favorable preference regime in terms of tariffs (GSP in the case of LDCs, other preferential agreements for non-LDCs also eligible to the GSP); and the rates of coverage and utilisation of "at least one" preference regime, with the corresponding straightforward definitions. By definition, the coverage rate is superior when more than one preference regime is available, but this is not necessarily the case for the utilisation rate. The utilisation and coverage rates are computed by grouping partners together according to the preference regime they are eligible for, treating LDCs and sub-Saharan African (SSA) countries separately (each group's composition is spelt out in the Appendix).17
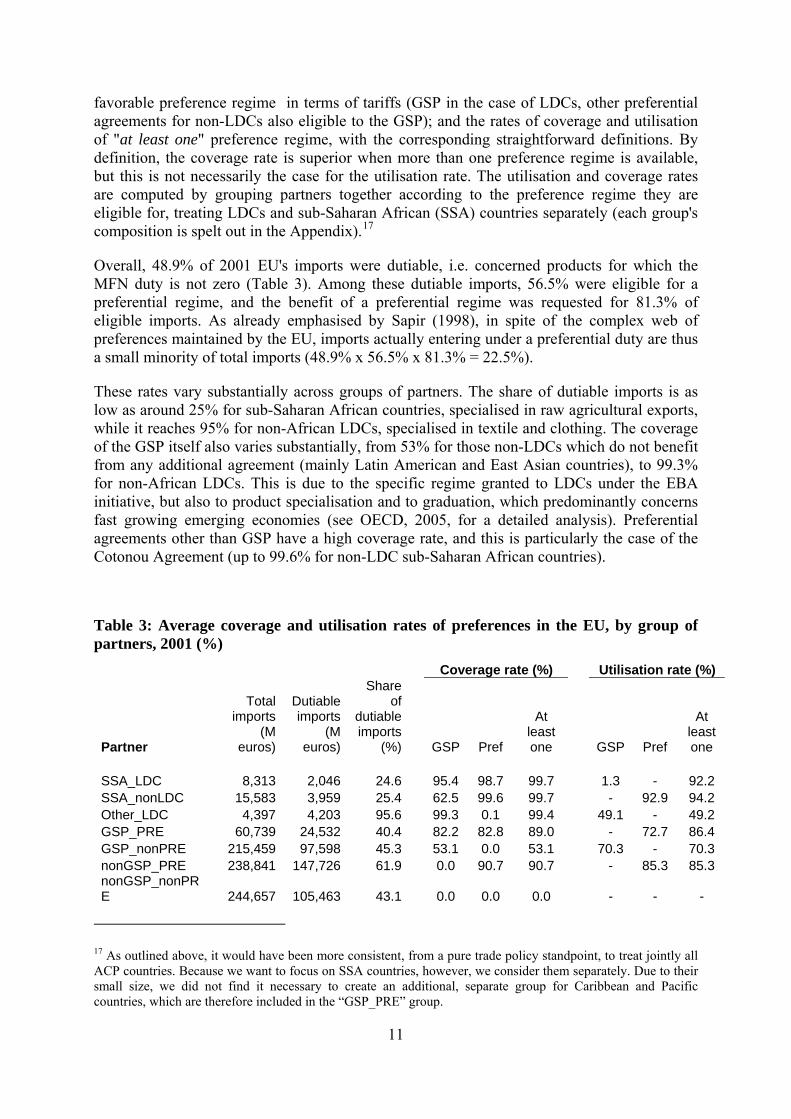
Overall, 48.9% of 2001 EU's imports were dutiable, i.e. concerned products for which the MFN duty is not zero (Table 3). Among these dutiable imports, 56.5% were eligible for a preferential regime, and the benefit of a preferential regime was requested for 81.3% of eligible imports. As already emphasised by Sapir (1998), in spite of the complex web of preferences maintained by the EU, imports actually entering under a preferential duty are thus a small minority of total imports (48.9% x 56.5% x 81.3% = 22.5%).
These rates vary substantially across groups of partners. The share of dutiable imports is as low as around 25% for sub-Saharan African countries, specialised in raw agricultural exports, while it reaches 95% for non-African LDCs, specialised in textile and clothing. The coverage of the GSP itself also varies substantially, from 53% for those non-LDCs which do not benefit from any additional agreement (mainly Latin American and East Asian countries), to 99.3% for non-African LDCs. This is due to the specific regime granted to LDCs under the EBA initiative, but also to product specialisation and to graduation, which predominantly concerns fast growing emerging economies (see OECD, 2005, for a detailed analysis). Preferential agreements other than GSP have a high coverage rate, and this is particularly the case of the Cotonou Agreement (up to 99.6% for non-LDC sub-Saharan African countries).
Table 3: Average coverage and utilisation rates of preferences in the EU, by group of partners, 2001 (%) Coverage rate (%) Utilisation rate (%)
Partner
Total imports
(M euros)
Dutiable imports
(M euros)
Share of
dutiable imports
(%) GSP Pref
At least one GSP Pref
At least one
SSA_LDC 8,313 2,046 24.6 95.4 98.7 99.7 1.3 - 92.2 SSA_nonLDC 15,583 3,959 25.4 62.5 99.6 99.7 - 92.9 94.2 Other_LDC 4,397 4,203 95.6 99.3 0.1 99.4 49.1 - 49.2 GSP_PRE 60,739 24,532 40.4 82.2 82.8 89.0 - 72.7 86.4 GSP_nonPRE 215,459 97,598 45.3 53.1 0.0 53.1 70.3 - 70.3 nonGSP_PRE 238,841 147,726 61.9 0.0 90.7 90.7 - 85.3 85.3 nonGSP_nonPRE 244,657 105,463 43.1 0.0 0.0 0.0 - - -
17 As outlined above, it would have been more consistent, from a pure trade policy standpoint, to treat jointly all ACP countries. Because we want to focus on SSA countries, however, we consider them separately. Due to their small size, we did not find it necessary to create an additional, separate group for Caribbean and Pacific countries, which are therefore included in the “GSP_PRE” group.

12
All partners 787,988 385,527 48.9 20.4 41.6 56.5 54.2 83.9 81.3 Source: Authors' calculations based on Custom declarations and TARIC.
Note: "SSA_LDC" includes sub-Saharan African countries classified as LDCs; "SSA_nonLDC" refers to other sub-Saharan African countries; "Other_LDC" includes all LDCs outside sub-Saharan Africa; "GSP_PRE" include countries benefiting from both the GSP and a preferential agreement, except those included in the categories above (i.e. sub-Saharan African countries and LDCs); "nonGSP_PRE" refers to countries benefiting from a preferential agreement, but not from the GSP; "nonGSP_nonPRE" includes countries not eligible to any preferential regime.
The utilisation rate of the preferential agreement taken alone is rather low (73%) for GSP countries party to a preferential agreement, but taking into account both schemes leads to autilisation rate of 86% for at least one preferential scheme. Although it cannot be excluded that in some cases, the regime used is not the most beneficial one, this does not reveal any substantial problem of under-utilisation. The lower utilisation (70%) of the GSP regime for non-LDCs entitled to access under this regime ("GSP_nonPRE") is more problematic, since this means that almost one third of their eligible imports enter under the MFN regime. This raises questions about the severity of the constraints associated with use of the EU's GSP scheme. By contrast, the utilisation of the Cotonou scheme by sub-Saharan African non LDC is very high (94%). For African countries, the EBA initiative remained virtually unused. As mentioned above, this is likely to be due to the alternative offered to these countries to benefit from the Cotonou regime, which is already extremely favourable both in terms of rates and of associated constraints, and which exporters are accustomed to. When all preferential agreements offered to sub-Saharan African LDCs are considered together, the utilisation of "at least one" preferential regime turns out to be high, well above 90%. Even for non-African LDCs, for which no alternative preferential agreement exists (except for a few relatively small Caribbean and Pacific states), the utilisation rate does not reach 50%. EBA thus stands out as exhibiting an especially low utilisation rate. However, it is difficult to judge the meaning of this figure, given that EBA was only implemented in March 2001. Not only was the scheme in force over part of the year only, but getting accustomed to the specific requirements associated with a scheme may take time. This is all the more true in poor countries, where information dissemination may be far from perfect.
Although our analysis focuses on 2001, we could investigate the utilisation of the EBA initiative in 2002. For sub-Saharan African LDCs, it increased from 1.3% to 2.8%, which is still a very small figure, due to the above-mentioned “preference” of exporters for Cotonou agreement preferences. For other LDCs, the utilisation rate rose from 49.1% to 54.8%. While slow, this increase suggests that exporters are adapting, and could draw further benefit from this scheme. More time is needed to draw any firm conclusion, but it confirms that working on the initial year of enforcement tends to under-state the potential use of the EBA initiative.
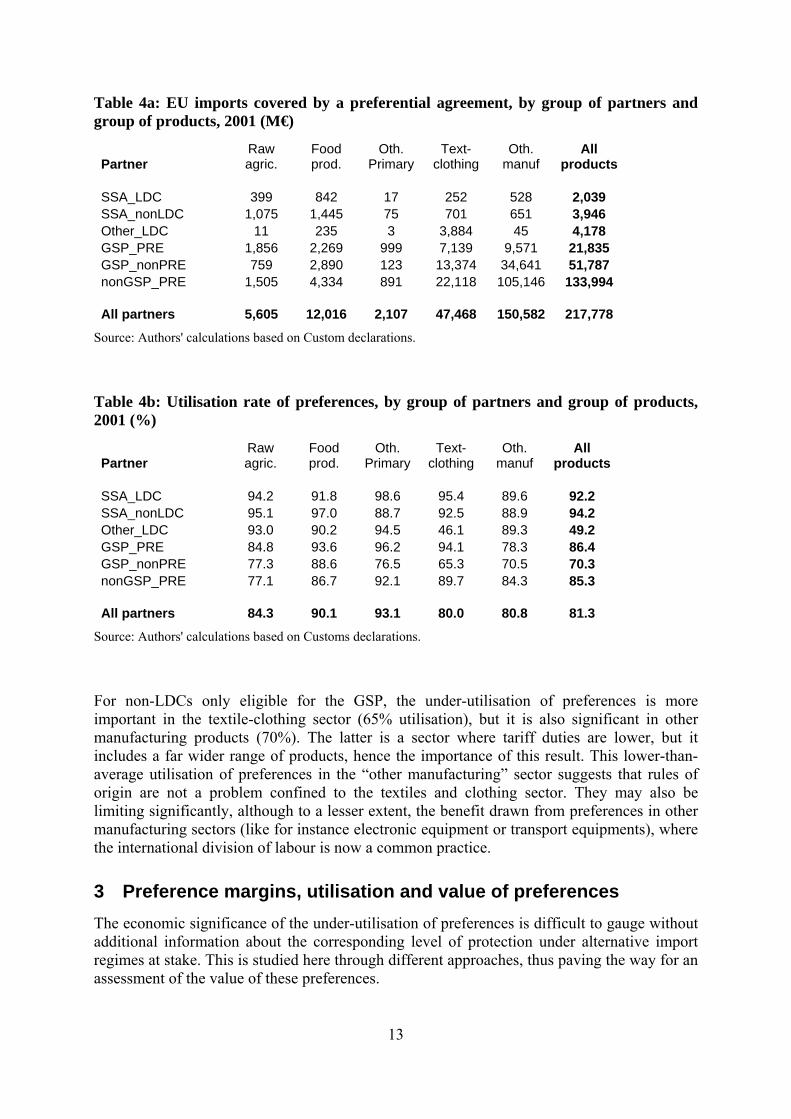
The analysis of the coverage and utilisation of preferences for groups of products sheds more light on some underlying issues (Table 4). For other LDCs, under-utilisation is actually limited to textile and clothing products, which account for the bulk of their exports. It is striking that the utilisation rate is twice as high in other sectors as in this one. Given the well-known importance of rules origin in textile and clothing exports (see e.g. Inama, 2003), this would appear to make intuitive sense.
13
Table 4a: EU imports covered by a preferential agreement, by group of partners and group of products, 2001 (M€)
Partner Raw agric.
Food prod.
Oth. Primary
Text-clothing
Oth. manuf
All products
SSA_LDC 399 842 17 252 528 2,039 SSA_nonLDC 1,075 1,445 75 701 651 3,946 Other_LDC 11 235 3 3,884 45 4,178 GSP_PRE 1,856 2,269 999 7,139 9,571 21,835 GSP_nonPRE 759 2,890 123 13,374 34,641 51,787 nonGSP_PRE 1,505 4,334 891 22,118 105,146 133,994 All partners 5,605 12,016 2,107 47,468 150,582 217,778
Source: Authors' calculations based on Custom declarations.
Table 4b: Utilisation rate of preferences, by group of partners and group of products, 2001 (%)
Partner Raw agric.
Food prod.
Oth. Primary
Text-clothing
Oth. manuf
All products
SSA_LDC 94.2 91.8 98.6 95.4 89.6 92.2 SSA_nonLDC 95.1 97.0 88.7 92.5 88.9 94.2 Other_LDC 93.0 90.2 94.5 46.1 89.3 49.2 GSP_PRE 84.8 93.6 96.2 94.1 78.3 86.4 GSP_nonPRE 77.3 88.6 76.5 65.3 70.5 70.3 nonGSP_PRE 77.1 86.7 92.1 89.7 84.3 85.3 All partners 84.3 90.1 93.1 80.0 80.8 81.3
Source: Authors' calculations based on Customs declarations.
For non-LDCs only eligible for the GSP, the under-utilisation of preferences is more important in the textile-clothing sector (65% utilisation), but it is also significant in other manufacturing products (70%). The latter is a sector where tariff duties are lower, but it includes a far wider range of products, hence the importance of this result. This lower-than-average utilisation of preferences in the “other manufacturing” sector suggests that rules of origin are not a problem confined to the textiles and clothing sector. They may also be limiting significantly, although to a lesser extent, the benefit drawn from preferences in other manufacturing sectors (like for instance electronic equipment or transport equipments), where the international division of labour is now a common practice.
3 Preference margins, utilisation and value of preferences The economic significance of the under-utilisation of preferences is difficult to gauge without additional information about the corresponding level of protection under alternative import regimes at stake. This is studied here through different approaches, thus paving the way for an assessment of the value of these preferences.

14
3.1 Utilisation by level of preference margin
It should not come as a surprise that exporters do not find it profitable to comply with administrative requirements when the preference margin it would provide them is tiny. In contrast, a low utilisation of a preference regime granting a large preferential margin is a clear sign that significant obstacles exist, which prevent exporters from taking advantage of the preference.
In order to take the utilisation of preference into account, it is necessary to match statutory protection with custom duties. Indeed, custom declarations do not provide any information about the level of duties, but only about the preference regime used. This information is thus taken from official information about the EU's statutory protection, as given in the TARIC database. The data used are broken down at the EU's tariff line level, i.e. at the 10-digit level TARIC classification (plus two additional codes). Computing the preference margin requires calculating ad-valorem equivalents of specific tariffs. This is done here using the unit value of imports by partner, at the tariff line level.18
These AVE duties allow the AVE preferential margin to be computed for each product and each preferential regime. In Table 5, the utilisation rate of preferences is broadly related to the preferential margin, calculated for the most favorable regime. It also displays the corresponding share in dutiable exports of each partner, which illustrates the particular importance of trade preferences for LDCs and sub-Saharan African countries: more than 95% of dutiable exports of these partners into the EU are made in products where their preferential margin is higher than 3 percentage points. For non-African LDCs, almost 96% of their exports correspond to products where their preferential margin is higher than 9 points (overwhelmingly, textile and apparel products).
The utilisation rate of preferences may be linked to the magnitude of the preferential margin in two kinds of situation. Firstly, the existence of a significant compliance cost for a given preferential regime should lead exporters not to request this regime, as long as the preferential margin is lower than the compliance cost. Such situation should be reflected in low utilisation for low preferential margins, since compliance costs are generally assumed to be in the order of a few percentage points of total cost. Secondly, preferential access may be associated with restrictive RoOs. When these rules are indeed a binding constraint for exporters, they should lead to a lower utilisation of preferences. And there is no reason to assume a priori that this under-utilisation should be restricted to low preferential margins: if the local content requirement and the rules of cumulation associated with a regime prevent exporters from sourcing their intermediate inputs from the best providers, this might well entail substantial extra-cost, thus possibly leading to under-utilisation of significant preference margins.
Low utilisation of preferences, when the margin is below three percentage points, is indeed observed for LDCs, but this is not very significant given the low amounts concerned. More significant is probably the relatively weak utilisation of the GSP for non-LDCs when the preferential margin is under six percentage points, even though this is the only scheme open to
18 Note however that these unit values suffer from two drawbacks: they lack robustness, and they are likely to present endogeneity (in particular when preference creates a rent, materialising in an above-world average price, see e.g. Olarraega and Ozden, 2005).

15
them. This is consistent with administrative requirements and/or rules of origin being constraining in this case.
When the preferential margin is above six points, however, EU trade preferences are well utilised, with two exceptions: non-African LDCs, for which the utilisation is as low as 49% for products with preferential margins above than nine points; and non-LDCs only eligible for the GSP, with a utilisation rate of 79% for products where the margin is higher than nine points. The first case is difficult to interpret given the introduction of EBA during the year studied. The latter, however, suggests that stringent rules of origin might entail significant cost for one fifth of eligible imports.
Table 5: Coverage and utilisation rates of preferences in the EU, by group of partners and by magnitude of preferential margin, 2001 (%) Share in dutiable imports Utilisation rate
Level of pref. margin 0 [0;3] [3;6] [6;9] >9 [0;3] [3;6] [6;9] >9
Group of partners
SSA_LDC 0.3 2.8 35.9 15.5 45.4 54 93 92 94 SSA_nonLDC 0.3 4.2 21.0 13.6 61.0 71 95 96 95 Other_LDC 0.6 0.0 0.8 2.9 95.7 29 89 58 49 GSP_PRE 11.0 22.1 18.4 18.1 30.3 81 81 91 91 GSP_nonPRE 46.9 25.8 22.1 4.5 0.7 68 69 88 79 nonGSP_PRE 9.3 35.9 20.7 12.9 21.3 82 86 91 87
All preferences 22.2 29.9 20.8 10.3 16.8 78 79 91 85
Source: Authors' calculations based on Custom declarations and TARIC.
Note: The preference margin is calculated as the difference between the AVE MFN rate and the best preferential rate available. The calculation is made at the tariff line level. The AVE of specific tariffs are computed based on worldwide weighted median unit values.
3.2 Utilisation of preferences and "actual" average protection
The link between the level of the preference margin and the degree of under-utilisation can also be summarised by computing average AVE duties. Every exporter has at least access to the MFN regime, without any additional requirements. This can be though of as an upper bound for the level of protection faced. If the exporter complies with administrative requirements, it can at best use the most favourable preferential regime for which he is eligible. Hereafter, this is referred to as the best preferential regime, and it corresponds to the lower bound protection faced by the product. When the utilisation of preferences is imperfect for a given product, some of the exports enter the market using the MFN regime, some of them make use of the best preferential regime, and some of them possibly use another available preferential regime. It is then possible to compute the average AVE duty actually faced by the exporter, i.e. the ratio of tariff receipts to the value of imports. This is hereafter referred to as the average "requested duty".

16
Table 6 shows this average requested duty, compared with the MFN and the best duty, by group of partners and group of products. When aggregating across products and partners, a straightforward calculation provides the import-weighted average. This is a standard way to proceed, and it preserves the definition of the average requested duty as the ratio of tariff receipts to the value of imports. Its obvious drawback, however, is that imports are strongly endogenous to protection: the higher the protection level, the lesser the import value, ceteris paribus. In the presence of trade preferences, products where the preference margin is large (and relatively costless to use) are also likely to be overrepresented. This may bias upward the assessment of the average preferential margin, and of the average utilisation rate.
This is why we also report another average, computed using exports to all markets except the EU. This weighting scheme may better reflect the structure of export specialisation of each country, and its weight as an exporter. This alternative weighting scheme provides an average across all products for all partners, including those products not imported by the EU from the partner at hand. Note, however, that for those "zero-import" products, the requested duty as defined above cannot be used here (since its definition is based upon the regime claimed while importing). We thus report the average across "zero-import products" separately, i.e. across those product-partner pairs for which no import flow is recorded in the EU.
When relying on import-weighted averages, these calculations show that the average requested duty faced by EU's imports is 2.3%, close to the best preferential duty of 2.0%, and substantially lower than the MFN average duty (3.6%). This corresponds to an average utilisation of the preferential margin of 83%, very close to the above-calculated utilisation rate of preferences. Non-African LDCs exhibit the lowest utilisation of the preferential margin (49.2%). They face an average requested duty of 6.0%, while the best preferential duty they are eligible for is as low as 0.1%: they do enjoy an average 5.7 percentage points preferential margin in their exports to the EU, but this is significantly below the 11.6 point preference margin for which they would be eligible. The preferential margin is also significantly under-utilised by non-LDCs only eligible for the GSP, but the margin at stake is rather low in this case (0.8 percentage points).
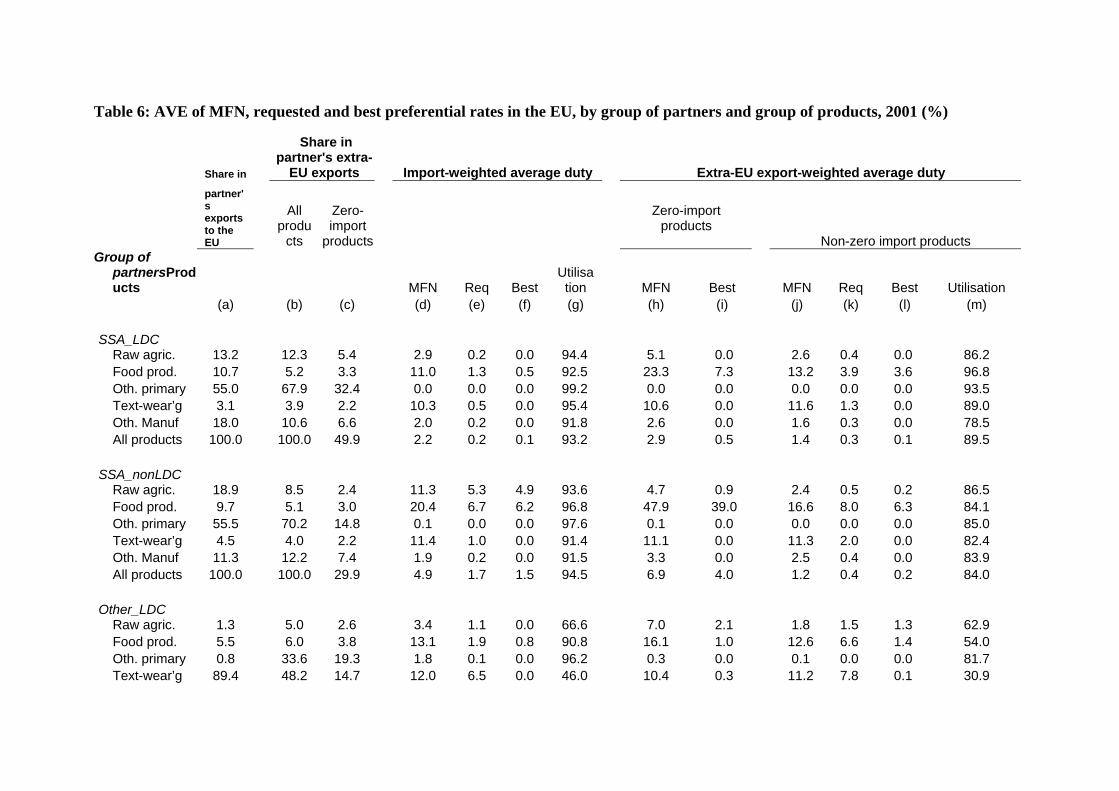
Table 6: AVE of MFN, requested and best preferential rates in the EU, by group of partners and group of products, 2001 (%)
Share in
Share in partner's extra-
EU exports Import-weighted average duty Extra-EU export-weighted average duty
partner's exports to the EU
All produ
cts
Zero-import
products
Zero-import products
Non-zero import products Group of
partnersProducts
MFN Req Best Utilisa
tion MFN Best MFN Req Best Utilisation (a) (b) (c) (d) (e) (f) (g) (h) (i) (j) (k) (l) (m)
SSA_LDC Raw agric. 13.2 12.3 5.4 2.9 0.2 0.0 94.4 5.1 0.0 2.6 0.4 0.0 86.2 Food prod. 10.7 5.2 3.3 11.0 1.3 0.5 92.5 23.3 7.3 13.2 3.9 3.6 96.8 Oth. primary 55.0 67.9 32.4 0.0 0.0 0.0 99.2 0.0 0.0 0.0 0.0 0.0 93.5 Text-wear’g 3.1 3.9 2.2 10.3 0.5 0.0 95.4 10.6 0.0 11.6 1.3 0.0 89.0 Oth. Manuf 18.0 10.6 6.6 2.0 0.2 0.0 91.8 2.6 0.0 1.6 0.3 0.0 78.5 All products 100.0 100.0 49.9 2.2 0.2 0.1 93.2 2.9 0.5 1.4 0.3 0.1 89.5
SSA_nonLDC Raw agric. 18.9 8.5 2.4 11.3 5.3 4.9 93.6 4.7 0.9 2.4 0.5 0.2 86.5 Food prod. 9.7 5.1 3.0 20.4 6.7 6.2 96.8 47.9 39.0 16.6 8.0 6.3 84.1 Oth. primary 55.5 70.2 14.8 0.1 0.0 0.0 97.6 0.1 0.0 0.0 0.0 0.0 85.0 Text-wear’g 4.5 4.0 2.2 11.4 1.0 0.0 91.4 11.1 0.0 11.3 2.0 0.0 82.4 Oth. Manuf 11.3 12.2 7.4 1.9 0.2 0.0 91.5 3.3 0.0 2.5 0.4 0.0 83.9 All products 100.0 100.0 29.9 4.9 1.7 1.5 94.5 6.9 4.0 1.2 0.4 0.2 84.0
Other_LDC Raw agric. 1.3 5.0 2.6 3.4 1.1 0.0 66.6 7.0 2.1 1.8 1.5 1.3 62.9 Food prod. 5.5 6.0 3.8 13.1 1.9 0.8 90.8 16.1 1.0 12.6 6.6 1.4 54.0 Oth. primary 0.8 33.6 19.3 1.8 0.1 0.0 96.2 0.3 0.0 0.1 0.0 0.0 81.7 Text-wear’g 89.4 48.2 14.7 12.0 6.5 0.0 46.0 10.4 0.3 11.2 7.8 0.1 30.9

Share in
Share in partner's extra-
EU exports Import-weighted average duty Extra-EU export-weighted average duty
partner's exports to the EU
All produ
cts
Zero-import
products
Zero-import products
Non-zero import products Group of
partnersProducts MFN Req Best
Utilisation MFN Best MFN Req Best Utilisation
(a) (b) (c) (d) (e) (f) (g) (h) (i) (j) (k) (l) (m) Oth. Manuf 3.0 7.2 4.9 4.2 0.6 0.4 93.8 2.7 0.9 2.1 1.0 0.7 79.1 All products 100.0 100.0 45.3 11.7 6.0 0.1 49.2 5.5 0.4 7.6 5.2 0.2 33.0
GSP_PRE Raw agric. 9.0 3.6 1.3 38.2 35.1 34.1 76.2 16.0 13.6 18.7 17.3 14.8 34.1 Food prod. 5.2 5.4 2.8 9.3 4.0 2.4 76.9 28.4 22.3 15.0 11.3 8.2 54.4 Oth. primary 41.8 19.9 9.6 0.1 0.0 0.0 95.0 0.2 0.0 0.0 0.0 0.0 76.4 Text-wear’g 11.8 9.3 3.8 10.8 0.9 0.1 92.6 10.4 1.2 11.0 8.8 1.3 22.8 Oth. Manuf 32.2 61.8 24.6 2.5 0.8 0.3 75.6 4.0 0.9 4.3 3.3 0.9 29.8 All products 100.0 100.0 42.2 6.0 3.8 3.3 84.0 5.7 2.5 5.2 4.1 1.6 30.4
18
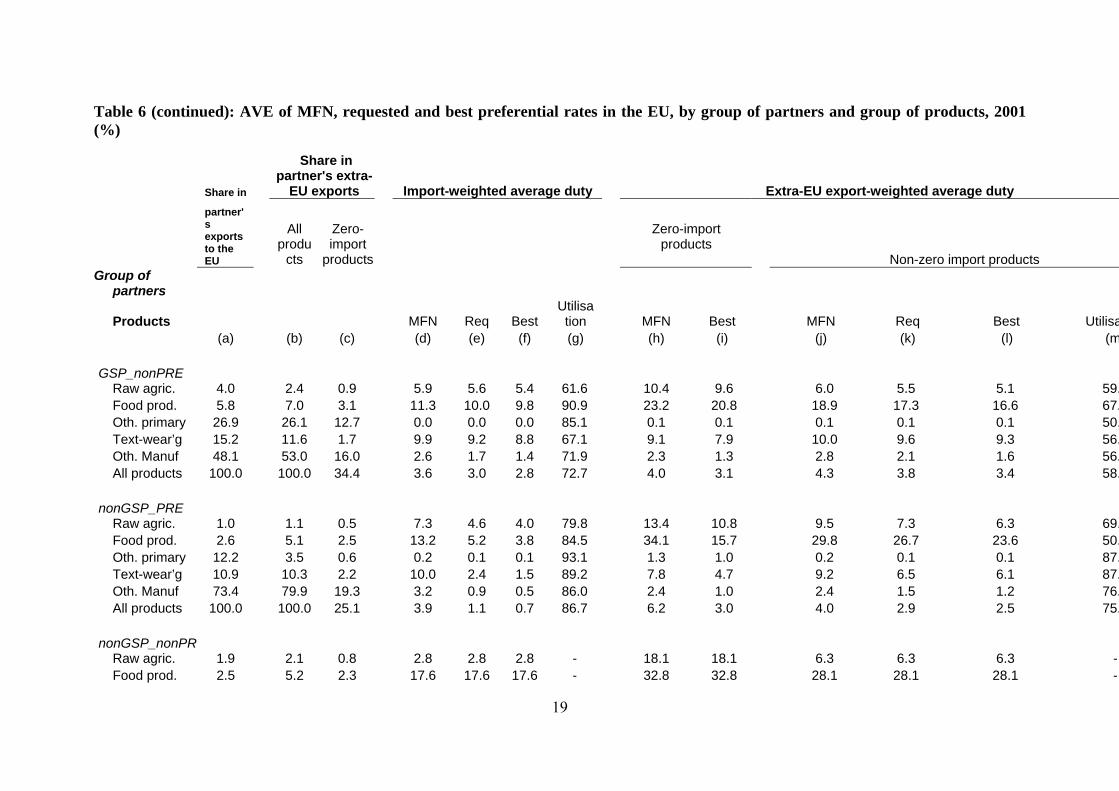
Table 6 (continued): AVE of MFN, requested and best preferential rates in the EU, by group of partners and group of products, 2001 (%)
Share in
Share in partner's extra-
EU exports Import-weighted average duty Extra-EU export-weighted average duty
partner's exports to the EU
All produ
cts
Zero-import
products
Zero-import products
Non-zero import products Group of
partners Products
MFN Req Best Utilisa
tion MFN Best MFN Req Best Utilisa(a) (b) (c) (d) (e) (f) (g) (h) (i) (j) (k) (l) (m
GSP_nonPRE Raw agric. 4.0 2.4 0.9 5.9 5.6 5.4 61.6 10.4 9.6 6.0 5.5 5.1 59.Food prod. 5.8 7.0 3.1 11.3 10.0 9.8 90.9 23.2 20.8 18.9 17.3 16.6 67.Oth. primary 26.9 26.1 12.7 0.0 0.0 0.0 85.1 0.1 0.1 0.1 0.1 0.1 50.Text-wear’g 15.2 11.6 1.7 9.9 9.2 8.8 67.1 9.1 7.9 10.0 9.6 9.3 56.Oth. Manuf 48.1 53.0 16.0 2.6 1.7 1.4 71.9 2.3 1.3 2.8 2.1 1.6 56.All products 100.0 100.0 34.4 3.6 3.0 2.8 72.7 4.0 3.1 4.3 3.8 3.4 58.
nonGSP_PRE Raw agric. 1.0 1.1 0.5 7.3 4.6 4.0 79.8 13.4 10.8 9.5 7.3 6.3 69.Food prod. 2.6 5.1 2.5 13.2 5.2 3.8 84.5 34.1 15.7 29.8 26.7 23.6 50.Oth. primary 12.2 3.5 0.6 0.2 0.1 0.1 93.1 1.3 1.0 0.2 0.1 0.1 87.Text-wear’g 10.9 10.3 2.2 10.0 2.4 1.5 89.2 7.8 4.7 9.2 6.5 6.1 87.Oth. Manuf 73.4 79.9 19.3 3.2 0.9 0.5 86.0 2.4 1.0 2.4 1.5 1.2 76.All products 100.0 100.0 25.1 3.9 1.1 0.7 86.7 6.2 3.0 4.0 2.9 2.5 75.
nonGSP_nonPRE Raw agric. 1.9 2.1 0.8 2.8 2.8 2.8 - 18.1 18.1 6.3 6.3 6.3 - Food prod. 2.5 5.2 2.3 17.6 17.6 17.6 - 32.8 32.8 28.1 28.1 28.1 -
19

20
Share in
Share in partner's extra-
EU exports Import-weighted average duty Extra-EU export-weighted average duty
partner's exports to the EU
All produ
cts
Zero-import
products
Zero-import products
Non-zero import products Group of
partners Products
MFN Req Best Utilisa
tion MFN Best MFN Req Best Utilisa(a) (b) (c) (d) (e) (f) (g) (h) (i) (j) (k) (l) ( m
Oth. primary 3.5 4.0 1.7 0.2 0.2 0.2 - 0.6 0.6 0.5 0.5 0.5 - Text-wear’g 2.0 3.4 0.7 7.1 7.1 7.1 - 6.7 6.7 8.1 8.1 8.1 - Oth. Manuf 90.1 85.2 17.4 2.1 2.1 2.1 - 2.7 2.7 3.3 3.3 3.3 - All products 100.0 100.0 22.9 2.5 2.5 2.5 - 6.3 6.3 4.4 4.4 4.4 -
All partners Raw agric. 3.2 2.4 0.9 12.9 11.1 10.7 82.4 14.3 13.2 8.2 7.6 7.0 49.Food prod. 3.9 5.8 2.7 13.2 9.5 8.9 86.9 28.8 25.1 23.3 22.0 21.1 60.Oth. primary 17.0 13.8 6.3 0.1 0.0 0.0 93.8 0.2 0.2 0.1 0.1 0.1 65.Text-wear’g 9.6 7.6 1.6 10.0 5.7 4.8 82.7 8.9 5.0 9.6 8.7 7.6 44.Oth. Manuf 66.3 70.4 17.7 2.6 1.5 1.3 82.7 2.8 1.8 3.1 2.8 2.5 49.All products 100.0 100.0 29.2 3.6 2.3 2.0 83.2 5.3 4.1 4.4 4.0 3.6 49.
Source: Authors' calculations based on Custom declarations and TARIC.
Note: The preference margin is calculated as the difference between the AVE MFN rate and the best preferential rate available. Calculations are made at the tariff line level. Columns (g) and (m) give the utilisation rate of the preferential margin, computed as follows: (g) = ((d)-(e)) / ((d)-(f)) and, similarly, (m) = ((j)-(k)) / ((j)-(l)).

Calculations based on world-wide exports outside the EU deliver a different picture. Firstly, the assessed preferential margin is lower: 0.8 percentage points for all partners, as compared to 1.6 points using import-weighted averages. While moderating the assessed extent of tariff preferences, this suggests at the same time that trade preferences are successful in enhancing exports to the EU, since products granted a relatively high preference margin account for a higher share of partners’ exports to the EU than to the rest of the world. In particular, EU preferences appear to effectively enhance sub-Saharan African countries' agricultural exports to the EU. Their large preferential margin in this sector is fairly well utilised (by 84% up to 97%), and is reflected in these products occupying a larger share in exports to the EU than to other markets. Broadly speaking, the relatively good utilisation of EU preferences by sub-Saharan Africa is confirmed.
Using a weighting scheme based on world-wide exports outside the EU also results in the utilisation rate of preferences appearing far lower, slightly below 50%. The difference is especially striking for developing countries eligible both for the GSP and for another preferential scheme (30% utilisation). The "other manufacturing" sector plays a significant role in the latter case, and the low utilisation of preferences in this sector is associated with a significantly lower share in exports to the EU than in exports to the rest of the world.
Non-African LDCs record an average utilisation of the preferential margin of 33 percent in this alternative calculation. Again, textiles and clothing play a significant role in this case. However, the share of textile and clothing is higher in exports toward the EU than toward the rest of the world. In spite of the imperfect utilisation of preferences, non-African LDC textile-clothing exporters might thus enjoy easier access to the EU market than to other large markets (the US and Canada in particular, see Table 1), and this is certainly due at least in part to the preferential access offered by the EU.
Using exports outside the EU as a weighting scheme also paves the way for incorporating products not exported to the EU in the analysis. It can then be assessed whether protection and constraints associated with preferential schemes might impede access to the European market for some products. On the whole, the average MFN duty for zero-import products is slightly above the average for other products (5.3%, as compared to 4.4%), but the difference is not striking, and it is even less in terms of the average best duty available (4.1%, compared to 3.6%). However, the presence of zero-import products is noteworthy in raw agricultural and food products, where the higher MFN protection is not compensated by preference margins. In the case of food products, their share in exports to the EU (3.9%) is also significantly lower than in exports to other markets (5.8%).
3.3 The value of EU preferences
Following Alexandraki and Lankes (2004) and the chapter by Dean and Wainio, a simple calculation of the value of preferences can be provided. Under simplifying assumptions (perfect substitutability across origins and constant world prices, in particular), the value of the rent arising from preferential tariff duties can indeed be computed as follows, for any partner j:
(1) ∑ −=i
PREijij
PREij
MFNij utildutiablettV )(
Where i is the tariff line, tMFN and tPRE refer respectively to the MFN and the preferential applied tariff duty. “dutiableij” refers to EU’s dutiable imports of product i from partner j, “util” is the corresponding utilisation rate.
This is a crude approximation in many respects, but it allows the magnitude of preferences to be compared across countries. Note however that these calculations do not account for the EU’s preferential tariff rate quotas, which are an important source of rents, in particular for sugar, banana and beef, because of the “product protocols” under the Cotonou Agreement (see Bureau and Tangerman, 1999 for a detailed analysis of EU’s TRQs, and Bouët et al., 2005, Table 6.5, for an assessment of the importance of TRQ rents for developing countries).
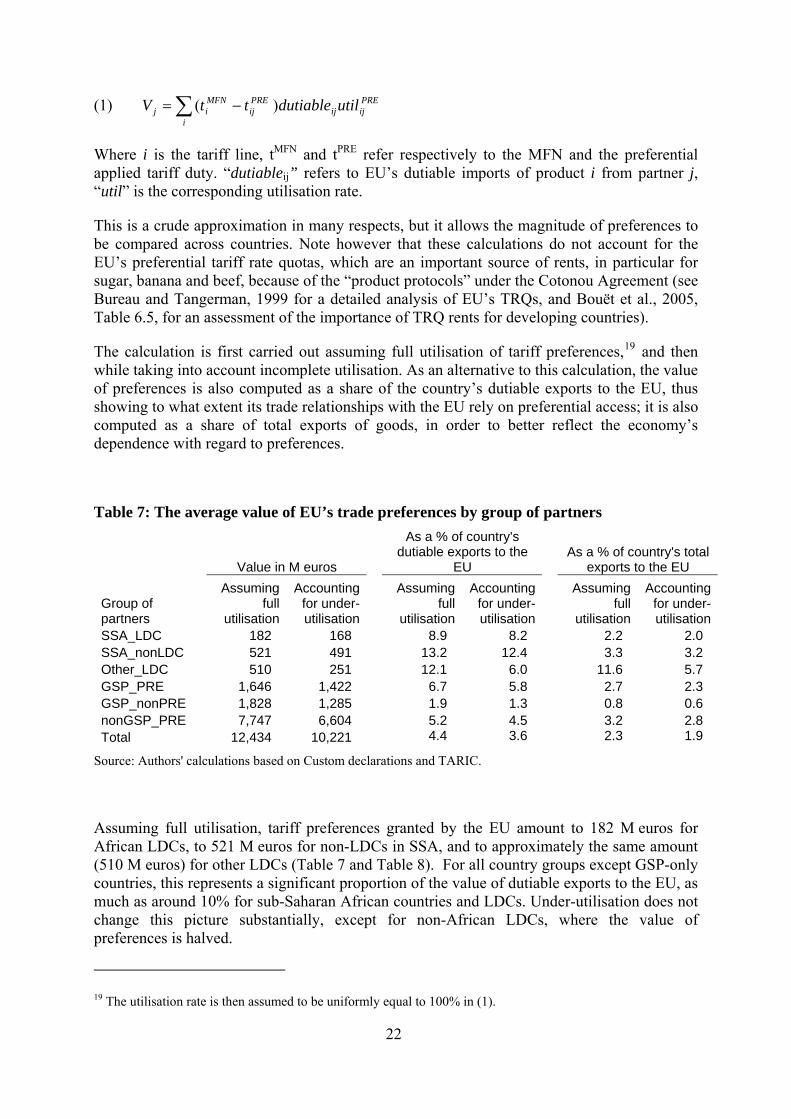
The calculation is first carried out assuming full utilisation of tariff preferences,19 and then while taking into account incomplete utilisation. As an alternative to this calculation, the value of preferences is also computed as a share of the country’s dutiable exports to the EU, thus showing to what extent its trade relationships with the EU rely on preferential access; it is also computed as a share of total exports of goods, in order to better reflect the economy’s dependence with regard to preferences.
Table 7: The average value of EU’s trade preferences by group of partners
Value in M euros
As a % of country's dutiable exports to the
EU As a % of country's total
exports to the EU
Group of partners
Assuming full
utilisation
Accounting for under-utilisation
Assuming full
utilisation
Accounting for under-utilisation
Assuming full
utilisation
Accounting for under-utilisation
SSA_LDC 182 168 8.9 8.2 2.2 2.0 SSA_nonLDC 521 491 13.2 12.4 3.3 3.2 Other_LDC 510 251 12.1 6.0 11.6 5.7 GSP_PRE 1,646 1,422 6.7 5.8 2.7 2.3 GSP_nonPRE 1,828 1,285 1.9 1.3 0.8 0.6 nonGSP_PRE 7,747 6,604 5.2 4.5 3.2 2.8 Total 12,434 10,221 4.4 3.6 2.3 1.9
Source: Authors' calculations based on Custom declarations and TARIC.
Assuming full utilisation, tariff preferences granted by the EU amount to 182 M euros for African LDCs, to 521 M euros for non-LDCs in SSA, and to approximately the same amount (510 M euros) for other LDCs (Table 7 and Table 8). For all country groups except GSP-only countries, this represents a significant proportion of the value of dutiable exports to the EU, as much as around 10% for sub-Saharan African countries and LDCs. Under-utilisation does not change this picture substantially, except for non-African LDCs, where the value of preferences is halved.
19 The utilisation rate is then assumed to be uniformly equal to 100% in (1).
22
23
Except for non-African LDCs, the figures are significantly lower when expressed as a proportion of countries’ total exports in goods to the EU. Still, the value of preferences, even accounting for under-utilisation, amounts to more than two per cent of total exports to the EU, except for GSP countries not eligible for another preferential scheme, and to around one percent of world exports in average for sub-Saharan African countries and LDCs. Although moderate, this is not negligible for the EU market alone, given that these exports include a significant proportion of non-dutiable products (energy and primary materials in particular).

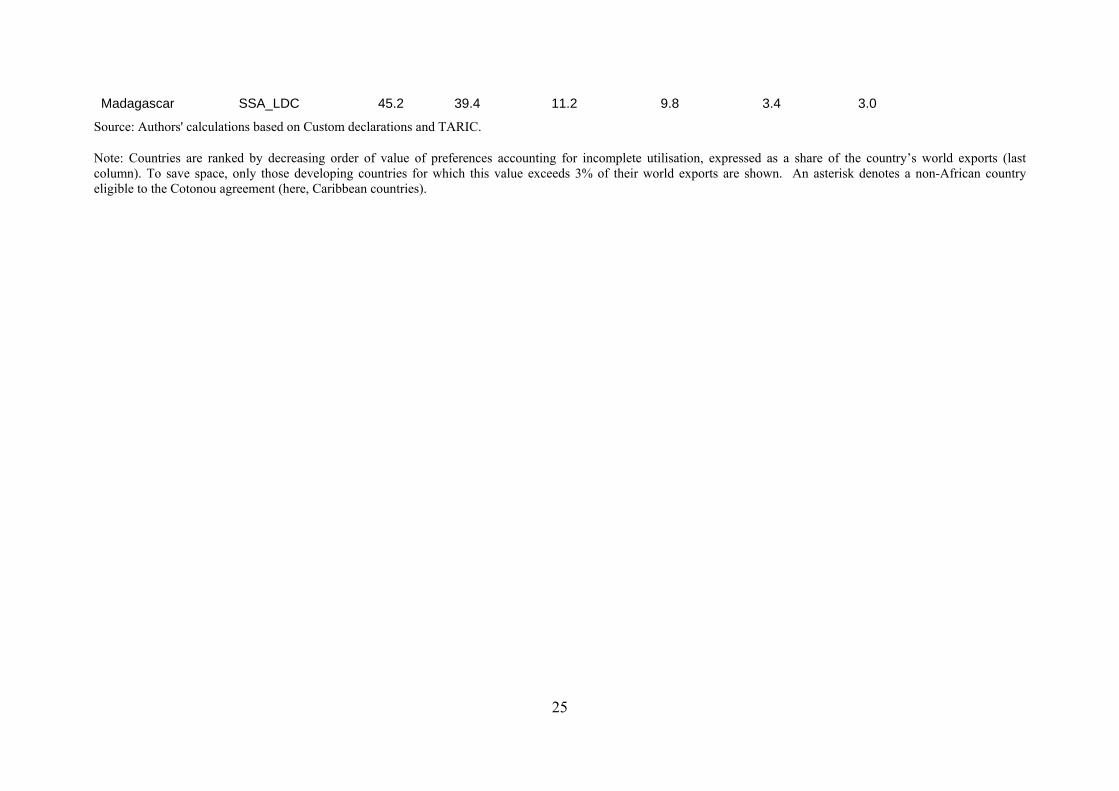
Table 8: The value of EU tariff preferences for selected countries
Value in M euros As a % of country's
dutiable exports to the EU As a % of country's
total exports
Partner
Group the country belongs to
Assuming full
utilisation
Accounting for
under-utilisation
Assuming full
utilisation
Accounting for under-
utilisation
Assuming full
utilisation
Accounting for under-utilisation
Seychelles SSA_nonLDC 37.6 35.5 23.5 22.2 13.4 12.6
Dominica * GSP_PRE 6.5 6.3 28.5 27.6 10.7 10.3Saint Lucia * GSP_PRE 12.3 12.2 46.8 46.2 10.0 9.9Senegal SSA_LDC 29.9 28.3 11.3 10.7 7.3 6.9Tunisia GSP_PRE 399.2 374.3 8.9 8.3 6.5 6.1Morocco GSP_PRE 454.3 432.7 10.0 9.6 5.2 5.0Mozambique SSA_LDC 33.4 32.5 7.0 6.8 5.0 4.8Lao PDR Other_LDC 16.5 10.3 12.3 7.6 7.7 4.8
Mauritius SSA_nonLDC 90.3 82.8 12.3 11.2 4.5 4.2
Cameroon SSA_nonLDC 86.3 82.6 25.9 24.8 4.2 4.0
Saint Vincent & Gr. * GSP_PRE 11.1 6.5 29.5 17.2 6.5 3.8Belize* GSP_PRE 16.4 15.8 38.5 37.0 3.9 3.7Gambia SSA_LDC 1.1 1.0 12.0 11.0 4.0 3.7
Namibia SSA_nonLDC 38.3 37.2 10.8 10.5 3.7 3.5
Bosnia & Herzegovina
nonGSP_PRE 28.1 26.0 7.2 6.6 3.7 3.4
Eritrea Other_LDC 0.2 0.1 13.8 11.9 3.9 3.4Cape Verde SSA_LDC 0.6 0.6 7.1 6.6 3.4 3.2
Kenya SSA_nonLDC 54.6 50.3 11.2 10.3 3.4 3.2
Romania nonGSP_PRE 470.9 429.7 7.7 7.0 3.5 3.2
25
Madagascar SSA_LDC 45.2 39.4 11.2 9.8 3.4 3.0
Source: Authors' calculations based on Custom declarations and TARIC.
Note: Countries are ranked by decreasing order of value of preferences accounting for incomplete utilisation, expressed as a share of the country’s world exports (last column). To save space, only those developing countries for which this value exceeds 3% of their world exports are shown. An asterisk denotes a non-African country eligible to the Cotonou agreement (here, Caribbean countries).

At the country level, however, the value of EU preferences amounts in some cases to far higher values; for 10 countries it is in excess of 4% of their world exports in goods, all of them being African or Caribbean, apart from Laos. EU Preferences account for more than 10% of global exports for Dominica and the Seychelles, and for almost half the dutiable exports to the EU of Saint Lucia.20
Here again, under-utilisation does not substantially change the picture, except for South-Asian LDCs. The value of EU preferences for Bangladesh, for instance, falls from 12.1% to 6.4% of its dutiable exports to the EU (respectively, 3.4% and 1.9% of its world exports) because of under-utilisation.
4 Conclusion The EU plays a major role with regard to developing countries exports, both because of the size of its market, and because of its numerous reciprocal and non-reciprocal preferential agreements. Our assessment confirms that EU tariff preferences are important for a number of developing countries, in particular in sub-Saharan Africa. While even the average figures are significant, the dependence to EU preferences is particularly important for a limited number of African and Caribbean countries. On average, the utilisation of these tariff preferences turns out to be strong.
The only case where under-utilisation appears as a significant loss to receiving countries is the EBA initiative for South-Asian LDCs. The novelty of the EBA scheme is part of the explanation, as witnessed by the slight but significant increase recorded between 2001 and 2002. However, the constraints imposed by rules of origin on textile and clothing exports (the foremost export specialisation of South-Asian LDCs) appear as the main reason for under-utilisation. Relaxing these rules could be an efficient way to substantially increase the benefit receiving countries are likely to draw from the scheme, at least as far as the textile-clothing sector is concerned, and perhaps also for other manufacturing goods.
For sub-Saharan African countries, the contractual non-reciprocal preferences granted through the Cotonou Partnership Agreement were of significant importance. By combining deep preferences, large coverage and relatively flexible rules, this agreement has proved instrumental for African exporters. The end of this agreement on January 1, 2008 is thus a milestone in the trade relationship of sub-Saharan countries with the EU, and finding an acceptable transition out of this regime is a key challenge. The Economic Partnership Agreements signed or still being negotiated with the EU should be the way out for most countries, although their reciprocity (even though "less than full", and tied to long transition periods) will require in return from these countries widespread liberalisation to imports from the EU. For sub-Saharan African LDCs, the EBA initiative might be an alternative in this context. Given their specialisation in raw agricultural products, most of which are produced using few traded intermediates and thus not inhibited by rules of origin, our results suggest
20 Note that the value of preferences in absolute terms is higher for large developing countries (among non-European developing countries, the highest values are found by decreasing order for Turkey, China, Morocco, Tunisia, Bangladesh, India, Israel).

27
that EBA could be of high value to them. For others, the EU's GSP appears as a very poor substitute.

28
References Alexandraki, K., and H. P. Lankes (2004), “The Impact of Preference Erosion on Middle-
Income Developing Countries”, IMF Working Paper 04/169, International Monetary Fund, Washington DC.
Anson J., Cadot O., Estevadeordal A., de Melo J., Suwa-Eisenmann A., and B. Tumurchudur (2004), Rules of Origin in North-South Preferential Trading Arrangements with an Application to NAFTA, mimeo.
Bouët A., J.-C Bureau, Y. Decreux and S. Jean (2004a), ‘Multilateral Agricultural Trade Liberalization: The Contrasting Fortunes of Developing Countries in the Doha Round’, CEPII Working Paper 2004-18, Centre d’Etudes Prospectives et d’Informations Internationales, Paris.
Bouët A., Y. Decreux., L. Fontagné , S. Jean , D. Laborde (2004b), ‘A Consistent, ad valorem Equivalent Measure of Applied Protection Across the World: The MAcMap-HS6 Database’, CEPII Working Paper 2004-22, Centre d’Etudes Prospectives et d’Informations Internationales, Paris.
Bouët A., Jean S. and Fontagné L. (2005), "Is erosion of preferences a serious concern?", in Agricultural Trade Reform and the Doha Development Agenda, edited by K. Anderson and W. Martin, Washington, D.C.: The World Bank, forthcoming.
Brenton P. (2003), “Integrating the Least Developed Countries into the World Trading System: The Current Impact of EU Preferences Under Everything But Arms,” Policy Research Working Paper No. 3018, Washington, D.C.: World Bank.
Brenton, P., Manchin M. (2003), “Making EU Trade Agreements Work: The Role of Rules of Origin”, The World Economy. 26 :755-69, May
Cadot O., Estevadeordal A. and Suwa-Eisenmann A.(2004), "Rules of Origin as Export Subsidies", mimeo, INRA February 2004.
Cadot, O., A. Estevadeordal, J. de Melo, A. Suwa-Eisenmann and B. Tumurchudur , (2002), “Assessing the Effect of NAFTA’s Rules of Origin”, mimeo, University of Lausanne.
Duttagupta R., and A., Panagariya (2001), “Free Trade Areas and Rules of Origin: Economics and Politics”. University of Maryland at College Park, mimeo
Estevadeordal, A. (2000), “Negotiating Preferential Market Access: The Case of the North American Free Trade Agreement”, Journal of World Trade, 34, 141-66.
Estevadeordal, A., and K. Suominen (2003), “Measuring Rules of Origin in the World Trading System and Proposals for Multilateral Harmonization”, mimeo IDB, Washington, D.C.
Estevadeordal, A., and K. Suominen (2004), “Rules of Origin: A World Map and Trade Effects”, mimeo IDB, Washington, D.C.
Falvey R. and G. Reed (1998), “Economic Effects of Rules of Origin”. Weltwirtschaftliches Archiv, 134(2), pp. 209-229.
Falvey R. and G. Reed (2002), “Rules of Origin as Commercial Policy Instruments”, International Economic Review, 43(2), pp. 393-407.
Gallezot J. (2003) “Real access to the EU’s agricultural market”, mimeo, INRA, Paris.
Herin, J. (1986), “Rules of Origin and Differences Between Tariff Levels in EFTA and in the

29
EC”, EFTA Occasional Paper 13.
Inama S. (2003), “Trade Preferences for LDCs: An Early Assessment of Benefits and Possible Improvements”, UNCTAD, ITCD/TSB/2003
Ju J. and K. Krishna, (2005), "Firm behaviour and market access in a Free Trade Area with rules of origin," Canadian Journal of Economics, Canadian Economics Association, vol. 38(1), pp. 290-308
Ju, J. and K. Krishna (2002) "Regulations, regime switches and non-monotonicity when non- compliance is an option: an application to content protection and preference", Economics Letters, 77(3):315-321
Krishna K. (2005), “Understanding Rules of Origin”, NBER Working Paper 11150.
Krishna K. and A. Krueger (1995), “Implementing Free Trade Areas: Rules of Origin and Hidden protection” in A. Deardorff, J Levinsohn and R. Stern (eds), New directions in Trade Theory. Ann Arbor, MI: University of Michigan Press.
Lamy P. (2002), “Stepping Stones or Stumbling Blocks? The EU’s Approach Towards the Problem of Multilateralism vs Regionalism in Trade Policy”, The World Economy, Vol. 25, No. 10, pp. 1399-1413.
Mattoo A., D. Roy, and A. Subramanian (2003), “The Africa Growth and Opportunity Act and its Rules of Origin: Generosity Undermined?” Vol. 26, Issue 6, pp 829-851
Melitz, M., (2003).“The Impact of Trade on Intra-Industry Reallocations and Aggregate Industry Productivity,” Econometrica 71, pp 1695-1725.
OECD (2005). Preferential Trading Arrangements in Agricultural and Food Markets. The case of the European Union and the United States, prepared by J. Gallezot and J.C. Bureau for the OECD Secretariat, Organisation for Economic Co-operation and Development, Paris.
Olarreaga M. and Ozden C. (2005), "Who Captures the Tariff Rent in the Presence of Preferential Market Access?", The World Economy, Vol. 28, No. 1, pp. 66-77.
Panagariya A. (2002), “EU Preferential Trade Arrangements and Developing Countries”, The World Economy, Vol. 25, No. 10, pp. 1415-1432.
Sapir A. (1998), “The Political Economy of EC Regionalism”, European Economic Review 42, 717-32.
WTO (2008a), "Revised Draft Modalities For Agriculture", TN/AG/W/4/Rev.1, World Trade Organization, Geneva.
WTO (2008b), "Draft Modalities For Non-Agricultural Market Access", TN/MA/W/103, World Trade Organization, Geneva.

30
Appendix: Partner classification
Group Short name Countries included
Sub-Saharan Africa non LDCs
SSA_nonLDC Botswana, Cameroon, Congo, Gabon, Ghana, Cote D'ivoire, Kenya, Mauritius, Namibia, Nigeria, Seychelles, Zimbabwe, Swaziland
Sub-Saharan Africa LDCs SSA_LDC Angola, Burundi, Cape Verde, Central African Republic), Chad, Comoros, Congo (Democratic Rep.), Benin, Equatorial Guinea, Ethiopia, Djibouti, Gambia, Guinea, Lesotho, Liberia, Madagascar, Malawi, Mali, Mauritania, Mozambique, Niger, Guinea-Bissau, Rwanda, Sao Tome and Principe, Senegal, Sierra Leone, Somalia, Sudan, Togo, Uganda, Tanzania, Burkina Faso, Zambia
Other LDCs Other_LDC Afghanistan, Bangladesh, Bhutan, Salomon Island, Myanmar, Cambodia, Eritrea, Kiribati, Haiti, Lao People's Democratic, Maldives, Nepal, Vanuatu, Tuvalu, Samoa, Yemen
Non-LDC, non-Sub-Saharan African Countries covered by EU's GSP and by another preferential agreement
GSP_PRE Algeria, Antigua and Barbuda, Azerbaijan, Bahamas, Armenia, Barbados, Bolivia, Belize, British Indian Ocean Terr., Virgin Island, Belarus, Cayman Islands, American Samoa, Colombia, Mayotte, Costa Rica, Cyprus, Dominica, Dominican Republic, Ecuador, El Salvador, Falkland Islands, South Georgia, Fiji, French Polynesia, French Southern Territo, Greenland, Grenada, Guam, Guatemala, Guyana, Honduras, Jamaica, Jordan, Lebanon, Mexico, Montserrat, Morocco, Netherlands Antilles, Aruba, New Caledonia, Nicaragua, Northern Maria Island, Panama, Papua New Guinea, Peru, Pitcairn, St. Helena, Saint Kitts and Nevis, Anguilla, Saint Lucia, St. Pierre and Miquelon, Saint Vincent and The Grenadines, South Africa, Bouvet Island, Suriname, Syrian Arab Republic, Tonga, Trinidad and Tobago, Tunisia, Turks and Caicos Island, Egypt, Venezuela, Wallis and Futuna
Countries only covered by EU's GSP
GSP_nonPRE Argentina, Bahrain, Bermuda, Brazil, Brunei Darussalam, Sri Lanka, Chile, China, Christmas Island, Cocos (Keeling) Islands, Cook Islands, Cuba, Georgia, Gibraltar, Heard and Mc Donald Isl, Indonesia, Iran, Iraq, Kazakhstan, Kuwait, Kyrgyzstan, Libyan Arab Jamahiriya, Macau, Malaysia, Mongolia, Moldova, Oman, Nauru, Norfolk Island, Palau, Pakistan, Paraguay, Philippines, Qatar, Russian Federation, Saudi Arabia, India, Viet Nam, Tajikistan, Thailand, Tokelau, United Arab Emirates, Turkmenistan, Ukraine, Virgin Islands (U.S.), Uruguay, Uzbekistan
Countries not covered by EU's GSP, but covered by another preferential agreement
nonGSP_PRE Albania, Andorra, Bosnia and Herzegowina, Bulgaria, Croatia , Czech Republic, Estonia, Faroe Islands, Hong Kong, Hungary, Iceland, Israel, Latvia, Liechtenstein, Lithuania, Malta, Taiwan, Niue, Norway, Micronesia, Marshall Islands, Poland, Romania, San Marino, Slovakia (Slovak Republic), Slovenia, Switzerland, Turkey, Macedonia, Serbia and Montenegro
Countries not covered by any preferential agreement
nonGSP_nonPRE Canada, Japan, Prk, Korea (Dem. People Rep.), New Zealand, Singapore, USA, Australia

31