what analytics can tell you and what it cant!
TRANSCRIPT
What analytics can tell you and what it can’t!
Paul & Aran - Evosite
#DigitalExeter
#DigitalExeter
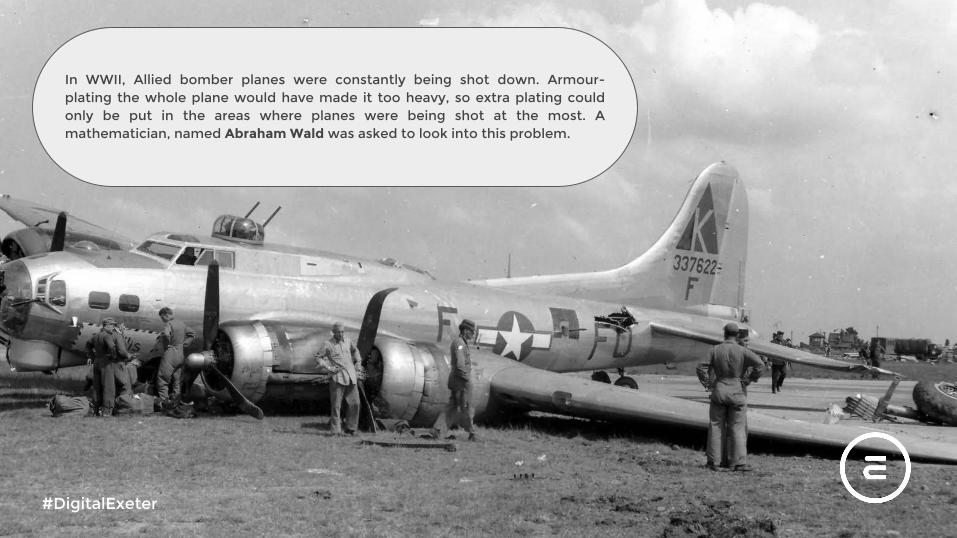
In WWII, Allied bomber planes were constantly being shot down. Armour-plating the whole plane would have made it too heavy, so extra plating could only be put in the areas where planes were being shot at the most. A mathematician, named Abraham Wald was asked to look into this problem.
#DigitalExeter
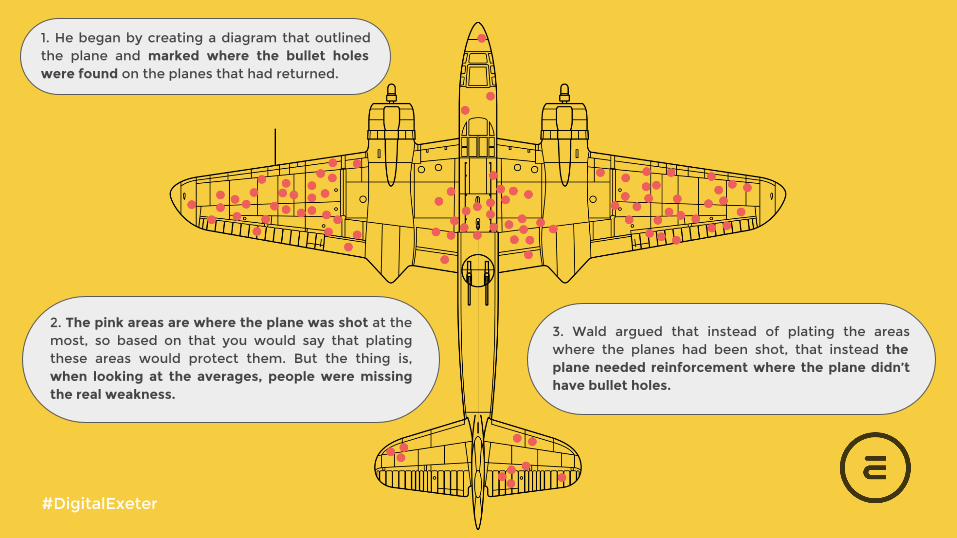
1. He began by creating a diagram that outlined the plane and marked where the bullet holes were found on the planes that had returned.
2. The pink areas are where the plane was shot at the most, so based on that you would say that plating these areas would protect them. But the thing is, when looking at the averages, people were missing the real weakness.
3. Wald argued that instead of plating the areas where the planes had been shot, that instead the plane needed reinforcement where the plane didn’t have bullet holes.
Don’t look at general averages hoping to find answers.
#DigitalExeter
Improvements won’t jump out at you, they have to be uncovered
#DigitalExeter

Averages...
#DigitalExeter
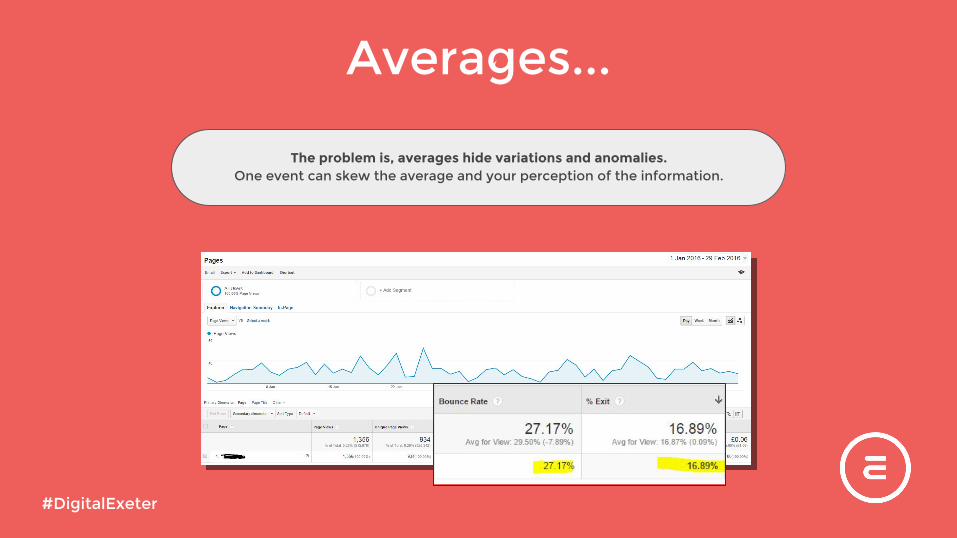
When looking at analytics, our dashboards are filled with averages: Average bounce rate, average time on site, average conversion rate. It’s easy to make assumptions with generalised data, but to understand the problem you have to look a little deeper.
Averages...
#DigitalExeter
The problem is, averages hide variations and anomalies. One event can skew the average and your perception of the information.
Weaknesses!
#DigitalExeter
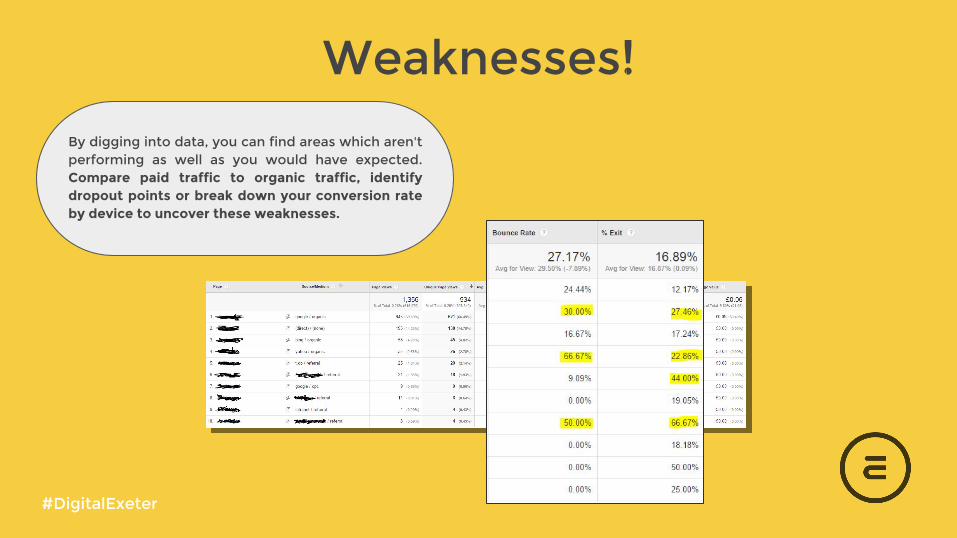
By digging into data, you can find areas which aren't performing as well as you would have expected. Compare paid traffic to organic traffic, identify dropout points or break down your conversion rate by device to uncover these weaknesses.
Step One:
Analytics tells you what, but it doesn’t tell you why
#DigitalExeter

Step Two:
Conduct usability tests to validate your hypothesis
#DigitalExeter
Step Three:
Use A/B testing to find the most effective improvement
#DigitalExeter
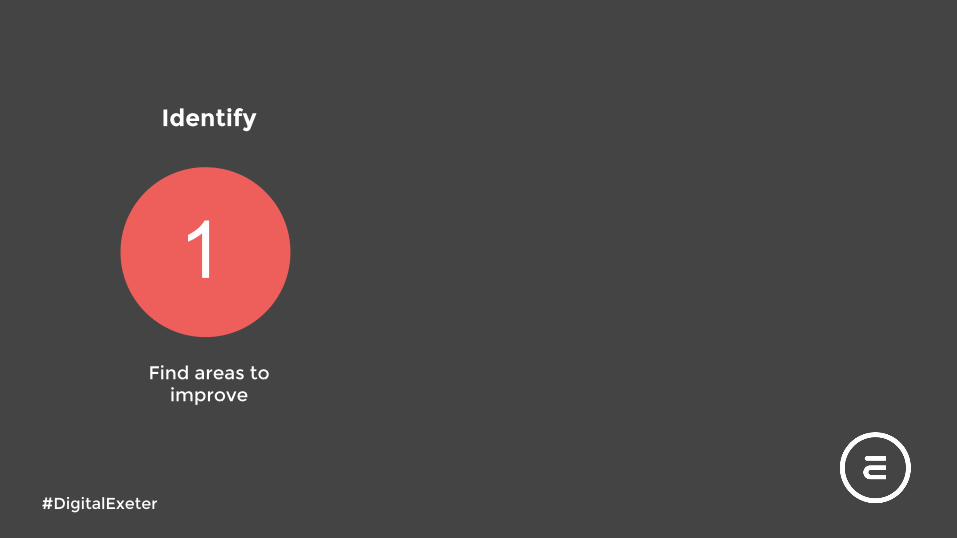
Identify
Find areas to improve
#DigitalExeter
1
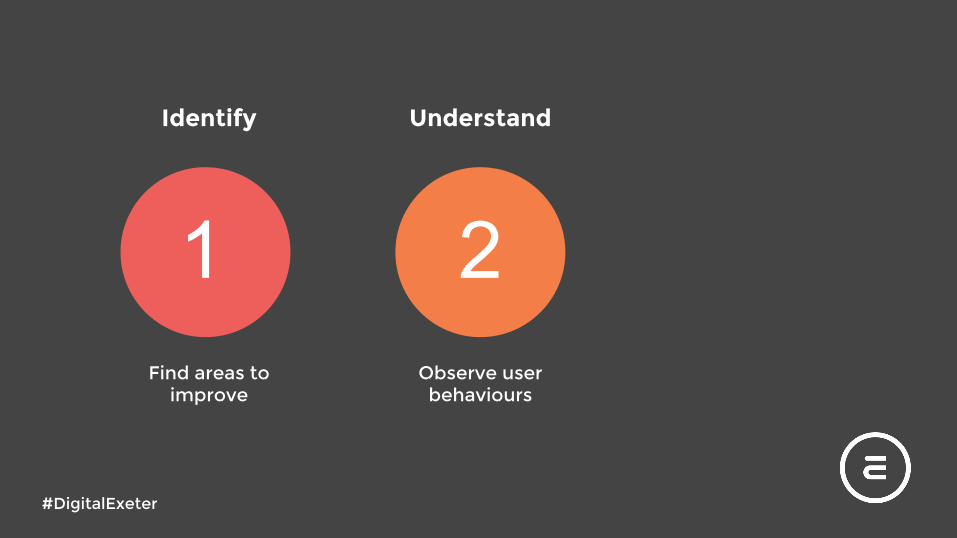
Identify Understand
Find areas to improve
Observe user behaviours
#DigitalExeter
1 2
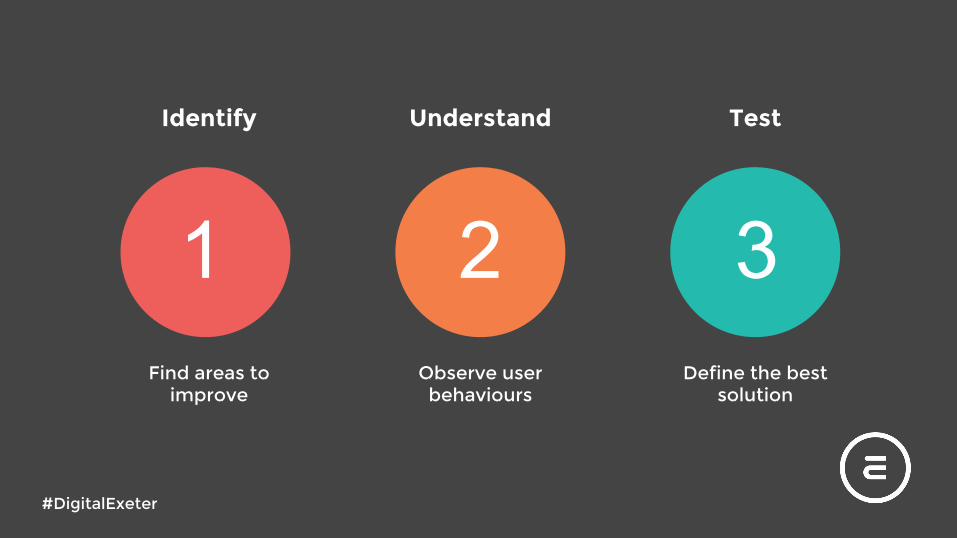
Identify Understand Test
Find areas to improve
Observe user behaviours
Define the best solution
#DigitalExeter
1 2 3
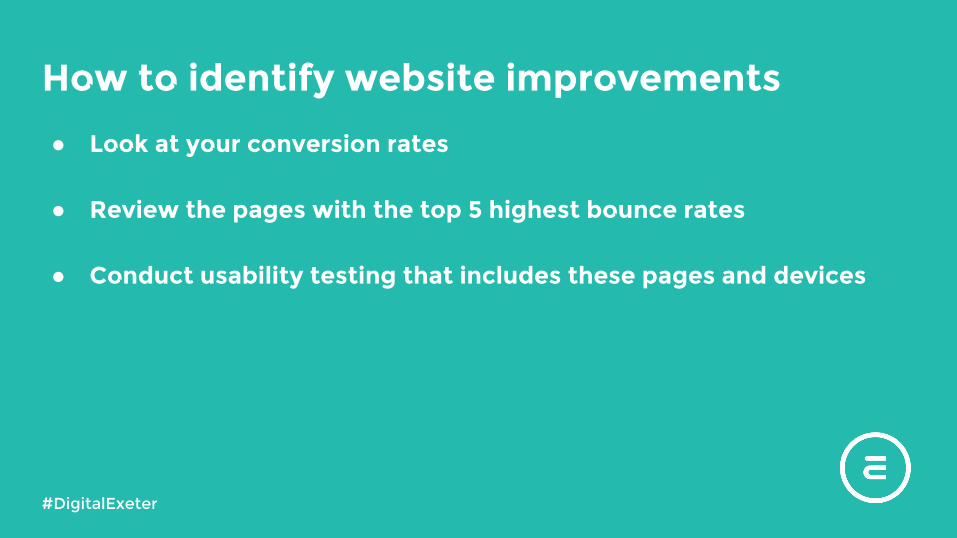
How to identify website improvements
● Look at your conversion rates
● Review the pages with the top 5 highest bounce rates
● Conduct usability testing that includes these pages and devices
#DigitalExeter
Are you truly understanding what your data is telling you?
Here’s a case study that reflects on the first partand provides a few actionable ideas.
#DigitalExeter
Gadsbywww.gadsby.co.uk
#DigitalExeter

Some important background: Gadsby is a B2B wholesaler of high quality wicker baskets, hampers, display and gift packaging. They work together with a wide range of highly regarded national brands to provide high quality retail display products.
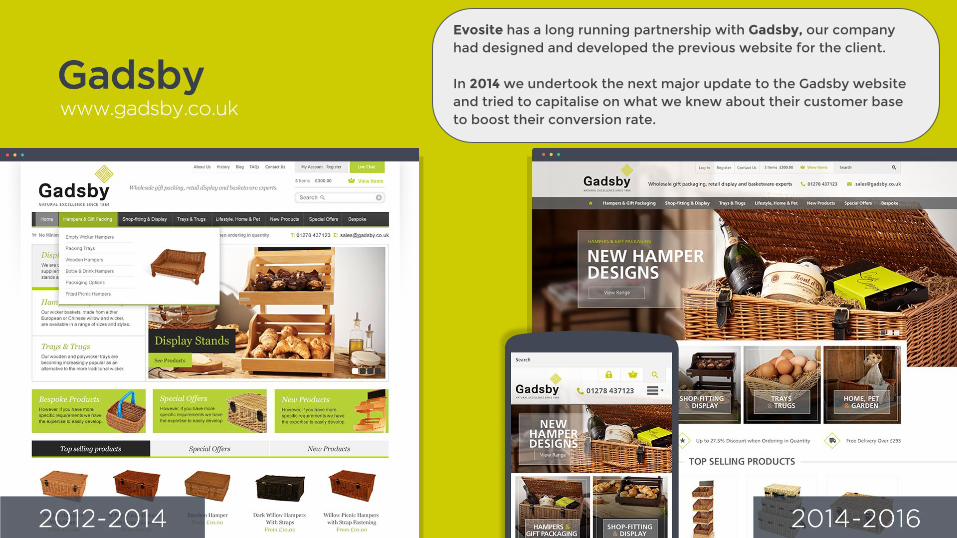
Evosite has a long running partnership with Gadsby, our company had designed and developed the previous website for the client.
In 2014 we undertook the next major update to the Gadsby website and tried to capitalise on what we knew about their customer base to boost their conversion rate.
We had a LOT of tracking in place on the existing website.
This would allow us to easily diagnose any potential issues when the new version of
the site launched.
#DigitalExeter
Following the launch of the NEW improved website, our tracking showed an increase across the
whole site!
#DigitalExeter
Well…...Almost every area!
#DigitalExeter
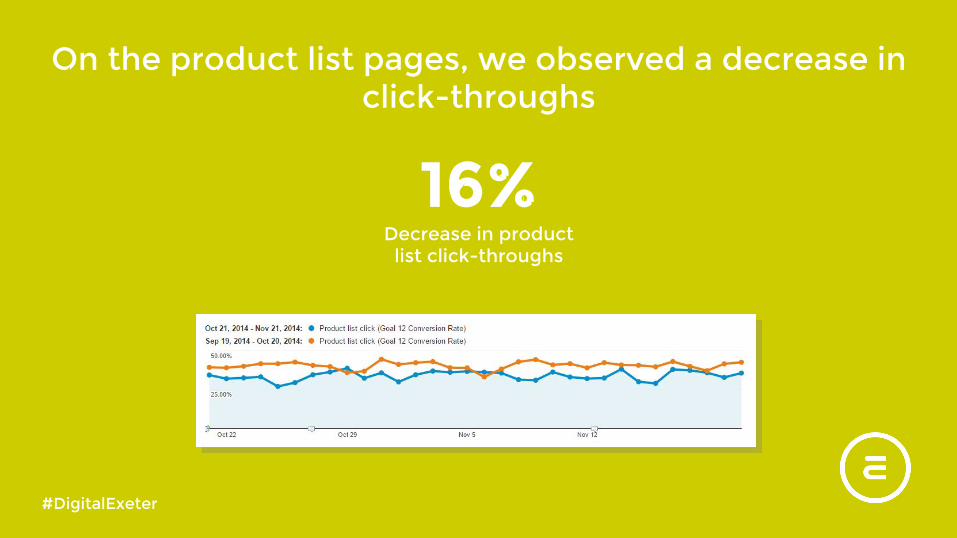
On the product list pages, we observed a decrease in click-throughs
16%Decrease in product
list click-throughs
#DigitalExeter
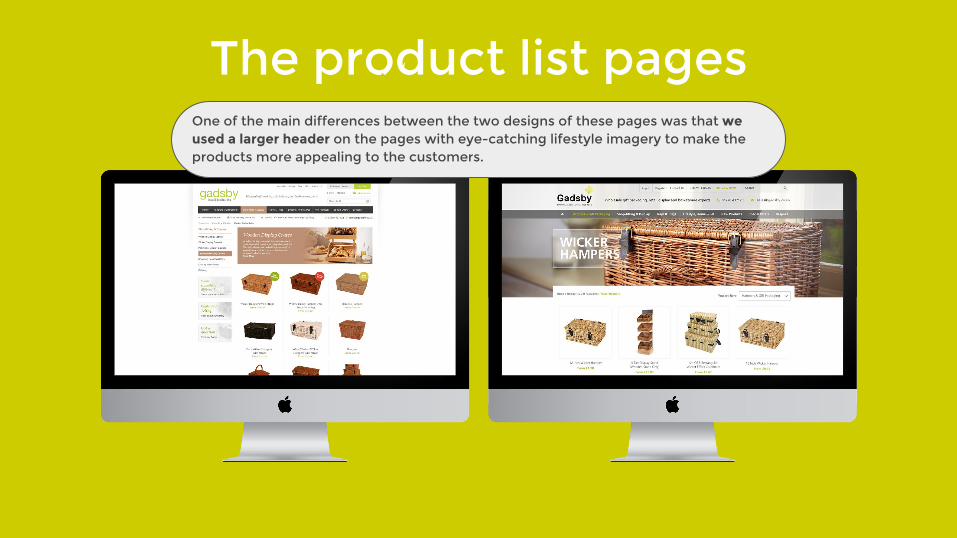
The product list pagesOne of the main differences between the two designs of these pages was that we used a larger header on the pages with eye-catching lifestyle imagery to make the products more appealing to the customers.
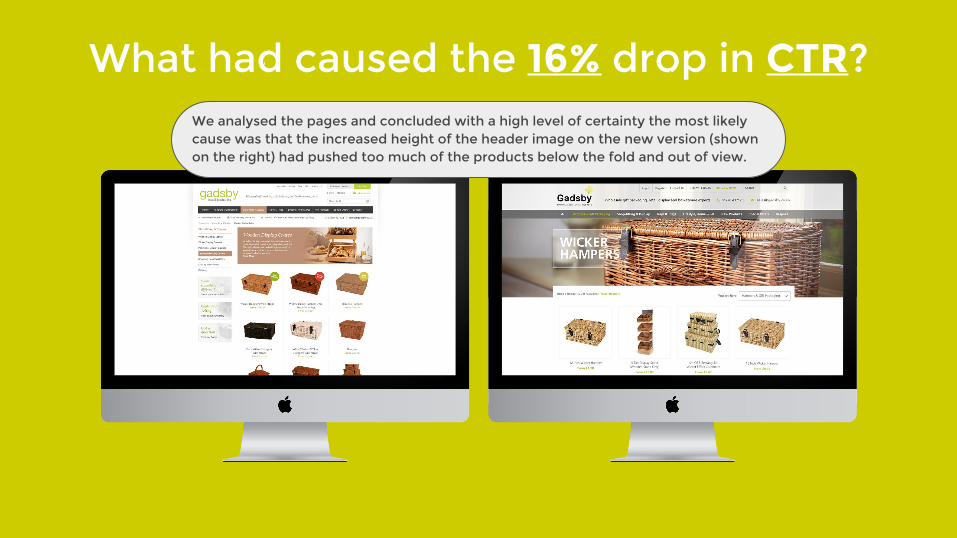
What had caused the 16% drop in CTR?We analysed the pages and concluded with a high level of certainty the most likely cause was that the increased height of the header image on the new version (shown on the right) had pushed too much of the products below the fold and out of view.
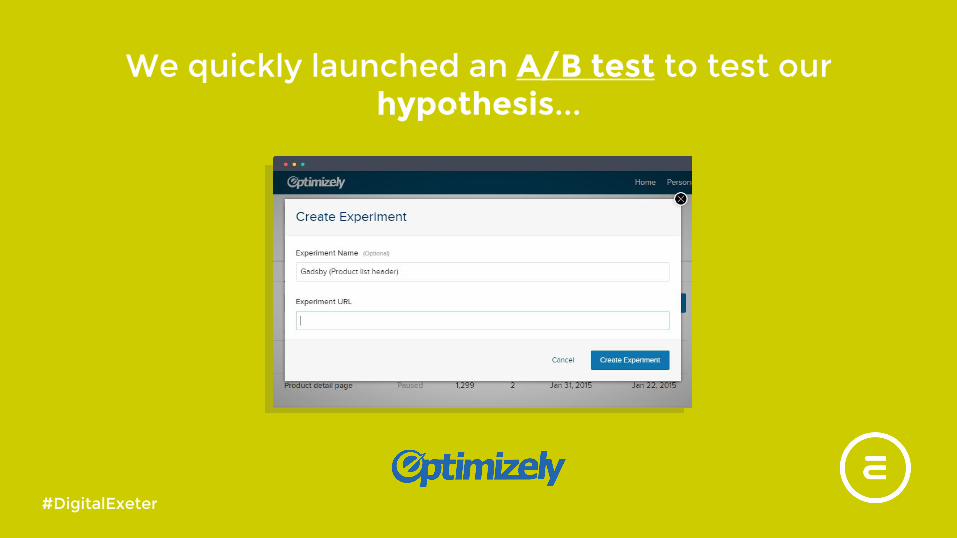
We quickly launched an A/B test to test our hypothesis...
#DigitalExeter
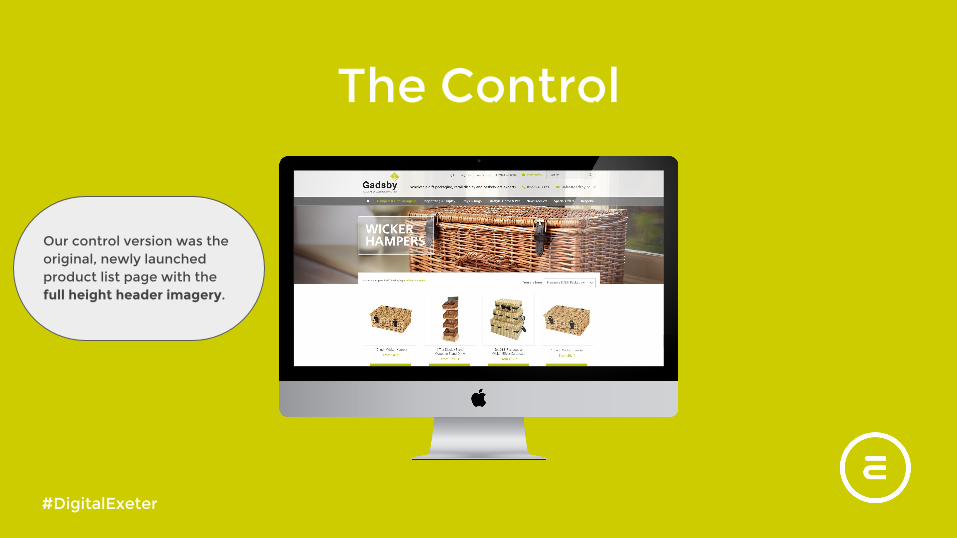
The Control
Our control version was the original, newly launched product list page with the full height header imagery.
#DigitalExeter
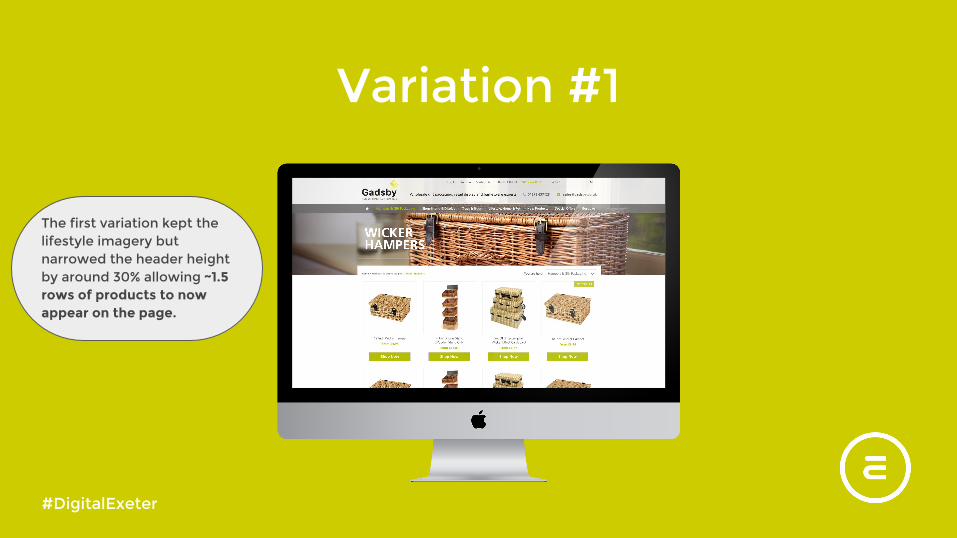
Variation #1
The first variation kept the lifestyle imagery but narrowed the header height by around 30% allowing ~1.5 rows of products to now appear on the page.
#DigitalExeter
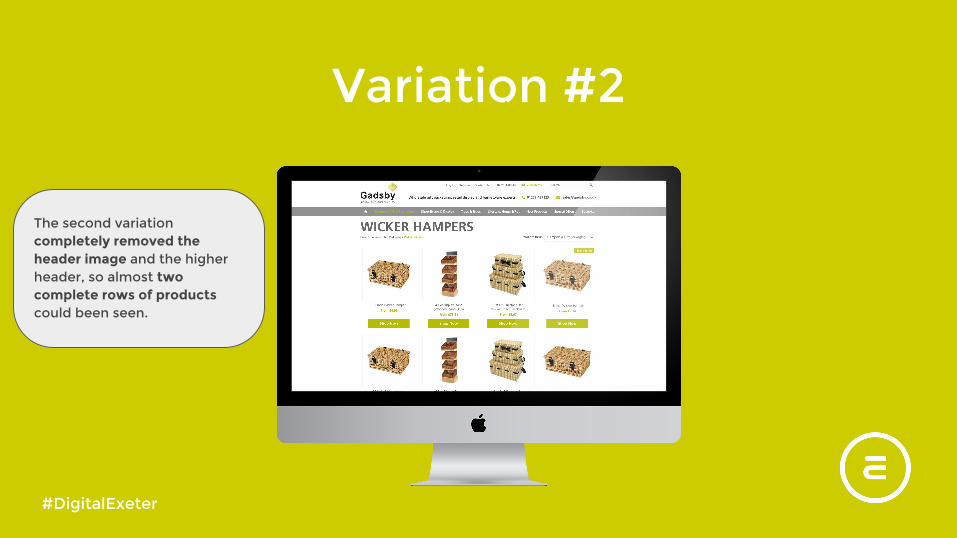
Variation #2
The second variation completely removed the header image and the higher header, so almost two complete rows of products could been seen.
#DigitalExeter
What were we expecting to win?
#DigitalExeter
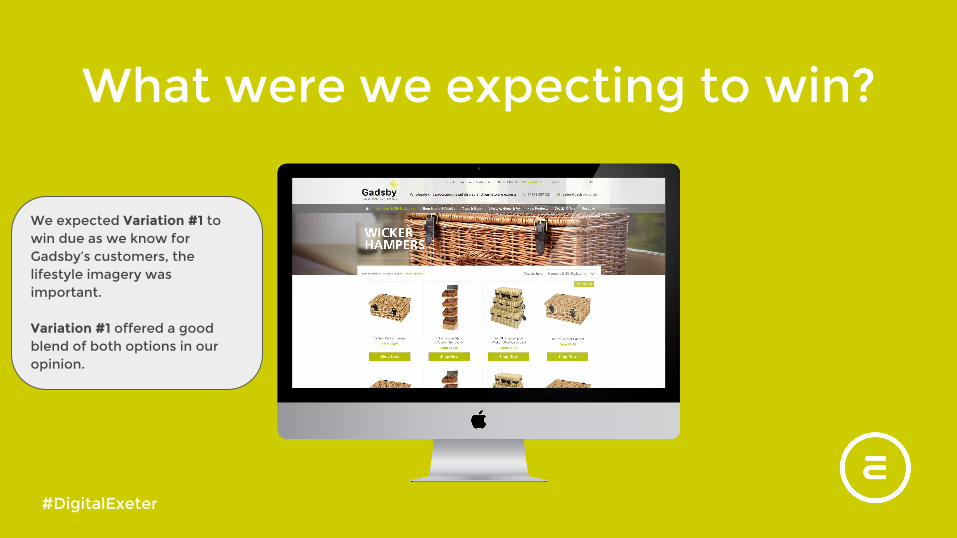
What were we expecting to win?
We expected Variation #1 to win due as we know for Gadsby’s customers, the lifestyle imagery was important.
Variation #1 offered a good blend of both options in our opinion.
#DigitalExeter
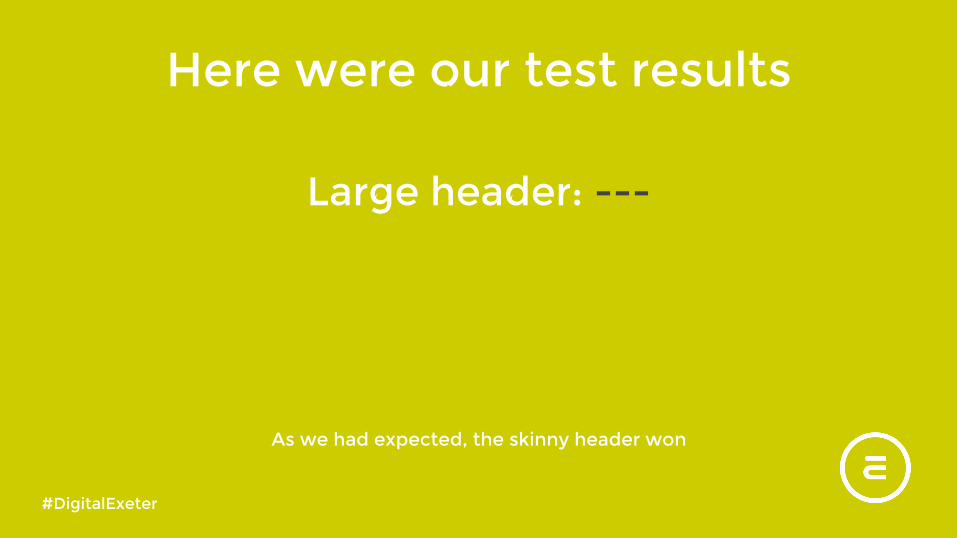
Here were our test results
Large header: ---
As we had expected, the skinny header won
#DigitalExeter
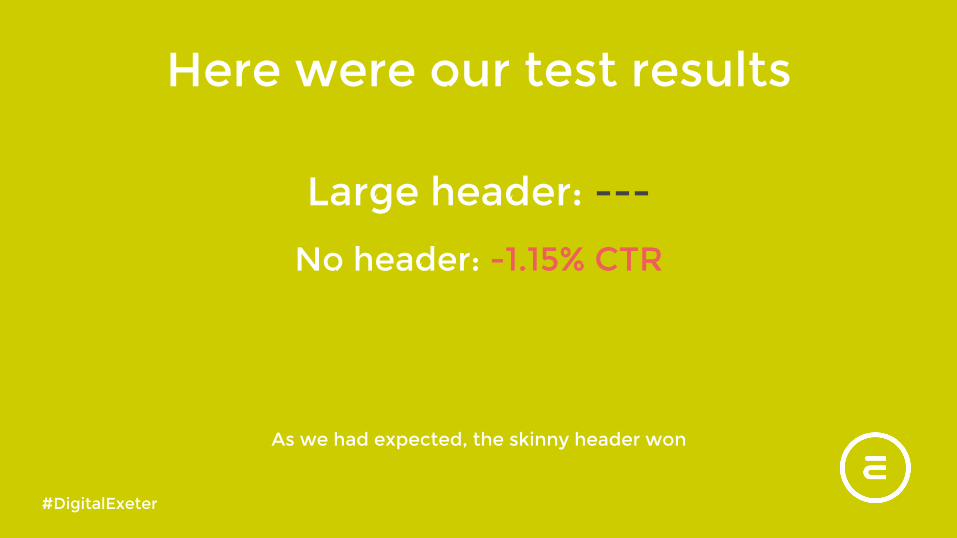
Here were our test results
Large header: ---
No header: -1.15% CTR
As we had expected, the skinny header won
#DigitalExeter
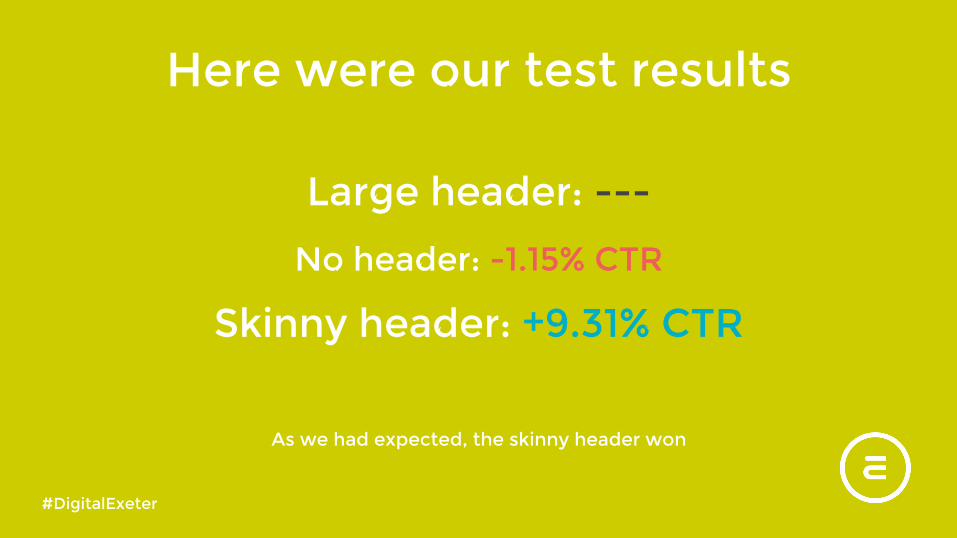
Here were our test results
Large header: ---
No header: -1.15% CTR
Skinny header: +9.31% CTR
As we had expected, the skinny header won
#DigitalExeter
As we predicted, Variation #1 had won!
#DigitalExeter
As we reviewed our A/B data against Google Analytics we learnt something
more important...
BUT...
#DigitalExeter
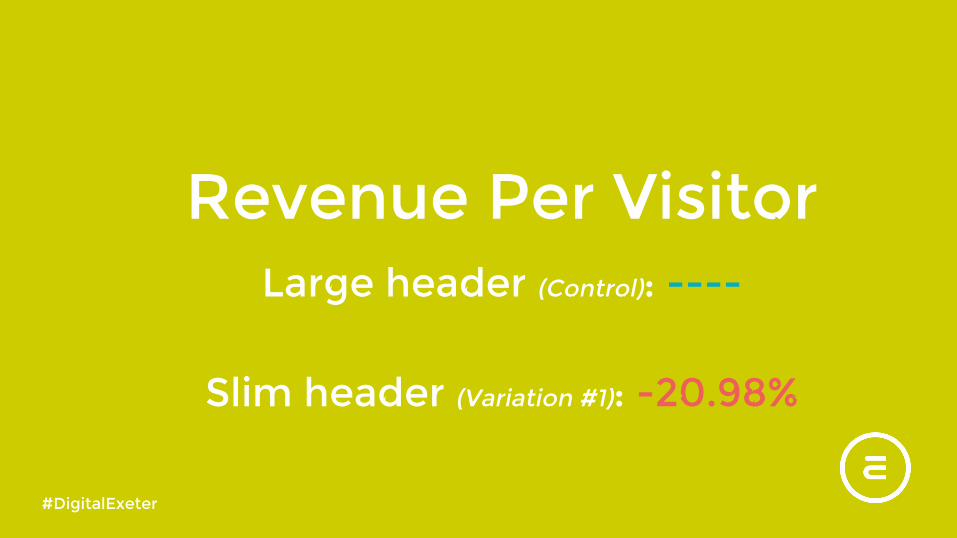
Revenue Per VisitorLarge header (Control): ----
Slim header (Variation #1): -20.98%
#DigitalExeter
But, why did this happen?Let’s quickly recap...
#DigitalExeter
#DigitalExeter
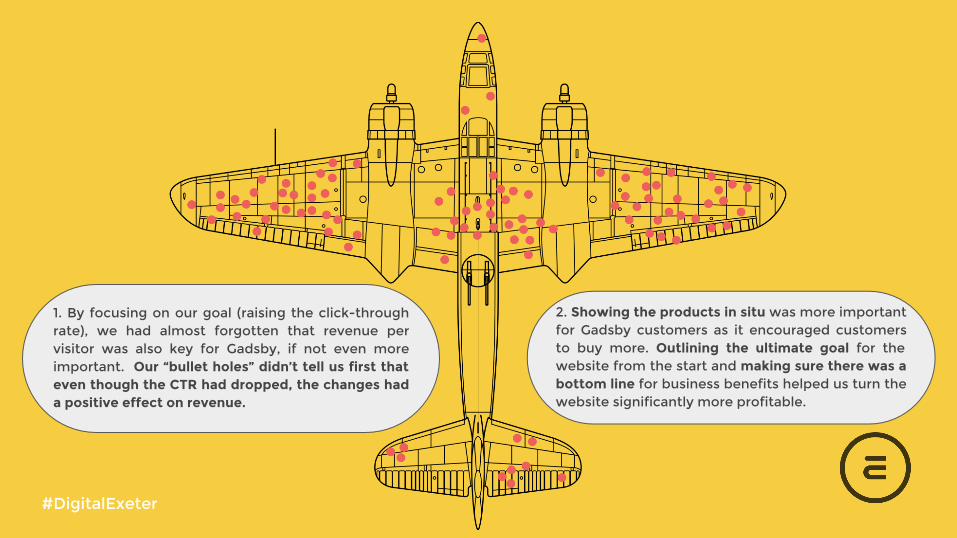
1. By focusing on our goal (raising the click-through rate), we had almost forgotten that revenue per visitor was also key for Gadsby, if not even more important. Our “bullet holes” didn’t tell us first that even though the CTR had dropped, the changes had a positive effect on revenue.
2. Showing the products in situ was more important for Gadsby customers as it encouraged customers to buy more. Outlining the ultimate goal for the website from the start and making sure there was a bottom line for business benefits helped us turn the website significantly more profitable.
Define and ALWAYS refer back to your critical KPIs
As this is an eCommerce site; revenue and orders will always be their #1 Priority
#DigitalExeter
Thank youfor your time
Aran ReeksHEAD OF CLIENT [email protected]: @EvositeAran
Paul RandallSENIOR UX [email protected]: @paulrandall
@Evosite
Get in touch:
#DigitalExeter