wgin2 jic update - wgin - home of lr19/sr25 nils cimmyt donors: • wheatear • kambari 1 •...
TRANSCRIPT

WGIN2 JIC UpdateManagement meeting Feb ‘10

Development of Near Isogenic Lines

Near Isogenic Line development-Example of strategy for 3A height
WGIN1 WGIN2

6A
QTL F1 BC1 BC2 Homozygotes
2D
3B
5A
7B
7D
Avalon x Cadenza Near isogenic line development- Yield

6A
QTL F1 BC1 BC2 Homozygotes
2A
2D
3A
3B
6A
6B
Avalon x Cadenza Near isogenic line development- Crop height

QTL F1 BC1 BC2 Homozygotes
1B
1D
6B
Avalon x Cadenza Near isogenic line development- Ear emergence

Wheat Functionality QTL
• QTL prioritised from Functionality LINK • Only Malacca x Hereward• Only Spiral White process• 5 BCs to Malacca and 3 to Hereward• QTL for: loaf volume (7B and 2D), cell
number (6A and 1B), L* (4D), cell wall thickness (7A), and firmness (2B).
• BC2 seed (Lesley Fish)

Development of Lr19/Sr25 NILs
CIMMYT donors:• Wheatear• Kambari 1• Oasis- no pigment
UK recurrent parents:• Alchemy• Paragon
Progress:• BC2 made• Selection with dominant marker• WGIN COS are co-dominant so ideal for selection of homozygotes
Why – Lr19 on segment of Agropyron elongarum translocation to 7DL, as wellas disease resistance CIMMYT breeders identified a yield advantage in someenvironments.
AE Watkins Collection and population development

Ten AE Watkins x Paragon SSD populations- now at F4
• Extremes- height and ear emergence. Ten SSD populations up to F4 plants, therefore F5 seed in June ’10- 4 fully on track, the other six have winter type stragglers!
• Thousand grain weight, grain length and grain width measured on 1100 Watkins lines. Data available on WGIN website.
• Also 2 SSDs Paragon X CS and JIC synthetic up to F4. F6 seed now sown and DNA extracted from F5. Already used for mapping. Availability of pops (including AxC ) advertised in Graingenes organised by Justin Farris.
• 1071 Watkins accessions in soil house• will go into field (Hege 90, 1m2) Autumn ’10.
• DNA extraction of soil house material (bagged) and minimum 800g of Watkins seed for further work.

Development of AE Watkins genotyped core sets
•Originally proposed DArTbut more efficient to go for SSRs in anticipationof NGS profiling of relatively small (initially) coresets.
• So far 4 SSRs on full pop

Avalon x Cadenza• Workshop held on 3rd Nov at JIC- Genome
Centre
• JIC continues to maintain stocks

Improved A x C map available on website
• http://cbr.jic.ac.uk/threadmapper

New WGIN influenced Projects
• Resource Use Efficiency LINK- ADAS, Limagrain, BASF, JIC.
• BBSRC Flowering time and stress in CCPs Reading and JIC.
• BBSRC LOLA prebreeding programme-with BBSRC.

MichelleLeverington
LuzieWingen
John Snape
LesleyFish
DeboraGasperini
SimonOrford
CatherineBaker
LizSayers
RichardGoram
WGIN at JIC

Segregation of ear emergence for 2939a
0
5
10
15
20
25
1040
‐105
910
60‐107
910
80‐109
911
00‐111
911
20‐113
911
40‐115
911
60‐117
911
80‐119
912
00‐121
912
20‐123
912
40‐125
912
60‐127
912
80‐129
913
00‐131
913
20‐133
913
40‐135
913
60‐137
913
80‐139
914
00‐141
914
20‐143
914
40‐145
914
60‐147
914
80‐149
915
00‐151
915
20‐153
915
40‐155
915
60‐157
915
80‐159
916
00‐161
9
Num
ber o
f plants
Growing Degree Days (cumulative tempºC from sowing date)
Flowering time of paragon wheat varieties, 2939a mutant parents, maris dove parents, and F2 cross
2939xmaris dove
pararagon
maris dove
2939a mutant

Heading date DArT data returned for heading date
• 2939a mutant was crossed with Maris Dove
• 2939a mutant was crossed with Wembley• 423a mutant was crossed with White Fife• 423a mutant was crossed with Koga
Taking Paragon EMS alleles forward

Mutant x Spring cultivars: F2 families12 families – segregations of mutant types height, flowering, leaf senescence and biomass
Tagging plants by visiting students forDNA collection and trait scoring
Leaf senescence segregating

Paragon mutants in Hege 80sLeft – flowering time differences (first two plots) Right – leaf senescence

Grp 7 associations for 423a

‘Late late’ 423a

Gamma M1 mutants:CS bagged left (2500) sown). Paragon (2000 sown) currently bagging right50% fertility rate expected
Now harvested M2 seed- for sowing in spring 2010Scope for a further 4000

Koga 7A nullisomics

Gamma mutagenesis

WGIN226th Feb 2010
Richard GutteridgeKim Hammond‐Kosack
WGIN 2 Objective 10 Take‐all Update

Take‐all disease of wheat
• Gaeumannomyces graminis var. tritici (Ggt)
‐ ascomycete soil borne fungus
‐ related to rice blast fungusMagnaporthe oryzae (previously M. grisea)
Seminal root
Crown root
Ggt infected wheat seedling

Runner hypha
A Ggt infected seminal root
Take‐all lesion

Typical take‐all patch showing stunting and premature ripening of the crop

Objective 10 – Take-all1. Screen Watkins and improved Gediflux
collections for take-all resistance under field conditions.
2. Explore the genetic basis for take-all inoculum build-up using the Avalon x Cadenza mapping population


2008 Watkins Experiment
Only growth regulator, herbicides and nitrogen applied
Excellent year foliar diseases: yellow and brown rust, septoria and mildewAll diseases were scored in July and results can be foundon the WGIN website
Also a good year for the root and stem base diseases

Watkins Hexaploid wheat collection 2008 Take‐all / eyespot assessments
All 740 lines + controls assessed for stem base diseases
eyespotsharp eyespot brown foot rot (fusarium spp.)74,000 straws assessednow in stats
Note : the 2008‐2009 trial was fungicide treated in the spring 2009 to minimise stem base diseases
Only this one year of data

2008 Eyespot assessment
Hereward control (total - 25 plots)
Percentage of straws infected: Slight Moderate Severe33 22 22
Criteria for Resistant lines: slight symptoms and less than 5% moderateinfection, no severe infection.
45 Watkins lines were selected
A list of these lines, together with other lines which are fully susceptible, has been sent to PhD student Christopher Burt (JIC) to analyse for the known resistance to eyespot.Presence of Pch1 using Wmc14 and Barc97 markersPresence of Pch2 using Wmc346, Wmc525 and cfa2040 markers

Hereward ‐ Extra 20 plots ‐ mean TAI = 45.3
5 control blocksVariety TAIHereward 35.6Triticale 18.4Rye 1.7Oats 0.0
Watkins Experiment 2008 RRes Take-all severity - control plots
0‐56‐1516‐2526‐3536‐4546‐ 55> 55
TAI
Mean of all plots Hereward = 43.4
N = 800 plots
Alpha design

Watkins Hexaploid wheat collection 2008 Take‐all / eyespot assessments
• All assessments completed – 740 lines12,000 plants
• Initial findings suggest that 253 lines (34%) can be omitted due to susceptibility to Take‐all.
• Further lines may also be discarded once the stats is completed

A.E.Watkins and Gediflux collection 2008 – 2009 field trial
• The same single plot – Alpha design
• Foliar diseaseswinter/ spring infection by septoria and mildewbut then did not develop further
late infection by yellow rust and brown rust
ALL lines affected recorded but not assessed
- overall less FOLIAR disease than in 2007-2008

500 lines carried forward from the 2008 trial but some may be discarded once statistical analysis complete
78 new lines added not previously tested
Watkins / Gediflux collections field experiment 2010
Watkins
Gediflux collection – 60 lines in total
All lines: For 2 years2008 – 2009 ‐ All assessments completed 2010 experiment was sown October 26th 2009

www.WGIN.org.uk
200 kgN plots

WGIN winter wheat bioassay 2008
Take-all infectivity in the soil after different winter wheat varieties
0
10
20
30
40
50
60
70
Caden
za (C
a)Hur
ley (H
u)
Maris W
idgeon (M
w)Clai
re (C
l)
Cordia
le (C
o)
Sokrat
es (S
k)
Beave
r (Be)
Robigu
s (Ro)
Xi19 (X
i)
Solstic
e (Sl)
Savan
nah (S
a)Riban
d (Ri)
Napier
(Na)
Parago
n (Pa)
Monopol (M
o)
Avalon (
Av)Merc
ia (M
e)Lyn
x (Ly)
Batis (
Ba)
Malacc
a (Ma)
Istab
raq (Is
)
Hereward
(He)
Shamro
ck (S
h)
Soisso
ns (So)
Winter wheat variety
% ro
ots
infe
cted
Consistent ranking over 4 years

% roots infected with take-all in a soil core bioassay Avalon and Cadenza 2005 - 2008 WGIN Diversity trials
0
10
20
30
40
50
60
70
80
90
100
2005 2006 2007 2008
Take‐all –pe
rcen
t roo
ts infected
Year
Avalon
Cadenza

Avalon x Cadenza DH trial
Soil cores, to measure take-all infectivity, were taken from just the parental plots in 2007 and 2008.
The intention was to sample all the A x C DH lines in 2008 but due to the late harvest and the presence of cereal volunteers, this trial was not sampled for the take-all soil infectivity.
In 2009, soil cores were taken from all A x C lines butdue to the presence of Phialophora take-all inoculumbuild-up was severely restricted.

% roots infected with take-all in a soil core bioassay Avalon v Cadenza

2008 Seed multiplication trial
62 A x C lines in a separate field + parental lines (plot size 20m x 2m) for multiplication in 2008 were ploughed and then over sown with Oakley
By July 2009 take-all patches were showing in the areas where the 2008 plots had been sown
These areas were scored for take-all patches as a percentage of area affected
Middle 2 m of each plot was harvested and yield measured

Square Take-all patches

Plot 180 (95% TA)Yield 5.25 t/ha
Plot 181 (5% TA)Yield 9.61 t/ha

Can we genetically analyse and map the trait ?
62 DH lines + parentals scored
Can QTL’s help in the analysis?

Can we genetically analyse and map the trait ?
62 DH lines + parentals scored
Can QTL’s help in the analysis?
Quality Take-all Lesions
YES!!!

Avalon x Cadenza lines in 2008, oversown withwheat cv. Oakley in 2009. Relationship betweentake-all patch score and yield
Take-all patch score (% area of plot affected)
0 20 40 60 80 100 120
Yiel
d t/h
a
4
5
6
7
8
9
10
11
R = 0.9245
AvalonCadenza
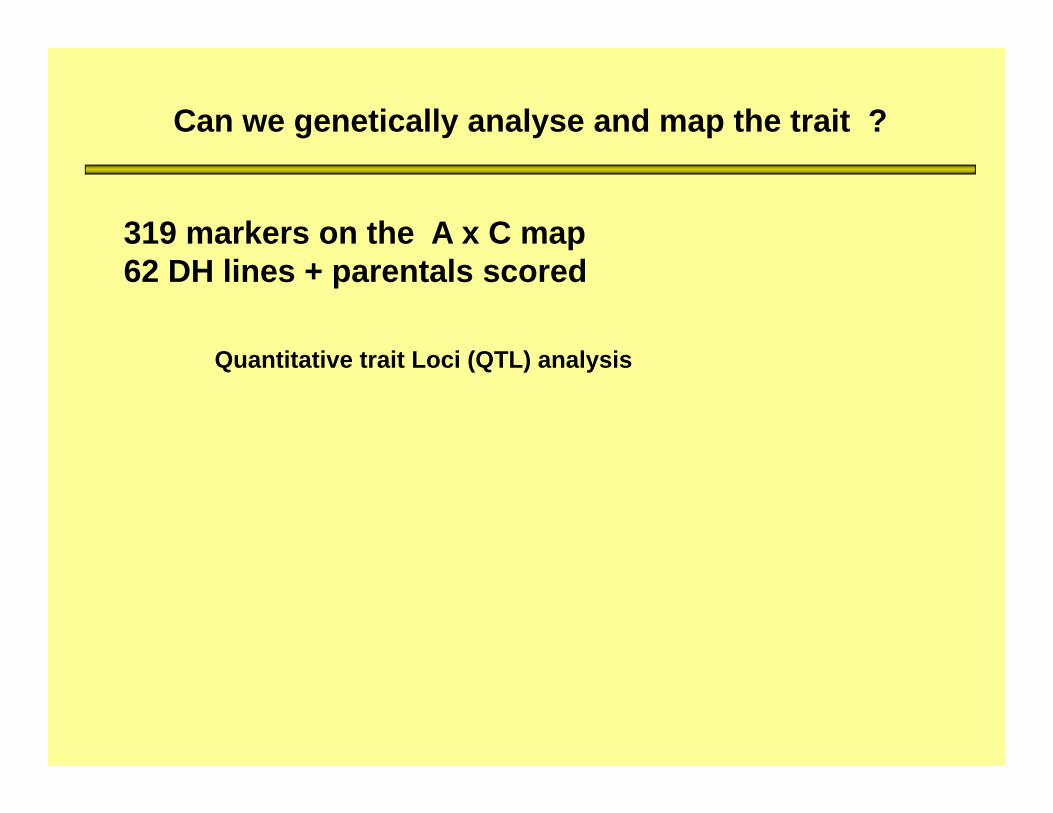
Can we genetically analyse and map the trait ?
319 markers on the A x C map 62 DH lines + parentals scored
Quantitative trait Loci (QTL) analysis

Can we genetically analyse and map the trait ?
319 markers on the A x C map 62 DH lines + parentals scored
Genotyping analysis done by Kostya Kanyuka
Quantitative trait Loci (QTL) analysis

Wheat Pathogenomics Team (RRes)Sanja TreskicVanessa McMillanJames BruceAdrian Czaban
Kim Hammond-KosackHai-Chun JingKostya KanyukaElke Anzinger
BAB DeptStatisticsSue Welham Rodger White
Watkins Exp.Simon Orford (JIC)Elke AnzingerSarah UsherSteve Freeman
The Rothamsted farm staff
A x C map (JIC)Simon GriffithsLeodie AlbertsMichelle Leverington-Waite
Many thanks to…..

WGIN subcontractor selection
Request for proposals
• Request for proposal was advertised through the WGIN mailing list
• Application form was available on www.wgin.org.uk
• Deadline for application was 1st October 2009
• We received five proposals

Selection Process
• Proposals were reviewed by two independent referees and by Defra
• Management meeting October 2009 –discussion on members for selection panel
• A panel comprising Graham Jellis (chair), David Feuerhelm and Peter Jack was convened in December.
• Applicants were notified of the outcome in January 2010

Selected Projects
Applicant: Richard WeightmanProject : Non-destructive screening of WGIN Paragon mutants forgrain NUE traits
Applicants: John Foulkes, Andy Greenland Project : Exploring the use of Δ180 and total mineral ash content in wheat as a new tools for phenotyping wheat with respect to water inputs

5 proposals receivedApplicant: Nigel G. HalfordProject : Measuring precursors of acrylamide, reducing sugars and sucrose in diversity trial
grain infected with take-all, yellow rust and fusarium ear blight.Cost: £12,750.--
Applicant: Richard WeightmanProject : Non-destructive screening of WGIN Paragon mutants for grain NUE traitsCost: £20,680.--
Applicants: Nick Gosman, Eric OberProject: Assessing 50 CIMMYT synthetic hexaploid wheat lines for drought tolerance and
drought-related traits.Cost: 42,723.--
Applicants: Peter Isaac, Simon Griffiths, David Laurie, Graham Moore Project : Gene copy number variation in selected genes (Ppd, Vrn1, Ph1, Rht8, Rht10) in
12 hexaploid wheat varietiesCost: £48,763,--
Applicants: John Foulkes, Andy Greenland Project : Exploring the use of Δ180 and total mineral ash content in wheat as a new tools for
phenotyping wheat with respect to water inputsCost: 49,829.--

Drought tolerance
WGIN-2 SG meetingSyngenta 26 February 2010

WGIN 2 (Activity 9, Drought tolerance)
1. To identify the physiological traits explaining improved water-use efficiency and drought tolerance in elite winter wheat varieties.
2. To identify robust QTLs for water-use efficiency and drought-tolerance traits using one existing DH population in an elite background.
3. To develop one new DH population in an elite modern background segregating for drought-tolerance traits.
4. To identify novel genes and alleles controlling water-use efficiency and drough tolerance using the AE Watkins and Gediflux collections.
5. To collate a diverse germplasm collection (cultivars, advanced lines) from worldwide drought-tolerance wheat breeding programmes as a resource for future association genetics studies.

Crop
water
use
Water-use
efficiency
(biomass)
Harvest
index
Grain
yield = X X
• Flowering
• Stem CHO reserves
• Transpiration efficiency (13C Δ)• Awns
• Stay-green
• Root density
Target traits →
Drought Resistance: Target traits

The image cannot be displayed. Your computer may not have enough memory to open the image, or the image may have been corrupted. Restart your computer, and then open the file again. If the red x still appears, you may have to delete the image and then insert it again.
The image cannot be displayed. Your computer may not have enough memory to open the image, or the image may have been corrupted. Restart your computer, and then open the file again. If the red x still appears, you may have to delete the image and then insert it again.
The image cannot be displayed. Your computer may not have enough memory to open the image, or the image may have been corrupted. Restart your computer, and then open the file again. If the red x still appears, you may have to delete the image and then insert it again.
Ideotype for high sustainable yield under drought
Optimised ABA root signalling
OPTIMIZE WUE
• High 13C Δ• Pn capacity • Specific leaf N
MAXIMIZE WATER CAPTURE
• RLD at depth• β (distribute roots deeper)• Specific root length
EARLINESS
• Extend stem elongation phase• Early onset GS31
MAXIMIZE HARVEST INDEX
• Stem CHO reserves• Stay green

WUE trial 2009-10
Split plot design (3 reps): plot size 1.6 x 12 m Main plot: Fully irrigated (trickle irrigation)
Unirrigated
Split plot (variety):1. Avalon *2. Beaver3. Cadenza *4. Cappelle Deprez5. Cordiale6. Gallant *7. Glasgow8. Hereward *9. Hobbit
* Common with NUE trial
10. Istabraq *11. M. Widgeon12. Oakley *13. Panorama14. Paragon15. Cappelle Deprez16. Soissons17. Xi 19 *18. Zebedee

Measurements• Combine grain yield, yield components • DM and partitioning at GS31, GS61, harvest • % stem WSC at GS61+10d • Leaf senescence kinetics for flag-leaf, L2 and L3. • Stomatal conductance/photosynthetic rate using Licor (unirrigated subset , 7 varieties)• Water use ~ gravimetric analysis of soil cores (unirrigated subset, 7 varieties)

Measurements: isotope analysis of plant samples
• Δ 13C ~ flag leaf @ flowering and grain @ harvest• Δ 18O ~ flag leaf @ flowering• Total mineral ash content ~ flag leaf @ GS61 and grain @ harvest
Analyses on all varieties in both irrigation trts (108 plots):

WGIN 2 (Drought tolerance, 9.2)Project
Month Milestone
30/11/2012 48
Act 9 Obj2: QTL analysis to identify genome locations associated with WUE and drought tolerance traits completed.
Imminent tasks:
~ select DH population for phenotying for yield physiological triats (94 lines and 2 parents) informed by data analysis from LK0986 project
~ seed supply 2 sites (Nottingham and JIC 2010/11 & 2011/12)
~ extend molecular map as necessary with Dart and SSR

WGIN 2 (Drought tolerance, 9.3)Project
Month Milestone
31/03/2012 40
Act 9 Obj3. Complete development of one new DH population in an elite modern background segregating for drought-tolerance traits.
Imminent tasks:
~ select candidate F1(s) to initiate crosses to maize informed by by data analysis from LK0986 project

Evaluation of novel genetic resources
• NIAB backcrossing CIMMYT synthetic wheats (shown in Mexico to have improved drought tolerance) in Xi19 background.
• 29 BC1F3 families grown in small plots (4 x 1 m) and the recurrent parent (Xi19) on the drought-prone light sand at Bunny Park Farm.

Techniques: Oxygen isotope ratio ~ leaf transpiration
• 16O/18O ratio determined by enrichment in the leaf water due to transpiration.
• Leaf water enriched due to the preferential loss of the lighter H2
16O during evaporation.
• Degree of enrichment is related to the ratio of atmospheric to intercellular vapourpressure.
• An increase in stomatal conductanceshould decrease leaf temp. henceintercellular vapour pressure, resulting inless enrichment at the evaporating site.

Relationship between
The relationship between the 3 year mean of cultivar δ18Oleaf and corresponding means of stomatal conductance (gs) measured pre-anthesis, grain yield and δ 13Cleaf for eight CIMMYT spring wheat cvs
Barbour et al. (2000) Aust. J. Plant Physiol., 27, 625–637Oxygen isotope ratio of leaf and grain material correlates with stomatal conductance and grain yield in irrigated wheat
δ18O is not thought to be strongly influenced by photosynthetic rate, so that combined measurement of both δ13C and δ18O should allow stomatal and photosynthetic effects on δ13C to be teased apart

The analysis of mineral ash content analysis is significantly less expensive than Δ13C or Δ18O, so may be a useful alternative for these screens.

Techniques: Mineral ash content ~ water use
Total leaf ash content of plant tissues is suggested as a useful tool to predict yield under drought.
The mechanism of mineral accumulation in plant tissues appears to be explained through the passive transport of minerals via xylem driven by transpiration.
Thus, ash content measured in plant tissues provides an indicator of the total water transpired.
The analysis of mineral ash content analysis is significantly less expensive than Δ13C or Δ18O, so may be a useful alternative for these screens in trials.

Chemical analysis Total
No. samples 13C 18O Ash%Flag leaf @ GS61 108 108 108 324Grain @ harvest 108 108 216
Proposed assessments in WGIN drought tolerance trial in 2009/19 and 20010/11
• Genetic variability in chemical analysis traits will becompared with grain yield (all varieties) and water use(subset of 7 varieties, capacitance probes) in the WGINdrought trial in 2009/10 and 2010/11.

Treatment
Irrigated Residual moisture
Phenotypic correlation with grain yield
δ13C leaf anth 0.069 NS 0.527*
Ash% leaf mat 0.489* 0.678***
Ash% grain mat 0.362 0.071 NSPhenotypic correlation with δ13C grain
δ13C leaf anth 0.001 0.498*
Ash% leaf mat 0.134 0.620**
Ash% grain mat 0.057 0.108 NS
Monneveux et al. 2005 Eur. J. Agron. 22 231-242
Relationship between leaf δ13C (at anthesis) and leaf ash content (at anthesis and maturity) and grain yield and grain δ13C for 20 CIMMYT spring wheat cultivars

WGIN 2 (Activity 9, Drought tolerance)Project Month Milestone
30/11//2011 36Act 9 Obj1: Complete phenotyping and data analysis for drought
tolerance traits in elite winter wheat varieties in 2009/10 &10/11.
30/11/2012 48Act 9 Obj2: QTL analysis to identify genome locations associated with
WUE and drought tolerance traits completed.
31/03/2012 40Act 9 Obj3. Complete development of one new DH population in an
elite modern background segregating for drought-tolerance traits.
28/02/2013 51Act 9 Obj4: Association genetics analysis of drought tolerance traits
using AE Watkins & Gediflux collections completed.
28/02/2013 51
Act 9 Obj5: Collation of diverse germplasm collection (cultivars, advanced lines) from worldwide drought-tolerance wheat breeding programmes completed.

www.adas.co.uk
Non-destructive screening of WGIN Paragon mutants
for grain NUE traits
Richard Weightman, ADAS BoxworthWGIN management meeting 26/02/10

Agenda
PartnersBackground, grain NUE traitsDevelopment of NIR calibrationsPerformance of existing calibrationsWork programme

Partners
ADAS R Weightman, D KindredJIC Simon GriffithsSCRI Stuart SwanstonAunir Chris Piotrowski

Aunir
developers & suppliers of NIR calibrations, support contracts and consultancyNIR software products used in >35 countries covering diverse range of food & feed applicationswork closely with FOSS (& others)

GREEN grain ProjectGenetic Reduction of Energy use and Emissions of Nitrogen through cereal production
y = -5.3979x + 504.03R2 = 0.8898
400410420430440450460470480490
5 6 7 8 9 10 11 12 13 14Protein % (by NIR)
Alc
ohol
yie
ld (b
y N
IR)

Storage protein fractions
GG hypothesis relates to reducing gliadins in grain
Increase in response to applied NMajor storage proteinNeed rapid screening toolTool could then be used to screen for ‘mutants’ or null gliadin lines

Embryo & bran
Endosperm
Wheat grain … response to N supply
0
50
100
150
0 100 200N applied (kg/ha)
prot
ein
(g/k
g gr
ain
DM
)
400
gliadin
gluteninalb & glob
NPN & res
Dubetz, Gardiner, Flynn & de la Roche (1979).

Storage proteins - methods
Gel electrophoresisnot quantitative
Fractionation (salt, alcohol soluble etc)Laborious, variable
SE-HPLCRelatively expensive, sensitive, quantitifies all fractions following single extraction

Typical chromatogram
0
10000
20000
30000
40000
50000
60000
70000
80000
90000
0 5 10 15 20 25
Time (min)
F1: HMW glutenins
F2: LMW glutenins
F3: Gliadins
F4: Gliadins
F5: Albumins &Globulins
Typical SE-HPLC chromatogramfor wheat protein

Response of storage proteins to applied N
0.0
1.0
2.0
3.0
4.0
5.0
6.0
0 50 100 150 200 250
N applied (kg/ha)
Prot
ein
(g/1
00 g
DM
) (a)
0.0
1.0
2.0
3.0
4.0
5.0
6.0
6 7 8 9 10 11 12
Total protein (g/100 g DM)Pr
otei
n (g
/100
g D
M)
(b)
GliLMW
A&G
HMW
Riband lower Gli
Kindred et al., Journal of Cereal Science, 48; 46-57 2008
SE-HPLC method – Riband and Option data set

NIR calibrations
FOSS Infratec

Ref dataset selection rationale (1)Ensured both +/- N represented, Initial sample selection within sites selected genotypes with contrasting protein, TGW and width:length combinations:
P:TGW:LW code Protein TGW LW1 H H H2 H H L3 H L H4 L H H5 L L H6 L H L7 H L L8 L L L

Ref dataset selection rationale (2)
P:AY:GLI code Protein AY Gliadin1 H H H2 H H L3 H L H4 L H H5 L L H6 L H L7 H L L8 L L L
From season 2Included samples based on year 1 NIR predictions for AY and gliadin

NIR calibrations – protein fractions
Reasonable calibrations for gliadins and LMW glutenins
… but don’t know if the calibration is mainly detecting total protein
y = 0.9572x + 0.076R2 = 0.9211
0
1
2
3
4
5
6
7
8
9
10
0 2 4 6 8 10
NIR predicted Gliadin DM% (*prot) GG0005
Mea
sure
d G
liadi
n D
M%
HPL
C (*
prot
) y = 1.0137x + 0.0397R2 = 0.805
0
1
2
3
4
5
0 1 2 3 4 5
NIR predicted LMW DM% (*prot) GG0005M
easu
red
LMW
DM
% H
PLC
(*pro
t)

NIR calibrations – protein fractions
Poorer calibrations for HMW glutenins and albumins&globulins
y = 0.8021x + 0.0722R2 = 0.444
0.0
0.2
0.4
0.6
0.8
1.0
1.2
1.4
1.6
1.8
2.0
0.0 0.5 1.0 1.5 2.0
NIR predicted HMW DM% (*prot) GG0005
Mea
sure
d HM
W D
M%
HPL
C(*p
rot)
y = 0.8282x + 0.5972R2 = 0.2336
0
1
2
3
4
5
0.0 1.0 2.0 3.0 4.0 5.0
NIR predicted Alb Glob DM% (*prot) GG0005M
easu
red
Alb
Glo
b D
M%
HPL
C(*
prot
)
NIR calibrations – protein fractions
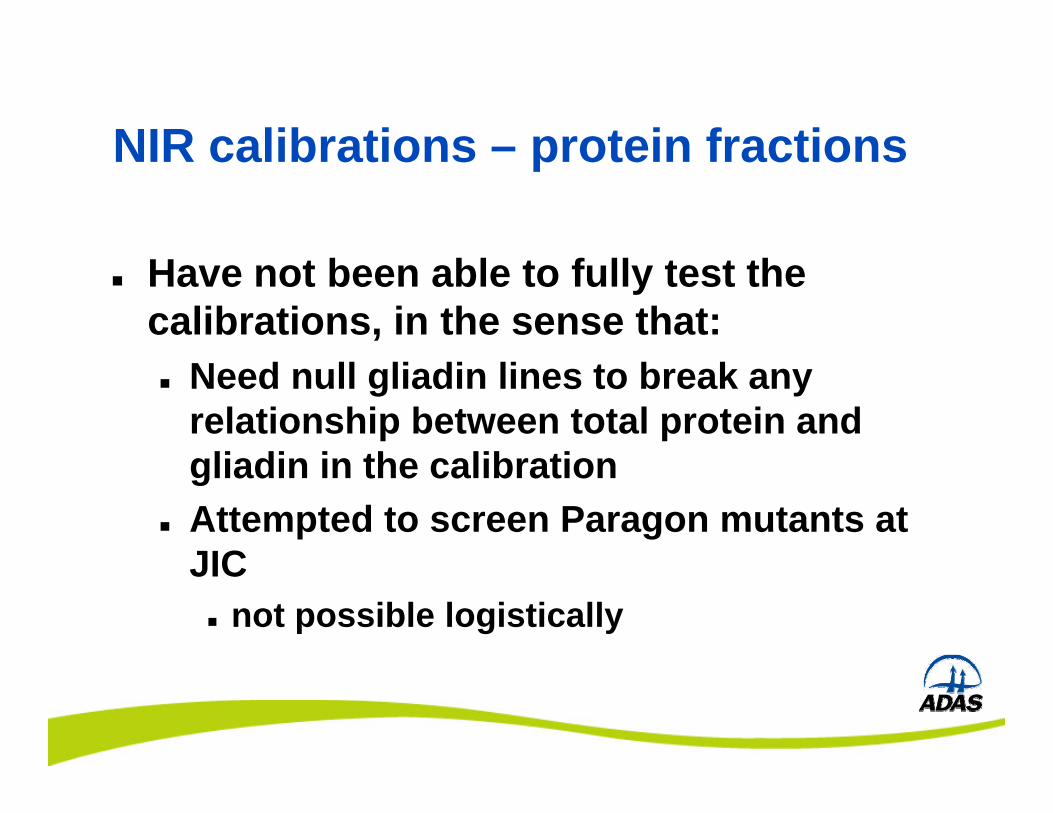
Have not been able to fully test the calibrations, in the sense that:
Need null gliadin lines to break any relationship between total protein and gliadin in the calibrationAttempted to screen Paragon mutants at JIC
not possible logistically

EMPP
EMS mutated Paragon populationIf mutants can be identified with reduced gliadin/protein but without damage to starch formation, this would allow testing of whether low grain N storage improves N use
Large number of lines (~6500)Seed samples valuable
Quantities for phenotyping small (<50g)Standard Infratec takes 1 kg samples

Calibrations which have been developed
Alcohol yield (L/t)Residue viscosityGliadin content (%DM)LMWG, A&G, HMWG (%DM)Protein fractions (% of total protein)(+ standard protein & starch)
Need to set up on FOSS 6500 model (wider spectral range, smaller cell size)

NIR calibrations – Alcohol yield
Calibration based on full ref dataset and CEL data
y = 0.9592x + 17.935R2 = 0.8046
380
400
420
440
460
480
500
380 400 420 440 460 480 500
PAY (NIR GG00006) l/t
AY
(SW
RI m
eas)
l/t
Have a useful NIR tool
Appears difficult to get higher R2 than ~0.8
However adds a ‘variety’ factor on top of predicting AY from protein only

435
440
445
450
455
460
465
470
475
480
485
2.0 3.0 4.0 5.0 6.0 7.0
NIR predicted gliadin (%DM)
NIR
pre
dict
ed a
lcoh
ol y
ield
(L/t) Deben
Zebedee
Use of NIR models to detect variety differences
Green Grain data 2005-2008 – site means from HM, TT, SCRI

6.00
7.00
8.00
9.00
10.00
11.00
12.00
2.00 3.00 4.00 5.00 6.00 7.00
Gliadin by NIR %DM
Gra
in p
rote
in %
DM
DebenZebedee
Use of NIR models to detect variety differences

Work plan (1)Transfer ref samples SCRI to Aunir (month 1)Development of calibrations at Aunir for advanced platform (FOSS 6500, XDS) able to scan small samples (month 1)Transfer machine to JIC, train staff

Work plan (2)Scan minimum 3000 samples from EMPP (months 2-4)Predictions transferred to ADAS study relationships between AY and protein, gliadins and protein etc (month 5)Final report: findings, conclusions, recommendations for future research (month 6)
