wgbis.ces.iisc.ernet.inwgbis.ces.iisc.ernet.in/biodiversity/sahyadri_enews/...page : executive...
TRANSCRIPT

Monitoring of Indian Aquatic Resources Series: MINARS/ 29 /2008-2009
STATUS OF WATER QUALITY IN INDIA- 2007
CENTRAL POLLUTION CONTROL BOARD MINISTRY OF ENVIRONMENT & FORESTS
Website: www.cpcb.nic.in e-mail: [email protected]
JULY 2008


CONTRIBUTIONS
Supervision and Co-ordination : Dr. B. Sengupta, Member Secretary
Dr. R.C. Trivedi, Additional Director
Report Preparation : Mr. R.M. Bhardwaj, Scientist `C’
Ms. Garima Dublish, Junior Research Fellow
Ms. Sandhya Shrivastava, Junior Research Fellow
Ms. Shweta Gaur, Junior Research Fellow

CONTENTS
Page
Executive Summary I-VII
Chapter I Introduction and Methodology of National Water Quality Monitoring Programme
1-12
1.1 Introduction 1.2 Water resources of India 1.2.1 Surface Water 1.2.2 Ground Water 1.3 Water Quality Monitoring Programme 1.3.1 Objectives 1.3.2 Monitoring Network 1.3.3 Parameters Observed 1.3.4 Frequency of Monitoring 1.3.5 River Basin wise Distribution of Water Quality Monitoring Stations 1.4 Approach to Water Quality Management Chapter II Water Quality Trend in India 13-22 2.1 Water Quality Trend 2007 2.2 Biochemical Oxygen Demand (BOD) 2.3 Total Coliform (TC) 2.4 Faecal Coliform (TC) 2.5 Water Quality Trend (1995-2007) 2.6 Water quality Trend of BOD in Rivers Chapter III Water Quality of Rivers at a Glance 23-32 3.1 Observed Water Quality 3.2 Organic and Pathogenic Pollution 3.3 Other parameters 3.4 Groundwater Quality Chapter IV Water Quality of Rivers in Indus Basin 33-36 4.1 Indus River System 4.2 Water Quality Monitoring in Indus Basin 4.2.1 Water Quality of river Beas 4.2.2 Water Quality of river Satluj 4.2.3 Water Quality of rivers Ravi, Parvati, Largi,Swan and Sirsa Chapter V Water Quality of Rivers in Ganga Basin 37-45 5.1 Ganga River System 5.2 Water Quality Monitoring in Ganga Basin 5.2.1 Water Quality of river Ganga 5.2.2 Water Quality of river Yamuna 5.2.2.1 Major Water Quality Segments 5.2.2.2 Critical Segments 5.2.2.3 Water Quality of river Yamuna 5.2.3 Water Quality of tributaries - Kalinadi, Ramganga, Gomti, Saryu,
Ghaghara, Hindon, Kali- Hindon, Rihand, Rapti, Sikrana, Sai, Sirsa,

Page
Daha, Farmar and Gandak 5.2.4 Water Quality of tributaries - Chambal, Khan, Kshipra, Parvati,
Betwa, Sind, Tons, Sone, Johila, Sankh, Mandakini and Gohad
5.2.5 Water Quality of tributaries – Damodar, Barakar, Mahananda and Rupnarayan
Chapter VI Water Quality of Rivers in Brahmaputra Basin 46-49 6.1 Brahmaputra River System 6.2 Water Quality Monitoring in Brahmaputra Basin 6.2.1 Water Quality of river Brahmaputra 6.2.2 Water Quality of tributary stream Dhansiri 6.2.3 Water Quality of tributary streams Subansiri, Kharsang,
Burhidihing, Pagladia, Digboi, Jai Bharali, Kolong, Manas, Disang, Jhanji, Bhogdoi, Mora Bharali, Borak, Bharalu, Kathakal and Deepar Bill
Chapter VII Water Quality of Rivers in Mahi Basin 50-51 7.1 Mahi River System 7.2 Water Quality Monitoring in Mahi Basin 7.2.1 Water Quality of river Mahi and tributaries Panam and Anas Chapter VIII Water Quality of Rivers in Sabarmati Basin 52-54 8.1 Sabarmati River System 8.2 Water Quality Monitoring in Sabarmati Basin 8.2.1 Water Quality of River Sabarmati 8.2.2 Water Quality of tributary streams Shedi and Khari Chapter IX Water Quality of Rivers in Narmada Basin 55-57 9.1 Narmada River System 9.2 Water Quality Monitoring in Narmada Basin 9.2.1 Water Quality of River Narmada and Tributary Chota Tawa Chapter X Water Quality of Rivers in Tapi Basin 58-60 10.1 Tapi River System 10.2 Water Quality Monitoring in Tapi Basin 10.2.1 Water Quality of River Tapi, Tributary Girna and Rangavali Chapter XI Water Quality of Rivers in Mahanadi Basin 61-65 11.1 Mahanadi River System 11.2 Water Quality Monitoring in Mahanadi Basin 11.2.1 Water Quality of River Mahanadi 11.2.2 Water Quality of Tributaries Seonath, Kharoon, Hasdeo, Arpa,
Kelo, Ib, Kuakhai, Kathajodi and Birupa
Chapter XII Water Quality of Rivers in Brahmani & Baitarni Basin 66-67 12.1 Brahmani and Baitarni River System 12.2 Water Quality Monitoring in Brahmani and Baitarni Basin 12.3 Water Quality of River Brahmani 12.4 Water Quality of River Baitarni Chapter XIII Water Quality of Rivers in Subarnarekha Basin 68-69 13.1 Subarnarekha River System 13.2 Water Quality Monitoring in Subarnarekha Basin
Page
13.3 Water Quality of River Subarnarekha Chapter XIV Water Quality of Rivers in Godavari Basin 70-73 14.1 Godavari River System 14.2 Water Quality Monitoring in Godavari Basin 14.2.1 Water Quality of River Godavari 14.2.2 Water Quality in tributaries streams Indravati, Shankni,Manjra,
Maner, Wardha, Wainganga, Kolar, Kanhan, Purna and Nira
Chapter XV Water Quality of Rivers in Krishna Basin 74-77 15.1 Krishna River System 15.2 Water Quality Monitoring in Krishna Basin 15.2.1 Water Quality of River Krishna 15.2.2 Water Quality of tributary streams Panchganga and Bhima 15.2.3 Water Quality of tributary streams Chandrabhaga, Kagina,
Ghatprabha, Malprabha, Nira Tungbhadra, Tunga, Bhadra, Musi, Palleru and Muneru
Chapter XVI Water Quality of Rivers in Penneru Basin 78-79 16.1 Penneru River System 16.2 Water Quality Monitoring in Penneru Basin 16.2.1 Water Quality of River Penneru Chapter XVII Water Quality of Rivers in Cauvery Basin 80-82 17.1 Cauvery River System 17.2 Water Quality Monitoring in Cauvery Basin 17.2.1 Water Quality of river Cauvery 17.2.2 Water Quality of tributary streams Yagachi, Hemavati, Shimsa,
Arkavati, Lakshmantirtha, Kabbani, Bhavani and Amravati
Chapter XVIII Water Quality of Medium and Minor Rivers, Canals and Creeks 83-87 18.1 Medium and Minor River System
18.2 Water Quality of Medium and Minor Rivers in Gujarat & Daman 18.3 Water Quality of Medium and Minor Rivers in Goa and
Maharashtra
18.4 Water Quality of Medium and Minor Rivers in Kerala 18.5 Water Quality of Medium and Minor Rivers in Andhra Pradesh,
Orissa, Pondicherry, Tamilnadu and Karnataka
18.6 Water Quality of Medium and Minor Rivers in Himachal Pradesh, Punjab, Haryana, Chandigarh and Rajasthan
18.7 Water Quality of Medium and Minor Rivers in Manipur, Meghalaya, Mizoram and Tripura
18.8 Water Quality of Creeks and Canals 18.8.1 Water Quality of Creeks 18.8.2 Water Quality of Canals Chapter XIX Water Quality of Lakes, Tanks and Ponds 88-91 19.1 Lantic Water Bodies 19.2 Lakes, Tanks and Ponds in Andhra Pradesh, Karnataka, Kerala,
Tamilnadu, Pondicherry and Goa
19.3 Lakes in Gujarat Madhya Pradesh and Rajasthan.

Page
19.4 Lakes in Haryana, Himachal Pradesh, Punjab, Chandigarh,Uttar Pradesh, Uttaranchal and West Bengal
19.5 Lakes, Tanks and Ponds in Assam, Manipur, Meghalaya and Tripura Chapter XX Assessment of Groundwater Quality 92-96 20.1 Ground Water Quality Monitoring 20.2 State wise Groundwater Quality Monitoring 20.3 Status of Ground Water Quality in Andhra Pradesh 20.4 Status of Ground Water Quality in Assam, Meghalaya, Mizoram
and Tripura
20.5 Status of Ground Water Quality in Chattisgarh and Madhya Pradesh 20.6 Status of Ground Water Quality in Himachal Pradesh, Chandigarh
and Punjab
20.7 Status of Ground Water Quality in Kerala 20.8 Status of Ground Water Quality in Pondicherry and Tamil Nadu 20.9 Status of Ground Water Quality in Daman, Maharashtra and Gujarat 20.10 Status of Ground Water Quality in Rajasthan 20.11 Status of Ground Water Quality in Uttar Pradesh and Uttaranchal 20.12 Status of Ground Water Quality in West Bengal 20.13 Status of Ground Water Quality in Orissa
• Annexure-I Water Quality Data Page1-Page43 • River Basins -Indus, Ganga, Brahmaputra, Mahi, Sabarmati, Narmada, Tapi, Mahanadi,
Brahmani and Baitarni, Subarnarekha, Godavari, Krishna, Penneru & Cauvery • Medium & Minor Rivers, Canals, Creeks and Drains • Statewise - Lakes, Tanks and Ponds • Statewise - Groundwater .

EXECUTIVE SUMMARY
The water quality data on rivers, lakes, ponds, tanks and groundwater locations being monitored under the network is evaluated against the water quality criteria and the monitoring locations in exceedence with respect to one or more parameters are identified as polluted and require action for restoration of water quality. The locations on rivers, lakes, ponds, tanks and groundwater not meeting the criteria are summarized briefly in this chapter. During 2007 the highest BOD (one of the most important indicators of pollution) was observed in rivers Amlakhedi (522 mg/l) followed by Sabarmati (310 mg/l), Kalinadi (233 mg/l), Markanda (218 mg/l), Khan (125 mg/l), Hindon (120 mg/l), Yamuna (93 mg/l), Ghaggar (81 mg/l), Musi (51 mg/l), Birupa (42 mg/l), Cauvery (38 mg/l), Kharoon (38 mg/l), Sukhana (36 mg/l), Bharalu (36 mg/l), Godavari (36 mg/l), Kuakhai (36 mg/l), Kathajodi (36 mg/l), Chambal (34 mg/l), Seonath (30 mg/l), Bhima (28.6 mg /l), Satluj (28 mg/l), Ib (25.2 mg/l), Tapi (25 mg/l), Kali-Hindon (24 mg/l), Girna (23 mg/l), Bhadra (22.5 mg/l), Khari (19 mg/l), Kolak (19 mg/l), Manjira (18 mg/l), Tunghabhadra (16.5 mg/l), Damanganga (16 mg/l), Kshipra (15 mg/l), Nambul (14.6 mg/l), Ganga (14 mg/l), Ramganga (14 mg/l), Tunga (13.5 mg/l), Karamana (13.2 mg/l), Gomti (12 mg/l), Nira (11.5 mg/l), Deepar Bill (11 mg/l), Chandrabhaga (10.2 mg/l), Laxmantirtha (10 mg/l) and Krishna (9.8 mg/l). The relatively low values of BOD are measured in river(s) Beas, Mahi, Narmada, Brahmaputra, Mahanadi, Pennar, Baitarni and Brahmani. Very high values of Biochemical Oxygen Demand (BOD) observed in Lakes, Ponds and Tanks are Elangabeel System (174.0 mg/l) in Assam, Saroonagar, Ranga Reddy Dist. A.P (24 mg/l), Udhagamadalem Lake (Ooty) (21 mg/l), Heballa Valley Lake, Mandya (18 mg/l), Hussain Sagar Lake, Budamaru, A.P (16 mg/l), Bahour Lake (14 mg/l), Pushkar Lake (13.3 mg/l), Oruvathilkotta Lake (12.2 mg/l), Bindu Sarovar at Siddhpur, Patan, Gujarat (12 mg/l), Osteri Lake (12 mg/l), Sursagar Lake (11 mg/l), Udaisagar Lake (10.8 mg/l) and Thol Tank (Kalol) (Dist. Mehasana) (10 mg/l).
The level of DO is observed more than 4 mg/l in river Narmada, Brahmaputra, Mahanadi, Brahmani, Baitarni, Subernarekha and Beas throughout the year to sustain aquatic life whereas, the values less than 4 mg/l are observed in stretches of river Satluj (3.2 mg/l), Ganga (1.4 mg/l), Yamuna (0.0 mg/l), Hindon (0.0 mg/l), Mahi (0.4 mg/l), Gomti (1.1 mg/l), Dhansiri (1.2 mg/l), Sabarmati (0.0 mg/l), Shedi (3.7 mg/l), Godavari (3.2 mg/l), Tapi (3.7 mg/l), Krishna (3.0 mg/l), Bhima (1.7 mg/l), Panchaganga (2.3 mg/l), Musi (0.0 mg/l), Pennar (2.8 mg/l), Cauveri (0.0 mg/l), Damanganga (3.1 mg/l), Karamana (0.0 mg/l), Ghaggar (1.0 mg/l), Swan (2.4 mg/l), Himachal Pradesh, Kali (East) (0.0 mg/l), Kali (West) (0.0 mg/l), Chambal (0.0 mg/l), Bharalu (0.0 mg/l), Sankh (1.9 mg/l), Maner (2.9 mg/l), Lakshmantirtha (0.0 mg/l), Bhavani (2.8 mg/l), Kolak (2.8 mg/l), Mindhola (2.5 mg/l), Periyar (2.7 mg/l), Pamba (3.7 mg/l), Manimala (0.6 mg/l), Irumpanam (2.2 mg/l), Markanda (1.0 mg/l), Sukhna (3.0 mg/l), Imphal (3.4 mg/l), Khuga (3.8 mg/l), Ganol (1.4 mg/l), Simsang (2.0 mg/l), Gumti (3.7 mg/l),
I

Sekmai (3.2 mg/l) and at few locations downstream of urban settlements due to discharge of untreated/partially treated municipal wastewater, which is responsible for high oxygen demand. Total Coliform and Faecal Coliform Numbers are observed very high in river Yamuna with highest count of 32X107 MPN/100 ml and 23X107 MPN/100 ml respectively followed by Kali (35X106 MPN/100 ml and 16X104 MPN/100 ml), Hindon (35X106 MPN/100 ml and 16X104 MPN/100 ml), Chambal(87X105 MPN/100 ml and 22X103 MPN/100 ml), Damodar (45X105 MPN/100 ml and 25X105 MPN/100 ml), Ghaggar (35X105 MPN/100 ml and 23X104 MPN/100 ml), Ganga (31X105 MPN/100 ml and 7X10⁵ MPN/100 ml), Tons river (131X104 MPN/100 ml and 121 X102 MPN/100 ml), Rupnarayan (7X10⁵ MPN/100 ml and 4X10⁵ MPN/100 ml), Kali-Hindon (27X104 MPN/100 ml and 46X103 MPN/100 ml), Brahmaputra (24X104 MPN/100 ml and 24X104 MPN/100 ml), Bharalu (24X104 MPN/100 ml and 24X104 MPN/100 ml), Bhogdoi (24X104 MPN/100 ml and 46X103 MPN/100 ml), Satluj (17X104 MPN/100 ml and 9X10⁴ MPN/100 ml), Kathajodi (16X104 MPN/100 ml and 92X103 MPN/100 ml), Gomti (16X104 MPN/100 ml and 9X10⁴ MPN/100 ml), Barakar (16X104 MPN/100 ml and 5X10⁴ MPN/100 ml), Mindhola (11X104 MPN/100 ml and 46X103 MPN/100 ml), Borak (11X104 MPN/100 ml and 15X103 MPN/100 ml), Sabarmati (75X103 MPN/100 ml and 15X103 MPN/100 ml), Krishna (716X102 MPN/100 ml and 1600 MPN/100 ml), Brahmani (54X103 MPN/100 ml and 22X103 MPN/100 ml), Tapi (46X103 MPN/100 ml and 15X103 MPN/100 ml), Kathakal river (46X103
MPN/100 ml and 93X102 MPN/100 ml), Baleshwar Khadi (46X103 MPN/100 ml and 24X103 MPN/100 ml), Purna (46X103 MPN/100 ml and 24X103 MPN/100 ml), Karmana (39X103 MPN/100 ml and 31X103 MPN/100 ml), Godavari (36X103 MPN/100 ml and 2200 MPN/100 ml), Mahanadi (35X103 MPN/100 ml and 17X103 MPN/100 ml), Kuakhai (35X103 MPN/100 ml and 17X103 MPN/100 ml), Nagavalli (35X103 MPN/100 ml and 2600 MPN/100 ml), Cauvery (28X103
MPN/100 ml and 17X103 MPN/100 ml), Valvant ( 24X103 MPN/100 ml and 16X103 MPN/100 ml), Kaveri (24X103 MPN/100 ml and 15X103 MPN/100 ml), Mahananda (22X103 MPN/100 ml and 4X10³ MPN/100 ml), Bhavani (22X103
MPN/100 ml and 3300 MPN/100 ml), Ambika (21X103 MPN/100 ml and 15X103
MPN/100 ml), Kalna (16X103 MPN/100 ml and 9200 MPN/100 ml), Khandepar (16X103 MPN/100 ml and 9200 MPN/100 ml) and Sikrana (16X103 MPN/100 ml and 9X10³ MPN/100 ml) at certain other locations. The river Mahi, Subernarekha, Pennar, Beas, Baitarni and Narmada are relatively clean rivers as the number of Total Coliform and Faecal Coliform count are relatively less than 4300 MPN/100 ml and 1700 MPN/100 ml respectively. The monitoring results obtained during 2007 indicate that organic pollution continues to be the predominant pollution of aquatic resources. The organic pollution measured in terms of bio-chemical oxygen demand (BOD) & Coliform bacterial count gives the indication of extent of water quality degradation in different parts of our country. It is observed that nearly 69% of the observations are having BOD less than 3 mg/l, 18% between 3-6 mg/l & 13% above 6 mg/l.
II
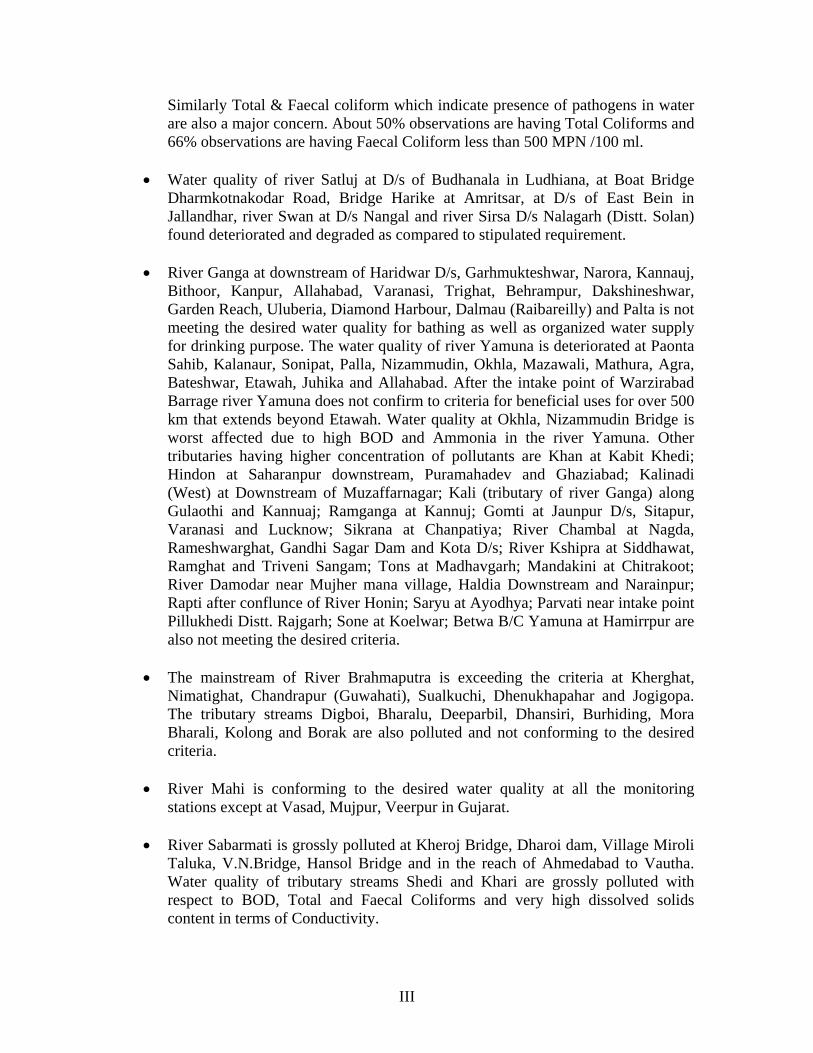
Similarly Total & Faecal coliform which indicate presence of pathogens in water are also a major concern. About 50% observations are having Total Coliforms and 66% observations are having Faecal Coliform less than 500 MPN /100 ml.
• Water quality of river Satluj at D/s of Budhanala in Ludhiana, at Boat Bridge Dharmkotnakodar Road, Bridge Harike at Amritsar, at D/s of East Bein in Jallandhar, river Swan at D/s Nangal and river Sirsa D/s Nalagarh (Distt. Solan) found deteriorated and degraded as compared to stipulated requirement.
• River Ganga at downstream of Haridwar D/s, Garhmukteshwar, Narora, Kannauj,
Bithoor, Kanpur, Allahabad, Varanasi, Trighat, Behrampur, Dakshineshwar, Garden Reach, Uluberia, Diamond Harbour, Dalmau (Raibareilly) and Palta is not meeting the desired water quality for bathing as well as organized water supply for drinking purpose. The water quality of river Yamuna is deteriorated at Paonta Sahib, Kalanaur, Sonipat, Palla, Nizammudin, Okhla, Mazawali, Mathura, Agra, Bateshwar, Etawah, Juhika and Allahabad. After the intake point of Warzirabad Barrage river Yamuna does not confirm to criteria for beneficial uses for over 500 km that extends beyond Etawah. Water quality at Okhla, Nizammudin Bridge is worst affected due to high BOD and Ammonia in the river Yamuna. Other tributaries having higher concentration of pollutants are Khan at Kabit Khedi; Hindon at Saharanpur downstream, Puramahadev and Ghaziabad; Kalinadi (West) at Downstream of Muzaffarnagar; Kali (tributary of river Ganga) along Gulaothi and Kannuaj; Ramganga at Kannuj; Gomti at Jaunpur D/s, Sitapur, Varanasi and Lucknow; Sikrana at Chanpatiya; River Chambal at Nagda, Rameshwarghat, Gandhi Sagar Dam and Kota D/s; River Kshipra at Siddhawat, Ramghat and Triveni Sangam; Tons at Madhavgarh; Mandakini at Chitrakoot; River Damodar near Mujher mana village, Haldia Downstream and Narainpur; Rapti after conflunce of River Honin; Saryu at Ayodhya; Parvati near intake point Pillukhedi Distt. Rajgarh; Sone at Koelwar; Betwa B/C Yamuna at Hamirrpur are also not meeting the desired criteria.
• The mainstream of River Brahmaputra is exceeding the criteria at Kherghat,
Nimatighat, Chandrapur (Guwahati), Sualkuchi, Dhenukhapahar and Jogigopa. The tributary streams Digboi, Bharalu, Deeparbil, Dhansiri, Burhiding, Mora Bharali, Kolong and Borak are also polluted and not conforming to the desired criteria.
• River Mahi is conforming to the desired water quality at all the monitoring
stations except at Vasad, Mujpur, Veerpur in Gujarat.
• River Sabarmati is grossly polluted at Kheroj Bridge, Dharoi dam, Village Miroli Taluka, V.N.Bridge, Hansol Bridge and in the reach of Ahmedabad to Vautha. Water quality of tributary streams Shedi and Khari are grossly polluted with respect to BOD, Total and Faecal Coliforms and very high dissolved solids content in terms of Conductivity.
III

• The mainstream of River Narmada and tributary stream Chota Tawa are confirming to water quality for all the criteria parameters.
• The water quality of mainstream of river Tapi is exceeding criteria limits at
Uphad village, Ajnad village, Bhusawal upstream, Ukai, Mandavi, Kathore, Surat and tributary stream Girna at Malegaon & Jalgaon and Rangavali at Navapur.
• The water quality of mainstream of Mahanadi does not meet the criteria with
respect to BOD at downstream of Rajim in Chattisgarh; and Cuttack and Sambhalpur in Orissa due to discharge of untreated sewage from cities. The Water Quality of tributary stream Seonath, Ib and Birupa are complying to the water quality criteria. Other streams such as Arpa at Bilaspur, Kuakhai downstream of Bhubaneshwar, Kathajodi downstream of Cuttack and Birupa at Choudwar are not meeting the criteria limit in respect of BOD.
• The water quality of mainstream of Brahmani with respect to BOD, Total and
Faecal Coliform is exceeding the criteria limit at downstream of Panposh due to wastewater discharges from the industrial and residential complexes of Rourkela, Talcher, Bhuban and Dharamashala. The water quality of tributary stream Koel is not meeting the criteria with respect to indicator of organic pollution. The water quality of major tributary streams Baitarni is complying with the criteria limit.
• In river Subarnarekha, BOD is exceeding the criteria limit at Ranchi Tatisilwai.
• The water quality of river Godavari at Nasik D/s, Panchavati at Ramkund and U/s
of Gangapur Dam at Nasik in Maharashtra does not meet the criteria due to proximity of large city. Manjira near Ganapati Sugars, Nira at Pulgaon cotton mill, Kolar before confluence to Kanhan at Kamptee & D/s of Nagpur, Wardha at Rajura Bridge, Purna at Dupeshwar, Wainganga at Ashti & A/c with Kanhan in Maharashtra and Maner at Warangal U/s in Andhra Pradesh are not meeting the criteria for BOD.
• River Krishna does not meet the water quality criteria at Sangli, Krishna Bridge-
Karad, Mahabaleshwar( Dhom dam near Koina dam), Rajapur weir, Kurndwad ( Kolhapur), Vedadri (Guntur), Hamsala Devi (Guntur) and U/s of Ugarkhurd barrage. River Bhima at Pune u/s, Vitthalwadi, d/s of Bundgarden( Pune), Pargaon after confluence with Mula Mutha, Narsinghpur D/S after confluence with river Nira and D/s of Road Bridge at Gangapur Village; Nira at Sarole bridge on Pune-Bangalore highway; Panchganga D/s of Kolhapur town and at Ichalkaranji; Tunghabhadra at Honnali Bridge, Haralehalli Bridge, Ullanur and Mantralayam; Tungha at D/s of Shimoga Town; Bhadra at D/s of KIOCL Road Bridge near Holehunnur & D/s of Bhadrawati; Chandrabhaga U/s & D/s of Padharpur Town and Musi D/s of Hyderabad are potentially polluted locations having higher BOD levels.
• River Pennar is meeting the desired water quality criteria at all locations.
IV

• The Water Quality of River Cauvery is not meeting the desired water quality
criteria at Erode near Chirapallayam, Pitchavaram, Trichy at Grand anaicut and Tiruchirapalli D/s whereas the tributary streams not meeting the criteria are Bhavani at Bhavani Sagar and Lakshamantirtha at D/s of Hunsoor Town.
• Kolak at Vapi; Ambika at Billimora; Amlakheri at Ankleshwar; Baleshwar Khadi;
River Purna; Dhadar at Kothada; Mindhola and Kaveri at Valsad road in Gujarat are exceeding the criteria limit for BOD. River Madai at Dabos- Valpoi in Goa is not meeting the criteria limit. River Patalganga at Shilphata and near intake of MIDC Water Works; Kundalika at Roha city; river Ulhas at U/s of Badlapur & upstream of NRC Bund at Mohane; Bhatsa at D/s of Pise Dam and Kalu at Atale village in Maharashtra are not meeting the criteria due to higher level of BOD in these rivers. The rivers in Kerala are meeting the criteria limit for BOD except Karmana at Moonnattumukku, Irupanamn, Amravila and Muvattapuzha. BOD observed more than criteria limit in river Arasalar in Pondicherry; Tambiraparani at Rail Bridge Ambasanudam, Arumuganeri, Muraepanadu and Tirunelveli and Palar at Vaniyambadi Water Supply Headworks. The river Ghagger is grossly polluted at majority of monitoring locations such as at D/s Patiala, Moonak, U/s & D/s Sardulgarh, Ratanheri D/s of Patiala Nadi, D/s of Chhatbir, Derabassi, Mubarakpur Rest House, U/s & D/s of Jharmal nadi, Chandrapur Syphon, U/s of Dhakansu nallah, GH-1 at road bridge in Sirsa and before Ottu weir due to the discharge of municipal and industrial wastewater. River Sukhna at Parwanoo and Markanda at D/s of Kala Amb are grossly polluted locations. N-choe, Patiala ki Rao and Sukhna choe are grossly polluted tributary streams of river Ghaggar carrying the waste water of Chandigarh. River Nambul at Hump Bridge and at Heirangoithong (Manipur), River Umtrew at Byrnihat East and River Kharkhala near Sutngan and Haora River at Chandrapur (Agartala) are observed as polluted due to high level of BOD.
• Three creeks in the vicinity of Mumbai are having high concentration of BOD and
conductivity due to discharge of waste water from metropolitan region and effect of sea water respectively.
• The Western Yamuna canal downstream of Yamuna Nagar at Damla is grossly
polluted due to municipal and industrial waste water disposal. Similarly Pragati Vidhya Bhawan Canal in Agartala is also not meeting the criteria limits.
• Lakes and Tanks having high concentration of organic matter and does not
comply to the standard limits for BOD are Hussain Sagar Lake, Dharamsagar Tank (Warangal), Bibinagar Tank, Saroornagar Lake, Pulicate Lake, Heballa Valley Lake, Kayamkulam Lake, Ulsoor Lake, Bahour Lake, Osteri Lake, Alappuzha Lake, Udhagamandalam Lake, Kodai Kanal Lake, Oruvathikotta Lake, Kochi Oil Tanker Jetty, Lower Lake (Bhopal), Udaisagar Lake, Fateh Sagar Lake, Nakki Lake, Kaylana Jheel, Kankoria Lake, Sursagar Lake, Bindu Sarovar (Siddhapur), Thol Tank, Kheta Talav (Nadiad), Narsimehta Talav (Junagarh),
V

• The groundwater monitoring locations observed with high conductivity which
exceeds water quality criteria for irrigation are observed at Rama Temple (Visakhapatnam); Panchayat Office (Bolaram); Open well near Pratap Nagar bridge (Kakinada); Peddanuyyi (Vizianagram); bore well near Swarnamukhi River (Srikalahasti- Chittoor); near Ckm College (Enumamula (V)- Warangal) and Nagiri (Chittoor-Andhra Pradesh). Conductivity observed high in well at Nehru Statue (Vadamattai) and well near Chunmbar River (Pondicherry) due to sea water intrusion; at Mira-Bhayander, Mehsana, Narole-Ahmedabad, Palghar, Surendranagar, Nadiad, Nandesari, Bhuj and Dahanu (Gujarat); Rasulwadi-Sambalwadi, Khanjirenagar, Ichalkaranji, Savali, Sangli, Parvati Industrial Estate- Sherole, Bhahmni Kalmeshwar (Nagpur) in Maharashra; Village Vinayakia (Jodhpur); Near Khanpura Talav,Opp. Private Bus Stand & Outside JLN Hospital in Ajmer; Nayagaon in Pali, village Bagar Rajput (Alwar); Pabupura road near Civil Airport (Jodhpur); near Kansua Nallah (Secondary School-Kota); Vidhani village, Goner road & Near Shri Kalyaneshwar Mahadev Temple Jaisingh Pura Khurd (Jaipur); Hotel Orient Place (Subhash Nagar-Udaipur); and village Harchandpur (Bhiwadi Industrial Area) in Rajasthan; and Sahibabad industrial area Ghaziabad & Roadways Bus Station Unnao (Uttar Pradesh).
Groundwater locations with BOD levels higher than the criteria are east of Saichevuru Padipally, Warangal Distt., Open Well Bhoomaiah near Ash Pond Of NTPC in Kundanpally and Ramagundam (Karimnagar) in Andhra Pradesh; Guwahati, Berpeta and Sibsagar in Assam; Shimla D/s of MSW Dumping Site in Himachal Pradesh; bore well near Chunmbar River and Nehru Statue in Pondicherry; Collector well at Thirupuvanam for Madurai water supply scheme in Tamilnadu; MSW site Pathardi Nasik, BMW site Burudgaon Ahmednagar, Bhahmni Kamleshwar & Koradi (Nagpur), Industrial Estate Tarapur & TPS Durgapur (Chandrapur), Mira Bhayander (Vasai), MSW site (Taloja-Raigad) in Maharashtra; Well near Pali town and well near Jodhpur Town in Rajasthan; and Sardar Nagar and Captain Ganj in Uttar Pradesh. The nitrate concentration observed high than the desired criteria at B/w near M/s Andhra Sugars Ltd. Kovvur (Warangal) and Peddanuyyi – Vizianagaram in Andhra Pradesh. Total Coliforms are not meeting the desired criteria in ground water at open well Near Pratap Nagar Bridge (Kakinada), B/w near M/s Andhra Sugars Ltd. Kovvur (Warangal) and Peddanuyyi – Vizianagaram in Andhra Pradesh; Silchar, Guwahati and Bonaigaon in Assam. pH is observed below 6.5 at Ckm College in Andhra Pradesh; Silchar and Guwahati in Assam; Ramhlum ( Northern Part) in Mizoram; Kunjban & A.D.Nagar, Agartala in Tripura; Industrial Area Govindpura, Bhopal in Madhya Pradesh; Dasmesh Nagar, Ludhiana in Punjab; Eloor, Chungapally, Pappanamkode & Nedumangad in
VI

VII
Thiruvananthpuram, Kundra in Kollam, Cherthala in alleppy, Edayar & Kalamassery in Ernakulam, Punkunnam Trissur Distt., Payyannur in Kunnur and Mavoor, Kozhikkode in Kerala; Well at Kalapet in Pondicherry Univ. Admn. Block & Mettopalayam in Pondicherry; Parvati Industrial Estate, Shirol, Khanjirenagar, Ichalkaranji and MIDC, Shinoli in Maharashtra and M/s Kanoria Chemical, Sonbhadra in Uttar Pradesh.

CHAPTER - I
Introduction and Methodology of National Water Quality Monitoring Programme
1.1 Introduction
In order to perform the functions specified under the Water (Prevention and Control of Pollution) Act, 1974, Central Pollution Control Board (CPCB) and State Pollution Control Boards/Pollution Control Committees (SPCBs/PCCs) need adequate knowledge on nature and extent of pollution control required in different parts of the country. Also they have to evaluate performance of the pollution control efforts. To achieve this, a continuous water quality monitoring is required. Realising this CPCB in collaboration with concerned SPCBs/PCCs established a wide network of water quality monitoring.
1.2 Water Resources of India
India receives 4000 Km3 of water through rainfall. Of this 3/4 part occurs only during monsoon. The surface flow is estimated as 1880 Km3. The annual replenishable ground water resources are assessed to be about 600 Km3 of which the annual usable resources are estimated at 420 Km3. Inland water resources of the country are classified as rivers and canals; reservoirs; tanks and ponds; beels, oxbow
7
lakes, derelict water; and brackish water. Other than rivers and canals, total water bodies cover an area of about 7 million hectare. Statewise details of inland water resources are given in table 1; there are few desert rivers, which flow for some distance and get lost in deserts. There are complete arid areas where evaporation equals rainfall and hence no surface-flow. The medium and minor river basins are coastal rivers. The Brahmaputra, Ganga, Indus and Godavari putting together cover more than half of the area of the country. The whole of the west coast stretching 1500 km between Surat in Gujarat and Cape Comorin in Tamilnadu are fed by fourteen medium and eighteen minor river basins leaving important cities like Bombay, Panaji, Cochin, Trivandrum out of major river basins. On the east coast of Peninsular India there are three pockets, which are out of any major river basins. These three pockets are: the area south of River Cauvery starting from Madurai to Cape Comorin; the area between Pennar and Cauvery basin wherein Chennai and Pondicherry are located; and the area between Mahanadi and Godavari basins in Orissa coast. There is a tremendous variation both in the quantity of discharge from a major basin to minor one and also in the quality of discharge from region to region.
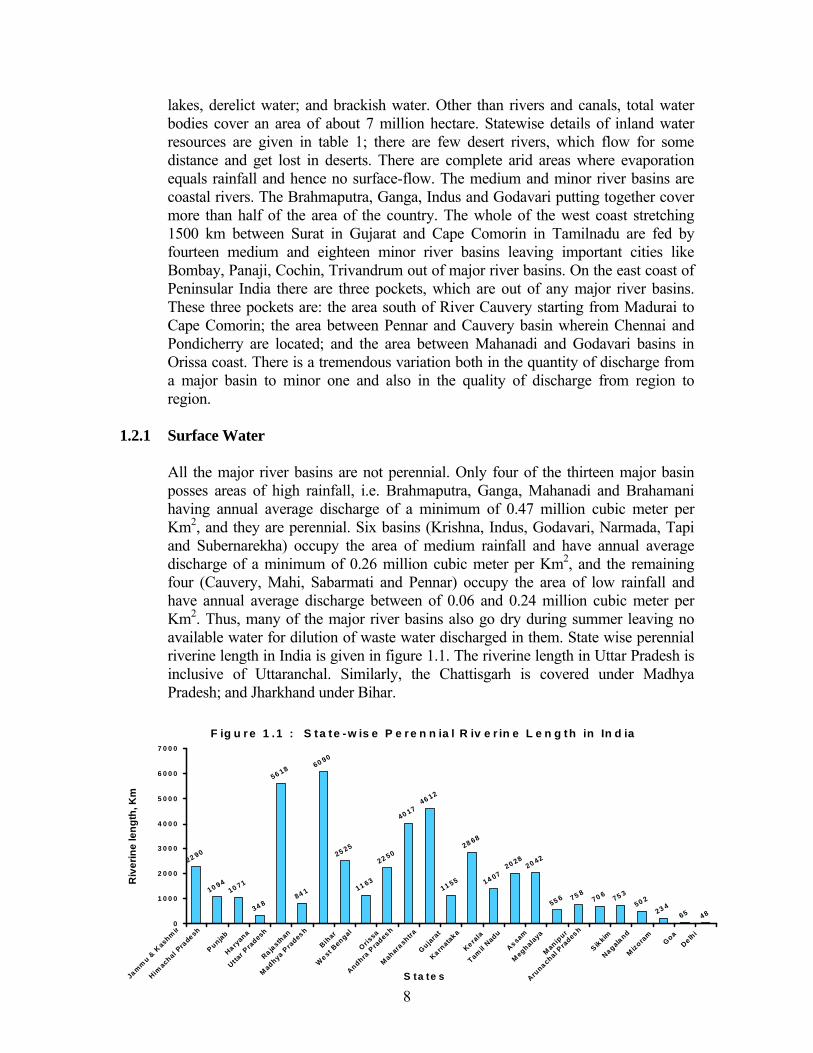
1.2.1 Surface Water All the major river basins are not perennial. Only four of the thirteen major basin posses areas of high rainfall, i.e. Brahmaputra, Ganga, Mahanadi and Brahamani having annual average discharge of a minimum of 0.47 million cubic meter per Km2, and they are perennial. Six basins (Krishna, Indus, Godavari, Narmada, Tapi and Subernarekha) occupy the area of medium rainfall and have annual average discharge of a minimum of 0.26 million cubic meter per Km2, and the remaining four (Cauvery, Mahi, Sabarmati and Pennar) occupy the area of low rainfall and have annual average discharge between of 0.06 and 0.24 million cubic meter per Km2. Thus, many of the major river basins also go dry during summer leaving no available water for dilution of waste water discharged in them. State wise perennial riverine length in India is given in figure 1.1. The riverine length in Uttar Pradesh is inclusive of Uttaranchal. Similarly, the Chattisgarh is covered under Madhya Pradesh; and Jharkhand under Bihar.
F ig u r e 1 .1 : S ta te -w is e P e re n n ia l R iv e r in e L e n g th in In d ia
22 90
10 9410 71
34 8
56 18
84 1
60 90
25 25
11 63
22 50
40 1746 12
11 55
28 68
14 0720 28
20 42
55 6 75 870 6 75 3
50 223 4
65 480
1 0 0 0
2 0 0 0
3 0 0 0
4 0 0 0
5 0 0 0
6 0 0 0
7 0 0 0
& K
ashmi
8
Jammu
r
Himachal P
radesh
Punjab
Ha ryana
tar Pra
desh
Ra jasthan
ya Pra
des
UtMadh
h
Bihar
st Bengal
Orissa
ra P
rades
We
Andh
h
M Ta
Arunacahara
shtra
Gujarat
Karnataka
Kerala
mil N
adu
Assam
Meghalaya
Manipur
hal Pra
desh
Sik kim
Nagaland
Mizoram
GoaDe lhi
Riv
erin
e le
ngth
, Km
S ta te s

1.2.2 Ground Water Total replenishable ground water potential of the country, has been estimated by Ministry of Water Resources as 431 Km3 cubic kilometre per year. After making provision for drinking, industrial and other purposes (other than irrigation), which is about 16 percent of total potential, the potential available for irrigation is 360 Km3 per year. The figure for net draft of ground water considering the present utilisation indicates that substantial portion of total potential (about 68 percent) is still remaining untapped.
Table-1.1 State wise Details of Inland Water Resources (Lakh Hectares)
S. No.
Name of the State/UT
Rivers/ Canals
(Length, Kms)
Reservoir Tanks, Lakes &
Ponds
Beels, Oxbow Lakes & Derelict Water
Brackish Water
Total Water Bodies
1. Andhra Pradesh 11514 2.34 5,17 - 0.64 8.15 2 Arunachal Pradesh 2000 - 0.01 0.03 - 0.04 3. Assam 4820 0.02 0.23 1.10 - 1.35 4. Bihar 3200 0.60 0.95 0.05 - 1.60 5. Goa 250 0.03 0.03 - - 0.06 6. Gujarat 3865 2.43 0.71 0.12 3.76 7.02 7. Haryana 5000 NEG 0.10 0.10 - 0.20 8. Himachal Pradesh 27781 0.07 0.17 0.06 - 0.30 9. Jammu and Kashmir 3000 0.42 0.01 - - 0.43 10. Karnataka 9000 2.20 4.14 - 0.08 6.42 11. Kerala 3092 0.30 0.30 - 2.43 3.03 12. Madhya Pradesh 20661 2.94 1.19 - - 4.13 13. Maharashtra 16000 2.79 0.50 - 0.10 3.39 14. Manipur 3360 0.01 0.05 0.40 - 0.46 15. Meghalaya 5600 0.08 0.02 NEG - 0.10 16. Mizoram 1395 - 0.02 - - 0.02 17. Nagaland 1600 0.17 0.50 NEG - 0.67 18. Orissa 4500 2.56 1.14 1.80 4.17 9.67 19. Punjab 15270 NEG 0.07 - - 0.07 20. Rajasthan N.A. 1.20 1.80 - - 3.00 21. Sikkim 900 - - -0.03 - 0.03 22. Tamil Nadu 7420 0.52 6.91 N.A. C.56 7.99 23. Tripura 1200 0.05 0.12 - - 0.17 24. Uttar Pradesh 31200 1.50 1.62 1.33 - 4.45 25. West Bengal (P) 2526 0.17 2.76 0.42 2.10 5.45 UNION TERRITORIES 26 Andaman & Nicobar
Islands 115 0.01 0.03 - 0.37 0.41
27 Chandigarh 2 - NEG NEG - - 28. Dadra & Nagar
Naveli 54 0.05 - - - 0.05
29. Daman & Diu 12 - - - - - 30. Delhi 150 0.04 - - - 0.04 31 Lakshadweep - - - - - - 32. Pondicherry 247 - NEG 0.01 0.01 0.02 Total 185734 20.50 28.55 5.45 14.22 68.72
9
Source: Fisheries Division, Dept. of Agriculture & Co-operation, Ministry of Agriculture N.A. : Not Available (P) : Provisional NEG : Negligible : Included in brackish water area 1.3 Water Quality Monitoring Programme 1.3.1 Objectives
Water quality monitoring is an important exercise, which helps in evaluating the nature and extent of pollution control required, and effectiveness of pollution control measures already in existence. It also helps in drawing the water quality trends and prioritising pollution control efforts. The pollution control boards in India are responsible for restore and maintain the wholesomeness of aquatic resources. To ensure that the water quality is being maintained or restored at desired level it is important that the pollution control boards regularly monitor the water quality. The water quality monitoring is performed with following main objectives in mind. • For rational planning of pollution control strategies and their prioritisation; • To assess nature and extent of pollution control needed in different water
bodies or their part; • To evaluate effectiveness of pollution control measures already is
existence; • To evaluate water quality trend over a period of time; • To assess assimilative capacity of a water body thereby reducing cost on
pollution control; • To understand the environmental fate of different pollutants. • To assess the fitness of water for different uses.
1.3.2 Monitoring Network
The above programme helps in evaluating the nature and extent of pollution control required, and effectiveness of pollution control measures already in existence. It also helps in drawing the water quality trends and prioritising pollution control efforts. Keeping this in mind the Central Pollution Control Board (CPCB) has established a network of monitoring stations on rivers across the country. The present network comprises of 1245 stations in 27 States and 6 Union Territories spread over the country. The monitoring is done on monthly or quarterly basis in surface waters and on half yearly basis in case of ground water. The monitoring network covers 250 Rivers, 78 Lakes, 6 Tanks, 26 Ponds, 8 Creeks, 19 Canals, 19 Drains and 382 Wells. Among the 1245 stations, 695 are on rivers, 86 on lakes, 19 on drains, 19 on canals, 6 on tank, 12 on creeks/seawater, 26 on pond and 382 are groundwater stations (Figure 1). Presently the inland water quality-monitoring network is operated under a three-tier programme i.e. GEMS, Monitoring of Indian National Aquatic Resources System and Yamuna Action Plan. Water samples are being analyzed for
10

28 parameters consisting of physico-chemical and bacteriological parameters for ambient water samples apart from the field observations. Besides this, 9 trace metals and 28 pesticides are analyzed in selected samples. Biomonitoring is also carried out on specific locations. In view of limited resources, limited numbers of organic pollution related parameters are chosen for frequent monitoring i.e. monthly or quarterly and major cations, anions, other inorganic ions and micro pollutants (Toxic Metals & POP’s) are analyzed once in a year to keep a track of water quality over large period of time. The water quality data are reported in Water Quality Status Year Book.
Water Body No.of StationPond 26Creek 12Tank 6Canal 19Drain 19Lake 86Well 382River 695
Fig 1.2 : NATIONAL WATER QUALITY MONITORING NETWORK
26 12 6 19 19 86
382
695
1245
0200400600800
100012001400
Pond Creek Tank Canal Drain Lake Well River Total
WATER BODIES
NO
. OF
STA
TIO
NS
Table-1.2 State wise and water body wise Distribution of Water Quality
Monitoring Stations
State River Lake Tank Pond CanalCreek/
Sea water
Drain Well Total
ANDHRA PRADESH 27 4 4 - - - - 24 59 ASSAM 43 2 1 23 - - - 32 101 BIHAR 16 - - - - - - 20 36 CHANDIGARH - 1 - - - - 3 7 11 CHHATISSGARH 23 - - - - - - 4 27 DADRA AND NAGAR HAVELI 2 - - - - - - - 2
DAMAN & Diu(ZOV) 2 - - - - - - 1 3 DELHI 4 - - - 2 - 9 - 15 GOA 17 2 - - 3 1 - 6 29 GUJARAT 49 14 1 2 2 2 1 42 113 HARYANA 8 2 - - 11 - 2 - 23 HIMACHAL PRADESH 31 3 - - - - - 20 54 JAMMU & KASHMIR 7 2 - - - - - - 9
11

State River Lake Tank Pond CanalCreek/
Sea wa ert
Drain Well Total
JHARKHAND 9 - - - - - - - 9 KARNATAKA 43 2 - - - - - - 45 KERALA 30 10 - - - - - 15 55 LAKSHDWEEP - - - 1 - - - 15 16 MADHYA PRADESH 69 18 - - - - - 18 105 MAHARASHTRA 83 - - - - 9 1 30 123 MANIPUR 11 4 - - - - - 5 20 MEGHALAYA 5 3 - - - - - 5 13 MIZORAM 4 - - - - - - 2 6 NAGALAND 8 - - - - - - - 8 ORISSA 39 - - - - - - 15 54 PONDICHERRY 1 2 - - - - 13 16 PUNJAB 35 2 - - - - - 6 43 RAJASTHAN 7 7 - - - - - 37 51 SIKKIM 14 - - - - - - - 14 TAMIL NADU 27 3 - - - - - 2 32 TRIPURA 3 2 - - 1 - - 7 13 UTTAR PRADESH 44 1 - - - - 3 25 73 UTTRANCHAL 14 1 - - - - - 1 16 WEST BENGAL 20 1 - - - - - 30 51 Total 695 86 6 26 19 12 19 382 1245
1.3.3 Parameters observed
The water samples are analysed for 9 core parameters and 19 general parameters. The monitoring agencies have also analysed the trace metals at few locations. The list of parameters identified under the National Water Quality Monitoring Programme is given in Table 1.3. In the present report data on core parameters is incorporated for interpretation and drawing of conclusion based on primary water quality criteria.
12

Table-1.3 List of Parameters under National Water Quality Monitoring Programme
Core Parameters (9)
Field Observations (7)
PH Weather Temperature Depth of main stream/depth of water table Conductivity, μmhos/cm Colour and intensity Dissolved Oxygen, mg/L Odour BOD, mg/L Visible effluent discharge Nitrate – N , mg/L Human activities around station Nitrite – N, mg/L Station detail Fecal Coliform, MPN/100 ml Trace Metals (9) Total Coliform, MPN/100 ml Arsenic, μg/L General Parameters (19) Cadmium, μg/L Turbidity, NTU Copper, μg/L Phenolphthalein Alkalinity, as CaCO3 Lead, μg/L Total Alkalinity, as CaCO3 Chromium (Total) , μg/L Chlorides, mg/L Nickel, μg/L COD, mg/L Zinc, μg/L Total Kjeldahl - N, as N mg/L Mercury, μg/L Ammonia - N, as N mg/L Iron (Total) , μg/L Hardness, as CaCO3 Pesticides (15) Calcium, as CaCO3 Alpha BHC, μg/L Sulphate, mg/L Beta BHC, μg/L Sodium, mg/L Gama BHC (Lindane) , μg/L Total Dissolved Solids, mg/L O P DDT, μg/L Total Fixed Dissolved Solids, mg/L P P DDT, μg/L Total suspended Solid, mg/L Alpha Endosulphan, μg/L Phosphate, mg/L Beta Endosulphan, μg/L Boron, mg/L Aldrin, μg/L Magnesium, as CaCO3 Dieldrin, μg/L Potassium, mg/L Carboryl(Carbamate) , μg/L Fluoride, mg/L 2-4 D, μg/L Bio-Monitoring (3) Malathian, μg/L Saprobity Index Methyl Parathian, μg/L Diversity Index Anilophos, μg/L P/R Ratio Chloropyriphos, μg/L 1.3.4 Frequency of monitoring
Frequency of monitoring station on surface water bodies such as rivers, lakes, ponds, canals and creeks is either monthly or quarterly whereas the groundwater monitoring
13

stations are monitored on half yearly basis. Three river stations in upper Ganga and Yamuna River are monitored on yearly basis. The frequency of monitoring stations in each State is given in Table 1.4.
Table-1.4 Frequency of Water Quality Monitoring Stations
State Monthly Half yearly Quarterly Yearly Total Andhra Pradesh 14 24 21 - 59 Assam 6 32 63 - 101 Bihar 8 20 8 - 36 Chandigarh - 7 4 - 11 Chhattisgarh 7 4 16 - 27 Dadra and Nagar Haveli 1 - 1 - 2 Daman & Diu 2 1 - 3 Delhi 14 - 1 - 15 Goa 11 6 12 - 29 Gujarat 36 42 35 - 113 Haryana 5 - 18 - 23 Himachal Pradesh - 20 33 1 54 Jammu & Kashmir - - 9 - 9 Jharkhand 1 - 8 - 9 Karnataka 23 - 22 - 45 Kerala 10 15 30 - 55 Lakshadweep - 15 1 - 16 Madhya Pradesh 50 18 37 - 105 Maharashtra 72 30 21 - 123 Manipur - 5 15 - 20 Meghalaya - 5 8 - 13 Mizorzm 2 4 - 6 Nagaland - - 8 - 8 Orissa 14 15 25 - 54 Pondicherry - 13 3 - 16 Punjab - 6 37 - 43 Rajasthan 4 37 10 - 51 Sikkim - - 14 - 14 Tamil Nadu 20 2 10 - 32 Tripura - 7 6 - 13 Uttar Pradesh 41 25 7 - 73 Uttaranchal 3 1 9 3 16 West Bengal 9 30 12 - 51 Total : - 351 382 508 4 1245
1.3.5 River basin wise distribution of Water Quality Monitoring Stations
The number of water quality monitoring stations on each river, its tributary, sub tributary, lake, ponds, tanks, canals, creeks and on groundwater are summarized in Table 1.5.
14

Table-1.5 River Basin wise distribution of Water Quality Monitoring Stations- 2007 River (main stream), Tributaries and Sub-Tributaries, Lake, Ponds, Tanks, Canals, Creeks and Groundwater Stations
Total Stations
Baitarni (5) 5
Brahmani (11) Tributaries-Karo (1), Koel (2), Sankh (1)
15
Brahmaputra (10) Tributaries-Burhidihing (3), Dhansiri (7), Disang (2), Jhanji (1), Subansiri (1), Bhogdoi (1), Bharalu (1), Borak (2), Deepar Bill (1), Digboi (1), Mora Bharali (1), Teesta (5), Dickhu (1), Maney (2), Ranichu (2), Rangit (5), Jai Bharali (1), Kathakal (1), Kharsang (1), Kolong (2), Manas(1), Pagldia (1), Chathe (1), Dzu (1), Kapili(1), Beki(1), Kundli(1), Kushiara(1), Panchnai(1), Sankosh(1), Sonai(1), Kohara(1), Ranga(1), Boginadi(1), Dikhow(1)
66
Cauvery (20) Tributaries-Arkavati (1), Amravati (1), Bhawani (5), Kabini (4), Laxmantirtha (1), Shimsa (2), Hemavati (1), Yagachi (1)
36
Ganga (34) Tributaries-Alakananda-Upper Ganga (4), Mandakini-Upper Ganga (1), Barakar (1), Betwa (10), Chambal (8), Damodar (5), Gandak (1), Saryu-Ghaghra (3), Gomti (5), Hindon (3), Kali (West) (2), Kali Nadi(East) (2), Khan (3), Kshipra (3), Mahananda (1), Mandakini (Madhya Pradesh) (1), Parvati (2), Ramganga (1), Rapti (1), Rihand (2), Rupanarayan (1), Sai (1), Sone (5), Tons (Madhya Pradesh) (2), Yamuna (23), Sindh (1), Johila (1), Sankh(1), Gohad (1), Kolar (1), Churni (2), Tons (Himachal Pradesh) (1), Sikrana (1), Daha (1), Sirsa (1), Dhous (1), Farmer (1), Kalia sot(1), Bihar(1), Bichia(1),
141
Godavari (22) Tributaries- Manjara (Manjira) (3), Maner (2), Nira (1), Wainganga (8), Wardha (3), Kolar (1), Kanhan (3), Purna (2), Indravati (2), Sankhani (1),
48
Indus Tributaries-Beas (19), Chenab (1), Jhelum (3), Largi (1), Parvati (3), Ravi (3), Sutlej (21), Tawi (1), Gawkadal (1), Chuntkol (1), Sirsa (3), swan (1)
58
Krishna (22) Tributaries- Bhadra (3), Bhima (10), Ghataprabha (2), Malprabha (3), Muneru (1), Musi (2), Nira (2), Paleru (1), Tunga (1), Tungabhadra (6), Panchganga (4), Chandrabhaga (2), Kagina(1), Koyna(1), Mula(2), Mutha(1), Mula-Mutha(1), Venna(1), Pawana(1), Indrayani(1),
68
Mahi (9) Tributaries-Anas (1), Panam (1) , Jammer(1), Malei(1), Shivna(1), Chillar(1)
15
Mahanadi (18) Tributaries-Ib (4), Hasdeo (2), Kathajodi (1), Kharoon (4), Kuakhai (2), Sheonath (3), Birupa (1), Arpa (1), Kelo (2)
38
Narmada (21) Tributaries-Chhota Tawa (1), Gour(1), Katni(1), Kunda(1)
25
Pennar (5) 5
Sabarmati (9) Tributaries-Meswa (1), Shedhi (1), Khari (1)
12
Subarnerekha (6) 6
Tapi (14) Tributaries-Girna (2), Rangavali (1), Denwa(1), Kim(1),
19
15

River (main stream), Tributaries and Sub-Tributaries, Lake, Ponds, Tanks, Canals, Creeks and Groundwater Stations
Total Stations
Medium rivers Ambika (1), Ulhas (3), Ulhas-Bhatsa (1), Ulhas-Kalu (1), Imphal (4), Mandovi (2), Palar (1), Pamba (3), Pariyar (3), Rushikulya (2), Tambiraparani (7), Achankoil (2), Chalakudy (1), Damanganga (6), Ghaggar (19), Kallada (1), Kali-Karnataka (1), Manimala (2), Mindhola (1), Nagavalli (3), Amlakhadi (2), Chaliyar (2), Iril (2), Kharkhala (1), Karmana (1), Kolak (2), Kundalika (2), Meenachil (1), Muvattupuza (1), Patalganga (2), Umtrew (1), Vamanpuram(1), Zuari(2), Gumti(2), Kalna (1),Valvant (1), Madai (1), Khandepar (2), Asanora (1), Bhadar (1), Neyyar (1), Ithikkara (1), Kadalundy (1), Kuttiyady (1), Mahe (1), Kuppum (1), Neelsvaram (1), Karingoda (1), Chandergiri (1), Chitrapuzha (1), Nambul (2), Ganol (1), Simsang (1), Myntdu (1), Arasalar (1), Kodra (1), Haora (1), Khuga (1), Khujairok (1), Sekmai (1), Markanda (1), Sukna (1), Baleshwar Khadi (1), Netravati (1), Kumardhara (1), Purna (1), Kaveri (1), Dhadar (1), Tlawng (2), Tuirial (2), Talpona (1), Bhogavo(1), Triveni sangam(1), Mapusa(1), Bicholim(1), Chapora(1), Kushawati(1), Sal(2), Meethi(1), Savitri(1), Vashisti(1),
138
Lakes (86) Hussainsagar (1), Saroornagar (1), Himayatsagar (1), Pulicate (1), Salaulim (1), Kankoria (1), Chandola (1), Ajwah (1), Sursagar (1), Brahamsarovar (1), Sukhna (2), Govindsagar (1), Pongdam (1), Renuka (1), Wuller (1), Dal (1), Ulsoor (1), HebbalaValley (1), Oruvathikotta (1), Sasthamcotta (1), Ashthamudi (1), Paravur (1), Vembanad (1), Periyar (1), Kodumgallor (1), Kayamkula (1), Punnamadakayal (1), Pookotekayal (1), UpperLake (4), LowerLake (1), MultaiLake (1), Loktak (4), Umiam (1), Ward (1), Thadlaskena (1), Osteri (1), Bahour (1), Harike (2), Pichola (1), Udaisagar (1), Ramgarh Jaipur (1), Pushkar (1), Fatehsagar (1), Kalyana (1), Nakki (1), Udhagamadalam (1), Kodaikanal (1), Yercaud (1), Lakshminarayan Baridigh (1), Rudrasagar (1), Ramgarh-UttarPradesh (1), Naini (1), Rabindrasarovar (1), Nalsarovar (1), Bindusaraovar (1), Sahastrling Sarovar (1), Lakhota Talav (1), Narsimehta Talav (1), Nadiad city Lake (1), Ranjitnagar Talav (1), Ankleshwar reservoir(1), Kuwadava(1),Moticher lake(1), Mayem lake(1), Janunia talav(1), Yashwant sagar(1), Sirpur talav(1), Kali sindh reservoir(1), Periat tank(1), Shahpura (1), Madhav lake(1), Nagchun(1), Karwa dam(1), Khandari reservoir(1), Daloni Beel(1), Mer Beel(1), Govindgarh tank(1), Bilawali talav(1) Tanks (6) Dharamsagar (1), Bibinagar (1), Kistrapetrareddy (1), Goysagar (1), Thol (1), Gandigudem(1) Ponds (26) Elangabeel System (1), Lakshadweep (1), Olpad village pond (1),Bishnu Pushkar pukhuri(1), Bor Beel(1), Bor pukhuri(1), Botodriva pond(1), Chand dubi Beel(1), Deepar Beel(1), Dighali pukhuri(1), Dhudia talav(1), Baskandi pond(1), Galabeel(1), Ganga pukhuri(1), Gaurisagar(1), Gopur tank(1), Padum pukhuri(1), Hordai pukhuri(1), Jaipal pukhuri(1), Mahamaya mandir pukhuri(1), Rajadinia pukhuri(1), Raja pukhuri(1), Rajmaw pukhuri(1), Saranbeel(1), Sivasagar tank(1), Subhagya kund(1),
118
Creeks, Canals and Drains Creeks (8),Sea Water(4), Agra Canal (1), Gurgaon Canal (1), Western Yamuna Canal (11), Agartala Canal (1), Cuncolim canal(2),Panoli canal(1), Narmada canal(1), Cumbarjua canal(1), Drains (19)
50
Groundwater 382
Total 1245
G-GEMS - Global Environmental Monitoring System M-MINARS - Monitoring of Indian National Aquatic Resources YAP- - Yamuna Action Plan
1.4 Approach to Water Quality Management
The water quality management in India is performed under the provision of Water (Prevention and Control of Pollution) Act, 1974. The basic objective of this Act is to maintain and restore the wholesomeness of national aquatic resources by prevention and control of pollution. The Act does not define the level of wholesomeness to be maintained or restored in different water bodies of the country. The Central Pollution Control Board (CPCB) has tried to define the wholesomeness in terms of protection of human uses, and thus, taken human uses of water as base f or identification of water quality objectives for different water bodies in the country. It was considered ambitious to maintain or restore all natural water body at pristine
16

level. Planning pollution control activities to attain such a goal is bound to be deterrent to developmental activities and cost prohibitive. Since the natural water bodies have got to be used for various competing as well as conflicting demands, the objective is aimed at restoring and/or maintaining natural water bodies or their parts to such a quality as needed for their best uses. Thus, a concept of “designated best use” (DBU) was developed. According to this concept, out of several uses a water body is put to, the use which demands highest quality of water is termed as “designated best use”, and accordingly the water body is designated. Primary water quality criteria for different uses have been identified. A summary of the use based classification system is presented in table 1.6.
Table-1.6 Use based classification of surface waters in India
Designated-Best-Use Class of water Criteria Drinking Water Source without conventional treatment but after disinfection
A 1. Total Coliforms OrganismMPN/100ml shall be 50 or less
2. pH between 6.5 and 8.5 3. Dissolved Oxygen 6mg/l or more 4. Biochemical Oxygen Demand 5 days 20oC
2mg/l or less Outdoor bathing (Organised)
B 1. Total Coliforms Organism MPN/100ml shall be 500 or less
2. pH between 6.5 and 8.5 3. Dissolved Oxygen 5mg/l or more 4. Biochemical Oxygen Demand 5 days 20oC
3mg/l or less Drinking water source after conventional treatment and disinfection
C 1. Total Coliforms Organism MPN/100ml shall be 5000 or less
2. pH between 6 to 9 3. Dissolved Oxygen 4mg/l or more 4. Biochemical Oxygen Demand 5 days 20oC
3mg/l or less Propagation of Wild life and Fisheries
D 1. pH between 6.5 to 8.5 2. Dissolved Oxygen 4mg/l or more 3. Free Ammonia (as N) 1.2 mg/l or less
Irrigation, Industrial Cooling, Controlled Waste disposal
E 1. pH between 6.0 to 8.5 2. Electrical Conductivity at 25oC micro mhos/cm
Max.2250 3. Sodium absorption Ratio Max. 26 4. Boron Max. 2mg/l
The entire water resources of the country were classified according to their designated best uses and a “Water Use Map” was prepared. For identification of the water bodies or their parts where water quality is at variance with water quality criteria, it was felt important to measure water quality of that water body or its part. It would help in preparation of “Water Quality Map” of India. The idea was to superimpose “Water Quality Map” on “Water Use Map” to identify the water bodies or their parts, which are in need of improvement (restoration). Subsequently through a wide network of water quality monitoring, water quality data are acquired. A large number of water bodies were identified as polluted stretches for taking appropriate
17

measures to restore their water quality. Today almost all policies and programmes on water quality management are based on this concept including the Ganga Action Plan and National River Action Plans.
18

CHAPTER II
Water Quality Trend in India 2.1 Water Quality Trend 2007
The water quality monitoring results obtained during 2007 indicate that the organic and bacterial contamination are continued to be critical in water bodies. This is mainly due to discharge of domestic wastewater mostly in untreated form from the urban centres of the country. The municipal corporations at large are not able to treat the increasing load of municipal sewage flowing into water bodies without treatment. Secondly the receiving water bodies also do not have adequate water for dilution. Therefore, the oxygen demand and bacterial pollution is increasing day by day. This is mainly responsible for water borne diseases.
The monitoring results obtained during 2007 indicate that organic pollution continues to be the predominant pollution of aquatic resources. The organic pollution measured in terms of bio-chemical oxygen demand (BOD) & coliform bacterial count gives the indication of extent of water quality degradation in different parts of our country. It is observed that nearly 69% of the observations are having BOD less than 3 mg/l, 18% between 3-6 mg/l & 13% above 6 mg/l. Similarly Total & Faecal coliform which indicate presence of pathogens in water are also a major concern. About 50% observations are having Total Coliforms and 66% observations are having Faecal Coliform less than MPN 500/100 ml.
2.2 Biochemical Oxygen Demand (BOD)
The numbers of observed BOD values less than 3 mg/l were between 57-69% during year 1995 to 2007. The maximum value of 69% was observed during 2007. This shows that there is improvement in the water quality. The number of observed BOD values ranges from 3-6 mg/l was between 17-28% during year 1995 to 2007, the maximum value of 28% was observed in the year 1998. During 2007 the percent observations were 18. It was observed that there was a gradual decrease in number of observations having BOD between 3-6 mg/l which indicates there is gradual improvement in water quality. The numbers of observed BOD value> 6 mg/l were between 13 and 19% during year 1995-2007 and the maximum value of 19% was observed in the year 2001 and 2002. It was observed that there was a gradual decrease to 14% in 2005 and increase to 18% in 2006 and subsequent decrease to 13% in 2007 in number of observations having BOD >6. . This shows that there is improvement in the water quality.
19

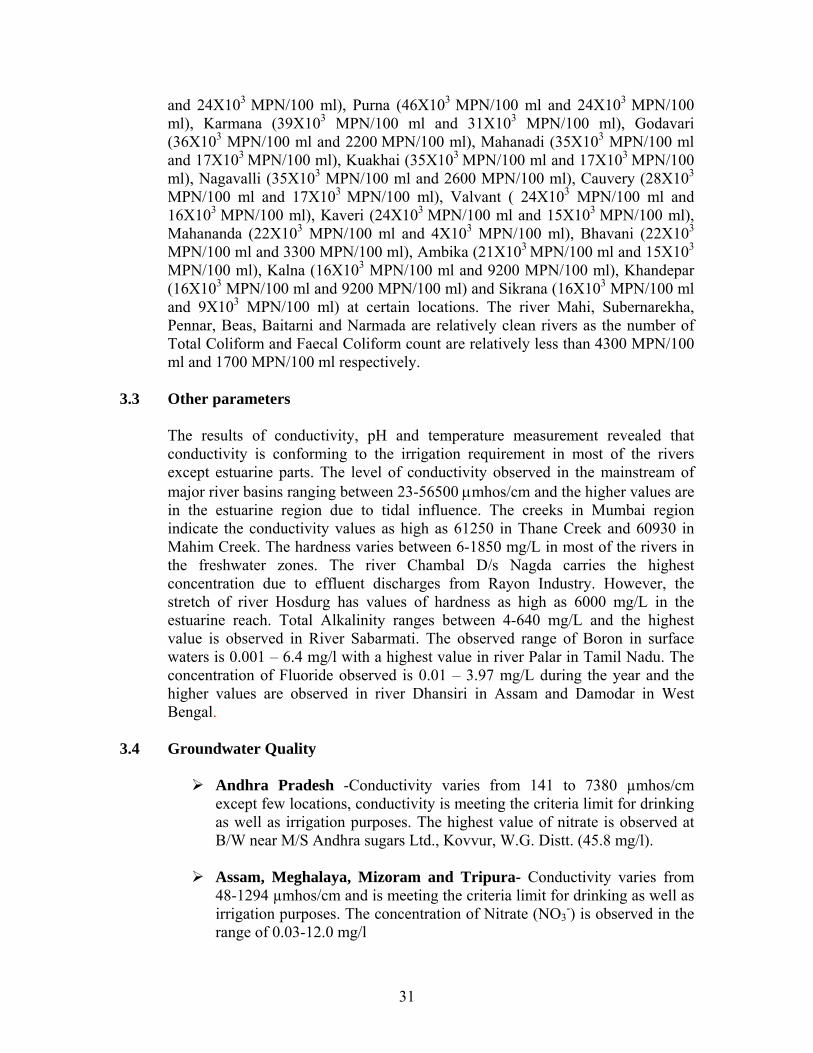
2.3 Total Coliform (TC)
The numbers of observed TC values < 500 MPN/100 ml were between 44-63% during 1995-2007, the value gradually increases to 63% in year 1999 which decreases to 45% in 2006 but subsequently increased to 50% during 2007. The numbers of observed TC values ranges from 500-5000 were between 28-37% during year 1995-2007 the maximum value of 37% was observed in 1997 and this was gradually decreases to 33% in 2000 which further decreases to 31% in year 2006. During 2007 it was observed as 33%. It was also observed that there was a gradual decrease in number of observations having TC < 500 MPN/100 ml. The numbers of observed TC values > 5000 were between 9-24% during year 1995-2007. The maximum value of 24% was observed in the year 2006. Minimum value of 9% was observed during the year 1999. During 2007 it was observed as 17% indicating decreasing trend.
2.4 Faecal Coliform (FC)
The numbers of observed FC values <500 MPN/100 ml was between 48-67% during year 1995-2007. The maximum value of 67% was observed in the year 1998 that gradually decreases to 48% in 1999, which again steadily rose to 53% in 2006 and 66% in 2007. The numbers of observed FC values ranges from 500-5000 MPN/100 ml was between 22-35% during year 1995 to 2007. The maximum value of 35% was observed in the year 1999, which gradually decreases to 26% in the year 2006 and further decreased to 23% in 2007. The numbers of observed FC values > 5000 MPN/100 ml was between 7-21% during year 1995-2007. The maximum value of 20% was observed in 2000 which gradually decreases to 12% in the year 2005 that increases to 21% in 2006 and then decrease to 11% in 2007 indicating improvement in quality.
2.5 Water Quality Trend (1995 -2007)
The water quality monitoring results obtained during 1995 to 2007 indicate that the organic and bacterial contamination are continued to be critical in water bodies. This is mainly due to discharge of domestic wastewater mostly in untreated form from the urban centres of the country. The municipal corporations at large are not able to treat increasing load of municipal sewage flowing into water bodies without treatment. Secondly the receiving water bodies also do not have adequate water for dilution. Therefore, the oxygen demand and bacterial pollution is increasing day by day. This is mainly responsible for water borne diseases.
20
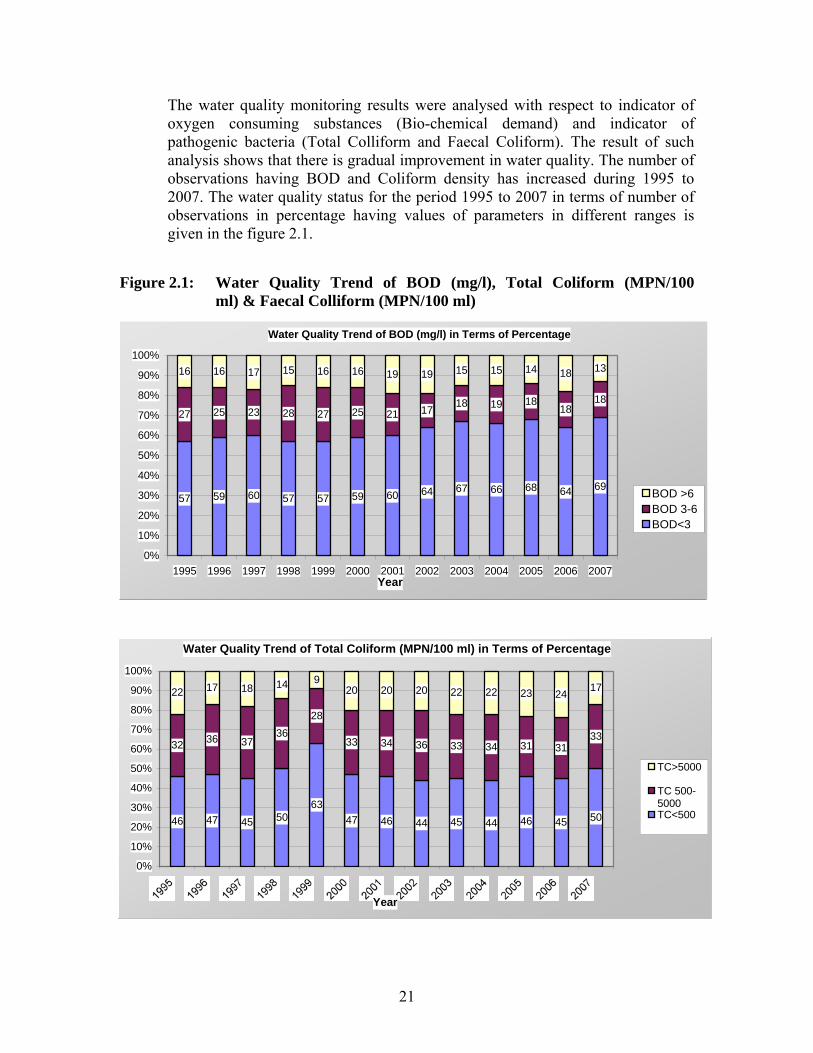
The water quality monitoring results were analysed with respect to indicator of oxygen consuming substances (Bio-chemical demand) and indicator of pathogenic bacteria (Total Colliform and Faecal Coliform). The result of such analysis shows that there is gradual improvement in water quality. The number of observations having BOD and Coliform density has increased during 1995 to 2007. The water quality status for the period 1995 to 2007 in terms of number of observations in percentage having values of parameters in different ranges is given in the figure 2.1.
Figure 2.1: Water Quality Trend of BOD (mg/l), Total Coliform (MPN/100
ml) & Faecal Colliform (MPN/100 ml)
Water Quality Trend of BOD (mg/l) in Terms of Percentage
57 59 60 57 57 59 60 64 67 66 68 64 69
27 25 23 28 27 25 21 17 18 19 1818
18
16 16 17 15 16 16 19 19 15 15 14 18 13
0%
10%
20%
30%
40%
50%
60%
70%
80%
90%
100%
1995 1996 1997 1998 1999 2000 2001 2002 2003 2004 2005 2006 2007Year
BOD >6BOD 3-6BOD<3
Water Quality Trend of Total Coliform (MPN/100 ml) in Terms of Percentage
46 47 45 5063
47 46 44 45 44 46 45 50
32 36 3736
28
33 34 36 33 34 31 3133
22 17 18 14 920 20 20 22 22 23 24 17
0%
10%
20%
30%
40%
50%
60%
70%
80%
90%
100%
Year
TC>5000
TC 500-5000TC<500
21

Water Quality Trend of Faecal Coliform (MPN/100ml) in Terms of Percentage
55 60 5967
4856
65 63 58 59 60 5366
2827 29
26
35 2422 23 28 27 28
26
23
17 13 12 717 20 13 14 14 14 12
2111
0%
10%
20%
30%
40%
50%
60%
70%
80%
90%
100%
Year
FC>5000
FC 500-5000FC<500
2.6 Water Quality trend of BOD in Rivers
The Water Quality trend of BOD in river Ganga, Yamuna, Sabarmati, Mahi, Tapi, Narmada, Godavari, Krishna, Cauvery, Mahanadi, Brahmani, Baitarni, Subernarekha, Brahmaputra, Satluj, Beas, Pennar and Ghaggar depicting the data from 2002 to 2007 is presented in figure 2.2 to 2.19.
Figure 2.2: Water Quality Trend of BOD in River Ganga
WATER QUALITY TREND OF RIVER GANGA
0.8 0.72.8 2.8 2.7 2.9 2.7
16.8
27
14.4 15.3 16.414
0.5 0.1 0.1 02.5
0
5
10
15
20
25
30
2002 2003 2004 2005 2006 2007YEAR
BO
D (m
g/l)
MINMEANMAX
22

Figure 2.3 : Water Quality Trend of BOD in River Yamuna WATER QUALITY TREND OF RIVER YAMUNA
15.6
36
58
40
59
144
93
1.0 1.0 1.0 0.8 1.0 0.87.6 7.3 7.7 7.9
70.0
20.0
40.0
60.0
80.0
100.0
120.0
140.0
160.0
2002 2003 2004 2005 2006 2007YEAR
BOD
(mg/
l)
MINMEANMAX
Figure 2.4 : Water Quality Trend of BOD in River Sabarmati
WATER QUALITY TREND OF RIVER SABARMATI
50
475
275
380
207
293 310
2.00.80.10.90.60.8223526
5440
0.0
100.0
200.0
300.0
400.0
500.0
2002 2003 2004 2005 2006 2007
YEAR
BO
D (m
g/l)
MINMEANMAX
Figure2.5: Water Quality Trend of BOD in River Mahi
WATER QUALITY TREND OF RIVER MAHI
0.51 1.1
0.3
33.9
6 5.9
8.5 8.2
1.3
2.5 2.4 2.4 2.5
0.20.10.7
0123456789
2002 2003 2004 2005 2006 2007
YEAR
BOD (m
g/l)
MINMAXMEAN
23

Figure 2.6 : Water Quality Trend of BOD in River Tapi WATER QUALITY TREND OF RIVER TAPI
1 1 1 1.1
10 10
25 25.1 24 25
3.6 3.95.9 6
4.67.7
0.30.60
5
10
15
20
25
30
2002 2003 2004 2005 2006 2007
YEAR
BOD
(mg/
l)
MINMAXMEAN
Figure 2.7 : Water Quality Trend of BOD in River Narmada
WATER QUALITY TREND OF RIVER NARMADA
0.41
0.6 0.4 0.6
3.83.3
54.5
3.7
5
1.4 1.6 1.7 1.6 1.72.2
0.10
1
2
3
4
5
6
2002 2003 2004 2005 2006 2007
YEAR
BOD
(mg/
l)
MINMAXMEAN
Figure 2.8: Water Quality Trend of BOD in River Godavari
WATER QUALITY TREND OF RIVER GODAVARI
1.7 1
78
53
20 20
32 36
6.50.5 0.20.40.56.4 4.65.34.13.8
0102030405060708090
2002 2003 2004 2005 2006 2007
YEAR
BOD
(mg/
l)
MINMAXMEAN
24

Figure 2.9: Water Quality Trend of BOD in River Krishna WATER QUALITY TREND OF RIVER KRISHNA
0.5 1
10
17
12 12.2
14.8
9.8
3.1 3.22.3 2.5 2.4 2.3
0.4 0.40.2 0.102468
1012141618
2002 2003 2004 2005 2006 2007YEAR
BOD (m
g/l)
MINMAXMEAN
Figure 2.10: Water Quality Trend of BOD in River Cauvery
WATER QUALITY TREND OF RIVER CAUVERY
1 1 1
26.6
1012 12
6
38
0.10.20.11.81.92.21.91.8 2.1
0
5
10
15
20
25
30
35
40
2002 2003 2004 2005 2006 2007YEAR
BOD (m
g/l)
MINMAXMEAN
Figure 2.11: Water Quality Trend of BOD in River Mahanadi
WATER QUALITY TREND OF RIVER MAHANADI
7.65.6
16 16
3.8 3.62.7 1.8 2.1 2 1.8 2.4
02468
1012141618
2002 2003 2004 2005 2006 2007YEAR
BOD
(mg/
l)
MINMAXMEAN
25

Figure 2.12: Water Quality Trend of BOD in River Brahmani WATER QUALITY TREND OF RIVER BRAHMANI
1.5
0.2
10.3 0.5 0.4
6 6
5 5.2 5.44.8
2.7
1.9 1.9 1.7 1.4 1.6
0
1
2
3
4
5
6
7
2002 2003 2004 2005 2006 2007
YEAR
BO
D (m
g/l)
MINMAXMEAN
Figure 2.13: Water Quality Trend of BOD in River Baitarni
WATER QUALITY TREND OF RIVER BAITARNI
2
0.31
0.4 0.3 0.4
6.8
3.54 4.3
1.82.2
3.1
1.9 1.8 1.61.1 1.3
0
12
3
4
56
7
8
2002 2003 2004 2005 2006 2007
YEAR
BO
D (m
g/l)
MINMAXMEAN
Figure 2.14: Water Quality Trend of BOD in River Subernarekha
WATER QUALITY TREND OF RIVER SUBARNAREKHA
1
12
4.7 4.6
8
2 2.1 1.8 20.3 0.3110.2
22
1.31.7
0
2
4
6
8
10
12
14
2002 2003 2004 2005 2006 2007
YEAR
BOD (m
g/l)
MINMAXMEAN
26

Figure 2.15: Water Quality Trend of BOD in River Brahmaputra WATER QUALITY TREND OF RIVER BRAHAMPUTRA
0.4 0.4 0.3 0.3
1.3 1.3 1.3 1.6 1.3 1.4
3.93.5 3.5
6.25.7
2.2
0.10.10.0
1.0
2.0
3.0
4.0
5.0
6.0
7.0
2002 2003 2004 2005 2006 2007
YEAR
BOD
(mg/
l)
MINMEANMAX
Figure 2.16: Water Quality Trend of BOD in River Satluj
WATER QUALITY TREND OF RIVER SATLUJ
45
24
64
40
3228
0.1 0.1 0.1 0.1 0.1 03 2.9 3.2 4.5 3.6 2.1
0
10
20
30
40
50
60
70
2002 2003 2004 2005 2006 2007
YEAR
BOD
(mg/
l)
MINMEANMAX
Figure 2.17: Water Quality Trend of BOD in River Beas
WATER QUALITY TREND OF RIVER BEAS
0.3
1.8 1.6 1.1 1.4 1.2
56
4.8
10
3.2 2.9
0.1 0.2 0.2 0.2 0.10.7
0
2
4
6
8
10
12
2002 2003 2004 2005 2006 2007
YEAR
BOD (m
g/l)
MINMEANMAX
27

Figure 2.18: Water Quality Trend of BOD in River Pennar WATER QUALITY TREND OF RIVER PENNAR
1 1 1 0.8 10.5
2.9
6.3
3 2.8 2.8 3
2.12.8
1.9 1.9 1.91.5
0
1
2
3
4
5
6
7
2002 2003 2004 2005 2006 2007
YEAR
BOD
(mg/
l)
MINMAXMEAN
Figure 2.19: Water Quality Trend of BOD in River Ghaggar
WATER QUALITY TREND OF RIVER GHAGGAR180
28 28 28 30
81
27.41 1.2 0.11 0.9
12.3 117.811.2 7.90
20406080
100120140160180200
2002 2003 2004 2005 2006 2007
YEAR
BO
D (m
g/l)
8
MINMAXMEAN
28

CHAPTER III
Water Quality of Rivers at a Glance 3.1 Observed Water Quality
The monitoring results obtained during 2007 under National Water Quality Monitoring Programme reflect that organic matter & bacterial population of fecal origin continue to dominate the water pollution problem in India. The major water quality concerns as revealed from the monitoring results are pathogenic pollution as reflected through indicators i.e. Total Coliforms (TC) & Faecal Coliform (FC), organic matter as reflected through Biochemical Oxygen Demand (BOD) and salinity as reflected through conductivity. The observed range of water quality parameters in major Indian rivers for the year 2007 along with summary for the year 2002, 2003, 2004, 2005 and 2006 is given in Table 3.1 for comparative assessment of water quality trend between the years. A brief overview of these pollution related parameters is provided below.
3.2 Organic and Pathogenic Pollution
The Organic pollution as measured through Biochemical Oxygen Demand (BOD) and Chemical Oxygen Demand (COD) is considerably high; water bodies are saprobic and eutrophicated near large urban centres due to the discharge of partly treated or untreated wastewater. This results in depletion of oxygen in these stretches of water bodies. The rivers and lakes in hilly part of the country are not affected significantly by such pollution, as there are no large urban centres. Although, high BOD is associated with low Dissolved Oxygen (DO), but many times the DO measurement does not reflect such conclusion due to the fact that the DO is measured during daytime when the photosynthetic effects are prominent. In such stretches of water bodies, the diurnal variation in dissolved oxygen is quite large. The dissolved oxygen during daytime increases to super saturation level (sometimes as high as 300% saturation) whereas at night at the same place the dissolved oxygen goes as low as zero mg/l. The pathogenic pollution is one of the major causes for water borne disease. The majority of surface water monitoring locations are found contaminated with high levels of Faecal Coliform bacteria, which are indicators of pathogenic pollution.
The water quality of major rivers varied widely with respect to DO, BOD, Total Coliform (TC) and Faecal Coliform (FC). The level of DO is observed more than 4 mg/l in river Narmada, Brahmaputra, Mahanadi, Brahamani, Baitarni, Subernarekha and Beas throughout the year to sustain aquatic life whereas, the values less than 4 mg/l are observed in stretches of river Satluj (3.2 mg/l), Ganga (1.4 mg/l), Yamuna (0.0 mg/l), Hindon (0.0 mg/l), Mahi (0.4 mg/l), Gomti (1.1 mg/l), Dhansiri (1.2 mg/l), Sabarmati (0.0 mg/l), Shedhi (3.7 mg/l), Godavari (3.2 mg/l), Tapi (3.7 mg/l), Krishna (3.0 mg/l), Bhima (1.7 mg/l), Panchaganga (2.3
29

mg/l), Musi (0.0 mg/l), Pennar (2.8 mg/l), Cauveri (0.0 mg/l), Damanganga (3.1 mg/l), Karamana (0.0 mg/l), Ghaggar (1.0 mg/l), Swan (2.4), H.P., Kali (E) (0.0), Kali (W) (0.0), Chambal (0.0), Bharalu (0.0), Sankh (1.9), Maner (2.9), Lakshmantirtha (0.0), Bhavani (2.8), Kolak (2.8), Mindhola (2.5), Periyar (2.7), Pamba (3.7), Manimala (0.6), Irumpanam (2.2), Markanda (1.0), Sukhna (3.0), Imphal (3.4), Khuga (3.8), Ganol (1.4), Simsang (2.0), Gumti (3.7), Sekmai (3.2) and at few locations downstream of urban settlements due to discharge of untreated/partially treated municipal wastewater, which is responsible for high oxygen demand.
Very high values of Biochemical Oxygen Demand (BOD) are observed in rivers Amlakhedi (522 mg/l), Sabarmati (310 mg/l), Markanda (218 mg/l), Khan (125 mg/l), Kalinadi (120 mg/l), Hindon (120 mg/l), Yamuna (93 mg/l), Ghaggar (81 mg/l), Musi (51 mg/l), N- Choe (50 mg/l), Patiala Ki Rao (50 mg/l), Sukhna Choe (50 mg/l), Birupa (42 mg/l), Cauvery (38 mg/l), Kharoon (38 mg/l), Sukhana (36 mg/l), Bharalu river (36 mg/l), Godavari (36 mg/l), Kuakhai (36 mg/l), Kathajodi (36 mg/l), Chambal (34 mg/l), Seonath (30 mg/l), Bhima (28.6 mg /l), Satluj (28 mg/l), Ib (25.2 mg/l), Tapi (25 mg/l), Kali-Hindon (24 mg/l), Girna (23 mg/l), Bhadra (22.5 mg/l), Khari (19 mg/l), Kolak (19 mg/l), Manjira (18 mg/l), Tunghabhadra (16.5 mg/l), Damanganga (16 mg/l), Kshipra (15 mg/l), Nambul (14.6 mg/l), Ganga (14 mg/l), Ramganga (14 mg/l), Tungha (13.5 mg/l), Karamana (13.2 mg/l), Gomti (12 mg/l), Nira (11.5 mg/l), Deepar Bill (11 mg/l), Chandrabhaga (10.2 mg/l), Laxmantirtha (10 mg/l) and Krishna (9.8 mg/l). The relatively low values of BOD are measured in river(s) Beas, Mahi, Narmada, Brahmaputra, Mahanadi, Pennar, Baitarni and Brahamani.
In respect of Total Coliform and Faecal Coliform Numbers, river Yamuna is leading with highest count of 32X107 MPN/100 ml and 23X107 MPN/100 ml respectively followed by Kali (35X106 MPN/100 ml and 16X104 MPN/100 ml), Hindon (35X106 MPN/100 ml and 16X104 MPN/100 ml), Chambal(87X105 MPN/100 ml and 22X103 MPN/100 ml), Damodar (45X105 MPN/100 ml and 25X105 MPN/100 ml), Ghaggar (35X105 MPN/100 ml and 23X104 MPN/100 ml), Ganga (31X105 MPN/100 ml and 7X10⁵ MPN/100 ml), Tons river (131X104 MPN/100 ml and 121 X102 MPN/100 ml), Rupnarayan (7X10⁵ MPN/100 ml and 4X10⁵ MPN/100 ml), Kali Hindon (27X104 MPN/100 ml and 46X103 MPN/100 ml), Brahmaputra (24X104 MPN/100 ml and 24X104 MPN/100 ml), Bharalu (24X104 MPN/100 ml and 24X104 MPN/100 ml), Bhogdoi (24X104 MPN/100 ml and 46X103 MPN/100 ml), Satluj (17X104 MPN/100 ml and 9X10⁴ MPN/100 ml), Kathajodi (16X104 MPN/100 ml and 92X103 MPN/100 ml), Gomti (16X104 MPN/100 ml and 9X10⁴ MPN/100 ml), Barakar (16X104 MPN/100 ml and 5X10⁴ MPN/100 ml), Mindhola (11X104 MPN/100 ml and 46X103 MPN/100 ml), Borak (11X104 MPN/100 ml and 15X103 MPN/100 ml), Sabarmati (75X103 MPN/100 ml and 15X103 MPN/100 ml), Krishna (716X102 MPN/100 ml and 1600 MPN/100 ml), Brahmani (54X103 MPN/100 ml and 22X103 MPN/100 ml), Tapi (46X103 MPN/100 ml and 15X103 MPN/100 ml), Kathakal river (46X103
MPN/100 ml and 93X102 MPN/100 ml), Baleshwar Khadi (46X103 MPN/100 ml
30
and 24X103 MPN/100 ml), Purna (46X103 MPN/100 ml and 24X103 MPN/100 ml), Karmana (39X103 MPN/100 ml and 31X103 MPN/100 ml), Godavari (36X103 MPN/100 ml and 2200 MPN/100 ml), Mahanadi (35X103 MPN/100 ml and 17X103 MPN/100 ml), Kuakhai (35X103 MPN/100 ml and 17X103 MPN/100 ml), Nagavalli (35X103 MPN/100 ml and 2600 MPN/100 ml), Cauvery (28X103
MPN/100 ml and 17X103 MPN/100 ml), Valvant ( 24X103 MPN/100 ml and 16X103 MPN/100 ml), Kaveri (24X103 MPN/100 ml and 15X103 MPN/100 ml), Mahananda (22X103 MPN/100 ml and 4X10³ MPN/100 ml), Bhavani (22X103
MPN/100 ml and 3300 MPN/100 ml), Ambika (21X103 MPN/100 ml and 15X103
MPN/100 ml), Kalna (16X103 MPN/100 ml and 9200 MPN/100 ml), Khandepar (16X103 MPN/100 ml and 9200 MPN/100 ml) and Sikrana (16X103 MPN/100 ml and 9X10³ MPN/100 ml) at certain locations. The river Mahi, Subernarekha, Pennar, Beas, Baitarni and Narmada are relatively clean rivers as the number of Total Coliform and Faecal Coliform count are relatively less than 4300 MPN/100 ml and 1700 MPN/100 ml respectively.
3.3 Other parameters
The results of conductivity, pH and temperature measurement revealed that conductivity is conforming to the irrigation requirement in most of the rivers except estuarine parts. The level of conductivity observed in the mainstream of major river basins ranging between 23-56500 μmhos/cm and the higher values are in the estuarine region due to tidal influence. The creeks in Mumbai region indicate the conductivity values as high as 61250 in Thane Creek and 60930 in Mahim Creek. The hardness varies between 6-1850 mg/L in most of the rivers in the freshwater zones. The river Chambal D/s Nagda carries the highest concentration due to effluent discharges from Rayon Industry. However, the stretch of river Hosdurg has values of hardness as high as 6000 mg/L in the estuarine reach. Total Alkalinity ranges between 4-640 mg/L and the highest value is observed in River Sabarmati. The observed range of Boron in surface waters is 0.001 – 6.4 mg/l with a highest value in river Palar in Tamil Nadu. The concentration of Fluoride observed is 0.01 – 3.97 mg/L during the year and the higher values are observed in river Dhansiri in Assam and Damodar in West Bengal.
3.4 Groundwater Quality
Andhra Pradesh -Conductivity varies from 141 to 7380 µmhos/cm
except few locations, conductivity is meeting the criteria limit for drinking as well as irrigation purposes. The highest value of nitrate is observed at B/W near M/S Andhra sugars Ltd., Kovvur, W.G. Distt. (45.8 mg/l).
Assam, Meghalaya, Mizoram and Tripura- Conductivity varies from
48-1294 µmhos/cm and is meeting the criteria limit for drinking as well as irrigation purposes. The concentration of Nitrate (NO3
-) is observed in the range of 0.03-12.0 mg/l
31

32
Chattisgarh and Madhya Pradesh- Conductivity varies from 210-2225 µmhos/cm whereas the concentration of Nitrate (NO3
-) is observed in the range of 0.10-8.50 mg/l.
Himachal Pradesh, Chandigarh and Punjab- Conductivity varies from
304-1520 µmhos/cm and the level of Nitrate (NO3-) is observed in the
range of 0.1- 6. 3 mg/l.
Kerala- Conductivity varies from 90-700 µmhos/cm and is meeting the criteria limit for drinking as well as irrigation purposes. The concentration of Nitrate (NO3
-) is observed in the range of 0.3-10.6 mg/l.
Orissa Conductivity varies from 120-1606 µmhos/cm. The concentration of Nitrate (NO3
-) is observed in the range of 0.25- 22 mg/l.
Pondicherry and Tamil Nadu- Conductivity varies from 82-37,650 µmhos/cm and the higher values are due to sea water ingress in coastal tract. Nitrate is observed in the range of 0.08-2.90 mg/l.
Daman, Maharashtra and Gujarat- Conductivity varies from 105-6424
µmhos/cm and higher values are attributed to draught conditions and concentrated industrial activities. The concentration of Nitrate is observed in the range of 0.08-35.0 mg/l.
Rajasthan The conductivity varies from 200-16,900 µmhos/cm and the
salinity is attributed to saline soils. The concentration of Nitrate (NO3-) is
observed in the range of 0.14- 15.6 mg/l.
Uttar Pradesh and Uttaranchal- Conductivity varies from 410-2439 µmhos/cm whereas the concentration of Nitrate (NO3
-) is observed in the range of 0.2- 24.2 mg/l.
West Bengal- Conductivity varies from 135-2590 µmhos/cm and the
higher concentrations are in the vicinity of estuarine zone. The concentration of Nitrate (NO3
-) is observed in the range of 0.1- 9.6 mg/l.
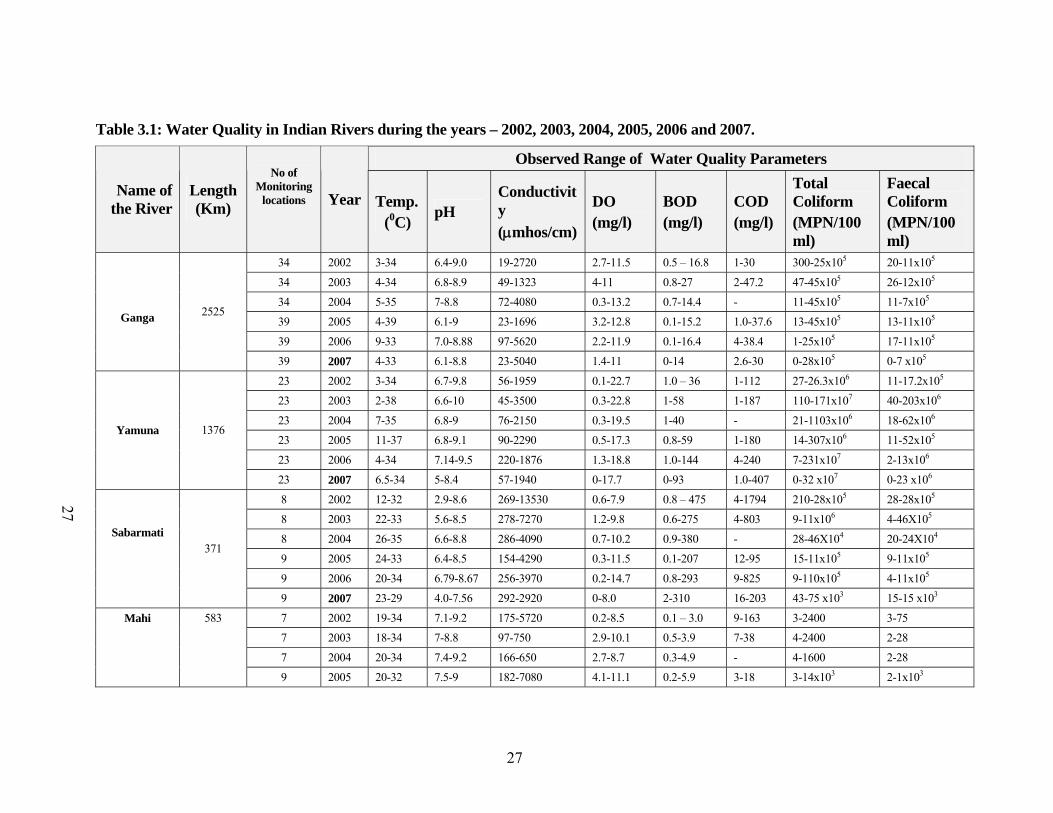
Table 3.1: Water Quality in Indian Rivers during the years – 2002, 2003, 2004, 2005, 2006 and 2007.
Observed Range of Water Quality Parameters
Name of the River
Length (Km)
No of
Monitoring locations Year Temp.
(0C) pH
Conductivity (μmhos/cm)
DO (mg/l)
BOD (mg/l)
COD (mg/l)
Total Coliform (MPN/100 ml)
Faecal Coliform (MPN/100 ml)
34 2002 3-34 6.4-9.0 19-2720 2.7-11.5 0.5 – 16.8 1-30 300-25x105 20-11x105
34 2003 4-34 6.8-8.9 49-1323 4-11 0.8-27 2-47.2 47-45x105 26-12x105
34 2004 5-35 7-8.8 72-4080 0.3-13.2 0.7-14.4 - 11-45x105 11-7x10⁵
39 2005 4-39 6.1-9 23-1696 3.2-12.8 0.1-15.2 1.0-37.6 13-45x105 13-11x105
39 2006 9-33 7.0-8.88 97-5620 2.2-11.9 0.1-16.4 4-38.4 1-25x105 17-11x105
Ganga 2525
39 2007 4-33 6.1-8.8 23-5040 1.4-11 0-14 2.6-30 0-28x105 0-7 x10⁵
23 2002 3-34 6.7-9.8 56-1959 0.1-22.7 1.0 – 36 1-112 27-26.3x10⁶ 11-17.2x10⁵
23 2003 2-38 6.6-10 45-3500 0.3-22.8 1-58 1-187 110-171x107 40-203x106
23 2004 7-35 6.8-9 76-2150 0.3-19.5 1-40 - 21-1103x106 18-62x106
23 2005 11-37 6.8-9.1 90-2290 0.5-17.3 0.8-59 1-180 14-307x106 11-52x105
23 2006 4-34 7.14-9.5 220-1876 1.3-18.8 1.0-144 4-240 7-231x107 2-13x106
Yamuna 1376
23 2007 6.5-34 5-8.4 57-1940 0-17.7 0-93 1.0-407 0-32 x107 0-23 x106
8 2002 12-32 2.9-8.6 269-13530 0.6-7.9 0.8 – 475 4-1794 210-28x105 28-28x105
8 2003 22-33 5.6-8.5 278-7270 1.2-9.8 0.6-275 4-803 9-11x106 4-46X105
8 2004 26-35 6.6-8.8 286-4090 0.7-10.2 0.9-380 - 28-46X104 20-24X104
9 2005 24-33 6.4-8.5 154-4290 0.3-11.5 0.1-207 12-95 15-11x105 9-11x105
9 2006 20-34 6.79-8.67 256-3970 0.2-14.7 0.8-293 9-825 9-110x105 4-11x105
Sabarmati 371
9 2007 23-29 4.0-7.56 292-2920 0-8.0 2-310 16-203 43-75 x103 15-15 x103
7 2002 19-34 7.1-9.2 175-5720 0.2-8.5 0.1 – 3.0 9-163 3-2400 3-75
7 2003 18-34 7-8.8 97-750 2.9-10.1 0.5-3.9 7-38 4-2400 2-28
7 2004 20-34 7.4-9.2 166-650 2.7-8.7 0.3-4.9 - 4-1600 2-28
Mahi
583
9 2005 20-32 7.5-9 182-7080 4.1-11.1 0.2-5.9 3-18 3-14x103 2-1x10³
27
27

Observed Range of Water Quality Parameters No of
Total Faecal Monitoring Name of Length ConductivitYear Temp. DO BOD COD the River (Km) locations
(0C) pH y
(μmhos/cm) (mg/l) (mg/l) (mg/l) Coliform Coliform (MPN/100 (MPN/100 ml) ml)
9 2006 16-28 7.2-8.9 263-580 7.3-12.1 1.1-8.5 - 3-180 2-9
9 2007 20-31 7.6-8.89 234-3720 0.4-10.7 0.3-5.7 2.5-20 4-160 0-11
10 2002 20-40 7.4-9.0 76-700 4.8-8.8 0.6 – 10.0 8-40 40-2100 2-210
10 2003 18-36 3.1-9.2 119-1130 3.1-10.4 1-10 10-44 30-930 2-230
10 2004 13-39 3.1-9.5 190-790 1.2-8.7 0.7-36 - 3-5X10⁵ 2-9X10⁴
13 2005 26-30 7.2-9.4 186-1084 4-8.4 1-25.1 - 2-46X104 2-15X104
13 2006 14-31 7.7-9.28 161-923 4.6-9.7 0.3-24 5-47 5-11X104 2-11X104
Tapi
724
14 2007 23-39 7.3-8.5 210-581 3.7-8.7 1.1-25 9-36 17-46 x103 7-15 x103
14 2002 - 6.9-9.3 102-1341 5.8-9.8 0.1 – 3.8 6-47 9-2400 2-64
14 2003 12-31 7.1-8.5 95-441 4.5-9.5 0.4-3.3 7-29 4-1600 1-110
14 2004 15-34 7-8.6 181-815 5.5-9.6 0.2-3.8 - 3-2400 2-15
15 2005 21-30 3.3-9 190-1746 4.8-10.9 0.6-4.5 12-18.3 3-2400 2-210
15 2006 9-32 7.1-8.6 188-682 6.2-11 0.4-3.7 3-50 3-2400 0-39
Narmada 1312
15 2007 19-31 7.5-8.8 244-1629 6.2-10.4 1.2-3.5 3.0-19. 3 7-1600 0-15
11 2002 22-35 7.0-9.0 118-1400 3.1-10.9 0.5 – 78.0 3-96 8-5260 2-3640
11 2003 22-37 7.1-8.7 115-1350 3.2-9.3 1.7-53 5-188 70-68200 3-1400
11 2004 21-35 6.5-9 86-1290 2.4-9.2 0.2-15 - 4-22X104 2-5X10⁴
18 2005 23-32 6.7-9.1 121-1300 0.8-8.7 0.5-20 4.0-80 2-33 X103 1-10 X103
18 2006 19-34 6.65-9.11 75-691 1.1-9.6 1.2-32 3-36 2-31 X103 2-6 X10³
Godavari
1465
18 2007 20-37 5.9-8.9 126-918 3.2-7.5 0.2-36 2-16 5-36 x103 0-2200
17 2002 18-33 6.8-9.5 28-11050 2.9-10.9 0.2 – 10.0 3-88 17-33300 3-10000
17 2003 18-35 6.7-8.9 36-40000 0.7-12.6 0.5-17 10.5-68 6-7X10⁴ 2-2X10⁴
Krishna 1401
17 2004 18-38 6.7- 9 71-44000 0.4-9.2 0.3-9 - 15-124X103 3-28X103
2828
28

Observed Range of Water Quality Parameters No of
Total Faecal Monitoring Name of Length ConductivitYear Temp. DO BOD COD the River (Km) locations
(0C) pH y
(μmhos/cm) (mg/l) (mg/l) (mg/l) Coliform Coliform (MPN/100 (MPN/100 ml) ml)
21 2005 24-37 6.5-9.9 69-43300 1.4-8.8 0.4-40 4-44 17-84 X103 1-34 X103
19 2006 15-40 6.32-9.30 76-2580 3.0-8.5 0.4-14.8 4-32.4 4-86X103 1-6000
19 2007 13-38 6.2-9.1 69-23400 3.0-10 0.1-9.8 4.0-48 0-71x103 0-1600
20 2002 21-37 2.0-9.2 31-53100 0.1-12.6 0.1 – 26.6 30 39-160000 2-28000
20 2003 8-34 7-9.2 42-57200 2.1-13.5 0.2-10 16-128 4-22X103 2-4000
20 2004 19- 35 6.6-9 35-39720 3.3-9.9 1-9 - 2-5X10⁴ 2-17X103
20 2005 20-37 6.2-9.5 28-48700 0.3-9.8 1-12 16-96 2-9500 1-3000
20 2006 20-34 7.0-9.3 26-1694 2.7-8.9 1-6 8-24 90-3500 3-1400
Cauvery 800
20 2007 19-32 6.5-8.8 28-56500 0-12.4 0.1-38 8-45 40-28 x103 4-17 x103
16 2002 18-38 7.3-8.9 114-15940 1.3-10.4 1.0 – 7.6 7-39 15-30000 50-17000
16 2003 17-37 6.5-8.6 77-83600 4.7-10.1 0.3-5.6 10-70 4-35X103 50-28X103
16 2004 17- 34 6.3-8.8 105-20700 4.4- 9.4 0.2-4 - 3-92X103 27-24X103
21 2005 22-34 6.1-8.7 75-36279 4.5-10 0.2-16 4-150 3-92X103 78-54X103
21 2006 20-32 6.97-8.9 113-34587 4.7-8.5 0.2-3.8 20-40 14-92X103 68-54X103
Mahanadi 851
21 2007 26-33 7.3-8.54 102-813 6.2-8.9 1.2-3.6 2.8-30 27-35 x103 700-17 x103
11 2002 20-38 7.0-8.4 81-376 5.2-9.8 1.5 – 6.0 8-13 80-90000 40-60000
11 2003 17-35 6.6-8.4 69-501 6.1-10.2 0.2-6 4.2-4.2 90-24x103 60-14x103
11 2004 16-28 6.3-8.4 47-402 6-9.6 0.2-7 - 490-28x103 22-13x103
11 2005 16-34 6.3-8.7 65-850 5.1-13.8 0.3-5.2 4-32.6 490-16x104 330-16x104
11 2006 18-32 6.9-8.4 102-380 4.6-8.9 0.3-5.4 8-20.2 940-5400 630-2400
Brahamani 799
15 2007 20-40 6.7-8.5 91-582 1.9-8.9 0.3-4.9 5.1-64 210-54 x103 110-22 x103
Baitarni - 5 2002 24-36 7.3-8.3 54-78400 6.8-9.3 2.0 – 6.8 7 900-22000 700-11000
29
29

Observed Range of Water Quality Parameters
Name of the River
Length (Km)
No of
Monitoring locations Year Temp.
(0C) pH
Conductivity (μmhos/cm)
DO (mg/l)
BOD (mg/l)
COD (mg/l)
Total Coliform
Faecal Coliform
(MPN/100 ml)
(MPN/100 ml)
5 2003 18-36 6.7-7.8 75-54802 5.4-11.3 0.3-3.5 - 330-16x103 230-9x10³
5 2004 18-32 6.6-8.1 64-29118 5.9-9.8 0.4-2.6 - 640-92000 310-35x102
5 2005 24-34 7-8.6 68-42257 5.2-8.8 0.4-4.3 12.9-20.4 790-24x103 3330-11x103
5 2006 15-25 7.6-8.4 90-2287 7.4-8.0 0.3-1.8 - 1400-4300 790-1700
5 2007 22-35 7.3-8.2 136-19450 5.6-8.8 0.4-2.2 6-20.9 330-5400 170-2200
6 2002 18-36 6.5-8.0 113-355 5.2-8.5 0.2 – 12.0 4-96 150-1800 70-540
6 2003 22-35 7.3-8.3 133-346 6.4-8.4 1-2 - 300-7900 130-3300
6 2004 24-28 7.8-8.3 152-623 7.1-7.5 0.4-2.5 - 470-2200 270-700
6 2005 20-36 6.8-8.3 130-405 5.5-8.6 1.0-4.7 4-38 110-1400 78-700
6 2006 19-34 6.9-7.9 192-15013 5.8-8.2 0.3-4.6 8.0-68 2200 1300
Subernarekha
395
6 2007 19-37 6-8.1 134-740 4.6-8.7 0.9-8.0 4-100 540-2400 200-920
6 2002 15-32 6.5-9.0 104-684 1.1-10.5 0.1 – 3.9 6-11 360-240000 300-24000
6 2003 14-32 6.4-8.4 77-570 1.2-11.5 0.4-3.5 4.8-27.4 360-24x104 300-24x104
6 2004 15-34 5.2-9 91-445 1.1-9.4 0.4-4.3 - 360-24x104 300-24x104
10 2005 - 5.9-7.6 20-408 2-10.5 0.3-6.2 - 300-24x104 150-24x104
10 2006 18-30 6.9-8.0 55-485 4.2-10.2 0.3-5.7 3.0-47.2 1-24x104 300-24x104
Brahmaputra
916
10 2007 18-32 5.9-7.9 76-645 5.1-10 0.1-3.4 3.1-15.4 0-24 x104 0-24 x104
4 2002 - 7.5-8.7 364-978 6.0-9.3 1.0 – 2.9 14-16 - -
4 2004 23-33 7.6-8.4 401-1035 3.3-8.8 0.6-4.8 14-16 120-2400 3-3
5 2005 27-30 7.8-8.8 447-2340 3.8-8 0.8-2.8 12-13.2 16-2790 2-35
5 2006 20-30 6.9-8.2 438-1933 3.0-6.8 10-2.8 - 20-62x103 1-960
Pennar 597
5 2007 21-31 7-8.7 250-1916 2.8-7.8 0.5-3.0 10-12 14-50x103 2-110
Satluj 1078 20 2002 9-32 6.8-8.8 131-819 3.8-11.4 0.1 – 45.0 1-80 8-35000 2-3500
30
30

Observed Range of Water Quality Parameters
Name of the River
Length (Km)
No of
Monitoring locations Year Temp.
(0C) pH
Conductivity (μmhos/cm)
DO (mg/l)
BOD (mg/l)
COD (mg/l)
Total Coliform
Faecal Coliform
(MPN/100 ml)
(MPN/100 ml)
20 2003 5-30 6.9-8.9 164-1226 3.4-11.5 0.1-24 0.8-61 3-3x10⁴ 1-1300
20 2004 9-29 7.1-8.3 144-694 1.6-10.3 0.1-64 - 7-2x10⁵ 2-9x10⁴
21 2005 10-28 7.1-8.3 150-818 2.8-14.2 0.1-40 2.8-60 1-35x104 1-11x104
21 2006 7-28 7.1-8.26 160-958 2.8-10.6 0.1-32 1.6-68 1-17x104 1-5x10⁴
21 2007 2-26 7-8.6 145-865 3.2-11.9 0-28 1.6-76 3-17 x104 0-9 x10⁴
19 2002 3-32 7.1-8.7 53-517 5.2-11.5 0.3 – 5.0 1-13 2-2400 2-1600
19 2003 4-29 7.3-8.9 76-559 7-12 0.1-6 1-18 2-2400 2-1600
19 2004 2-29 6.9-8.5 60-396 6.8-11.8 0.2-4.8 - 2-5x10⁴ 2-3500
19 2005 4-27 7-8.8 54-395 4.8-13 0.2-10 1.8-22 2-11x103 2-1100
19 2006 4-27 7.0-8.2 94-395 5.8-11.0 0.2-3.2 2-6.9 2-11x103 2-1100
Beas 460
19 2007 2-22 6.2-8.9 86-470 5.9-12.8 0.1-2.9 1.2-38 0-2400 0-2400
15 2002 11-33 7.0-9.5 320-1012 2.6-9.6 1-180 4-560 43-14000 9-2500
15 2003 18-30 6.5-8.1 280-1477 3.5-7.9 0.9-28 9.6-251.2 28-6000 9-600
15 2004 16-29 7.2-8.5 188-1390 0.8-8 0.5-28 - 500-17x104 28-9x10⁴
19 2005 14-29 7-9 21-2682 2.2-8.9 1-626 96-1600 43-15x104 14-5x10⁴
19 2006 14-22 7.1-7.9 230-1156 1.8-7.3 1.2-30 7.8-90 600-24x104 170-11x104
Ghaggar 291
19 2007 10-34 6.5-8.8 50-4260 0.3-8.6 0.2-218 4.6-200 7-35 x105 3-23 x104
1 2002 27-32 1.7-7.2 7160-16770 0-0 485 – 1561.6
1821-3860
28-1100 3-28
1 2003 27-32 3.1-7.4 3070-3070 - 33-1463 - 3-3 3-3
1 2004 20-32 2.2-7.4 7020-13400 0.4-0.4 247-947 - 9-93 2-4
Amlakhedi -
1 2005 27-27 2.4-7.5 300-11810 3.9-3.9 35-714 1548-1548
7-15 2-4
31
31
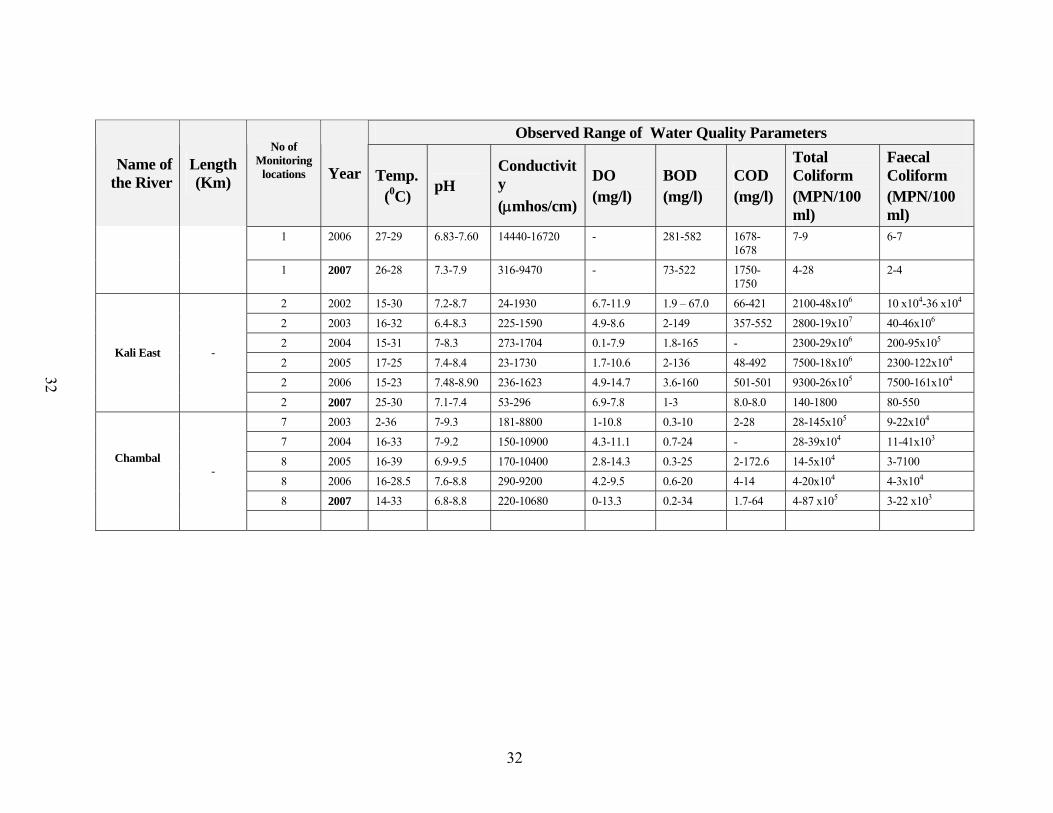
32
Observed Range of Water Quality Parameters
Name of the River
Length (Km)
No of
Monitoring locations Year Temp.
(0C) pH
Conductivity (μmhos/cm)
DO (mg/l)
BOD (mg/l)
COD (mg/l)
Total Coliform (MPN/100 ml)
Faecal Coliform (MPN/100 ml)
1 2006 27-29 6.83-7.60 14440-16720 - 281-582 1678-1678
7-9 6-7
1 2007 26-28 7.3-7.9 316-9470 - 73-522 1750-1750
4-28 2-4
2 2002 15-30 7.2-8.7 24-1930 6.7-11.9 1.9 – 67.0 66-421 2100-48x106 10 x104-36 x104
2 2003 16-32 6.4-8.3 225-1590 4.9-8.6 2-149 357-552 2800-19x107 40-46x106
2 2004 15-31 7-8.3 273-1704 0.1-7.9 1.8-165 - 2300-29x106 200-95x105
2 2005 17-25 7.4-8.4 23-1730 1.7-10.6 2-136 48-492 7500-18x106 2300-122x104
2 2006 15-23 7.48-8.90 236-1623 4.9-14.7 3.6-160 501-501 9300-26x105 7500-161x104
Kali East -
2 2007 25-30 7.1-7.4 53-296 6.9-7.8 1-3 8.0-8.0 140-1800 80-550
7 2003 2-36 7-9.3 181-8800 1-10.8 0.3-10 2-28 28-145x105 9-22x104
7 2004 16-33 7-9.2 150-10900 4.3-11.1 0.7-24 - 28-39x104 11-41x103
8 2005 16-39 6.9-9.5 170-10400 2.8-14.3 0.3-25 2-172.6 14-5x10⁴ 3-7100
8 2006 16-28.5 7.6-8.8 290-9200 4.2-9.5 0.6-20 4-14 4-20x104 4-3x10⁴
8 2007 14-33 6.8-8.8 220-10680 0-13.3 0.2-34 1.7-64 4-87 x105 3-22 x103
Chambal -
32

CHAPTER IV
Water Quality of Rivers in Indus Basin 4.1 Indus River System
The Indus Basin is bounded on the east by the Great Himalayas, on the north by the Karakoram and Haramosh ranges, on the west by the Sulaiman and Kirthar ranges and on the south by the Arabian Sea. The basin in Indian Territory has a maximum east-west length of about 855 km and maximum north south width of about 560 km.
The Indus rises near Manasarowar Lake in Tibet Plateau (China). The river has five tributaries in India; they are the Jhelum, the Chenab, the Ravi, the Beas, and the Sutlaj. The Jhelum, the Ravi and the Sutluj rivers each have a considerable length running along the international boundary.
The basin area of Indus is covering the States of Jammu & Kashmir, Haryana, Himachal Pradesh, Punjab, Chandigarh and Rajasthan., The important urban centres in these States are Ambala, Shimla, Jalandhar, Moga, Pathankot, Ludhiana, Batala, Patiala, Hoshiarpur, Amritsar, Bathinda, Abohar, Ganganagar, Chandigarh, Barnala, Faridkot, Fazilka, Firozpur, FirozpurCantt., Gurdaspur, Kapurthala, Khanna, KotKapura, Malerkotla, Malout, Mansa, Muktsar, Phagwara, Rajpura, S.A.S.Nagar, (Mohali), Sangrur, Nabha, Panchkula Urban Estate, Hanumangarh.
33

4.2 Water Quality Monitoring in Indus Basin
The State Pollution Control Boards of Himachal Pradesh, Punjab, Haryana and Rajasthan at 58 locations carry out the water quality monitoring of tributaries of River Indus in the basin. The ranges of water quality observed in rivers Beas, Satluj, Sirsa, Swan, Largi, Parvati and Ravi with respect to Temperature, pH, Conductivity, DO, BOD, COD, Nitrite, Nitrate, Ammonia-N, Total Coliforms (TC) and Faecal Coliform (FC) are presented as minimum, maximum and mean value to assess the extent of water quality variation throughout the year.
4.2.1 Water Quality of river Beas
The Water quality of river Beas indicates that pH, conductivity, BOD, DO and TC are meeting the water quality criteria at all locations in River Beas. The BOD value ranges from 0.1-2.9 mg/l. The count of Faecal Coliforms ranges from Nil to 2400 MPN/100ml whereas Total Coliforms ranges from Nil-2400 MPN/100ml. The Water Quality of river Beas is given in Annexure-I (Table 4.1). The water quality status of river Beas with respect to BOD is presented in Fig.4.1.
Figure 4.1: Water Quality of River Beas
WATER QUALITY OF RIVER BEAS - 2007
0.6 0.60.40.6
0.50.3
0.20.4
0.6 0.6 0.5
0.2
0.8 0.9 0.9
1.2
0.50.6 0.6
0.80.5
1 0.9
0.5
0.2
0.5
0.8 0.9 0.8
0.2
1.11.3 1.3 1.4
0.8 0.8 0.9
1.4
0.2
1
0.40.20.10.3
1.2
0.30.10.20.2
0.4
0.1 0.10.2
0.20.1
1.8
2.9
0
0.5
1
1.5
2
2.5
3
3.5
LOCATION
BO
D m
g/l
MINMEANMAX
34

4.2.2 Water Quality of river Satluj The water quality of river Satluj is conforming to water quality criteria with respect to pH, conductivity and DO except at 100m D/s Budha Nala Confl., Ludhiana where DO is observed low than the desired criteria. The DO varies from 3.2 to 12.0 mg/l and. The BOD ranges from 0.0-28 mg/l. The maximum value 28 mg/l of BOD is observed at D/s Budhanala Confluence at Ludhiana. The other locations having high level of BOD are at Boat Bridge Dharmkotnakodar Road of Jalandhar (16 mg/l), D/s of East Bein (8 mg/l) and Bridge Harike at Amritsar (4.8 mg/l) in Punjab. The Faecal coliform value ranges from 0 to 90,000 MPN/100ml whereas the Total Coliform value ranges from 3 to 170,000 MPN/100ml. The Total Coliforms count are considerably high and does not meet the criteria at number of locations such as at D/s of Budhanala confl. in Ludhiana, Boat Bridge at Dharmkotnakodar in Jalandhar and D/s of East Bein, in Punjab. The Fecal Coliforms count is considerably high at D/s of Budhanala Confl. in Ludhiana and Dharmkotnakodar in Jalandhar. The concentration of Nitrate (NO3
-) is observed in the range of 0.08-5.4 mg/l, whereas Ammonical Nitrogen (NH4-N) is in the range of 0.2-2.2 mg/l. The water quality of river Satluj is given in Annexure–I (Table 4.2). The water quality status of river Satluj with respect to BOD is presented in Fig. 4.2 & 4.3.
Figure 4.2: Water Quality of River Satluj (Upper Stretch)
WATER QUALITY OF RIVER SATLUJ - 2007 (UPPER STRETCH)
0.1
0.3
0.2
0.4 0.4
0.5
0.4
0.2
0.10.2
0.3
0.2
0.1 0.1 0.1 0.1
0.2
0.3
0.1 0.1
0.3
0.4
0.20.1
0
0.1
0.2
0.3
0.4
0.5
0.6
B / C WithR iver
Spit i A tKhab
N epthaZ akhai
U/ SR ampur
D / SR ampur
U/ ST atapani
U/ SSlapper
D / SSlapper
D / SB hakhra
LOCATION
BO
D m
g/l
M AXM EANM IN
35

Figure 4.3: Water Quality of River Satluj (Lower Stretch)
WATER QUALITY OF RIVER SATLUJ - 2007 (LOWER STRETCH)
0.6 1.8 1 0.4 0.22.6
16
8
1 1.84.8
0.4 1.5
17.9
10.7
4.6
1.22.7
86
28
0.90.20.71.00.41.20.80.83.2
10.20.40.40.40.20
5
10
15
20
25
30
LOCATION
BOD
mg/
l
MAXMEANMIN
4.2.3 Water Quality of river Ravi, Parvati, Largi, Swan and Sirsa The water quality of river Ravi, Parvati, Largi, Swan and Sirsa are meeting the water quality criteria for pH, DO, Conductivity, BOD and TC at all locations in the year during the period of monitoring except in river Swan at D/s Nangal and river Sirsa D/s Nalagarh Distt. Solan. River Swan is not meeting desired water quality quality criteria in respect of DO (2.4 mg/l) and BOD (4.8 mg/l). River Sirsa is receiving wastewater from industrial area of Barootiwala which cause increase in BOD (4.8 mg/l) level in the river. The Water Quality of river(s) Ravi, Parvati, Largi, Swan and Sirsa is given in Annexure-I (Table 4.3).
36

CHAPTER V
Water Quality of Rivers in Ganga Basin 5.1 Ganga River System
The Ganga basin covers slightly more than one-fourth (26.3 per cent) of the country’s total geographical area, and is the biggest river basin. In India the basin covers the whole of Uttaranchal, Uttar Pradesh, Bihar and the Union Territory of Delhi and parts of Punjab, Haryana, Himachal Pradesh, Rajasthan, Madhya Pradesh and West Bengal. The main river, rising in the northern most part of Uttaranchal, flows through Uttar Pradesh, Bihar and West Bengal and finally falls into the Bay of Bengal. The Ganga Basin is bound on the north by the Himalayas and on the south by the Vindhyas. The ridge between the Indus system and the Ganga system, the Great desert of Rajasthan and the Aravalli hills form the boundary on the west. After traversing a length of 1450 km in Uttaranchal and Uttar Pradesh and 110 km in the boundary between U.P. and Bihar the river then enters Bihar and flows 445 km more or less through the middle of the State. The length of the river measured along the Bhagirathi and the Hugli during its course in West Bengal is about 520 km.
37
The Ganga has a large number of tributaries. Some of these are of Himalayan origin having considerably large water wealth. The important tributaries within India are the Kali, the Ramganga, the Yamuna, the Gomti, the Ghaghara, the Gandak and the Kosi. The Yamuna although a tributary of the Ganga, is virtually a river by itself. Its major tributaries are the Chambal, the Sind, the Betwa and the Ken. The main plateau tributaries of the Ganga are the Tons, the Son, the Damodar and the Kasai-Haldi.
5.2 Water Quality Monitoring in Ganga Basin
The water quality monitoring of the river Ganga and its several tributaries are being done in the basin by the State Pollution Control Boards of Uttaranchal, Uttar Pradesh, Bihar, West Bengal, Haryana, Himachal Pradesh, Rajasthan, Madhya Pradesh and Central Pollution Control Board at 141 locations. The ranges of water quality observed in rivers in Ganga Basin with respect to pH, Conductivity, DO, BOD, Total Coliform and Faecal Coliform are calculated and presented as minimum, maximum and mean value to assess the extent of water quality variation throughout the year.
5.2.1 Water Quality of river Ganga
The Water quality of river Ganga indicates that pH, conductivity and DO are meeting the water quality criteria at majority of locations. Dissolved Oxygen ranges from 1.4 to 11.0 mg/l. The lowest value of 1.4 mg/l DO is observed at Kanpur D/s (Jajmau Pumping Station) in Uttar Pradesh. High value of conductivity is observed at Diamond Harbour (5040 µmhos/cm) and Kanpur U/s (Ranighat) (4300 µmhos/cm). The BOD value ranges from 0.0-14.4 mg/l. The highest value of 14.4 mg/l of BOD is observed at D/S of Varanasi (Malviya Bridge). The other locations observed with maximum BOD level exceeding the criteria are Haridwar D/s, Narora, Garhmukteshwar, Kannauj U/s and D/s, Bithoor, Kanpur U/s and D/s, Dalmau (Raibareilly), Allahabad (Rasoolabad) and D/s, Varanasi U/s, Ghazipur (Trighat), Beharampore, Dakshineshwar, Garden reach, Uluberia, Palta and Diamond Harbour. The count of Faecal Coliforms (FC) ranges from 0 to 7, 00,000 MPN/100ml whereas Total Coliforms (TC) ranges from 0 to 31,00,000 MPN/100ml. The Total Coliforms (TC) is not meeting the water quality criteria at most of the locations. The highest value of Total Coliform is observed in Alkananda b/c to river Mandakini at Rudraprayag and of Faecal Coliform at Dakshineshwar and Garden Reach (7,00,000 MPN/100ml) in West Bengal. The concentration of Nitrate (NO3
-) varies from 0.1-3.8 mg/l whereas Nitrite (NO2-) ranges from
0.01-3.3 mg/l and the Ammonical Nitrogen (NH4-N) are observed in the range of 0.0-1.5 mg/l. The water quality of river Ganga with respect to pH, Conductivity, D.O, BOD, FC and TC, Nitrite, Nitrate and Ammonical Nitrogen is given in Annexure-I (Table 5.1). The water quality status of mainstream Ganga with respect to BOD is given in Figure 5.1 & 5.2.
38

Figure 5.1: Water Quality of River Ganga (Upper Stretch)
WATER QUALITY OF RIVER GANGA - 2007 (UPPER STRETCH)
0 0 0 0 0 0 0
3.1
00.9 1 1 1 0.9 0.9 1.2
3.8
2.53.1 3.4 3.9
2.7 2.93.6
0
2.13
2.12.9
2.3 2.5 2.1
5.6
3.5 3.75
6
3.8
9.8
3.5 44.7
3.4 3.12.821.9
2.6
0
3
1.5 1.6 2.1
6.1
3.3 3.2
6.4
0
2
4
6
8
10
12
LOCATION
BO
D m
g/l
M INM EANM AX
Figure 5.2: Water Quality of River Ganga (Lower Stretch)
WATER QUALITY OF RIVER GANGA - 2007 (LOWER STRETCH)
3.1
10.4
3.42 2.1 2.3 2 2.3 2 2.1 2.1 2.3 2.4
3.3
11.9
4
2.1 2.2 2.1 1.8
4
23.5
2.7 2.3 2.22.1 2.4 2.1 2.4 2 2.1 2.2
3.92.3
6.2
2.54.1 4.1 4.2
3.2
0.81.3 1.51.41.41
2.122.42.4 2.12.22.3
3.84.6
14.4
0
2
4
6
8
10
12
14
16
LOCATION
BO
D m
g/l
M INM EANM AX
5.2.2 Water Quality of river Yamuna
The river Yamuna is a major tributary of river Ganges. In the upper course of 200 km stretch it draws water from several major streams namely Rishi-
39

Ganga, Unta and Hanuman Ganga, Tons, Giri, and Ashan. The combined stream flows through the shivalik range of hills of Uttaranchal, Himachal Pradesh, and Uttar Pradesh and enters into the plains in the Dak Phatthar in Haryana where this river regulated through weir and diverted into canal for power generation. From Tajewala barrage in Yamunanagar district of Haryana, river again diverted into Western Yamuna Canal and Eastern Yamuna Canal for irrigation. River regain its water from ground water accrual and feeding canal through Somnadi (seasonal stream) just upstream of Kalanaur and traverses a route of about 1150 km through three states i.e. Haryana, Delhi and U.P. and finally to its confluence with Ganges at Allahabad. It receives major tributaries like Chambal, Betwa, Sindh and Ken from right bank and Hindon from left bank.
The availability of water in Yamuna River is greatly varied with time and space. Precipitation is confined to only three months in a year and varies greatly. Most of the water flows in the Yamuna (nearly 80%) in monsoon period (July, August and September) only. Whatever water flows in non-monsoon period (October to June) is extensively used for irrigation and drinking leaving very little or no water in the river to flow. It is observed that about 500 km long stretch of the river is in bad shape, having water quality, most of the time, below desired level for "designated best use". In the dry season four distinct gradients of pollutional load can be discerned in the river stretch between Wazirabad and Etawah. The stretch between Wazirabad and Okhla is the most heavily polluted one, carrying the massive input of wastewater from Delhi. This input has sets off a progressive series of chemical and biological events in the downstream water. This stretch is characterised by high bacterial population, cloudy appearance high BOD and strong disagreeable odour - all indicating general depletion of oxygen. Masses of gaseous sludge rising from the bottom are often noticed floating near the surface of the water. During monsoon due to flood the sludge deposited in this stretch is flushed and stay in suspension causes rise in oxygen uptake in the downstream. This causes heavy fish mortality every year during first flushing after onset of monsoon. Though there are number of bathing "Ghats along the river in Delhi stretch, the quality of water is far below the bathing standards. Even in this short stretch, remarkable purification takes place due to high temperature and long retention time in this stretch due to the two barrages one at Okhla and another at ITO (nearly 10 km upstream of Okhla Barrage). The ITO Barrage is used divert the Yamuna water for cooling purpose of the two Thermal Power Plants located near ITO. In the stretch between Okhla and Agra the same assimilative capacity can be observed after the sewage input at Okhla, Mathura and Agra. After a few kilometers the repeated additions of sewage are mainly noticeable by a higher state of eutrophication leading to the formation of algal mats in the River. Excessive algal can cause problems associated with the oxygen balance in the water (daytime super saturation and nighttime oxygen depletion). The water quality from DO, BOD, and bacterial point of view is not fit for designated best uses of this stretch. The Agra Water Works is drawing its raw water from this only.
40
The stretch from Agra to the confluence with the Chambal River at Etawah is characterized by self- purification processes of the Agra effluents. The confluence with relatively clean Chambal River is of great value in diluting the pollution load of Yamuna River before it joins the Ganga at Allahabad. During the monsoon period due to huge mass of water flows in the river the barrages are opened leading to a more or less continuous system. The high load of untreated biodegradable material (domestic sewage) leads several gradients in saprobic and eutrophic conditions; major part of the Yamuna can hardly fulfill the designated uses.
5.2.2.1 Major Water Quality Segments
The Yamuna is classified into 5 distinct segments due to characteristic Hydrological and Ecological conditions. These segments are:
Himalayan Segment: From origin to Tajewala Barrage (172 kms.) Upper Segment: Tajewala Barrage to Wazirabad Barrage (224 kms.)
Delhi Segment: Wazirabad Barrage to Okhla Barrage (22 kms.) Eutrophicated Segment: Okhla Barrage to Chambal Confluence (490 kms.) Diluted Segment: Chambal Confluence to Ganga Confluence (468
kms.) 5.2.2.2 Critical Segments
The water quality in the Himalayan Segment and the Diluted Segment is comparatively good. However, due to heavy abstraction from and discharge of pollutants into the river system, there are critical segments, which require pollution abatement measures to improve the water quality of the river. These segments with the causes of pollution are:
Wazirabad to Okhla : Domestic and industrial waste water of Delhi.
Okhla to Vrindavan: Domestic wastewater from Delhi and industrial effluent from Saharanpur, Muzaffarnagar, Ghaziabad, NOIDA, etc.
Vrindavan to Mathura: Domestic wastewater and industrial effluent from dyeing and printing industry of Vrindavan and Mathura.
Mathura to Etawah: Domestic wastewater from Agra and Etawah. 5.2.2.3 Water Quality of river Yamuna
The water quality of river Yamuna is conforming to water quality criteria with respect to pH only throughout its length which ranges 5.0 to 8.4. The DO varies from 0.0 to 17.7 mg/l, which indicates that the river is highly septic or eutrophicated at a number of locations. The low values of DO are observed at Kalanaur, Nizamuddin Bridge, Okhla barrage after meeting Shahdara Drain, Mazawali, Agra U/s & D/s and Bateshwar.
41

The BOD ranges from 0.0-93.0 mg/l. The maximum value of 93 mg/l of BOD is observed at Okhla after meeting Shahdara drain. The other locations observed maximum BOD are at Nizamuddin (47 mg/l), Mazawali (37 mg/l), Agra D/s (33 mg/l), Mathura U/s (20 mg/l), Bateshwar (20 mg/l), Agra U/s (16 mg/l), Etawah (16 mg/l), Mathura D/s (15 mg/l), Juhika B/C with Chambal at Etawah (7 mg/l), Palla (6.0 mg/l), Sonepat D/s (5.0 mg/l), Kalanaur Yamuna Nagar (5.0 mg/l), Okhla Bridge-inlet of Agra canal (3.6 mg/l) and Allahabad D/s (3.1 mg/l). Faecal Coliform value ranges from 0 to 23x106 MPN/100ml whereas the Total Coliform value ranges from 0 to 32x107 MPN/100ml. The Total and Faecal Coliforms count is considerably high and does not meet the criteria at number of locations in Delhi, downstream reach of Delhi upto Etawah downstream, Hathnikund, Mazawali, Poanta Sahib, Allahabad, Bateshwar, Kalanaur (Yamuna Nagar), Sonipat, and Palla. The concentration of Nitrate (NO3
-) varies from 0.1-9.0 mg/l whereas Nitrite (NO2
-) ranges from 0.01-1.02 mg/l and the Ammonical Nitrogen (NH4-N) is observed in the range of 0.05-28.9 mg/l and does not meeting the criteria at number of locations in Delhi and downstream reach of Delhi upto Etawah downstream. The water quality of river Yamuna is presented in Annexure-I Table 5.2. The water quality status of mainstream Yamuna with respect to BOD is given in Figure 5.3 & 5.4.
Figure 5.3: Water Quality of River Yamuna (Upper Stretch)
WATER QUALITY OF RIVER YAMUNA UPPER STRETCH(Yamnotri to Sonepat D/s) - 2007
0 0
2.1
1.4
0.8
2
5 5
0 0
1.00.7
0.90.5
1.2
2
2.8
0 0 0 0 0.1 0.2
1 1 1
2
0
1
2
3
4
5
6
LOCATION
BO
D m
g/l
M AXM EANM IN
42

Figure 5.4: Water Quality of River Yamuna (Lower Stretch)
WATERQUALITY OF RIVER YAMUNA LOWER STRETCH (Palla to Allahabad) - 2007
6
4737
20 15 16
3320 16
7 2.2 3.13
23.830
17.810.8 9.3 10.2
16.7 11.4 10.24.2 2.2 2.5
93
1.82.23354650.121 250102030405060708090
100
LOCATION
BOD
mg/
l
M AXM EAN
M IN
5.2.3 Water Quality of tributaries - Kalinadi (E), Ramganga, Gomti, Saryu,
Ghaghara, Hindon, Kali-Hindon, Rihand, Rapti, Sikrana, Sai, Sirsa, Daha, Farmar and Gandak
The water quality of tributaries namely Kalinadi (E), Ramganga, Gomti, Saryu, Ghaghara, Hindon, Kali-Hindon, Rihand, Rapti, Sikrana, Sai, Sirsa, Daha, Farmar and Gandak is conforming to water quality criteria with respect to pH and conductivity throughout its length. The DO varies from 0.0 to 12.7 mg/l in mentioned rivers. The DO is observed Nil in following rivers Kali (E), Kali-Hindon and Hindon at various locations. The BOD ranges from 1.0-120 mg/l in river Kali (E). The high BOD values were observed in Kalinadi (E) at Kannauj (120 mg/l), Hindon at Ghaziabad D/s (120 mg/l), Hindon at Puramahadev (34 mg/l), Kali (E) at Gulawati (34 mg/l), Hindon at Saharanpur downstream (24 mg/l), Kali (W) D/s Mujaffarnagar (24 mg/l), Ramganga at Kannauj (14 mg/l), Gomti at Jaunpur D/s (12 mg/l), Sikrana at Chanpatiya (8.0 mg/l), Gomti at Sitapur U/s at water intake pt. (4.2 mg/l), Kali (W) U/s Mujaffarnagar (4.1 mg/l), Gomti at Lucknow U/s (3.8 mg/l), Saryu at Ayodhya (3.2 mg/l), Gomti at Lucknow D/s (3.2 mg/l) and Rapti after confl. of R. Honin (3.1 mg/l). The Faecal Coliform (FC) value ranges from 24 to 16x104 MPN/100ml, whereas the Total Coliform (TC) value ranges from 18 to 35x106 MPN/100ml. The highest count of TC is observed at Kali (E) at Gulawati. The other places having higher values for TC are Hindon at Pura Mahadev, Kali (E) at Kannuaj, Kalinadi (W) at U/s and D/s of Muzaffar Nagar, Hindon at Sharanpur D/s, Hindon at Ghaziabad D/s, Gomti at Lucknow U/s, Gomti at Jaunpur D/s, Gomti at Sitapur U/s, Sikrana at Chanpatiya and Saryu at
43
Ayodhya in Uttar Pradesh. The water quality of the tributaries Kalinadi (E), Ramganga, Gomti, Saryu, Ghaghara, Hindon, Kali-Hindon, Rihand, Rapti, Sikrana, Sai, Sirsa, Daha, Farmar and Gandak is presented in Annexure-I, Table 5.3.
5.2.4 Water Quality of tributaries - Chambal, Khan, Kshipra, Parvati, Betwa, Sind, Tons, Sone Johila, Sankh, Mandakini and Gohad.
The water quality of Chambal, Khan, Kshipra, Parvati, Betwa, Sind, Tons, Sone Johila, Sankh, Mandakini and Gohad tributary streams is conforming to water quality criteria with respect to pH, DO and conductivity at all the locations except Chambal at Nagda downstream and Khan at Kabit Khedi Near Indore in Madhya Pradesh where the high conductivity 10680 µmhos/cm and 2261 µmhos/cm respectively and DO of 0.0 mg/l is found. The low value of DO is also observed in River Chambal at Rameshwarghat near Sawaimadhopur (2.6 mg/l) and at Kota D/s (2 Km. from city) (3.7 mg/l) in Rajasthan. The BOD ranges from 0.2-125 mg/l. The maximum value of 125 mg/l of BOD is observed in river Khan at Kabit Khedi near Indore. Other locations having high BOD are Chambal at Nagda D/s (34 mg/l), Kshipra at Ramghat at Ujjain (15 mg/l), Kshipra at Trivenisangam (1 Km. D/s of Sangam) (14 mg/l), Kshipra at Siddhawat (8 mg/l), Tons at Madhavgarh (8.0 mg/l), Chambal at Kota D/s (2 Km. from city) (5.3 mg/l), Mandakini at Chitrakoot (5.0 mg/l), Parvati near intake point Pillukhedi Distt. Rajgarh (4.5 mg/l) and Chambal at Rameshwarghat near Sawaimadhopur (4.3 mg/l). The Faecal Coliform value ranges from 0-22,000 MPN/100ml, whereas the Total Coliform (TC) value ranges from 4 to 87,00,000 MPN/100ml. The highest values of Faecal Coliforms count and Total Coliforms are observed in Chambal at Etawah before confluence to river Yamuna. The other places having higher values for TC are Tons River in H.P., Sone at Koelwar, and Khan at Kabit Khedi near Indore. The concentration of Nitrate (NO3
-) varies from 0.10-42.0 mg/l whereas Nitrite (NO2
-) ranges from 0.01-7.8 mg/l. The maximum value of nitrate (42.0 mg/l) is observed in river Khan at Kabit Khedi near Indore. The Ammonical Nitrogen (NH4-N) is observed in the range of 0.00-21.0 mg/l and does not meeting the criteria in river Betwa B/C Yamuna at Hamirrpur (21 mg/l) followed by River Khan at Kabit Khedi near Indore (15 mg/l), river Chambal at Gandhi Sagar Dam, at Rameshwarghat near Sawaimadhopur and Nagda D/s; Kshipra at Siddhawat D/s of Ujjain and Trivenisangam (1 Km. D/s of Sangam). The water quality of tributaries discussed above is presented in Annexure-I Table 5.4.
5.2.5 Water Quality of tributaries – Damodar, Barakar, Mahananda and Rupnarayan
The water quality of the tributary streams Damodar and Rupnarayan with respect to pH, DO and Conductivity are meeting the water quality criteria, except Damodar at Haldia D/s where conductivity (13840 µmhos/cm) and pH 5.8 is observed. The BOD ranges from 0.6-4.9 mg/l. The highest value of
44

BOD (4.9 mg/L) is observed in Damodar near Mujher mana village A/c of Tamla Nallah and at Narainpur after Confl. of Nunia Nallah in West Bengal. The Faecal Coliform (FC) value ranges from 800 to 25x105 MPN/100ml, whereas the Total Coliform (TC) value ranges from 1100 to 45x105 MPN/100ml. The Total Coliforms values are above the criteria level at all the places. The nitrate (NO3
-) values ranges from 0.10-2.8 mg/l. Ammonical Nitrogen (NH4-N) values ranges from 0.0-13.0 mg/l. The highest concentration of ammonical nitrogen is observed at Damodar near Mujher mana village A/c of Tamla Nallah in West Bengal. The water quality of these tributaries is presented in Annexure-I Table 5.5.
45

CHAPTER VI
Water Quality of Rivers in Brahmaputra Basin 6.1 Brahmaputra River System
The Brahmaputra basin extends over an area of nearly 5, 80,000 sq km and traverses a distance of about 2900 km through Tibet (China), India and Bangladesh. In India, the basin lies in the states of Arunachal Pradesh, Assam, Nagaland, Meghalaya and West Bengal. The river rises in the Great glacier in the northern-most chain of the Himalayas in the Kailash range at an elevation of about 5,510 m. It enters India across the Sadiya frontiers tract, west of Sadiya town into the Assam valley. Here it is joined by two more tributaries viz. the Dibang or Sikang and the Lohit, from here onwards the river is known as the Brahmaputra. The river then descends down into the Assam valley from east to west for a distance of about 720 km with its channels meandering from side to side and forming several islands, one of these islands, Majuli covers an area of 1,250 sq. Km. during its course the river receives many more tributaries both from the north and the south while some of them are trans-Himalayan rivers with considerable discharges. The Brahmaputra has the highest discharge of all the rivers, in India, because of heavy annual average rainfall in the catchment area. The river has eight significant tributaries in India, three from the north are the Manas, the Kameng (or the Jia Bharali) and the Subansiri and three from the east are the Dibang or Sikang, the lohit and the Buri Dihing and two from the North West are the Tista and the Jaldhaka.
46

The basin area of Brahmaputra is covering the States of Arunachal Pradesh, Assam, Nagaland, Meghalaya, Sikkim and West Bengal. The important urban centres in these States are Shillong (Meghalaya), Guwahati, Jorhat Dilbrugarh, Siliguri, Alipurduar, Dhubri, Nagaon, Tezpur, Tinsukia (Assam), Dimapur (Nagaland), Kohima (Sikkim), Darjeeling, Dabgram Jalpaiguri, Koch-Bihar (West Bengal).
6.2 Water Quality Monitoring in Brahmaputra Basin The State Pollution Control Boards of Assam, Nagaland and Sikkim at 66
locations are doing the water quality monitoring of the river Brahmaputra and its several tributaries in the basin. The tributary streams covered under the monitoring programme are Subansiri, Kharsang, Buridihing, Pagladia, Digboi, Jaibharli, Kolong, Manas, Disang, Jhanji, Bhogdoi, Mora Bharali, Borak, Bharalu, Kathakal and Deepar Bill. The ranges of water quality observed in the mainstream and tributaries with respect to pH, Conductivity, DO, BOD, Nitrate, Nitrite, Ammonical Nitrogen, Total Coliform (TC) and Faecal Coliform (FC) are presented as minimum, maximum and mean value to assess the extent of water quality variation throughout the year.
6.2.1 Water Quality of river Brahmaputra
The water quality of river Brahmaputra is conforming to water quality criteria with respect to pH, Conductivity and DO. The BOD value ranges from 0.1-3.4 mg/l. The highest value of 3.4 mg/l of BOD is observed at Jogijhoga near Bridge. The other locations having high value of BOD are at Chandrapur, Guwahati (3.3 mg/l), at Sualkuchi, Dist. Kamrup (3.1 mg/l) and at Dhenukhapahar (3.1 mg/l) in Assam. The count of Faecal Coliforms (FC) ranges from 0 to 2,40,000 MPN/100ml whereas the maximum number of Total Coliforms observed 2,40,001 MPN/100ml at Dhenukhapahar. The TC is not meeting the water quality criteria at many locations under monitoring programme. The water quality of Brahmaputra is presented in Annexure-I Table 6.1. The water quality status of river Godavari with respect to BOD is presented in Figure 6.1.
47

Figure 6.1: Water Quality of River Brahmaputra
WATER QUALITY OF RIVER BRAHMAPUTRA - 2007
0.40.2
0.5 0.40.1 0.2
0.5
1.11.3
0.7
1.31.1
1.71.4
1.2 1.20.9
1.92.2
1.1
2.4 2.52.7
3.12.9
3.4
1.1
3.33.1
1.6
0
0.5
1
1.5
2
2.5
3
3.5
4K
herg
hat (
A/C
With
Dib
ang
&D
ihan
g)
Dib
ruga
rh
Nim
atig
hat
Dhe
nukh
apah
ar
Pand
u
Jogi
ghop
a N
ear
Brid
ge
Nea
r Wat
erIn
take
Poi
nt A
tK
acha
righa
t
Cha
ndra
pur
Sual
kuch
i, D
ist.
Kam
rup
Dhu
bri
LOCATION
BO
D m
g/l
M INM EANM AX
6.2.2 Water Quality of tributary stream Dhansiri
The water quality of river Dhansiri is conforming to water quality criteria with respect to pH, Conductivity and DO at all the locations except Dhansiri at Nuton Basti in Nagaland, where the very low DO (1.2 mg/l) is found. The BOD ranges from 0.3-4.8 mg/l. The highest value of 4.8 mg/l of BOD is observed at Dhansiri at Nuton Basti, Nagaland. The BOD is not meeting the water quality criteria at all the locations under monitoring programme except at Bridge near Purana Bazar, Nagaland. The water quality of Dhansiri is presented in Annexure-I Table 6.2.
6.2.3 Water Quality of tributary stream Subansiri, Kharsang, Buridihing,
Pagladia, Digboi, Jaibharli, Kolong, Manas, Disang, Jhanji, Bhogdoi, Mora Bharali, Borak, Bharalu, Kathakal and Deepar Bill
The Water quality of other tributary streams Subansiri, Kharsang, Buridihing, Pagladi, Digboi, Jaibharli, Kolong, Manas, Disang, Jhanji, Bhogdoi, Mora Bharali, Borak, Bharalu, Kathakal and Deepar Bill is meeting the desired criteria for pH, Fecal Coliform, Conductivity and DO except Bharalu River at Guwahati where DO is observed NIL. The highest value of BOD (36.0 mg/l) is observed in Bharalu River at Guwahati. High values of BOD are also observed at Deeparbill (11.0 mg/l), Burhidihing at Margherita (7.9 mg/l), Mora Bharali At Tezpur (4.5 mg/l), Digboi River at Lakhipathe, Reserve Forest, Digboi (4.4 mg/l), at Borak at Panchgram (3.5 mg/l) and Kolong River at Marigaon (3.9 mg/l) in Assam. The Total Coliform count varies from 0- 2, 40,000 MPN/100 ml. The Faecal Coliform count varies from 0–2, 40,001 MPN/100 ml. The Total Coliform is observed higher than the criteria in
48

Subansiri, Kharsang, Pagladia, Digboi, Disang, Bhogdoi, Borak, Bharalu, Deeparbill and Kathakal. Water quality of Subansiri, Kharsang, Buridihing, Pagladi, Digboi, Jaibharli, Kolong, Manas, Disang, Jhanji, Bhogdoi, Mora Bharali, Borak, Bharalu, Kathakal and Deepar Bill is presented in Annexure-I Table 6.3.
49
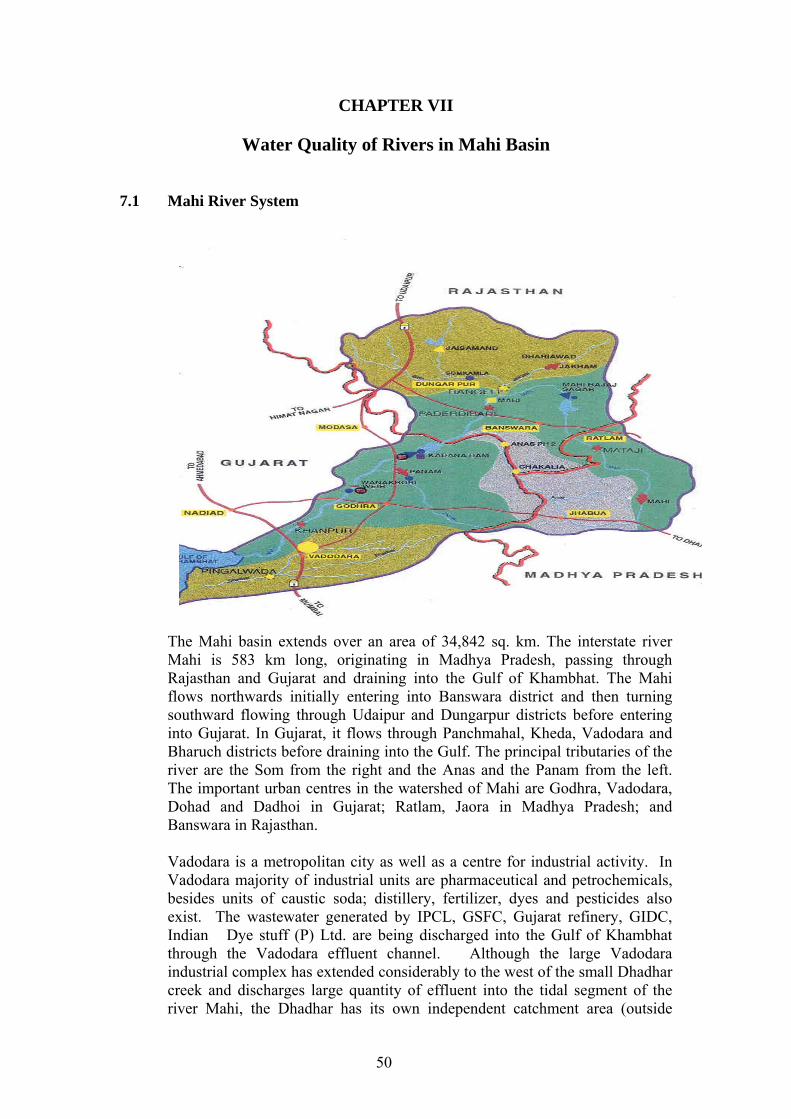
CHAPTER VII
Water Quality of Rivers in Mahi Basin 7.1 Mahi River System
The Mahi basin extends over an area of 34,842 sq. km. The interstate river Mahi is 583 km long, originating in Madhya Pradesh, passing through Rajasthan and Gujarat and draining into the Gulf of Khambhat. The Mahi flows northwards initially entering into Banswara district and then turning southward flowing through Udaipur and Dungarpur districts before entering into Gujarat. In Gujarat, it flows through Panchmahal, Kheda, Vadodara and Bharuch districts before draining into the Gulf. The principal tributaries of the river are the Som from the right and the Anas and the Panam from the left. The important urban centres in the watershed of Mahi are Godhra, Vadodara, Dohad and Dadhoi in Gujarat; Ratlam, Jaora in Madhya Pradesh; and Banswara in Rajasthan. Vadodara is a metropolitan city as well as a centre for industrial activity. In Vadodara majority of industrial units are pharmaceutical and petrochemicals, besides units of caustic soda; distillery, fertilizer, dyes and pesticides also exist. The wastewater generated by IPCL, GSFC, Gujarat refinery, GIDC, Indian Dye stuff (P) Ltd. are being discharged into the Gulf of Khambhat through the Vadodara effluent channel. Although the large Vadodara industrial complex has extended considerably to the west of the small Dhadhar creek and discharges large quantity of effluent into the tidal segment of the river Mahi, the Dhadhar has its own independent catchment area (outside
50

Mahi Basin) inclusive of its tiny tributary Viswamitri which is extremely polluted by the effluent generated from Vadodara.
7.2 Water Quality Monitoring in Mahi Basin
The State Pollution Control Boards of Gujarat and Rajasthan at 15 locations are doing the water quality monitoring of the river Mahi and several tributaries in the basin. The monitoring locations are on mainstream of river Mahi (9) and tributaries- Anas (1),Panam (1), Jammer(1), Malei(1), Shivna(1) and Chillar(1). The ranges of water quality observed in rivers Mahi, Panam and Anas with respect to pH, Conductivity, DO, BOD, Total Coliform (TC) and Faecal Coliform (FC) are presented as minimum, maximum and mean value to assess the extent of water quality variation throughout the year.
7.2.1 Water Quality of river Mahi and Tributaries Panam and Anas
The water quality of river Mahi with respect to pH, Conductivity, DO, BOD, Total Coliforms and Faecal Coliforms is meeting the desired criteria. Mahi River indicates pH ranges from 7.6-8.89. The Conductivity lies in the range of 234-3720 µmhos/cm. The DO lies in the range of 0.4-10.7 mg/l. The BOD was observed in the range of 0.3-5.7 mg/l with maximum at Mujpur in Gujarat. The Faecal Coliforms range from 0-11 MPN/100ml and the Total Coliforms are in the range of 4-160 MPN/100ml. TC found in the desired range at all the places. The water quality data of river Mahi and its tributaries is presented in Annexure-I Table 7.1.
51
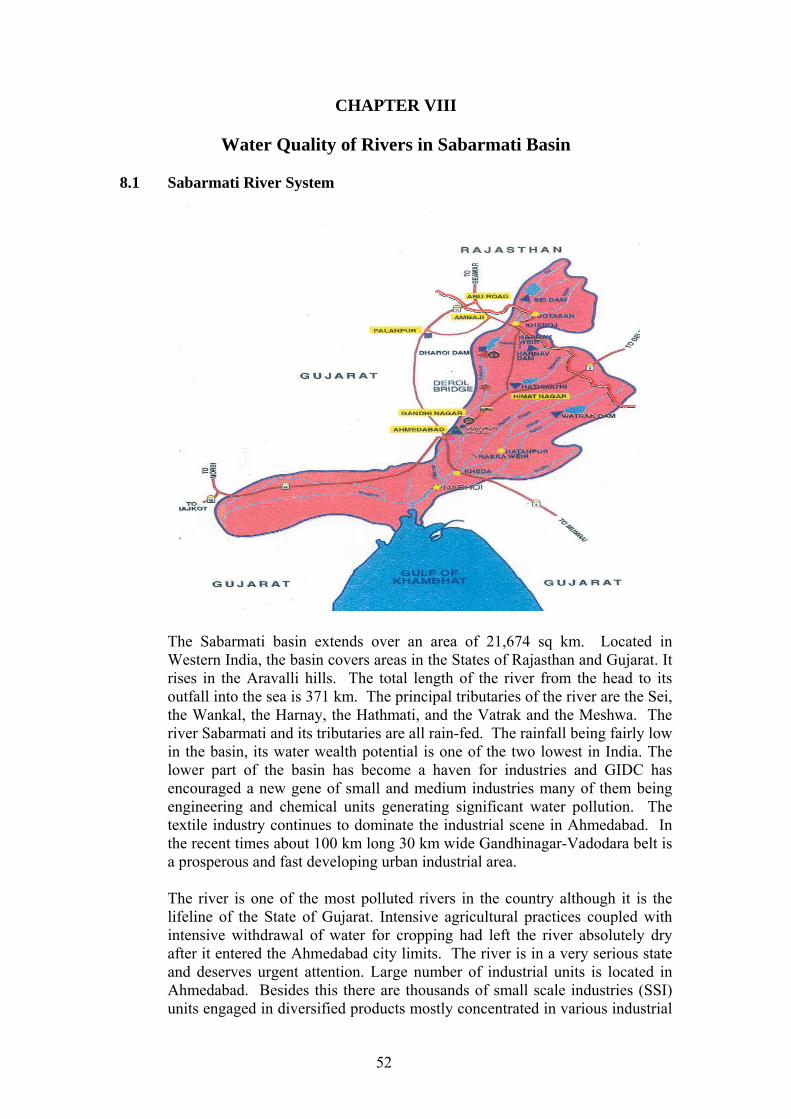
CHAPTER VIII
Water Quality of Rivers in Sabarmati Basin 8.1 Sabarmati River System
The Sabarmati basin extends over an area of 21,674 sq km. Located in Western India, the basin covers areas in the States of Rajasthan and Gujarat. It rises in the Aravalli hills. The total length of the river from the head to its outfall into the sea is 371 km. The principal tributaries of the river are the Sei, the Wankal, the Harnay, the Hathmati, and the Vatrak and the Meshwa. The river Sabarmati and its tributaries are all rain-fed. The rainfall being fairly low in the basin, its water wealth potential is one of the two lowest in India. The lower part of the basin has become a haven for industries and GIDC has encouraged a new gene of small and medium industries many of them being engineering and chemical units generating significant water pollution. The textile industry continues to dominate the industrial scene in Ahmedabad. In the recent times about 100 km long 30 km wide Gandhinagar-Vadodara belt is a prosperous and fast developing urban industrial area.
The river is one of the most polluted rivers in the country although it is the lifeline of the State of Gujarat. Intensive agricultural practices coupled with intensive withdrawal of water for cropping had left the river absolutely dry after it entered the Ahmedabad city limits. The river is in a very serious state and deserves urgent attention. Large number of industrial units is located in Ahmedabad. Besides this there are thousands of small scale industries (SSI) units engaged in diversified products mostly concentrated in various industrial
52

states like Naroda, Odhar, Vatva, Pilas and Chandola etc. All these industries are discharging their waste waters downstream (d/s) of Sabarmati Ashram whereas thermal power plant is discharging upstream (u/s) of Sabarmati Ashram.
The river Sabarmati U/s of Ahmedabad city to Sabarmati Ashram and from Sabarmati Ashram to Vautha have been identified as polluted stretches. The immense urban and industrial growth combined with growing demand of irrigation water has taken their toll as observed by the deteriorating water quality recorded particularly from Ahmedabad city to Vautha. The total length of the stretch from Ahmedabad city to Vautha is of 52 km and in the polluted river stretch; the main contributing outfalls are the Maninagar (mixed effluent) and river Khari (industrial).
The basin area of Sabarmati is covering the States of Rajasthan, Madhya Pradesh and Gujarat. The important urban centres in Gujarat are Gandhi Nagar, Junagadh, Ahmadabad, Surendranagar, Gandhidham, Anand, Dholka, Himatnagar, Kalol, Unjha, Viramgam and Visnagar.
8.2 Water Quality Monitoring in Sabarmati Basin
The water quality monitoring of the river Sabarmati and its tributaries are being done in the basin by the State Pollution Control Boards of Gujarat. The monitoring locations are on mainstream of river Sabarmati and tributaries- Shedi and Khari. The ranges of water quality observed in Sabarmati Basin with respect to pH, Conductivity, DO, BOD, COD, Total Coliform (TC) and Faecal Coliform (FC) are presented as minimum, maximum and mean value to assess the extent of water quality variation throughout the year.
8.2.1 Water Quality of river Sabarmati
The water quality meets the desired water quality criteria with respect to pH at all locations except Dharoi Dam, where pH is observed 4.0. The Dissolved Oxygen ranges from 2.4-6.7 mg/l. The low value of DO is observed at Kheroj Bridge (2.4 mg/l) in Gujarat. The value of conductivity ranges from 292-2920 µmho/cm and exceeds the limit even for irrigation at Village Miroli Taluka (2920 µmho/cm), after confluence with Meshwa at Vautha (2700µmho/cm) and V.N.Bridge (2270 µmho/cm). The BOD is ranges from 12-310 mg/l and its not meeting the criteria at all locations. The high values of BOD were observed at Ahmedabad at V.N.Bridge (310 mg/l), Vill.Miroli Taluka Dascroi (103 mg/l), A/c with Meshwa at Vautha (105 mg/l), Railway Bridge at Ahemdabad (29 mg/l), Hansol Bridge (15 mg/l) and Kheroj Bridge at Ahmedabad (12 mg/l) in Gujarat. The high concentration of BOD is attributed to the discharge of untreated wastewater into the river. The Total Coliform count in the river ranges from 2000–75,000 MPN/100ml whereas the Faecal Coliform count varies from 1500–15,000 MPN/100ml. The highest count of Total Coliform was observed at Kheroj Bridge. The Ammonical-Nitrogen lies in the range of 0.56-31.86 mg/l. The water quality of river Sabarmati is given in Annexure-I Table 8.1. The water quality status of river Sabarmati with respect to BOD is given in figure 8.1.
53

Figure 8.1: Water Quality of River Sabarmati
WATER QUALITY OF RIVER SABARMATI - 2007
15 12
310
29
103 105
71.4
39.07.7
46.6
8.53.712 3 2 22
0
50
100
150
200
250
300
350
Rha
nsao
lB
ridge
, Guj
arat
Khe
roj B
ridge
,G
ujar
at
V.N
. Brid
ge,t
Ahm
edab
ad
Rai
lway
Brid
ge,
Ahm
edab
ad
Vill.
Miro
liTa
luka
Das
croi
,A
hmed
abad
Saba
rmat
iaf
ter c
onf.
with
Mes
hwa
atVa
utha
LOCATION
BO
D m
g/l
MAX
MEAN
MIN
8.2.2 Water Quality of Tributary Streams Shedi and Khari The water quality of tributary streams Shedi and Khari meets the water quality criteria with respect to pH and conductivity. The dissolved oxygen in river Shedi does not meet the criteria and varies from (3.7-8.0 mg/l). BOD varies from 2.0-4.0 in river Shedi and 7.0-19.0 mg/l in river Khari. The Total Coliform and Faecal Coliform count range from 43-7500 and 15-2100 MPN/100ml in river Shedi, whereas the Total Coliforms and Faecal Coliforms count range from 1500–15,000 MPN/100ml and 200-9300 MPN/100 ml respectively in river Khari. The water quality status of river Shedi and Khari is given in Annexure-I Table 8.1.
54

CHAPTER IX
Water Quality of Rivers in Narmada Basin 9.1 Narmada River System
The Narmada basin extends over an area of 98,796 sq km. Lying in the northern extremity of the Deccan plateau, the basin covers large areas in the Madhya Pradesh and Gujarat and a comparatively smaller area in Maharashtra. The Narmada Basin is bounded on the north by the Vindhya, on the east by the Maikala range, on the south by the Satpura and on the west by the Arabian Sea.
Narmada is the largest west-flowing river of the Indian peninsula. Narmada rises from Amarkantak, in the Shahdol district of Madhya Pradesh. The total length of the river from the head to its outfall into the Gulf of Khambhat is 1,312 km. Although entirely rain fed, the Narmada has a fairly heavy discharge because of moderately heavy annual average rainfall in the basin, particularly in the upper catchment area. Urbanisation unlike in other basins has been going on in a slow pace in this basin mainly due to the river passing through hilly terrain that has made it inaccessible in most places. The major urbanisation centres are Jabalpur, Dewas and Khandwa besides Bharuch in Gujarat State.
The industrial development in the Narmada basin is lower as compared to other river basins. The industrialized districts of the Narmada basin are Dhar, Jabalpur and Bharuch consisting of clusters of pharmaceuticals, pesticides,
55

dyes & distilleries, leather & fertilizer units whereas in Jabalpur, Khandwa and Hoshangabad the main industrial activity are the paper mills. In most of the other districts the industries are almost non-existent. The basin area of Narmada is covering the States of Madhya Pradesh, Gujarat and Maharashtra. The important urban centres in these States are Bharuch and Ankleshwar in Gujarat; Murwara (Katni), Jabalpur, Khandwa, Betul Hoshangabad, Itarsi and Khargone in Madhya Pradesh.
9.2 Water Quality Monitoring in Narmada Basin
The State Pollution Control Boards of Madhya Pradesh and Gujarat are doing the water quality monitoring of the river Narmada at 21 locations and its tributary streams Chhota Tawa , Gour, Katni, Kunda at one location each. The ranges of water quality observed in river Narmada and Tributary Chota Tawa with respect to pH, Conductivity, DO, BOD, COD, Total Coliform (TC) and Faecal Coliform (FC) are presented as minimum, maximum and mean value to assess the extent of water quality variation throughout the year.
9.2.1 Water Quality of river Narmada and Tributary Chota Tawa
The water quality of mainstream of Narmada with respect to pH ranges from 7.5-8.8. The conductivity ranges from 244-1629 µmho/cm. The DO varies from 6.2-10.4 mg/l. The BOD ranges from 1.2-3.5 mg/l that indicates about the relatively clean stretch of entire length of the river. The Total Coliform count in the river ranges from 7-1600 MPN/100ml whereas the Faecal Coliform count varies from Nil-15 MPN/100ml indicates relatively low level of pollution from human waste. The water quality of river Narmada is broadly meeting the criteria for beneficial uses.
The Water Quality of the tributary Chota Tawa with respect to DO is observed as 6.8 – 8.0 mg/l, pH as 7.5-7.6, Conductivity as 352-641 µmhos/cm and BOD 1.2-1.4 mg/l. The number of Total Coliforms and Faecal Coliforms are observed as 140-200 MPN/100ml and Nil respectively.
The water quality observations indicate that all the parameters are by and large meeting the water quality criteria at all locations. The ranges of water quality observed in rivers Narmada and its tributary Chota Tawa with respect to pH, Conductivity, DO, BOD, COD, Total Coliform and Faecal Coliform is given in Annexure-I Table 9.1. The water quality status of river Narmada with respect to BOD is presented in figure 9.1.
56

Figure 9.1: Water Quality of River Narmada
WATER QUALITY OF RIVER NARMADA - 2007
2.4
3.5
2.8
1.6
3.0
1.31.5
1.72.0 2.0
1.8 1.8
2.6
1.5
2.7
1.7
1.2
1.7
1.2 1.11.2
1.51.6 1.7
2.2
0.9
2.2
1.10.8 0.7
1.0 0.9 0.8 0.9
1.71.4
1.61.8
1.9
0.0
1.0
2.0
3.0
4.0
LOCATION
BO
D m
g/l
M AX
M EANM IN
57

CHAPTER X
Water Quality of Rivers in Tapi Basin 10.1 Tapi River System
The Tapi basin extends over an area of 65,145 sq km. Situated in the Deccan plateau, the basin covers large areas in the States of Madhya Pradesh, Maharashtra and Gujarat.
The Tapi basin is bounded on the north by the Satpura range, on the east by the Mahadeo hills, on the south by the Ajanta range and Satmala hills and on the west by the Arabian Sea. The total length of the river from the head to its outfall into the sea is 724 km of which 228 km is in Madhya Pradesh. 228 km in Maharashtra, 214 km in Gujarat and the remaining 54 km from the common boundary between Madhya Pradesh and Maharashtra. The Tapi receives several tributaries on both its banks. The Bhokar, the Suki, the Mor, the Harki, the Guli, the Aner, the Arunavati, the Gomai, the Gomati and the Valer join it from the right and the Puma, the Bhogvati, the Vaghur, the Girna, the Bori, the Panjhra, the Amarvati, the Shiva, the Rengavati and the Nesu join from the left. The river basin is moderately rain fed and flows through intensively farmed black cotton-soil area.
The urban population has been observed to be higher in the tail reaches of the river compared to the Upper reaches of the basin, although the proportion of the geographical areas covered to these two reaches are in reverse order. The most populous town in Tapi basin is Surat followed by Amravati and Dhule in Maharashtra.
58

Major part of the upper Tapi basin is predominantly agricultural but in the lower basin area industrialisation has fairly developed in M.P. the industries are centred only in one district-East Nimar (Khandwa) while in Maharashtra Jalgaon is the most industrialised area. Distillery units contribute the largest share in Maharashtra where as textile occupies the predominant activity in Gujarat followed by food & beverages and chemical industries. The Tapi receives several tributaries on both its banks. The Bhokar, the Suki, the Mor, the Harki, the Guli, the Aner, the Arunavati, the Gomai, the Gomati and the Valer join it from the right and the Puma, the Bhogvati, the Vaghur, the Girna, the Bori, the Panjhra, the Amarvati, the Shiva, the Rengavati and the Nesu join from the left. The river basin is moderately rain fed and flows through intensively farmed black cotton-soil area.
The basin area of Tapi is covering the States of Madhya Pradesh, Gujarat and Maharashtra. The important urban centres in these States are Burhanpur and Sarni in Madhya Pradesh; Akola, Malegaon, Bhusawal, Jalgon, Amaravati, Dhule, AchalpurAkot Khamgaon Malkapur in Maharashtra; and Surat in Gujarat.
10.2 Water Quality Monitoring in Tapi Basin
The water quality monitoring of the river Tapi and tributary stream Girna and Rangavali is being done in the basin by the State Pollution Control Boards of Gujarat, Madhya Pradesh and Maharashtra. The ranges of water quality observed in river Tapi and its tributary stream Girna with respect to pH, Conductivity, DO, BOD, COD, Total Coliform and Faecal Coliform are presented as minimum, maximum and mean value to assess the extent of water quality variation throughout the year.
10.2.1 Water Quality of river Tapi, Tributary Girna and Rangavali
The water quality of mainstream of Tapi with respect to pH ranges from 7.3-8.5. The conductivity varies from 210-587 µmhos/cm. The DO ranges from 3.7-8.7 mg/l. The lowest value of DO (3.7 mg/l) is observed at Ajnand Village in Maharashtra. The BOD varies from 1.1-25 mg/l and the values higher than the desired criteria are observed at Ajnand Village (25.0 mg/l), Uphad village (22.0 mg/l), Bhusawal U/s (18.0 mg/l) in Mharashtra; at Ukai, Sherula Bridge (3.7 mg/l) and Kathore, (Nh-8 Bridge) (3.2 mg/l) in Gujarat. The Total Coliform count in the river ranges from Nil-46,000 MPN/100ml whereas the Faecal Coliform count varies from Nil–15,000 MPN/100ml. The water quality of tributary stream Girna with respect to pH, Conductivity, DO and Total Coliform is meeting the desired criteria. The BOD is in the range of 2.0-16 mg/l, which indicate that the river is considerably polluted at Malegaon (Manmad) (23 mg/l), Jalgaon (16.0 mg/l) and at Jalgaon (10mg/l) with respect to BOD. River Rangavali downstream of Navapur is also meeting the desired criteria in respect of pH, Conductivity, DO, Total Coliform and Faecal Coliform. In River Rangavali The value of BOD is 9.0 mg/l which is not meeting the water quality criteria.
59

The ranges of water quality observed in rivers Tapi and its tributary stream Girna and Rangavali with respect to pH, Conductivity, DO, BOD, COD, Total Coliform and Faecal Coliform is given in Annexure-I Table 10.1.
60

CHAPTER XI
Water Quality of Rivers in Mahanadi Basin 11.1 Mahanadi River System
The Mahanadi basin extends over an area of 141 thousands sq km. lying in the north east of the Deccan plateau, the basin covers large areas in the States of Chattisgarh and Orissa, and only small areas in Bihar and Maharashtra. The upper basin is a saucer-shaped depression known as the Chhatisgarh. The Mahanadi rises in a pool, 6 km from Pharsiya village near Nagri town in Raipur district of Chattisgarh, and falls into the Bay of Bengal, near False point about 16 km below the confluence of the Chitarala and the Mahanadi.The total length of the river from the head to its outfall into the sea is 851 km of which 357 km are in Chattisgarh and the balance of 494 km are in Orissa. The Seonath, the Jonk, the Hasdeo, the Mand, the Ib, the Ong and the Tel are the principal tributaries of the Mahanadi river.
The water quality study reveals that the water of Mahanadi is comparatively less polluted compared to the other similar rivers in the country. However, certain stretches like the downstream portion of river Ib at Brajrajnagar, downstream of Sambalpur and Cuttack have comparatively higher degree of
61

pollution. The pollution of Ib river is easily attributable to the discharges from a large paper industry situated in Brajrajnagar. In the majority of the other locations the BOD and the total coliform are the two parameters that are mainly responsible for lowering the water quality. While at places like Tikarapara this could be due to run-off from the areas adjoining the riverbanks that are generally used by the village people for defection. At the urban centres, the high BOD and coliform levels are obviously due to the discharges into the river from domestic sources either directly or indirectly. None of the towns small or large, on the banks of Mahanadi have any regular sewerage system or sewage treatment plants and the domestic wastes find their way mostly through small nullah or storm water drains which join the downstream of the Ib river at Brajrajnagar causing serious depletion of oxygen level along the whole stretch which cause serious threat to the aquatic lives.
Korba has been identified as a critically polluted area in this river basin. The industrial as well as domestic wastewaters are being discharged into the River Hasdeo directly as well as through river Ahiran and Dengur Nala. The major source of pollution in the river is due to Thermal Power Plants, Bharat Aluminium Company, Captive power plant of BALCO, IBP (explosive unit) and coal mining operations. The action plan formulated suggests that the capacity of ash ponds of thermal ponds of BALCO have to be augmented.
The river has often been referred to as the ‘Sorrow of Orissa’. The inhabited inner basin Chattisgarh plain suffered frequent droughts whereas the fertile deltaic area has been wrecked by repeated floods.
The basin area of the Mahanadi has a large number of industrial complexes in the Orissa portion of the basin the major industries are paper. textiles and thermal power plants at Choudwar, fertiliser and breweries at Paradeep, Sugar industries of Nayagarh, Badamba, Cement industry at Bargarh, paper industry of Brajrajnagar, coal mining areas of Rampur and lb valley, and an aluminium smelter at Hirakud.
Most of these industries are located on the banks of the river Mahanadi or its tributaries and distributaries, which are used to carry the industrial effluents and wastewater from these industries. From the point of view of significant environmental impacts, the important medium scale industries are the chemical, textile, paper, cement, and leather tanning which consume large quantities of water.
Iron and steel industry at Bhilai, cement industries at Durg and Raipur, textile industry of Rajnandagaon, aluminium and thermal power plants at Korba are the major polluting industries in the State of M.P that falls in the river basin. All these major units are located on the riverbanks of Seonath, Kharoon and Hasdeo. The medium scale industries include chemical and distilleries of Durg, cement industries of Raipur, Iron and steel of Urla, paper industries of Bilaspur and many other agro based industries.
All the industries are discharging their wastewater either directly or indirectly to river Mahanadi as well as its tributaries. The vast mineral and human
62

resources of the basin besides power generation infrastructure has resulted in a growth of a large variety of industries. The industries using the river bodies as the ultimate sink need to establish effluent treatment plants so that the designated best use of the river is sustained.
The basin area of Mahanadi is covering the States of Chhattisgarh, Madhya Pradesh, Orissa and Jharkhand. The important urban centres in these States are Rajnandgaon, Korba, Bilaspur, Durg, Raipur, Dhamtari, Raigarh, Rajharajharandalli in Madhya Pradesh & Chhattisgarh. And Cuttack, Puri, Sambalpur, Jatani, Balangir, Bargarh, Bhawanipatna, Brajarajnagar and Jharsuguda in Orissa.
11.2 Water Quality Monitoring in Mahanadi Basin
The State Pollution Control Boards of Chhatissgarh and Orissa at 38 locations are doing the water quality monitoring of the river Mahanadi and its several tributaries in the basin. The ranges of water quality observed in rivers Mahanadi and Tributary streams Seonath, Kharoon, Hasdeo, Ib, Kuakhai, Kathajodi Birupa, Arpa and Kelo with respect to pH, Conductivity, DO, BOD, COD, Total Coliform and Faecal Coliform are presented as minimum, maximum and mean value to assess the extent of water quality variation throughout the year.
11.2.1 Water Quality of River Mahanadi
The water quality status observed in rivers Mahanadi with respect to pH, Conductivity, DO, BOD, COD Faecal Coliform count and Total Coliform count is given in Annexure-I Table 11.1.
The water quality of mainstream of Mahanadi with respect to pH ranges from 7.3–8.7. The value of conductivity ranges from 102 µmhos/cm at Cuttack upstream in Orissa to 813 µmhos/cm at Paradeep downstream in Orissa. The DO value varies from 6.2 -8.9 mg/l. The BOD ranges from 1.2 – 3.6 mg/l and the higher value were observed at Sambalpur D/s (3.6 mg/l) in Orissa, U/s of Rajim (3.2 mg/l) in Chattisgarh, Cuttack D/s (3.1 mg/l) in Orissa and Inter state boundary (3.1 mg/l) in Chattisgarh. The highest value of Faecal Coliform count (17,000 MPN/100 ml) is observed at Cuttack downstream and at Sambalpur downstream (13,000 MPN/100 ml); whereas the maximum Total Coliform count (35,000 MPN/100 ml) is observed at Cuttack downstream & Sambalpur downstream. The concentration of Nitrate (NO3
-) ranges from 0.11-1.89 mg/l, while the highest concentration of nitrate is recorded at Sheorinarayan village, Chattisgarh. The water quality status observed in river Mahanadi with respect to pH, Conductivity, DO, BOD, COD, Faecal Coliform count and Total Coliform count is given in Annexure-I Table 11.1.The water quality status of river Mahanandi with respect to BOD is given in figure 11.1.
63
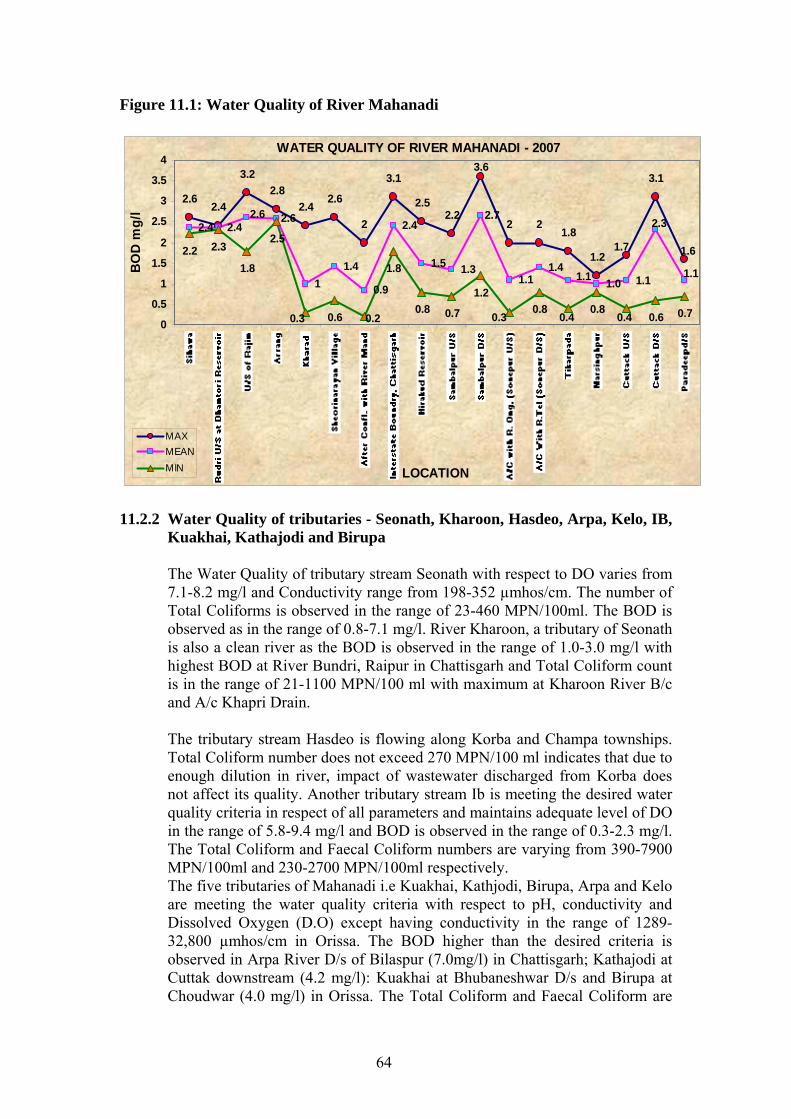
Figure 11.1: Water Quality of River Mahanadi
WATER QUALITY OF RIVER MAHANADI - 2007
2.62.4
3.22.8
2.42.6
2
3.1
2.52.2
2 21.8
1.2
3.1
2.4 2.4
11.4
0.9
2.4
1.5 1.31.1
1.41.0 1.1
2.2 2.3
1.8
2.5
0.6
1.8
0.8 0.7
1.20.8 0.8
0.6 0.7
3.6
1.7 1.6
2.6 2.6 2.3
1.11.1
2.7
0.40.40.30.3 0.20
0.5
1
1.5
2
2.5
3
3.5
4
LOCATION
BO
D m
g/l
MAXMEANMIN
11.2.2 Water Quality of tributaries - Seonath, Kharoon, Hasdeo, Arpa, Kelo, IB,
Kuakhai, Kathajodi and Birupa
The Water Quality of tributary stream Seonath with respect to DO varies from 7.1-8.2 mg/l and Conductivity range from 198-352 µmhos/cm. The number of Total Coliforms is observed in the range of 23-460 MPN/100ml. The BOD is observed as in the range of 0.8-7.1 mg/l. River Kharoon, a tributary of Seonath is also a clean river as the BOD is observed in the range of 1.0-3.0 mg/l with highest BOD at River Bundri, Raipur in Chattisgarh and Total Coliform count is in the range of 21-1100 MPN/100 ml with maximum at Kharoon River B/c and A/c Khapri Drain.
The tributary stream Hasdeo is flowing along Korba and Champa townships. Total Coliform number does not exceed 270 MPN/100 ml indicates that due to enough dilution in river, impact of wastewater discharged from Korba does not affect its quality. Another tributary stream Ib is meeting the desired water quality criteria in respect of all parameters and maintains adequate level of DO in the range of 5.8-9.4 mg/l and BOD is observed in the range of 0.3-2.3 mg/l. The Total Coliform and Faecal Coliform numbers are varying from 390-7900 MPN/100ml and 230-2700 MPN/100ml respectively. The five tributaries of Mahanadi i.e Kuakhai, Kathjodi, Birupa, Arpa and Kelo are meeting the water quality criteria with respect to pH, conductivity and Dissolved Oxygen (D.O) except having conductivity in the range of 1289-32,800 µmhos/cm in Orissa. The BOD higher than the desired criteria is observed in Arpa River D/s of Bilaspur (7.0mg/l) in Chattisgarh; Kathajodi at Cuttak downstream (4.2 mg/l): Kuakhai at Bhubaneshwar D/s and Birupa at Choudwar (4.0 mg/l) in Orissa. The Total Coliform and Faecal Coliform are
64
varying from 8-1, 60,000 MPN/100ml and 8-92,000 MPN/100ml respectively in these tributaries. The highest value of Total Coliform and Faecal Coliform is observed at Kathajodi at Cuttak downstream in Orissa. The water quality status observed in rivers Seonath, Kharoon, Hasdeo, IB, Kuakhai, Kathajodi, Arpa, Kelo and Birupa with respect to pH, Conductivity, DO, BOD, COD, Faecal coliform count and Total Coliform count is given in Annexure-I Table 11.2.
65
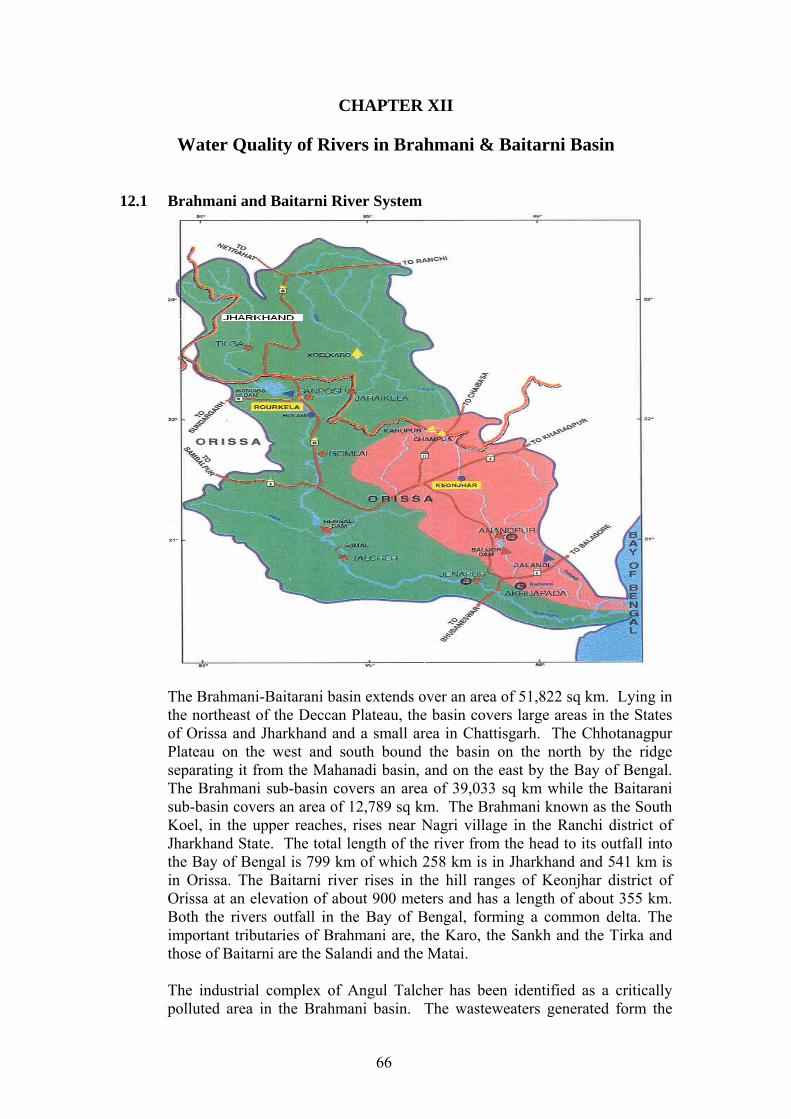
CHAPTER XII
Water Quality of Rivers in Brahmani & Baitarni Basin 12.1 Brahmani and Baitarni River System
The Brahmani-Baitarani basin extends over an area of 51,822 sq km. Lying in the northeast of the Deccan Plateau, the basin covers large areas in the States of Orissa and Jharkhand and a small area in Chattisgarh. The Chhotanagpur Plateau on the west and south bound the basin on the north by the ridge separating it from the Mahanadi basin, and on the east by the Bay of Bengal. The Brahmani sub-basin covers an area of 39,033 sq km while the Baitarani sub-basin covers an area of 12,789 sq km. The Brahmani known as the South Koel, in the upper reaches, rises near Nagri village in the Ranchi district of Jharkhand State. The total length of the river from the head to its outfall into the Bay of Bengal is 799 km of which 258 km is in Jharkhand and 541 km is in Orissa. The Baitarni river rises in the hill ranges of Keonjhar district of Orissa at an elevation of about 900 meters and has a length of about 355 km. Both the rivers outfall in the Bay of Bengal, forming a common delta. The important tributaries of Brahmani are, the Karo, the Sankh and the Tirka and those of Baitarni are the Salandi and the Matai. The industrial complex of Angul Talcher has been identified as a critically polluted area in the Brahmani basin. The wasteweaters generated form the
66
industries Viz, NALCO, TTPS etc. and mining operations are primarily responsible for deterioration of water quality of Nandira River which is a tributary stream of Brahmani river. Detailed survey of this stretch has been carried out and the action plans have been formulated to improve the water quality of this stretch. The basin area of Brahmani and Baitarni is covering the States of Jharkhand, and Orissa.The important urban centres in these States are Rourkela in Orissa; and Gumia in Jharkhand
12.2 Water Quality Monitoring in Brahmani and Baitarni Basin
The water quality monitoring of the river Brahmani, the State Pollution Control Boards of Jharkhand and Orissa at 20 locations are doing Baitarni and tributaries in the basin. There are eleven (11) monitoring locations on the main stream of river Brahmani, five on tributary Baitarni, one on tributaries Karo & Sankh and two on tributary Koel. The ranges of water quality observed in rivers Brahmani and its tributaries; with respect to pH, Conductivity, DO, BOD, COD, Total Coliform and Faecal Coliform are presented as minimum, maximum and mean value to assess the extent of water quality variation throughout the year.
12.3 Water Quality of River Brahmani
The water quality of mainstream of Brahmani with respect to pH, DO and conductivity are meeting the desired criteria. The BOD varies from 0.3 to 4.9 mg/l. The higher values of BOD are observed at Koel at Basia Dam U/s (4.9 mg/l) in Jharkhand and Brahmani at D/s Panposh (4.8 mg/l) in Orissa. The Fecal Coliform (FC) counts ranges from 110-22,000 MPN/100ml whereas the Total Coliform (TC) count ranges from 210-54,000 MPN/100ml. The water quality of mainstream of Brahmani during the period is given in Annexure-I Table 12.1
12.4 Water Quality of River Baitarni The water quality of river Baitarni observed at 5 locations is meeting the water quality criteria for pH, DO, conductivity, BOD, TC and FC however, the high values of conductivity are observed at Dhamra (19,450 µmhos/cm) due to estuarine region of the river. BOD values are observed in the range of 0.4-2.2 mg/l. The Faecal Coliform (FC) counts ranges from 170 to 2200 MPN/100ml whereas the Total Coliform (TC) count ranges from 330 to 5400 MPN/100ml. Nitrate (NO3
-) values ranges from 0.11-2.11 mg/l. The water quality of river Baitarni is given in Annexure-I Table 12.2.
67

CHAPTER XIII
Water Quality of Rivers in Subarnarekha Basin 13.1 Subarnarekha River System
The Subarnarekha rises near Nagri village in the Ranchi district. Of its total length 269 km are in Jharkhand and 64 km in West Bengal and 62 in Orissa. The river drains a total area of 19,296 sq km. The Subarnarekha is the smallest of the basins and is falling short only marginally to be called a ‘major basin’. It has virtually no significant tributary; the tiny Kharkai has gained a name only because of its support to the Jamshedpur steel city. The river Subarnarekha passes through an important industrial belt of Jharkhand.
The river is basically a rainfed peninsular river with the wet months being June to September. The river in its upper and middle reaches remains more or less as a stagnant pool, often highly charged with pollutants, particularly during dry periods. The largest concentration of population is located in the Singbhum and Ranchi districts of Jharkhand. The river and its tributaries are the main sources of urban water supply with the ground water resources still under utilized. Nearly 60 percent of the water supplies eventually find their way to surface water systems. Some of the important towns are also significant industrial centres. None of the towns except partly for Jamshedpur and Tatanagar railway colony have wastewater treatment facility worth mentioning.
The Subarnarekha being a mineral rich area, it is natural that mining activity would always be an important element in the pollution control programme. The possibility of contamination of surface and ground water derived from the ore dumps and radioactive waste materials in the uranium mines at Jaduguda is very great
The basin area of Subarnerekha is covering the States of Jharkhand and Orissa. The important urban centres in these states are Jamshedpur, Chaibasa and Ranchi in Jharkhand; and Bhadrak in Orissa.
13.2 Water Quality Monitoring in Subarnarekha Basin The water quality monitoring of the river Subarnarekha are being done in the basin by the State Pollution Control Boards of Jharkhand and Orissa at 6 locations. The monitoring locations are on mainstream of river Subarnerekha. The ranges of water quality observed in river Subarnarekha with respect to pH, Conductivity, DO, BOD, COD, Total Coliform (TC) and Faecal Coliform (FC) are presented as minimum, maximum and mean value to assess the extent of water quality variation throughout the year.
68
13.3 Water Quality of River Subarnarekha
The water quality of Subarnarekha River with respect to pH, DO, Total Coliform and Conductivity during the year indicates that it is meeting the desired water quality criteria at all the locations. DO is observed in the range of 4.6-8.7 mg/l. The higher value of BOD is observed at Ranchi Tatisilwai (8.0 mg/l) in Jharkhand. The water quality of the river Subarnarekha during the period is given in Annexure-I Table 13.1
69

CHAPTER XIV
Water Quality of Rivers in Godavari Basin
14.1 Godavari River System
The Godavari basin extends over an area of 3, 12,812 sq km which is nearly 10 percent of the total geographical area of the country. The basin lies in the Deccan plateau, and covers large areas in the States of Andhra Pradesh, Madhya Pradesh, Chattisgarh and Maharashtra, in addition to smaller areas in Karnataka and Orissa. The Satmala Hills, the Ajanta Range and the Mahadeo Hills, on the south and east by the Eastern Ghats and on the west by the Western Ghats, bound the Godavari basin on the north. The Godavari is the largest river of the Peninsular India, inspite of its massive catchment area; the discharge is not very impressive because of moderate annual average rainfall in the basin. Its four important tributaries are the Manjira, the Pranhita, the Indravati and the Sabari. The wastewater generation from domestic (both rural and urban) and the industrial sector are the main sources of pollution in the river basin.
70

Amongst the five states Orissa State is least industrialized followed by Chhitisgarh and Karnataka, with Maharashtra having the high urban industrial pockets. Most of the industrial activities are centred mainly at Aurangabad & Nasik in Maharashtra, East & West Godavari Distt. in Andhra Pradesh. Sugar and distillery units are large in number in Maharashtra followed by pharmaceuticals, leather, pulp and paper and pesticide units.In Andhra Pradesh sugar and distillery units are large in number followed by Pulp & Paper and fertilizer industries. The above-mentioned industries are massive water consuming by nature and the deterioration in water quality in the river cannot be ruled out particularly from Nashik to Nanded in Maharashtra and at Baster,
Chattisgarh and Burganpad in Andhra Pradesh.
and Tanuku in Andhra Pradesh; Bidar in Karnataka; and Jeypur in Orissa
14.2 ater Quality Monitoring in Godavari Basin
value to assess the extent of water quality variation throughout the year.
14.2.1 Water Quality of River Godavari
in The important urban centers in this basin are Nagpur, Ambejogai, Ballarpur, Bhandara, Buldhana, Chalisgaon, Hinganghat, Hingoli, Manmad Nandurbar Osmandabad Parli Pusad Shrirampur Udgir Latur Kamptee Ahmadnagar Parbhani Aurangabad Wardha Bid Nashik Chandrapur Jalna Nanded Yavatmal, Amalner and Gondiya in Maharashtra; Jagdalpur in Chhatisgarh, Chiklikalan Parasia ,Chindwara Seoni Balaghat in Madhya Pradesh, Rajahmundry Nizamabad Ramagundam Eluru Warangal Khammam Kothagudem Karimnagar Bhimavaram Kakinada Adilabad , Bellampalle Bodhan Jagtial Kagaznagar Mancherial Mandamarri Narsapur Nirmal Palacole Palwancha Sangareddy Siddipet Siricilla Tadepalligudem
W The water quality monitoring of the river Godavari are being done in the basin by the State Pollution Control Boards of Maharashtra, Andhra Pradesh, Madhya Pradesh and Orissa at 48 locations. The monitoring locations are on main stream of river Godavari (22) and tributaries Manjeera(3), Maner(2), Nira(1), Wainganga(8), Kolar(1), Kanhan(3), Purna(2), Indravati(2), Shankhni(1) and Wardha (3). The ranges of water quality observed in Godavari basin with respect to pH, Conductivity, DO, BOD, COD, Total Coliform (TC) and Faecal Coliform (FC) are presented as minimum, maximum and mean
The river Godavari from downstream of Nashik to Nanded and Nanded city limits in Maharashtra and upstream of Bhadrachalam at Mancheral and Ramgundam in A.P. have been identified as the polluted river stretches. The major sources of pollution in the polluted stretches are from domestic and industrial wastewater generated from the Nashik and Nanded cities in Maharashtra and Mancherial, Ramgundam and Bhadrachalam cities in Andhra Pradesh. Depletion of dissolved oxygen has been reported due to addition of high organic load into the river besides bacteriological pollution has also been reported. To maintain the desired water quality uses of the Godavari River in these stretches, the municipalities need to treat their wastewater and the
71
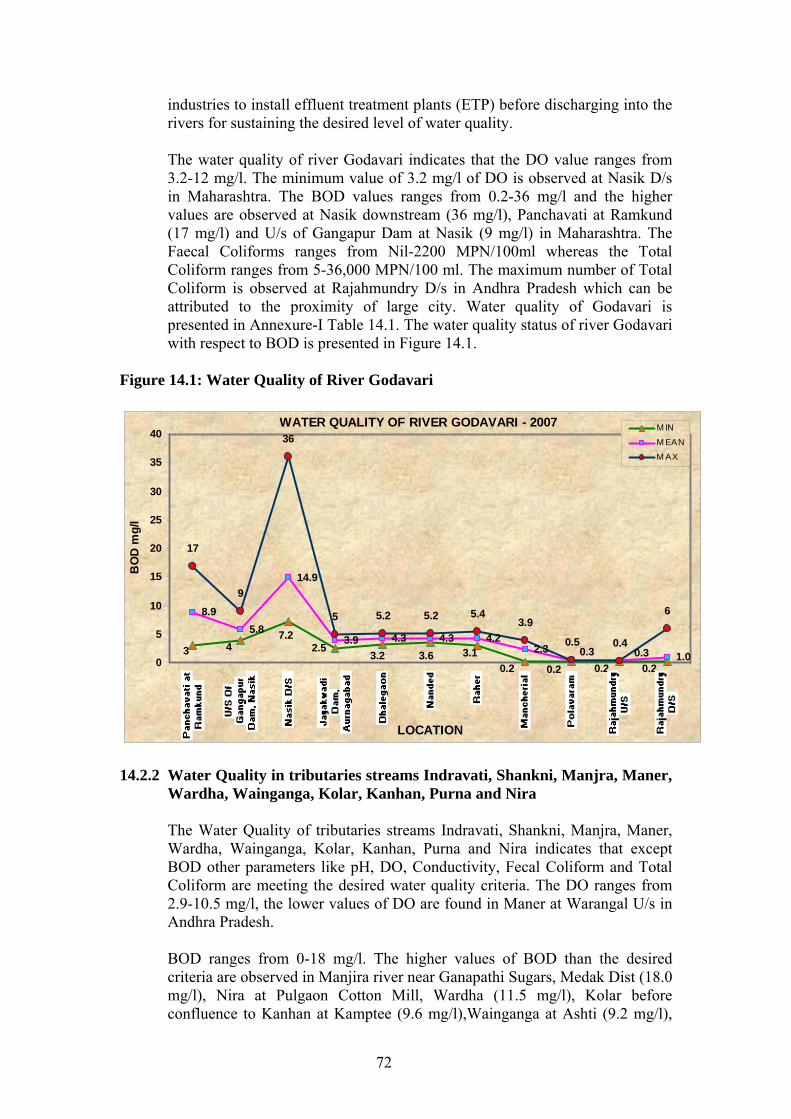
industries to install effluent treatment plants (ETP) before discharging into the
ter quality of Godavari is resented in Annexure-I Table 14.1. The water quality status of river Godavari
14.1.
Figure 14.1: Water Quality of River Godavari
rivers for sustaining the desired level of water quality. The water quality of river Godavari indicates that the DO value ranges from 3.2-12 mg/l. The minimum value of 3.2 mg/l of DO is observed at Nasik D/s in Maharashtra. The BOD values ranges from 0.2-36 mg/l and the higher values are observed at Nasik downstream (36 mg/l), Panchavati at Ramkund (17 mg/l) and U/s of Gangapur Dam at Nasik (9 mg/l) in Maharashtra. The Faecal Coliforms ranges from Nil-2200 MPN/100ml whereas the Total Coliform ranges from 5-36,000 MPN/100 ml. The maximum number of Total Coliform is observed at Rajahmundry D/s in Andhra Pradesh which can be attributed to the proximity of large city. Wapwith respect to BOD is presented in Figure
WATER QUALITY OF RIVER GODAVARI - 2007
2.5
8.95.8
14.9
3.9 4.3 4.3 4.22.3
1.0
17
9
36
5 5.2 5.2 5.43.9
0.5 0.4
6
3.13.63.2
7.243
0.20.20.2 0.20.30.3
0
5
10
15
20
25
30
35
40 M IN
M EANM AX
BO
D m
g/l
LOCATION
4.2.2 Water Quality in tributaries streams Indravati, Shankni, Manjra, Maner,
ting the desired water quality criteria. The DO ranges from .9-10.5 mg/l, the lower values of DO are found in Maner at Warangal U/s in
1
Wardha, Wainganga, Kolar, Kanhan, Purna and Nira
The Water Quality of tributaries streams Indravati, Shankni, Manjra, Maner, Wardha, Wainganga, Kolar, Kanhan, Purna and Nira indicates that except BOD other parameters like pH, DO, Conductivity, Fecal Coliform and Total Coliform are mee2Andhra Pradesh. BOD ranges from 0-18 mg/l. The higher values of BOD than the desired criteria are observed in Manjira river near Ganapathi Sugars, Medak Dist (18.0 mg/l), Nira at Pulgaon Cotton Mill, Wardha (11.5 mg/l), Kolar before confluence to Kanhan at Kamptee (9.6 mg/l),Wainganga at Ashti (9.2 mg/l),
72

Kanhan D/s of Nagpur (9.0 mg/l), Wainganga after confluence with Kanhan
ty atus of tributaries streams Indravati, Shankni, Manjra, Maner, Wardha,
Wainganga, Kolar, Kanhan, Purna, Nira is given in Annexure-I Table 14.2.
(8.5 mg/l), River Wardha at Rajura Bridge and Purna at Dupeshwar (6.9 mg/l). The Total Coliform number ranges from 7-2500 MPN/100ml, whereas the Faecal Coliform is observed from Nil-900 MPN/100ml. The water qualist
73

CHAPTER XV
Water Quality of Rivers in Krishna Basin 15.1 Krishna River System
The Krishna basin extends over an area of 2, 58,948 sq km which is nearly 8% of the total geographical area of the country. Lying in the Deccan plateau, it covers large areas in the States of Maharashtra, Karnataka and Andhra Pradesh. All the major tributaries draining the base of the triangle fall into the river in the upper two-thirds of its length. The Krishna rises in the Western Ghats at an altitude of 1,337 meter just north of Mahabaleshwar, about 64 km from the Arabian Sea and flows from west to east through the States of Maharashtra, Karnataka and Andhra Pradesh to join the Bay of Bengal. The total length of the river from the source to its outfall into the sea is about 1,400 km. Together with its tributaries, the river drains about 708 km of the Western Ghats which is its chief source of supply. The Krishna is the third longest river within India, yet it has a rather poor water wealth because of fairly low rainfall in the basin. The river has two large tributaries - the Bhima and the Tungabhadra and four smaller tributaries - the Ghataprabha, the Malprabha the Musi and the Muneru. The river basin survey report communicates that the most populous cities in the basin are Hyderabad Aggomeration in A.P. Pune
74

aggomeration in Maharashtra and Bhadravati complex in Karnataka. Bhadravati in Karnataka and Patancheru- Bolaram in Andhra Pradesh are the critically polluted areas identified in the basin area of Krishna. For Bhadravati the major source of water pollution is the wastewater generated from industries besides the untreated sewage of the town, which is being discharged into Bhadra. It is suggested that sewage treatment plant may be provided for the sewage of the town and ETPs of the existing industries need modifications to comply with prescribed standards for restoration of water quality of the Bhadra river.In the Patancheru - Bolaram area in Andhra Pradesh the effluent generated by industries is the main sources of water pollution in the rivers Manpera and Nakkvagu. Industries are polluting ground water in the region. The basin area of Krishna is covering the States of Maharashtra, Andhra Pradesh, and Karnataka. The important urban centres in Andhra Pradesh are Guntakal, Guntur, Hyderabad, Kurnool, Gudivada, Tenali, Machilipatnam, Vijayawada, Adoni, Mahaboob-Nagar, Bapatla, Chilakaluripet, Gudur, Kavali, Miryalguda, Nalgonda, Suryapet, Yemmiganur, Chikmagalur, Gangawati, Gokak, Harihar, Nipani, Rabkavi-Banhatti, Ranibennur, Shahabad; in Karnataka are Gadag-betagiri, Raichur, Hubli-Dharwad, Shimoga, Bijapur, Bellary, Gulbarga, Bhadravati, Hosepet, Davangere, Belgaum, Chitradurga, Bagalkot; and in Maharashtra are Karad, Pandharpur, Panvel, Satara, Kolhapur, Solapur, Pune, Ichalkaranji, Sangli and Barshi.
15.2 Water Quality Monitoring in Krishna Basin
The water quality monitoring of the river Krishna are being done in the basin by the State Pollution Control Boards of Maharashtra, Karnataka and Andhra Pradesh at 68 locations. The monitoring locations are on mainstream of river Krishna (22) and tributaries Bhadra (3), Bhima (10), Ghataprabha (2), Malprabha (3), Muneru (1), Musi (2), Nira (2), Paleru (1), Tunga (1), Tungabhadra (6), Panchganga (4), Kagina(1), Chandrabhaga (2) and Koyna(1), Mula(2), Mutha(1), Mula-Mutha(1), Venna(1), Pawana(1), Indrayani(1). The ranges of water quality observed in river Krishna and it’s tributaries with respect to pH, Conductivity, DO, BOD, COD, Total Coliform (TC) and Faecal Coliform (FC) are presented as minimum, maximum and mean value to assess the extent of water quality variation throughout the year.
15.2.1 Water Quality of River Krishna The water quality of river Krishna indicates that pH, Conductivity and DO are largely meeting the water quality criteria at all the locations however DO does not meet the desired limits at upstream of Ugarkhurd Barrage (3.0 mg/l) in Karnataka, at Sangli (3.2 mg/l) in Maharashtra, at Kurundwad in Kolhapur (3.8 mg/l) in Maharashtra and at Vedadri, Guntur (3.8mg/l) in A.P. and conductivity does not meet the desired limits at Hamsala Deevi, Guntur Dist. (23,400 μmhos/cm) and at Sangli (3166 µmhos/cm). The BOD ranges from 0.1 to 9.8 mg/l. The maximum value of BOD (9.8mg/l) is observed at Krishna Bridge, Karad in Maharashtra and U/s of Ugarkhurd Barrage in Karnataka. Other locations having high BOD are at Mahabaleshwar Dhom dam near
75

Koina dam (8.2 mg/l), Rajapur Weir (4.4 mg/l), at Kurunwad in Kolhapur (5.0 mg/l), at Sangli (4.8 mg/l) in Maharashtra and at Hamsala Devi, Guntur (4.4 mg/l), in Andhra Pradesh. The Faecal Coliform ranges from 0–1600 MPN/100ml whereas the Total Coliforms ranges from 0–71,600 MPN/100ml. The maximum count of TC is observed in river Krishna at Sangameshwaram, A/c with Tungabhadra in A.P. The water quality status of river Krishna is given in Annexure-I Table 15.1. The water quality status of mainstream Krishna with respect to BOD is given in Figure 15.1.
Figure 15.1: Water Quality of River Krishna
WATER QUALITY OF RIVER KRISHNA - 2007
8.2
4.4
9.8
4.24.8 5.0
9.8
2.1 1.6 2.0
3.42.6 2.3
3.8
2.1
4.4
1.8 1.8 1.8
5.4
2.9
6.8
2.42.9 2.9
1.71.0 1.2 1.3 1.8 1.7 1.4
2.61.9 1.5 1.5 1.31.6 1.2 1.4 1.4
0.51.2 0.9 1.21.0
3.4
0.11.00.1 0.1 0.5 1.0 0.81.00.6
3.2
0.0
2.0
4.0
6.0
8.0
10.0
12.0
LOCATION
BOD
mg/
l
M AX
M EAN
M IN
15.2.2 Water quality of tributary streams Panchganga and Bhima
The water quality of tributary streams Panchganga and Bhima indicates that pH ranges from 6.3-8.8. The conductivity ranges from 73 to 4515 μmhos/cm. The higher values of conductivity are observed in River Bhima at Narsinghpur D/s after confluence with River Nira (4515 μmhos/cm) in Maharashtra. DO vary from 1.7 to 7.6 mg/l. The minimum value of DO is observed in river Bhima (1.7 mg/l) downstream of Bundgarden at Pune in Maharashtra. The BOD value ranges from 1.0 to 28.6 mg/l. The maximum value of BOD (28.6 mg/l) is observed in river Bhima downstream of Bundgarden at Pune. The other locations Bhima at Pargaon after confluence with Mula- Martha ( 16.8 mg/l), Bhima at Pune U/s Vithalwadi (16.4 mg/l), Bhima at Narsinghpur D/S after confluence with river Nira (10.4 mg/l), Bhima at Takli (10.4 mg/l), Bhima after confluence with daunt (8.8 mg/l), Panchganga D/s of Kolhapur town (6.4 mg/l), Panchganga at Ichalkaranji ( 3.6 mg/l) in Maharashtra; and river Bhima at D/s of Road Bridge at Gangapur village (3.4 mg/l) in Karnataka, are potentially polluted locations having higher BOD levels. The Faecal Coliforms range from 0–1600 MPN/100ml whereas the Total Coliform number ranges from 10-1700 MPN/100ml. The maximum number of Total
76

Coliform (1700 MPN/100ml) and Faecal Coliform (1600 MPN/100ml) is observed at Bhima at d/s of Bridge near Yadgir in Karnataka. The water quality of tributaries streams Panchganga and Bhima during the year is given in Annexure-I Table.15.2.
15.2.3 Water quality of tributary streams Chandrabhaga, Kagina, Ghatprabha, Malprabha, Nira, Tungbhadra, Tunga, Bhadra, Musi, Palleru, and Muneru
The water quality of tributary streams Chandrabhaga, Kagina, Ghatprabha, Malprabha, Tungbhadra, Tunga, Bhadra, Musi, Palleru, and Muneru indicates that pH ranges from 6.2- 9.7. The conductivity ranges from 48 to 1586 μmhos/cm. The higher values of conductivity are observed in river Tunghabhadra at Kurnool U/s, Bavapuram (1586 μmhos/cm) in Andhra Pradesh. DO vary from 4.0- 10.0 mg/l. The minimum value of DO is observed in river Palleru (4.0 mg/l) before confluence with Krishna, Jaggayyapet in Andhra Pradesh. The BOD value ranges from 0.2 to 51 mg/l. The maximum value of BOD (51 mg/l) is observed in river Musi downstream at Hyderabad in Andhra Pradesh. The other locations on river Bhadra at downstream of Bhadravathi (22.5 mg/l), River Tunghabhadra at honnali Bridge (16.5 mg/l), Tungha at downstream of Shimoga Town (13.5 mg/l), Bhadra at downstream of KIOCL Road Bridge near Holehunnur (13.5 mg/l) in Karnataka; Chandrabhaga downstream of Pandharpur Town(10.2 mg/l), Chandrabhaga upstream of Pandharpur Town (9.6 mg/l) in Andhra Pradesh; Nira at Sarole bridge on Pune-Bangalore Highway( 9.6 mg/l) in Maharashtra, Tunghabhadra at Haralahalli Bridge (6.0 mg/l), Tunghabhadra at Ullanur (3.8 mg/l) in Karnataka, and Tunghabhadra at Mantralayam, Kurnool Dist. ( 3.3 mg/l) in Andhra Pradesh; are potentially polluted locations having higher BOD levels. The Faecal Coliforms range from 0–1600 MPN/100ml whereas the Total Coliform number ranges from 27-9000 MPN/100ml. The maximum number of Total Coliform (9000 MPN/100ml) and Faecal Coliform ( 1600 MPN/100ml) is observed at Tunghabhadra at Mantralayam, Kurnool Dist. in Andhra Pradesh and Tunghabhadra at Ullanur in Karnataka respectively. The water quality of tributaries streams of river Krishna during the year is given in Annexure-I Table.15.3.
77

CHAPTER XVI
Water Quality of Rivers in Penneru Basin
16.1 Penneru River System The Penneru basin extends over an area of 55,213 sq km. Located in Peninsular India, it covers areas in the States of Karnataka and Andhra Pradesh. The total length of the river from the head to its outfall into the sea is 597 km of which about 61 km are in Karnataka and the balance of 536 km is in Andhra Pradesh.
The principal tributaries of the river are the Jayamangali, the Kunderu and the Sagilery from the left and the Chitravati, the Papagni and the Cheyyeru from the right.
The Penneru river has the lowest average flow, due to low annual average rainfall. The meagre water wealth of the basin has been utilized only for limited irrigational use, and additional support had to be obtained from the adjoining R.Krishna through the Kurnool-Cuddapah (K.C.) and Tungabhadra canals. The Penneru and its tributaries do not have enough flow to support direct abstraction for larger towns so; infiltration-wells are used for most of the riverside towns. Only Nandyal town abstracts from the K.C. canal.
78

Major industries situated on the banks of the Penneru river are Paper Mills, Straw Board and Sugar industry. The pollution abatement measures like sewage treatment plants for treating municipal wastewater and effluent treatment plants for industries should be established so that indiscriminate discharge of raw effluent directly into the river body shall not interfere with the designated best uses of the river Penneru.
The basin area of Penneru is covering the States of Karnataka and Andhra Pradesh. The important urban centres in Andhra Pradesh are Proddatur, Hindupur, Anantapur, Cuddapah, Nellore, Nandyal, Dharmavarm, Kadiri, Madanapalle, Rayachoti and Tadipatri.
16.2 Water Quality Monitoring in Penneru Basin
The water quality monitoring of the river Penneru are being done in the basin by the State Pollution Control Board of Andhra Pradesh at 5 locations. The monitoring locations are on mainstream of river Penneru (5). The ranges of water quality observed in Penneru Basin with respect to pH, Conductivity, DO, BOD, COD, Total Coliform (TC) and Faecal Coliform (FC) are presented as minimum, maximum and mean value to assess the extent of water quality variation throughout the year.
16.2.1 Water Quality of River Penneru
The water quality observed at four locations on Penneru River indicates that pH, Conductivity and BOD are meeting the desired water quality criteria at all locations. DO observe in the range of 2.8-7.8 mg/l, whereas the BOD varies from 0.5-3.0 mg/l. The Total Coliform number varies from 14-5000 MPN/100ml. However, the lower values of DO are observed at all locations. The conductivity of river water ranges from 250-1916 μmhos/cm. The water quality status of the river Penneru is given in Annexure-I Table 16.1.
79

CHAPTER XVII
Water Quality of Rivers in Cauvery Basin 17.1 Cauvery River System
The Cauvery Basin extends over an area of 87,900 sq km in the States of Kerala, Karnataka and Tamil Nadu. The total length of the river from the head to its outfall into the sea is 800 km of which about 320 km are in Karnataka 416 km in Tamil Nadu and the remaining length of 64 km forms the common boundary between the States of Karnataka and Tamil Nadu. The important tributaries, which join the Cauvery within the Karnataka State, are the Harangi, the Hemavati, the Shimsha and the Arkavati on the north (left bank) and the Lakshmantirtha, the Kabani or Kapila and the Suvarnavati on the south (right bank). In the south (right bank), they are the Bhavani, the Noyil and the Amaravati. The delta of Kaveri is so matured that the main river Kaveri has virtually lost its link with the sea, while Coleroon, the main distributaries, bears the brunt of the burden of flow. Like other rivers of South India, the Kaveri too has a rather limited water wealth because of moderate to low rainfall in the basin. The basin area of Cauvery is covering the States of Karnataka and Tamil Nadu, The important urban centres in these states are Tumkur, Mandya, Mangalore, Mysore, Hassan, Bangalore, Channapatna, Dod, Ballapur, Ramanagaram, in Karnataka; Karaikal in Pondichery; Valparai, Tamilnadu, Pollachi, Coimbatore, Erode, Thanjavur, Karur, Tiruchirappalli, Salem, Kumbakonam, Bhavani, Chidambaram,Coonoor, Devershola, Mannargudi, Mayiladuthurai, Mettuppalaiyam Nagappattinam, Pattukkottai, Pudukkottai, Tiruchengodu, Udhagamandalam, Udumalaippettai, Villupum in Tamil Nadu. Industrial activity is also high in this basin, particularly in the Bangalore area (Karnataka) and the towns Mettur and Coimbatore in the Tamil Nadu State,
80

followed by the districts of Mysore and Mandya in Karnataka and Periyar and Salem in Tamil Nadu.
17.2 Water Quality Monitoring in Cauvery Basin The water quality monitoring of the river Cauvery is being done in the basin by the State Pollution Control Board Karnataka, Tamil Nadu and Kerala at 36 locations. The monitoring locations are on mainstream of river Cauvery (20) and on tributaries are- Arkavati (1), Amravati (1), Bhawani (5), Kabini (4), Laxmantirtha (1), Shimsa (2), Hemavati (1) and Yagichi (1). The ranges of water quality observed in Cauvery basin with respect to pH, Conductivity, DO, BOD, COD, Total Coliform (TC) and Faecal Coliform (FC) are presented as minimum, maximum and mean value to assess the extent of water quality variation throughout the year.
17.2.1 Water Quality of River Cauvery The Water Quality of Cauvery river at twenty locations indicates that DO is in the range of Nil-14.0 mg/l and the minimum value is observed at Erode near Chirapalayam in Tamil Nadu. The water quality of Cauvery river is meeting the desired water quality criteria at all locations in respect of conductivity, pH, Total Coliform bacteria and BOD except at Coleroon, Erode near Chirapalayam and Pitchavaram in Tamil Nadu. Conductivity in the river varies from 28-56,500 μmhos/cm. The high values of Conductivity are observed in at Coleroon (56,500 μmhos/cm) and Pitchavaram (55,500 μmhos/cm). The water quality of river Cauvery is presented in Annexure-I Table 17.1. The water quality status of river Cauveri with respect to BOD is given in Figure 17.1.
Figure 17.1: Water Quality of River Cauvery
WATER QUALITY OF RIVER CAUVERY - 2007
1 1 1 0 .2 0 .6 0 .8 0 .5 0 .7 0 .1 0 .5
1 1.2 1.1 1 1.3 1.1 1.3 1.5
13 .2
0 .8 1.2 1.3 1.2 1.80 .5 1.3 11
36 5
0 .6
0 .10 .31 0 .20 .3
1 10 .2
0 .92 .3
2 31
38
2212 2 2 2 3
38
22
0
5
10
15
20
25
30
35
40
LOCATION
BO
D m
g/l
MIN
MEAN
MAX
81
17.2.2 Water Quality of tributary streams Yagachi, Hemavati, Shimsa, Arkavati, Lakshmantirtha, Kabbani, Bhavani and Amravati
The water quality of tributary steams Yagachi, Hemavati, Shimsa, Arkavati, Lakshmantirtha, Kabbani, Bhavani and Amravati indicate that pH, Conductivity, DO and BOD is meeting the water quality criteria at all the locations except in Lakshmantirtha at D/s of Hunsur Town in Karnataka where the concentration of DO is observed as nil and BOD 10.0 mg/l. The Faecal Coliforms ranges from 12-3300 MPN/100ml whereas the Total Coliforms ranges from 40-22,000 MPN/100ml. The Total Coliforms are observed higher than the desired criteria in River Bhavani at Bhavani in Tamilnadu, followed by Bhavani at Bhavani Sagar, Bhavani at Sirumugai in Tamilnadu. The water quality of tributaries of river Cauvery is given in Annexure-I Table 17.2
82

CHAPTER XVIII
Water Quality of Medium and Minor Rivers, Canals and Creeks 18.1 Medium and Minor River System
The rivers and streams having catchment area less than 20,000 square kilometres are categorized as medium and minor rivers. There are 99 medium and minor rivers in India. The medium and minor rivers are mainly confined to the coastal tract of India and are flowing in the State’s of Gujarat, Maharashtra, Goa, Karnataka, Kerala, Tamil Nadu, Orissa, Andhra Pradesh, Haryana, Himachal Pradesh, Punjab; and Union Territory of Chandigarh and Daman and Diu.
18.2 Water Quality of Medium and Minor Rivers in Gujarat & Daman
The water quality monitoring of river Damanganga, Baleshwar Khadi, Purna, Kaveri, Dhadar, Ambika, Kolak, Amlakheri and Mindhola in Gujarat & Daman is carried out by the State Pollution Control Boards at 12 locations. In River Damanganga DO varies from 3.1 mg/l to 7.2 mg/l and BOD observed in the range of 0.3 mg/l to 16 mg/l. The level of BOD observed in river Amlakhadi in the range of 73 to 522 mg/l after confluence of wastewater from Ankleshwar. The level of BOD observed in river Kolak (max. 19 mg/l), Baleshwar (max. 4.7 mg/l), River Purna (max. 3.9 mg/l), river Kaveri (max. 3.6 mg/l), River Dhadar (max. 6.3 mg/l), Mindhola (max. 5.3 mg/l) and Ambika (max. 4.7 mg/l) does not meet the water quality criteria. The Conductivity is found very high in river Kolak at railway bridge in Vapi (29,920 µmhos/cm), Damanganga at Kachigaon D/s (20,360 µmhos/cm), River Kolak at Patalia Bridge (14,426 µmhos/cm), river Kaveri on bridge at Billimora in Valsad road (14,111 µmhos/cm) and Amlakhadi after confluence of wastewater from Ankleshwar (5414 µmhos/cm). The Total Coliform observed higher than the desired criteria in River Mindhola at state Highway Bridge, Sachin (1,10,000 MPN/100ml), River Purna on bridge at Surat-Navsari Highway & Balehwar Khadi at N.H. No. 8 (36,000 MPN/100ml), River Kaveri at Bilimora-Valsad road (24,000 MPN/100ml) and Ambika at Bilimora (21,000 MPN/100ml). The Faecal Coliform is found very high in River Mindhola at State Highway Bridge, Sachin (46,000 MPN/100ml), Balehwar Khadi at N.H. No. 8 & River Purna on bridge at Surat-Navsari Highway (24,000 MPN/100ml), river Kaveri on bridge at Billimora in valsad road (15,000 MPN/100ml) and Ambika at Bilimora (15,000 MPN/100ml). The water quality status of rivers in Gujarat is presented in Annexure-I Table 18.1.
18.3 Water Quality of Medium and Minor Rivers in Goa and Maharashtra
The State Pollution Control Board of Goa carries out the water quality monitoring of river Zuari, Mandovi, Kalna, Valvant, Madai, Khandepar, Talpona and Assonora. The water quality of all the mentioned rivers in Goa is
83
meeting the desired water quality criteria in respect of DO, Conductivity, pH at most of the locations except Conductivity in river Zuari at D/s of Point where Kumbarjria canal joins (2609 µmhos/cm), Mandovi at Tonca (2821 µmhos/cm ) and river Zuari at Panchawadi (1005 µmhos/cm). Total Coliform and BOD is not meeting the desired water quality criteria at all the location except in River Madai at Dabos-Valpoi. The water quality monitoring of river Ulhas, Bhatsa, Kalu, Patalganga and Kundalika is carried out by the State Pollution Control Board of Maharashtra. All the Rivers are meeting the desired water quality criteria in respect of DO, pH, Conductivity and Total Coliform except Conductivity in River Kalu at Atale village (1269 µmhos/cm). BOD observed in the range of 3.0 mg/l to 7.5 mg/l and the higher levels are observed in river Kalu at Atale village (max. 7.5 mg/l), river Ulhas at U/s of NRC Bund at Mohane (max. 6.0 mg/l), river Ulhas at U/s of Badlapur, Patalganga at Shilphata & near intake of MIDC Water works, Kundalika at Roha city (max. 5.0 mg/l) and Bhatsa at D/s of Pise Dam (max. 4.2 mg/l). The number of Total Coliform are meeting the criteria limit at all the locations. The water quality status of rivers in Goa and Maharashtra is presented in Annexure-I Table 18.2.
18.4 Water Quality of Medium and Minor Rivers in Kerala
The water quality monitoring of river Periyar, Chaliyar, Kallada, Muvattapuzha, Chalakudy, Karmana, Pamba, Meenachil, Manimala, Achenkoil, Vamanapuram, Amaravila, Ayur, Thirurangady, Kuttiyady, Valayum, Kuppam, Hosdurg, Kakkadavu, Padiyathadka & Irupanam in Kerala is carried out by the State Pollution Control Board of Kerala at 28 locations. The DO does not meet the criteria in river Karmana at Moonnattumukku (0.0 mg/l), Irupanamn (2.2 mg/l), Manimala at Kalloopara (0.6 mg/l), Periyar near Alwaye-Eloor (2.7 mg/l) and Pamba Down (3.7 mg/l). BOD varies from 0.1 mg/l to 13.2 mg/l. All the monitoring locations in Kerala on Medium and Minor River are having 3 mg/l BOD or less except Karmana at Moonnattumukku (13.2 mg/l), Amaravila (3.5 mg/l), Irupanamn (3.6 mg/l) and Muvattapuzha (3.6 mg/l) that indicates about the relatively low level of concentration of organic matter in water bodies. The Total and Faecal Coliform numbers were observed in the range of 40-39,000 MPN/100ml and Nil-31,000 MPN/100ml with maximum at Karmana at Moonnattumukku. The conductivity observed high in river Hosdurg (37,600 µmhos/cm), Chaliyar at Chungapally (36,000 µmhos/cm), Kuppam at Thaliparamba (34,300 µmhos/cm), Karmana at Moonnattumukku (9300 µmhos/cm), Periyar at Alwaye (4000 µmhos/cm) and Irupanamn (3100 µmhos/cm) due to estuarine zone of these rivers on these locations. The water quality status of rivers in Kerala is presented in Annexure-I Table 18.3.
18.5 Water Quality of Medium and Minor Rivers in Andhra Pradesh, Orissa,
Pondicherry, Tamilnadu and Karnataka
The water quality monitoring of river Nagavalli, Rushikulya, Arasalar, Tambiraparani, Palar, Nethravati, Kumardhara and Kali in Andhra Pradesh, Orissa, Pondicherry, Tamilnadu and Karnataka respectively is carried out by
84
the respective State Pollution Control Boards. The pH, Conductivity and DO is meeting the criteria all locations except conductivity in river Rushikulya at Ganjam D/s (42,900 µmhos/cm) in Orissa. BOD varies from 0.0-7.0 mg/l. BOD observed more than criteria limit in Arasalar, Karaikal Region (7.0 mg/l) in Pondicherry; Tambiraparani at Rail Bridge near Ambasanudam (6.0 mg/l), Tambiraparani at Arumuganeri (4.7 mg/l), Palar at Vaniyambadi Water Supply Headworks (4.0 mg/l), Tambiraparani at Murappanadu (3.4 mg/l), Tambiraparani at Tirunelveli Collectorate (3.3 mg/l) in Tamilnadu. The Total and Faecal Coliform are observed in the range of 2-35,000 MPN/100ml and Nil-2600 MPN/100 ml respectively. The critical location with respect to Coliform levels is river Nagavalli at Thotapalli Regulator in Andhra Pradesh. The water quality status of rivers in Andhra Pradesh, Orissa, Pondicherry, Tamilnadu and Karnataka is presented in Annexure-I Table 18.4.
18.6 Water Quality of Medium and Minor Rivers in Himachal Pradesh, Punjab, Haryana, Chandigarh and Rajasthan
The water quality monitoring of river Ghaggar, Markanda, Kala Amb, Sukhana, Kodra Dam, N-Choe, Patiala ki Rao and Sukhna Choe in Punjab, Haryana, Chandigarh, Himachal Pradesh and Rajasthan is carried out by the respective State Pollution Control Boards. In river Ghaggar DO varies from 1-8 mg/l. The low value of DO observed at road bridge Sirsa, Debwali road (1.0 mg/l) and at Chandrapur Syphon (3.0 mg/l) in Haryana. BOD observed in the range of 0.8 mg/l to 81 mg/l. All the locations in river Ghaggar are grossly polluted. Locations having very high BOD in River Ghaggar are ottu weir (81 mg/l), at road Brdg. Sirsa, Debwali road (68 mg/l), GH-2 at Chandrapur Syphon (42 mg/l) in Haryana; D/s Sardulgarh(20 mg/l), U/s of Sardulgarh and U/s Dhakansu Nallah(18 mg/l), at D/s of Jharmal nadi (16mg/l), at Moonak (14 mg/l ), 100m D/s after confluence with river Saraswati, Patiala and near Bankarpur, Dera Bassi (12 mg/l), at Ratanheri D/s of Patiala Nadi after confluence (10 mg/l), D/s of Chhatbir (4.8 mg/l), U/s of Jharmal nadi (4.2 mg/l) and at Mubarakpur Rest House (Patiala) (3.4 mg/l) in Punjab. The number of Total and Fecal Coliform were in the range of 7-35,00,000 MPN/100ml and 3-2,30,000 MPN/100ml respectively. The river is grossly polluted at majority of monitoring locations due to the discharge of municipal and industrial wastewater. The water quality of tributary stream Markanda at D/s of Kala Amb indicates that the river is grossly polluted due to effluent discharge from Ruchira Paper Mills. The BOD in River Markanda ranges from 0.2 to 218 mg/l and conductivity from 128 to 4260 µmhos/cm. River Sukhana does not meet the criteria limit as the BOD is in the range of 6.8-36 mg/l. The water quality of river Kodra is meeting water quality criteria in respect of all parameters except BOD. The tributary streams N-Choe, Patiala ki Rao and Sukhna Choe are having high concentration of BOD which is in the range of 49-50 mg/l. The water quality status of medium and minor rivers in Punjab, Haryana, Himachal Pradesh and Rajasthan is presented in Annexure-I Table 18.5.
85

18.7 Water Quality of Medium and Minor Rivers in Manipur, Meghalaya, Mizoram and Tripura The water quality monitoring of river Imphal, Kiyamgio, Minuthong, Iril, Lilong, Tlawing, Tuirial, Umtrew, Kharkhla, Myntdu, Ganol, Khuga, Khujairok, Simsang, Gumti, Nambul, Haora and Sekmai in the states Manipur, Meghalaya, Mizoram and Tripura is carried out by the respective State Pollution Control Boards. The DO meets the criteria at all the locations except in River Ganol, Tura (1.4 mg/l), River Simsang, William Nagar(2.0 mg/l) in Meghalaya; Hump Bridge (2.1 mg/l) and Heirangoithong (3.1 mg/l), Imphal at Mahabali (3.4 mg/l) and Koirengei (3.9 mg/l), Khuga River, Churachandpur Dist.(3.8 mg/l) in Manipur; Gumti at D/s South Tripura (3.7 mg/l) and Sekmai river, Kakching (3.2 mg/l) in Tripura. The pH is meeting the desired criteria at all the locations except at Kharkhla near Sutanga Khlieriat, Jaintia Hills District in Meghalaya, where it observed in acidic range (2.90). BOD varies from 0.1 to 14.6 mg/l. The locations having high BOD are river Nambul at Hump Bridge (14.6 mg/l) and at Heirangoithong (12 mg/l) in Manipur; River Umtrew at Byrnihat East (7.7 mg/l), at Kharkhla near Sutnga Khlieriat, Jaintia Hills Dt. (7.0 mg/l) in Meghalaya; Haora River Chandrapur, Agartala D/s (3.9 mg/l) in Tripura and Imphal River at Minuthong (3.3 mg/l) in Manipur. River Tlawing and Tuirial in Mizoram are meeting the water quality criteria in respect of pH, DO and BOD at all monitoring locations. The Total and Faecal Coliform are meeting the criteria at all the locations on the rivers monitored in North Eastern States. The water quality of Medium and Minor Rivers in Manipur, Meghalaya, Mizoram and Tripura is presented in Annexure-I Table 18.6.
18.8 Water Quality of Creeks and Canals The monitoring locations on creeks are one each on Thane, Mahim and Bassein in the vicinity of Mumbai, Maharashtra. Gurgaon Canal, Western Yamuna Canal and Katakha Canal are monitored in Haryana and Tripura.
18.8.1 Water Quality of Creeks
The water quality of the creeks Thane, Mahim and Bassein, with respect to pH, Conductivity, DO, BOD, Total Coliform (TC), Faecal Coliform (FC), Nitrite, Nitrate and Ammonical Nitrogen are presented as minimum, maximum and mean value to assess the extent of water quality variation throughout the year. DO varies from 1.1 mg/l to 5.8 mg/l. BOD observed in the range of 7.8 mg/l to 19 mg/l and however the maximum value was observed in Mahim Creek at Mahim Bay. Conductivity is observed very high due to marine water insurgence and it ranges from 16,000–61,250 µmhos/cm. The Nitrate (NO3
-) concentrations are in the range of 0.60 – 3.40 mg/l. The highest concentration of Nitrate (3.40 mg/l) is observed in Mahim Creek. The number of Total and Faecal Coliform are meeting the criteria limit due to proximity of monitoring locations to sea. The water quality status of the creeks Thane, Mahim and Bassein is presented in Annexure-I Table 18.7.
86

18.8.2 Water Quality of Canals
The water quality of Western Yamuna Canal and Katakhal (Agartala) Canal with respect to pH, Conductivity, DO, BOD, Total Coliform (TC), Faecal Coliform (FC), Nitrite, Nitrate and Ammonical Nitrogen are presented as minimum, maximum and mean value to assess the extent of water quality variation of the canals throughout the year. In Western Yamuna Canal DO vary from 0.2 mg/l to 6.8 mg/l and BOD observed in the range of 0.6 mg/l to 396 mg/l with maximum at Damla (Yamuna Nagar) on Western Yamuna Canal 100 m D/s after receiving Industrial & Municipal Sewage. The Total and Fecal Coliform observed at Haiderpur Water Works does not meet the criteria as the value of Total Coliform varies from 11,000–5,20,000 MPN/100ml and Faecal Coliform from 7500–19,000 MPN/100ml. Katakhal Canal in Tripura does not meet the water quality criteria. The maximum DO observed in Katakhal Canal in Tripura is 6.11 mg/l and BOD is 12.2 mg/l, however Total Coliform is meeting the criteria. The water quality status of canals is presented in Annexure-I Table 18.7.
87

CHAPTER XIX
Water Quality of Lakes, Tanks and Ponds 19.1 Lantic Water Bodies
Lakes in India spread over an area of about 7.2 Lakh hectares. There are very few lakes in India, and among them most are quite shallow and none of any considerable size. In the hilly regions, there is abundance of lakes. Lakes are an integral part of a drainage basin and landlocked body of water with a horizontal surface water level.
The Lakes being monitored are Hussainsagar (1), Saroornagar (1), Himayatsagar (1), Pulicate (1), Salaulim (1), Kankoria (1), Chandola (1), Ajwah (1), Sursagar (1), Brahamsarovar (1), Sukhna (2), Govindsagar (1), Pongdam (1), Renuka (1), Wuller (1), Dal (1), Ulsoor (1), HebbalaValley (1), Oruvathikotta (1), Sasthamcotta (1), Ashthamudi (1), Paravur (1), Vembanad (1), Periyar (1), Kodumgallor (1), Kayamkula (1), Punnamadakayal (1), Pookotekayal (1), UpperLake (1), LowerLake (1), MultaiLake (1), Loktak (4), Umiam (1), Ward (1), Thadlaskena (1), Osteri (1), Bahour (1), Harike (2), Pichola (1), Udaisagar (1), Ramgarh Jaipur (1), Pushkar (1), Fatehsagar (1), Kalyana (1), Nakki (1), Udhagamadalam (1), Kodaikanal (1), Yercaud (1), Lakshminarayan Baridigh (1), Rudrasagar (1), Ramgarh-UttarPradesh (1), Naini (1), Rabindrasarovar (1), Nalsarovar (1), Bindusaraovar (1), Sahastrling Sarovar (1), Lakhota Talav (1), Narsimehta Talav (1), Nadiad city Lake (1), Ranjitnagar Talav (1) Ankleshwar reservoir(1), Dharoi dam(1), Kuwadava(1),Moticher lake(1), Mayem lake(1), Janunia talav(1), Yashwant sagar(1), Sirpur talav(1), Kali sindh reservoir(1), Periat tank(1), Shahpura (1), Madhav lake(1), Nagchun(1), Karwa dam(1), Khandari reservoir(1), Daloni Beel(1), Mer Beel(1), Govindgarh tank(1), Bilawali talav(1). The tanks and ponds being monitoring are Dharamsagar(1), Bibinagar(1), Kistrapetrareddy(1), Goysagar(1), Thol Tank (1), Gandigudem(1) and the ponds are Elangabeel System(1), Olpad, Village Pond, Olpad, Surat (1), Lakshadweep Pond near Juma Masjid (1), Bishnu Pushkar pukhuri(1), Bor Beel(1), Bor pukhuri(1), Botodriva pond(1), Chand dubi Beel(1), Deepar Beel(1), Dighali pukhuri(1), Dhudia talav(1), Baskandi pond(1), Galabeel(1), Ganga pukhuri(1), Gaurisagar(1), Gopur tank(1), Padum pukhuri(1), Hordai pukhuri(1), Jaipal pukhuri(1), Mahamaya mandir pukhuri(1), Rajadinia pukhuri(1), Raja pukhuri(1), Rajmaw pukhuri(1), Saranbeel(1), Sivasagar tank(1) and Subhagya kund(1). The number of monitoring locations on each lake is given in parenthesis.
19.2 Lakes, Tanks and Ponds in Andhra Pradesh, Karnataka, Kerala,
Tamilnadu, Pondicherry and Goa.
The respective State Pollution Control Boards and PWD in Lakshadweep carry out the water quality monitoring of Lakes, Tanks and Pond in Andhra Pradesh, Karnataka, Kerala, Tamilnadu and union territory of Pondicherry.
88

The ranges of water quality observed in these rivers with respect to pH, Conductivity, DO, BOD, Total Coliform (TC) and Faecal Coliform (FC) are presented as minimum, maximum and mean value to assess the extent of water quality variation throughout the year. DO varies from 0.0 mg/l to 10.0 mg/l. Lakes and Tanks having very low DO and does not meet the water quality criteria limits are Heballa Valley Lake, Mandya in Karnataka; Pulicate lake, Hussain Sagar lake and Saroornagar in A.P.; Ashthamudi Lake at Quilon and Kayamkulam in Kerala. and BOD observed in the range of 0.0 mg/l to 24 mg/l. Lakes and Tanks with high conductivity and does not meet the water quality criteria are Pulicate lake, Kistareddypet Tank (Medak Dist.) and Gandigudem (Medak Dist.), in AP; Kayamkulam Lake, Oruvathilkotta Lake, Alappuzha lake, Ashthamudi Lake at Quilon, Paravur Lake, Kodungalloor, and Kochi (Oil Tanker Jetty) in Kerala. Lakes and Tanks with high concentration of organic matter and does not comply to the standard limits for BOD are Saroornagar lake (24 mg/l), Hussain Sagar lake (16 mg/l), Dharmsagar Tank near Warangal (8 mg/l), Bibinagar Tank (4.8 mg/l) and Pulicate lake (4.8 mg/l) in AP; Heballa Valley Lake (18 mg/l) and Ulsoor lake (9 mg/l) in Karnataka; Bahour Lake (14 mg/l) and Osteri Lake (12 mg/l) in Pondicherry; Udhagamandalam lake (21 mg/l) and Kodai Kanal Lake (5.2 mg/l) in Tamil Nadu; Oruvathilkotta Lake (12.2 mg/l), Kayamkulam (5.0 mg/l), Alappuzha lake (4.5 mg/l) and Kochi (Oil Tanker Jetty) (3.7 mg/l) in Kerala. The water quality of Lakes and tanks in respective states is meeting the water quality criteria with respect to Total Coliform and Fecal Coliform except in Oruva Thilkotta Lake in Kerala where TC was observed higher than the desired criteria (17800 MPN/100ml). The Ammonical Nitrogen (NH4-N) is observed in the range of 0.0-15.0 mg/l.The higher concentration is observed at Saroornagar (15.0 mg/l) and Bibinagar Tank (4.20 mg/l) in AP & Kodaikanal Lake (5.0 mg/l) and Udhagamandalam Lake (5.0 mg/l) in Tamil Nadu. The water quality status of Lakes and tanks in Andhra Pradesh, Karnataka, Kerala, Tamilnadu, Goa and union Territory of Pondicherry is presented in Annexure-I Table 19.1.
19.3 Lakes in Gujarat, Madhya Pradesh and Rajasthan
The water quality monitoring of Lakes, Tanks and Pond in Gujarat, Madhya Pradesh and Rajasthan is carried out by the respective State Pollution Control Boards. The ranges of water quality observed in these Lakes with respect to pH, Conductivity, DO, BOD, Total Coliform (TC) and Faecal Coliform (FC) are presented as minimum, maximum and mean value to assess the extent of water quality variation throughout the year. DO varies from 1.0 mg/l to 12.8 mg/l with minimum at Kheta Talav, Nadiad (2.2 mg/l) and Kankori Lake at Ahemdabad (3.5 mg/l) in Gujarat; Udaisagar Lake at Udaipur (1.0 mg/l), Pushkar Lake (1.2 mg/l), Fateh Sagar Tank, Udaipur (2.8 mg/l), Nakki Lake, Mt. Abu (3.1 mg/l) and Pichola Lake at Udaipur (3.6 mg/l) in Rajasthan. Conductivity observed higher than the water quality criteria at Nalsarovar
89

Lake (Sanand), Dist.Ahmedabad (3670 µmhos/cm) in Gujarat. BOD observed in the range of 0.3 mg/l to 13.3 mg/l with maximum at Pushkar Lake (13.3 mg/l). Other Lakes and Tanks having high BOD and does not comply to the standard limits for BOD are Bindusarovar, Siddhpur (Dist.Patan) (12 mg/l), Sursagar Lake (11.1 mg/l), Thol Tank (Kalol) (Dist. Mehasana) (10 mg/l), Kheta Talav, Nadiad (8 mg/l), Narsimehta Talav- Junagadh (7.4 mg/l), Kankoria lake (6 mg/l), Nalsarovar Lake (5 mg/l), Lakhota Talav, Jamnagar (4.9 mg/l) and Olpad Village Pond (3.1 mg/l) in Gujarat; Udaisagar lake (10.8 mg/l), Nakki lake at Mt.Abu (6.1 mg/l), Kayalana Jheel at Jodhpur (4.1 mg/l) and Fateh Sagar Lake at Udaipur intake point of PHED (3.3 mg/l) in Rajasthan; Lower lake Bhopal (4.8 mg/l) in MP. The water quality of Lakes and tanks in respective states is meeting the water quality criteria with respect to Total Coliform except in Olpad village Pond, Nalsarovar Lake, Sahstraling Sarovar in Gujarat which is not complying with the criteria limit of Total Coliform. The water quality status of Lakes in Gujarat, Madhya Pradesh and Rajasthan is presented in Annexure-I Table 19.2.
19.4 Lakes in Haryana, Himachal Pradesh, Punjab, Chandigarh, Uttar
Pradesh, Uttaranchal and West Bengal
The water quality monitoring of Lakes, Tanks and Pond in Haryana, Chandigarh, Himachal Pradesh, Punjab, Uttar Pradesh and West Bengal is carried out by the respective State Pollution Control Boards. The ranges of water quality observed in these rivers with respect to pH, Conductivity, DO, BOD, Total Coliform (TC) and Faecal Coliform (FC) are presented as minimum, maximum and mean value to assess the extent of water quality variation throughout the year. All the lakes monitored are meeting the required level of water quality criteria in respect of DO, pH, TC and conductivity at most of the locations. DO vary from 0.2 mg/l to 9.8 mg/l. Lakes and Tanks having very low DO and does not meet the water quality criteria limits are Renuka Lake in HP and Naini Lake, Nainital in Uttranchal. BOD observed in the range of 0.2 mg/l to 5.2 mg/l. Lakes and Tanks having BOD more than criteria limit are Ramgarh Lake-U.P (5.2 mg/l), Rabindra Sarobar Lake-WB (4.8 mg/l) and Naini Lake, Nainital-UT (3.8 mg/l). The Total Coliform and Faecal Coliform varies from 9 -55,000 MPN/100ml and 0-35,000 MPN/100ml respectively. Lake having TC more than the desired criteria is Rabindra Sarobar Lake, WB (55,000 MPN/100ml). The water quality status of Lakes and tanks in Haryana, Himachal Pradesh, Punjab, Chandigarh, Uttar Pradesh, Uttaranchal and West Bengal is presented in Annexure-I Table 19.3.
19.5 Lakes, Tanks and Ponds in Assam, Manipur, Meghalaya and Tripura.
The water quality monitoring of Lakes, Tanks and Pond in Assam, Manipur, Meghalaya and Tripura is carried out by the respective State Pollution Control Boards. The ranges of water quality observed in these rivers with respect to pH, Conductivity, DO, BOD, Total Coliform (TC) and Faecal Coliform (FC) are presented as minimum, maximum and mean value to assess the extent of water quality variation throughout the year. DO varies from 0.0 mg/l to 9.8 mg/l. DO observed lower than the desired criteria are Elangabeel system pond in Assam; Loktak Lake at Thana, Loktak Lake at Bishnupur and Karang
90
Island (Loktak Lake) in Manipur and Rudrasagar in Tripura whereas all other locations monitored are meeting the required level of DO. Conductivity observed higher than the water quality criteria at Elangabeel system pond in Assam (3770 µmhos/cm). BOD observed in the range of 0.1 mg/l to 174 mg/l. Lakes and Tanks observed having BOD more than criteria are Elangabeel System Pond (174 mg/l) and Goysagar Tank, Sibsagar (3.5 mg/l) in Assam; Umiam lake at Barapani (9.7 mg/l) in Manipur; Loktak lake at Sendra (3.5 mg/l) and Ward Lake at Shillong (8.6 mg/l) in Meghalaya; Laxmi Narayan Bari Palace Compound, Tripura (5.2 mg/l). The water quality of Lakes, Tanks and Ponds in respective states is meeting the water quality criteria with respect to Total Coliform except Elangabeel system pond in Assam where maximum count observed 46,000 MPN/100ml. The water quality status of Lakes, Tanks and Ponds in Assam, Manipur, Meghalaya and Tripura is presented in Annexure-I Table 19.4.
91

CHAPTER XX
Assessment of Groundwater Quality
20.1 Ground Water Quality Monitoring
The groundwater occurrence and availability is largely governed by the state of cementation and compaction of the formation, which control the pore volume. The geological formations encountered in the country may be broadly divided into three categories-the unconsolidated, the semi-consolidated and the consolidated. In India a sizable proportion of population is dependant on ground water for drinking and other household utilities besides its use in irrigation at large. Due to limited cost effective treatment options for polluted ground water, the affected resource is generally lost for drinking and other utilities.
20.2 State wise Groundwater Quality Monitoring
To assess the problem of groundwater quality deterioration, network of groundwater quality monitoring is extended to 382 locations. The Statewise number of groundwater monitoring locations is given below.
Table 20.1: State wise Distribution of Groundwater Monitoring Stations
State/water body No. of wells ANDHRA PRADESH 24 ASSAM 32 BIHAR 20 CHANDIGARH 7 CHHATISSGARH 4 DAMAN & Diu(ZOV) 1 GOA 6 GUJARAT 42 HIMACHAL PRADESH 20 KERALA 15 LAKSHDWEEP 15 MADHYA PRADESH 18 MAHARASHTRA 30 MANIPUR 5 MEGHALAYA 5 MIZORAM 2 ORISSA 15 PONDICHERRY 13 PUNJAB 6 RAJASTHAN 37 TAMIL NADU 2 TRIPURA 7 UTTAR PRADESH 25 UTTRANCHAL 1 WEST BENGAL 30 Total 382
92
The ranges of water quality observed in groundwater with respect to pH, Conductivity, BOD, Total Coliform (TC) and Faecal Coliform (FC) are presented as minimum, maximum and mean value to assess the extent of water quality variation throughout the year.
20.3 Status of Ground Water Quality in Andhra Pradesh
The water quality monitoring of ground water in Andhra Pradesh is carried out by Andhra Pradesh Pollution Control Boards. pH of groundwater was in the range of 6.3-8.6 and the low pH was observed at B/W -Near Ckm College , Enumamula (V), Warangal. Conductivity varies from 141 to 7380 µmhos/cm except few locations, conductivity is meeting the criteria limit for drinking as well as irrigation purposes. Very high level of conductivity is observed in Near Rama Temple, Visakhapatnam (7380 µmhos/cm), in Panchayat Office, in Bolaram (5720 µmhos/cm), Near Ckm College, Enumamula (V), Warangal Dist.,(3590 µmhos/cm), Open well near Pratap Nagar bridge, Kakinada (3120 µmhos/cm), Nagiri, Chittoor Dist. (2350 µmhos/cm), Open well, Peddanuyyi-Vizianagaram (2350 µmhos/cm) and Swarnamukhi River, Srikalahasti, Chittoor Dist. (2330 µmhos/cm). BOD is meeting the criteria in well at all locations except at B/W – East of Saichevuru, Paidipally (V), Warangal Distt., A.P. (4.8 mg/l) and at Open well- Bhoomaiah near Ashponds of NTPC, Kundanpally (V), Ramagundam, Karimnagar (4.0 mg/l). Total Coliforms are meeting the desired criteria at all the locations except at Open well near Pratap Nagar bridge, Kakinada (12000 MPN/100ml), B/W near M/S Andhra sugars Ltd., Kovvur, W.G. Distt. (10000 MPN/100ml) and Open well Peddanuyyi-Vizianagaram (8000 MPN/100ml).The concentration of Nitrate (NO3
-) is observed in the range of 0.1-45.8 mg/l. The highest value of nitrate is observed at B/W near M/S Andhra sugars Ltd., Kovvur, W.G. Distt. (45.8 mg/l). The quality of ground water in Andhra Pradesh is presented in Annexure-I Table 20.1.
20.4 Status of Ground Water Quality in Assam, Meghalaya, Mizoram and
Tripura
The water quality monitoring of ground water in Assam, Meghalaya and Tripura is carried out by respective State Pollution Control Boards. pH of groundwater is observed in the range of 5.6-8.1 and pH observed below 6.0 at following monitoring locations Kunjban, Agartala and A.D.Nagar, Agartala, in Tripura. Conductivity varies from 48-1294 µmhos/cm and is meeting the criteria limit for drinking as well as irrigation purposes. BOD is not meeting the desired criteria at Guwahati (12.0 mg/l), Berpeta (6.8 mg/l) and Sibsagar (4.5 & 4.3 mg/l). Total Coliforms are not meeting the desired criteria at monitoring locations in Silchar (240000 MPN/100ml); Guwahati (15000 MPN/100ml) and Sibsagar, Berpeta, Bonaigaon & Guwahati (9300 MPN/100ml). The concentration of Nitrate (NO3
-) is observed in the range of 0.03-12.0 mg/l. The quality of ground water in Assam, Meghalaya and Tripura is presented in Annexure-I Table 20.2.
93
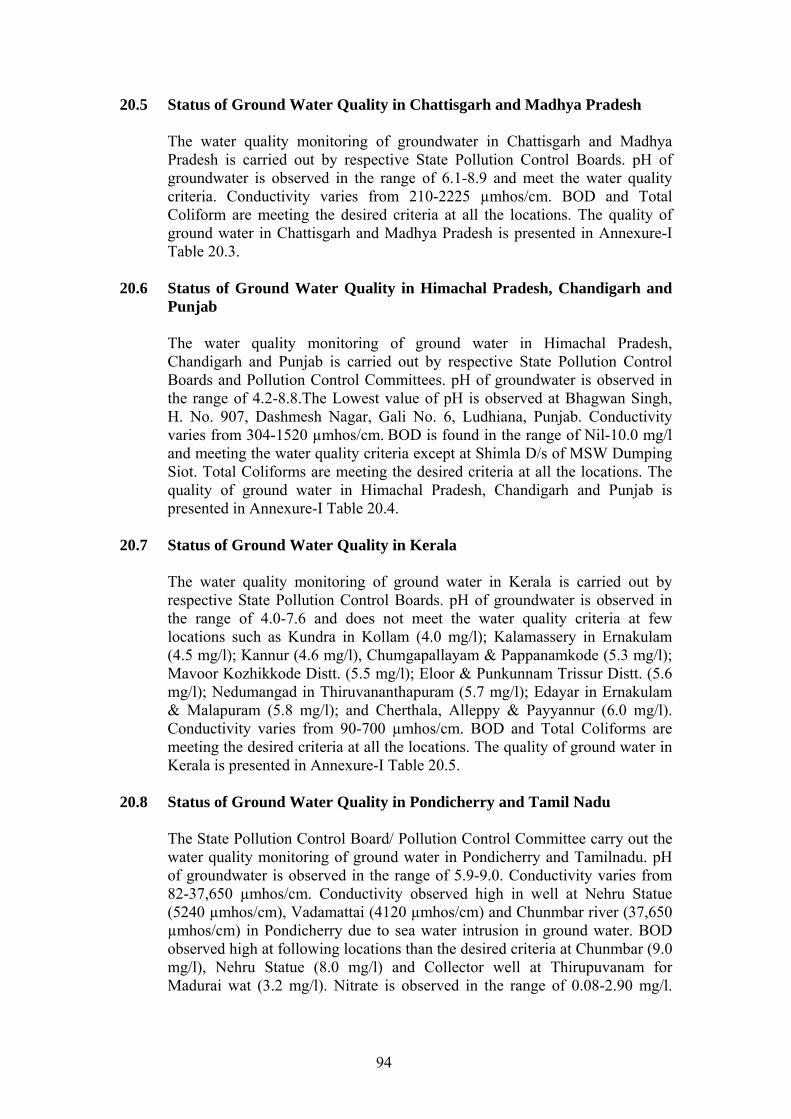
20.5 Status of Ground Water Quality in Chattisgarh and Madhya Pradesh
The water quality monitoring of groundwater in Chattisgarh and Madhya Pradesh is carried out by respective State Pollution Control Boards. pH of groundwater is observed in the range of 6.1-8.9 and meet the water quality criteria. Conductivity varies from 210-2225 µmhos/cm. BOD and Total Coliform are meeting the desired criteria at all the locations. The quality of ground water in Chattisgarh and Madhya Pradesh is presented in Annexure-I Table 20.3.
20.6 Status of Ground Water Quality in Himachal Pradesh, Chandigarh and
Punjab
The water quality monitoring of ground water in Himachal Pradesh, Chandigarh and Punjab is carried out by respective State Pollution Control Boards and Pollution Control Committees. pH of groundwater is observed in the range of 4.2-8.8.The Lowest value of pH is observed at Bhagwan Singh, H. No. 907, Dashmesh Nagar, Gali No. 6, Ludhiana, Punjab. Conductivity varies from 304-1520 µmhos/cm. BOD is found in the range of Nil-10.0 mg/l and meeting the water quality criteria except at Shimla D/s of MSW Dumping Siot. Total Coliforms are meeting the desired criteria at all the locations. The quality of ground water in Himachal Pradesh, Chandigarh and Punjab is presented in Annexure-I Table 20.4.
20.7 Status of Ground Water Quality in Kerala
The water quality monitoring of ground water in Kerala is carried out by respective State Pollution Control Boards. pH of groundwater is observed in the range of 4.0-7.6 and does not meet the water quality criteria at few locations such as Kundra in Kollam (4.0 mg/l); Kalamassery in Ernakulam (4.5 mg/l); Kannur (4.6 mg/l), Chumgapallayam & Pappanamkode (5.3 mg/l); Mavoor Kozhikkode Distt. (5.5 mg/l); Eloor & Punkunnam Trissur Distt. (5.6 mg/l); Nedumangad in Thiruvananthapuram (5.7 mg/l); Edayar in Ernakulam & Malapuram (5.8 mg/l); and Cherthala, Alleppy & Payyannur (6.0 mg/l). Conductivity varies from 90-700 µmhos/cm. BOD and Total Coliforms are meeting the desired criteria at all the locations. The quality of ground water in Kerala is presented in Annexure-I Table 20.5.
20.8 Status of Ground Water Quality in Pondicherry and Tamil Nadu
The State Pollution Control Board/ Pollution Control Committee carry out the water quality monitoring of ground water in Pondicherry and Tamilnadu. pH of groundwater is observed in the range of 5.9-9.0. Conductivity varies from 82-37,650 µmhos/cm. Conductivity observed high in well at Nehru Statue (5240 µmhos/cm), Vadamattai (4120 µmhos/cm) and Chunmbar river (37,650 µmhos/cm) in Pondicherry due to sea water intrusion in ground water. BOD observed high at following locations than the desired criteria at Chunmbar (9.0 mg/l), Nehru Statue (8.0 mg/l) and Collector well at Thirupuvanam for Madurai wat (3.2 mg/l). Nitrate is observed in the range of 0.08-2.90 mg/l.
94
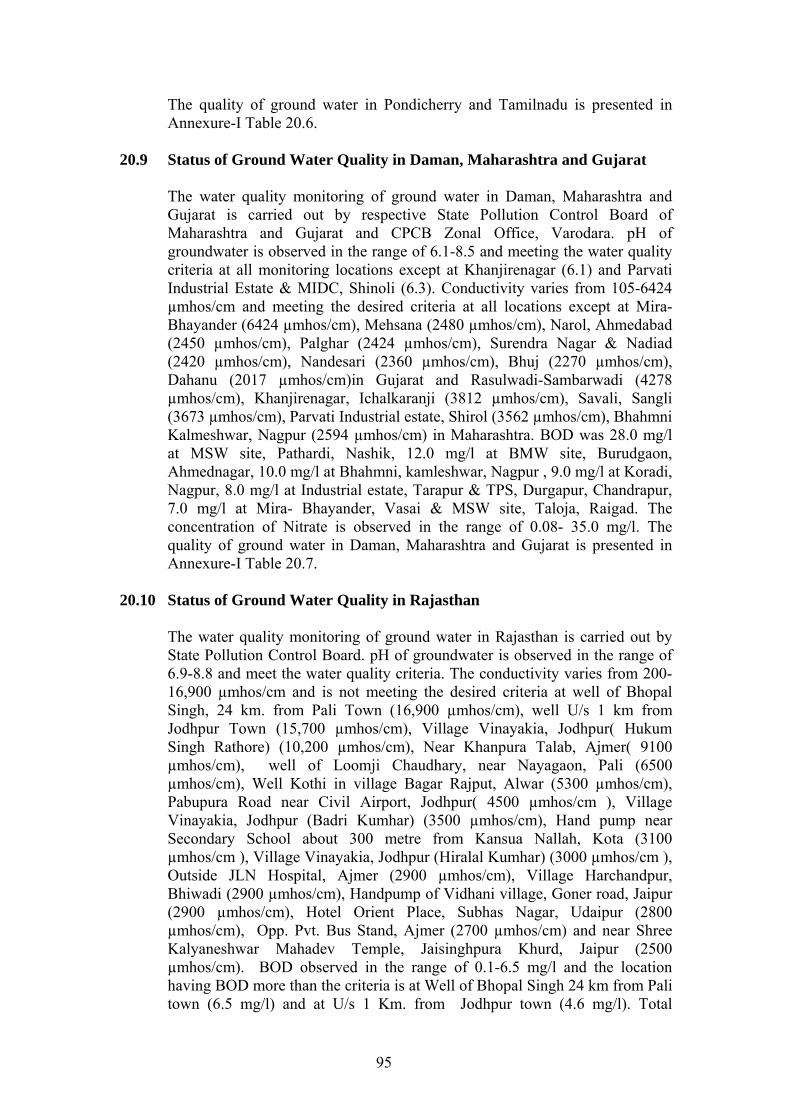
The quality of ground water in Pondicherry and Tamilnadu is presented in Annexure-I Table 20.6.
20.9 Status of Ground Water Quality in Daman, Maharashtra and Gujarat
The water quality monitoring of ground water in Daman, Maharashtra and Gujarat is carried out by respective State Pollution Control Board of Maharashtra and Gujarat and CPCB Zonal Office, Varodara. pH of groundwater is observed in the range of 6.1-8.5 and meeting the water quality criteria at all monitoring locations except at Khanjirenagar (6.1) and Parvati Industrial Estate & MIDC, Shinoli (6.3). Conductivity varies from 105-6424 µmhos/cm and meeting the desired criteria at all locations except at Mira-Bhayander (6424 µmhos/cm), Mehsana (2480 µmhos/cm), Narol, Ahmedabad (2450 µmhos/cm), Palghar (2424 µmhos/cm), Surendra Nagar & Nadiad (2420 µmhos/cm), Nandesari (2360 µmhos/cm), Bhuj (2270 µmhos/cm), Dahanu (2017 µmhos/cm)in Gujarat and Rasulwadi-Sambarwadi (4278 µmhos/cm), Khanjirenagar, Ichalkaranji (3812 µmhos/cm), Savali, Sangli (3673 µmhos/cm), Parvati Industrial estate, Shirol (3562 µmhos/cm), Bhahmni Kalmeshwar, Nagpur (2594 µmhos/cm) in Maharashtra. BOD was 28.0 mg/l at MSW site, Pathardi, Nashik, 12.0 mg/l at BMW site, Burudgaon, Ahmednagar, 10.0 mg/l at Bhahmni, kamleshwar, Nagpur , 9.0 mg/l at Koradi, Nagpur, 8.0 mg/l at Industrial estate, Tarapur & TPS, Durgapur, Chandrapur, 7.0 mg/l at Mira- Bhayander, Vasai & MSW site, Taloja, Raigad. The concentration of Nitrate is observed in the range of 0.08- 35.0 mg/l. The quality of ground water in Daman, Maharashtra and Gujarat is presented in Annexure-I Table 20.7.
20.10 Status of Ground Water Quality in Rajasthan
The water quality monitoring of ground water in Rajasthan is carried out by State Pollution Control Board. pH of groundwater is observed in the range of 6.9-8.8 and meet the water quality criteria. The conductivity varies from 200-16,900 µmhos/cm and is not meeting the desired criteria at well of Bhopal Singh, 24 km. from Pali Town (16,900 µmhos/cm), well U/s 1 km from Jodhpur Town (15,700 µmhos/cm), Village Vinayakia, Jodhpur( Hukum Singh Rathore) (10,200 µmhos/cm), Near Khanpura Talab, Ajmer( 9100 µmhos/cm), well of Loomji Chaudhary, near Nayagaon, Pali (6500 µmhos/cm), Well Kothi in village Bagar Rajput, Alwar (5300 µmhos/cm), Pabupura Road near Civil Airport, Jodhpur( 4500 µmhos/cm ), Village Vinayakia, Jodhpur (Badri Kumhar) (3500 µmhos/cm), Hand pump near Secondary School about 300 metre from Kansua Nallah, Kota (3100 µmhos/cm ), Village Vinayakia, Jodhpur (Hiralal Kumhar) (3000 µmhos/cm ), Outside JLN Hospital, Ajmer (2900 µmhos/cm), Village Harchandpur, Bhiwadi (2900 µmhos/cm), Handpump of Vidhani village, Goner road, Jaipur (2900 µmhos/cm), Hotel Orient Place, Subhas Nagar, Udaipur (2800 µmhos/cm), Opp. Pvt. Bus Stand, Ajmer (2700 µmhos/cm) and near Shree Kalyaneshwar Mahadev Temple, Jaisinghpura Khurd, Jaipur (2500 µmhos/cm). BOD observed in the range of 0.1-6.5 mg/l and the location having BOD more than the criteria is at Well of Bhopal Singh 24 km from Pali town (6.5 mg/l) and at U/s 1 Km. from Jodhpur town (4.6 mg/l). Total
95

96
Coliforms are meeting the desired criteria at all the locations. The quality of ground water in Rajasthan is presented in Annexure-I Table 20.8.
20.11 Status of Ground Water Quality in Uttar Pradesh and Uttaranchal
The ground water quality monitoring in Uttar Pradesh and Uttaranchal is carried out by State Pollution Control Boards. pH of groundwater is observed in the range of 6.2-8.5 and meet the water quality criteria except at M/S Kanoria Chemical, Sonbhadra, U.P. (6.2). Conductivity varies from 410-2439 µmhos/cm. Conductivity is observed high in the well at Roadways Bus Station Unnao (2439 µmhos/cm) and at Sahibabad industrial area Ghaziabad (2260 µmhos/cm). BOD observed high at Sardar Nagar (6.2 mg/l) and Captain Ganj (4.0 mg/l). Total Coliform is meeting the desired criteria. The quality of ground water in Uttar Pradesh and Uttaranchal is presented in Annexure-I Table 20.9.
20.12 Status of Ground Water Quality in West Bengal
State Pollution Control Board carries out the water quality monitoring of ground water in West Bengal. pH of groundwater is observed in the range of 6.5-8.4 and meet the water quality criteria. Conductivity varies from 135-2590 µmhos/cm and meeting the criteria for beneficial uses. BOD is observed in the range of Nil-3.9 mg/l. Total Coliform varies from Nil-900 MPN/100 ml and meeting the desired criteria at all the locations. The quality of ground water in West Bengal is presented in Annexure-I Table 20.10.
20.13 Status of Ground Water Quality in Orissa
State Pollution Control Board carries out the water quality monitoring of ground water in Orissa. pH of groundwater is observed in the range of 7.0-8.4 and meet the water quality criteria. Conductivity varies from 120-1606 µmhos/cm and meeting the desired criteria. The quality of ground water in Orissa is presented in Annexure-I Table 20.11.

Annexure-I
WATER QUALITY DATA-2007
• RIVER BASINS - INDUS, GANGA, BRAHMAPUTRA,
MAHI, SABARMATI, NARMADA, TAPI, MAHANADI,
BRAHMANI AND BAITRANI, SUBARNAREKHA,
GODAVARI, KRISHNA, PENNERU & CAUVERY.
• MEDIUM & MINOR RIVERS, CANALS, CREEKS AND
DRAINS
• STATEWISE - LAKES, TANKS AND PONDS
• STATEWISE - GROUNDWATER

TABLE 4.1 :- WATER QUALITY OF RIVER BEAS - 2007
STA
TIO
N C
OD
E
LOCATIONS
TEMPERATURE ºC
D.O. (mg/l) pH CONDUCTIVITY (µmhos/cm)
C.O.D. (mg/l) B.O.D. (mg/l) NITRATE (mg/l) NITRITE (mg/l) AMMONIA - N (mg/l) FECAL COLIFORM (MPN/100ml) TOTAL COLIFORM (MPN/100ml)
MIN
MA
X
MEA
N
MIN
MA
X
MEA
N
MIN
MA
X
MEA
N
MIN
MA
X
MEA
N
MIN
MA
X
MEA
N
MIN
MA
X
MEA
N
MIN
MA
X
MEA
N
MIN
MA
X
MEA
N
MIN
MA
X
MEA
N
MIN
MA
X
MEA
N
MIN
MA
X
MEA
N
1001 BEAS AT U/S MANALI, H.P. 2 16 10 7.7 11.0 9.4 6.2 7.6 7.1 160 226 182 1.6 1.6 1.6 0.2 0.5 0.4 0.10 0.10 0.10 2 17 7 6 2400 6161002 BEAS AT D/S KULU, H.P. 6 18 12 6.7 11.2 9.2 7.5 7.7 7.6 134 201 176 2.8 2.8 2.8 0.4 1.0 0.6 0.10 0.20 0.20 6 17 14 17 2400 12321003 BEAS AT D/S AUT, H.P. 7 18 13 7.8 11.0 9.1 7.0 7.5 7.2 179 406 280 1.2 1.2 1.2 0.2 0.9 0.5 0.10 0.20 0.20 9 9 9 6 2400 8351004 BEAS AT U/S PANDON DAM, H.P. 7 18 13 7.9 11.1 9.5 6.5 7.8 7.3 110 205 169 1.6 1.6 1.6 0.2 0.5 0.3 0.08 0.20 0.10 4 14 8 17 2400 673
1005 BEAS AT EXIT OF TUNNEL DEHAL POWER HOUSE, H.P.
6 19 15 9.0 12.8 10.9 7.4 7.9 7.6 184 470 291 1.2 1.2 1.2 0.1 0.2 0.2 0.10 0.20 0.20 2 11 7 7 170 80
1550 BEAS AT U/S MANDI, H.P 7 18 15 8.3 11.0 9.5 7.6 7.9 7.8 100 331 249 2.0 2.0 2.0 0.3 0.5 0.4 0.10 0.20 0.10 2 7 5 6 2400 6411006 BEAS AT D/S MANDI, H.P. 9 19 16 8.0 9.5 8.8 7.1 7.9 7.5 157 401 272 12.0 12.0 12.0 1.2 2.9 1.8 0.10 0.70 0.40 17 2400 700 2400 2400 24001007 BEAS AT D/S ALAMPUR, H.P. 10 23 16 7.2 9.5 8.2 7.8 8.9 8.4 86 337 215 2.0 2.0 2.0 0.3 0.8 0.6 0.11 0.40 0.30 1.12 1.20 1.20 2 9 5 9 43 221008 BEAS AT D/S DEHRAGOPIPUR,
H.P.15 26 19 7.7 8.7 8.1 8.2 8.6 8.4 141 341 237 3.0 12.0 7.5 0.1 0.9 0.6 0.10 0.80 0.40 1.80 2.20 2.00 2 11 5 14 49 28
1009 BEAS AT D/S PONG DAM, H.P. 17 19 18 4.2 8.0 6.6 7.6 8.4 8.1 143 204 181 2.0 3.0 2.5 0.1 0.8 0.5 0.20 0.50 0.30 1.12 1.20 1.20 4 8 6 12 41 291693 BEAS AT TALWARA H/W, PUNJAB 12 20 18 7.8 8.0 7.9 7.4 8.0 7.8 200 310 232 1.8 2.0 1.9 0.2 0.2 0.2 0.40 1.80 1.20 0.20 0.80 0.60 0.40 0.40 0.40 0 7 2 23 35 32
1694 BEAS AT U/S PATHANKOT, PUNJAB
13 21 17 7.6 7.9 7.8 7.4 7.7 7.6 212 224 217 3.4 38.0 21.0 0.4 1.1 0.8 1.00 1.80 1.40 0.40 0.80 0.60 0.60 0.60 0.60 0 50 28 110 350 270
1695 BEAS AT D/S PATHANKOT,PUNJAB
13 22 18 7.4 7.7 7.6 7.3 7.7 7.5 230 236 233 3.8 4.4 4.1 0.6 1.3 0.9 1.00 2.00 1.50 0.40 0.80 0.70 0.30 0.30 0.30 0 50 34 110 500 365
1010 BEAS AT MIRTHAL BRIDGE, GURDASPUR, PUNJAB
7 22 16 7.2 7.6 7.4 7.2 7.7 7.5 228 400 277 3.8 4.4 4.1 0.6 1.3 0.9 1.00 2.20 1.60 0.40 1.00 0.90 0.20 0.20 0.20 0 50 38 70 500 355
1294 BEAS AT 1KM.D/S OF EFFL. DISH. POINT AT MUKERIAN ,PUNJAB
12 22 18 6.8 7.5 7.3 7.6 7.7 7.7 246 286 263 4.1 4.5 4.3 1.0 1.4 1.2 0.80 2.40 1.70 0.40 1.20 0.90 0.40 0.40 0.40 0 110 53 110 1100 553
1011 BEAS AT G.T.ROAD UNDER BDG. NEAR KAPURTHALA, PUNJAB
14 22 18 6.8 8.0 7.4 7.5 7.9 7.7 202 356 293 4.0 8.2 6.1 0.2 0.8 0.5 0.80 1.80 1.40 0.30 1.20 0.90 0.80 0.80 0.80 0 170 98 70 900 493
1696 BEAS AT U/S GOINDWAL, PUNJAB 14 22 18 6.6 7.6 7.1 7.6 7.8 7.7 210 361 287 4.2 8.1 6.2 0.1 0.8 0.6 1.20 2.40 1.70 0.40 1.80 1.00 0.40 0.40 0.40 23 170 73 170 600 405
1012 BEAS AT 100M D/S INDUST. DISCH. GOINDWAL PUNJAB
14 22 18 6.6 7.6 7.0 7.5 7.8 7.6 212 370 291 4.4 8.5 6.5 0.1 0.9 0.6 1.40 2.00 1.70 0.60 1.00 0.80 1.20 1.20 1.20 23 250 106 170 1800 743
1697 BEAS AT HARIKE, PUNJAB 15 22 18 5.9 7.7 6.9 7.6 7.8 7.7 284 419 354 2.1 6.8 5.2 0.2 1.4 0.8 1.60 2.60 2.20 0.80 1.20 1.00 0.40 1.60 1.00 0 50 20 0 350 280
TABLE 4.2 :- WATER QUALITY OF RIVER SATLUJ - 2007
STA
TIO
N C
OD
E
LOCATIONS
TEMPERATURE ºC
D.O. (mg/l) pH CONDUCTIVITY (µmhos/cm)
C.O.D. (mg/l) B.O.D. (mg/l) NITRATE (mg/l) NITRITE (mg/l) AMMONIA - N (mg/l) FECAL COLIFORM (MPN/100ml) TOTAL COLIFORM (MPN/100ml)
MIN
MA
X
MEA
N
MIN
MA
X
MEA
N
MIN
MA
X
MEA
N
MIN
MA
X
MEA
N
MIN
MA
X
MEA
N
MIN
MA
X
MEA
N
MIN
MA
X
MEA
N
MIN
MA
X
MEA
N
MIN
MA
X
MEA
N
MIN
MA
X
MEA
N
MIN
MA
X
MEA
N
1867 RIVER SATLUJ B/C WITH RIVER SPITI AT KHAB, DISTT.KINNAUR, H.P.
5 11 7 8.4 11.5 9.8 7.8 8.2 8.1 252 500 386 4.0 4.0 4.0 0.1 0.1 0.1 0.40 0.90 1.00 0.40 0.90 1.00 3 4 3
1389 SATLUJ AT NEPTHA ZAKHAI, H.P 6 13 9 8.9 11.6 9.9 7.7 8.2 8.0 216 400 312 4.0 4.0 4.0 0.1 0.3 0.2 0.10 0.60 0.00 0.10 0.60 0.00 1 3 2 8 27 15
1086 SATLUJ AT U/S RAMPUR, H.P. 8 16 12 8.9 11.9 10.0 7.4 8.2 7.9 152 346 266 16.0 16.0 16.0 0.1 0.2 0.1 0.30 0.70 1.00 0.30 0.70 1.00 4 29 12 32 162 791087 SATLUJ AT D/S RAMPUR, H.P. 8 16 12 8.2 11.5 9.3 7.5 8.3 8.0 145 269 216 20.0 20.0 20.0 0.1 0.4 0.3 0.40 0.90 1.00 0.40 0.90 1.00 4 42 21 10 180 1011013 SATLUJ AT U/S TATAPANI, H.P. 10 26 17 8.6 11.7 9.7 8.1 8.6 8.3 189 337 273 16.0 16.0 16.0 0.2 0.4 0.3 0.20 0.60 0.00 0.20 0.60 0.00 14 51 25 52 160 89
1014 SATLUJ AT U/S SLAPPER, H.P. 7 18 15 8.9 11.7 10.3 7.5 8.0 7.7 353 462 426 2.8 2.8 2.8 0.3 0.5 0.4 0.10 0.20 0.00 0.10 0.20 0.00 5 14 9 17 540 2691015 SATLUJ AT D/S SLAPPER, H.P. 8 19 15 9.2 12.0 10.4 7.6 8.0 7.8 270 396 355 2.0 2.0 2.0 0.1 0.4 0.2 0.08 0.20 0.00 0.08 0.20 0.00 2 11 7 8 350 1101016 SATLUJ AT D/S BHAKHRA, H.P. 12 26 21 7.7 9.2 8.8 8.0 8.4 8.2 184 244 213 24.0 24.0 24.0 0.1 0.2 0.2 0.20 0.40 0.00 0.20 0.40 0.00 2 8 5 12 36 22
1017 SATLUJ AT 100M U/S OF HEADWORKS, NANGAL, PUNJAB
12 19 17 7.9 8.6 8.3 7.7 7.9 7.8 168 280 244 1.6 1.6 1.6 0.0 0.0 0.0 0.40 1.40 1.00 0.40 1.40 1.00 0.20 0.80 0.50 0 0 0 23 70 41
1018 SATLUJ AT 100M D/S ,NANGAL,PUNJAB
13 20 17 7.8 8.2 8.0 7.7 7.8 7.8 183 288 260 2.0 2.4 2.2 0.2 0.6 0.4 1.00 2.00 2.00 1.00 2.00 2.00 0.60 1.00 0.80 0 9 2 110 110 110
1293 SATLUJ AT 1 KM. D/S OF ZENITH, PUNJAB
14 21 19 6.2 7.8 7.2 7.4 7.8 7.6 190 392 321 3.0 3.4 3.2 0.4 1.8 1.0 1.80 3.00 3.00 1.80 3.00 3.00 1.00 1.40 1.30 0 900 450 110 2200 1155
1019 SATLUJ AT U/S HEAD WORKS ROPAR, PUNJAB
14 21 19 7.0 7.8 7.5 7.2 7.8 7.5 190 310 278 3.0 3.8 3.4 0.4 1.0 0.7 1.60 2.40 2.00 1.60 2.40 2.00 0.80 1.20 1.00 0 110 55 110 500 305
1380 SATLUJ AT D/S NFL, PUNJAB 13 21 18 7.8 8.0 7.9 7.8 7.9 7.8 178 274 241 1.8 1.8 1.8 0.4 0.4 0.4 0.80 2.00 2.00 0.80 2.00 2.00 0.40 0.80 0.70 0 11 4 70 110 971814 SATLUJ AT D/S KIRATPUR SAHIB,
PUNJAB14 14 14 7.9 7.9 7.9 7.8 7.8 7.8 187 187 187 2.6 2.6 2.6 0.2 0.2 0.2 1.60 1.60 2.00 1.60 1.60 2.00 0.80 0.80 0.80 0 0 0 110 110 110
1690 U/S BUDHA NALLAH (UPPER), PUNJAB
18 24 21 6.2 7.1 6.6 7.1 7.3 7.2 362 416 381 6.0 6.0 6.0 1.0 2.6 1.5 1.60 3.20 2.00 1.60 3.20 2.00 0.60 1.40 0.90 70 500 357 230 1100 777
1020 SATLUJ AT 100M D/S BUDHA NALA CONFL., LUDHIANA, PUNJAB
20 26 23 3.2 7.4 5.5 7.2 7.4 7.3 532 865 699 62.0 76.0 69.0 8.0 28.0 17.9 1.80 5.40 3.00 1.80 5.40 3.00 1.20 2.20 1.50 1100 90000 23600 30000 170000 70000
1021 SATLUJ AT BOAT BDG. DHARMKOTNAKODAR ROAD, JALANDHAR, PUNJAB
20 25 23 4.5 5.6 5.1 7.2 7.4 7.3 448 625 508 42.0 52.0 47.0 6.0 16.0 10.7 2.00 3.60 3.00 2.00 3.60 3.00 0.80 1.40 1.20 500 11000 3400 11000 90000 30750
1381 SATLUJ AT D/S EAST BEIN, PUNJAB
5 22 16 5.6 6.9 6.1 7.3 7.5 7.4 493 500 498 36.0 50.0 43.0 3.2 8.0 4.6 2.80 3.20 3.00 2.80 3.20 3.00 0.20 2.00 1.30 500 1100 950 5000 53000 24750
1691 U/S HUSSANIWALA - H/W FEROZEPUR, PUNJAB
15 20 18 5.8 7.0 6.4 7.6 7.8 7.7 374 408 396 6.6 7.6 7.1 0.8 1.0 0.9 1.20 2.20 2.00 1.20 2.20 2.00 0.60 1.20 0.90 0 100 33 350 500 400
1692 D/S HUSSANIWALA-H/W FEROZEPUR, PUNJAB
15 21 19 5.8 7.0 6.3 7.0 7.8 7.5 378 420 403 6.6 7.6 7.1 0.8 1.8 1.2 2.00 2.40 2.00 2.00 2.40 2.00 1.20 1.20 1.20 0 110 37 350 500 400
1022 SATLUJ AT BRIDGE HARIKE, AMRITSAR, PUNJAB
2 22 13 6.0 7.0 6.5 7.5 7.7 7.6 360 478 413 26.0 26.0 26.0 1.2 4.8 2.7 2.20 3.00 3.00 2.20 3.00 3.00 0.80 1.20 1.00 110 500 370 500 3500 2333
TABLE 4.3 :- WATER QUALITY OF RIVER RAVI, PARVATI, LARGI, SIRSA & SWAN - 2007
STA
TIO
N C
OD
E
LOCATIONS
TEMPERATURE ºC
D.O. (mg/l) pH CONDUCTIVITY (µmhos/cm)
C.O.D. (mg/l) B.O.D. (mg/l) NITRATE (mg/l) NITRITE (mg/l) AMMONIA - N (mg/l) FECAL COLIFORM (MPN/100ml) TOTAL COLIFORM (MPN/100ml)
MIN
MA
X
MEA
N
MIN
MA
X
MEA
N
MIN
MA
X
MEA
N
MIN
MA
X
MEA
N
MIN
MA
X
MEA
N
MIN
MA
X
MEA
N
MIN
MA
X
MEA
N
MIN
MA
X
MEA
N
MIN
MA
X
MEA
N
MIN
MA
X
MEA
N
MIN
MA
X
MEA
N
1089 RAVI AT U/S CHAMBA, H.P. 5 11 9 8.1 10.0 9.2 7.5 8.3 8.1 106 205 144 2.0 2.0 2.0 0.1 0.7 0.4 0.16 0.70 0.40 0.30 1.12 0.70 0 2 1 0 14 51088 RAVI AT U/S MADHOPUR, H.P. 14 18 16 8.2 8.8 8.4 7.6 8.6 8.1 155 217 183 2.0 2.0 2.0 0.2 0.7 0.5 0.46 0.80 0.60 2.20 2.20 2.20 2 4 3 7 23 15
1097 RAVI AT U/S OF MADHOPUR HEADWORKS, GURDASPUR, PUNJAB
12 19 16 7.7 8.0 7.9 7.7 7.9 7.8 192 226 209 2.0 2.0 2.0 0.2 0.4 0.3 0.60 1.20 0.90 0.20 0.80 0.50 35 70 53
1290 PARVATI BEFORE CONF. TO RIVER BEAS, H.P.
7 18 12 9.1 11.0 10.1 6.7 7.4 7.0 122 384 198 1.2 1.2 1.2 0.1 0.3 0.2 0.10 0.30 0.20 0.00 0.00 0.00 4 14 8 4 920 326
1090 LARGI AT D/S, H.P. 6 18 13 8.6 11.3 9.7 7.2 7.9 7.7 169 364 240 1.2 1.2 1.2 0.3 0.6 0.5 0.10 0.20 0.20 0.20 0.20 0.20 4 17 10 6 2400 6351551 RIVER SIRSA , U/S SITOMAJRI
NALLAHGARH, H.P10 31 23 8.5 11.7 9.7 7.2 8.0 7.7 372 431 399 16.0 16.0 16.0 0.4 2.0 1.0 0.30 1.10 0.80 0.30 0.30 0.30 16 50 27 40 200 113
1552 RIVER SIRSA , D/S NALAGARH BRIDGE, H.P
16 39 31 8.2 14.3 10.0 7.7 8.3 8.0 583 927 736 44.0 44.0 44.0 0.8 3.0 2.1 0.72 3.40 2.50 0.00 0.00 0.00 21 160 100 100 650 380
1868 RIVER SIRSA AT D/S NALAGARH DISTT. SOLAN, H.P.
16 38 31 6.6 14.8 9.4 7.8 8.2 8.0 636 939 762 32.0 32.0 32.0 0.9 4.8 2.0 0.62 3.10 2.20 0.00 0.00 0.00 36 180 94 117 610 367
1869 RIVER SWAN AT D/S NANGAL DISTT. UNA, H.P.
14 36 27 2.4 11.1 6.3 7.8 8.6 8.3 389 608 479 48.0 48.0 48.0 0.8 4.8 2.5 0.36 1.20 0.80 0.00 0.00 0.00 46 56 51 130 220 178
TABLE 5.1 :- WATER QUALITY OF RIVER GANGA - 2007
STA
TIO
N C
OD
E
LOCATIONS
TEMPERATURE ºC
D.O. (mg/l) pH CONDUCTIVITY (µmhos/cm)
C.O.D. (mg/l) B.O.D. (mg/l) NITRATE (mg/l) NITRITE (mg/l) AMMONIA - N (mg/l) FECAL COLIFORM (MPN/100ml) TOTAL COLIFORM (MPN/100ml)
MIN
MA
X
MEA
N
MIN
MA
X
MEA
N
MIN
MA
X
MEA
N
MIN
MA
X
MEA
N
MIN
MA
X
MEA
N
MIN
MA
X
MEA
N
MIN
MA
X
MEA
N
MIN
MA
X
MEA
N
MIN
MA
X
MEA
N
MIN
MA
X
MEA
N
MIN
MA
X
MEA
N
1491 BHAGIRATHI AT GANGOTRI, UTTARANCHAL
7 7 7 9.8 9.8 9.8 6.8 7.4 7.1 91 108 100 2.6 2.6 2.6 0.0 0.0 0.0 0 0 0 0 9100 4550
1484 ALKANANDA B/C MANDAKINI AT RUDRA PRAYAG, UTTARANCHAL
4 19 15 7.8 10.0 9.7 7.1 8.4 7.7 95 186 141 6.0 6.0 6.0 0.0 2.1 1.0 0.20 0.30 0.26 0.01 0.01 0.01 0 31000 7993 0 3100000 661571
1485 MANDAKINI B/C ALKALNADA AT RUDRAPRAYAG, UT
4 18 15 8.0 10.0 9.8 7.2 8.2 7.5 58 147 98 4.0 4.0 4.0 0.0 2.1 0.9 0.20 0.40 0.29 1.00 1.00 1.00 30 26000 8757 0 12580000 2180143
1486 ALKANANDA A/C MANDAKINI AT RUDRAPRAYAG, UT
8 18 15 7.5 11.0 10.1 7.2 8.1 7.4 95 180 138 6.0 6.0 6.0 0.0 3.0 1.0 0.20 0.30 0.24 0.02 0.02 0.02 0 12400 3168 0 2500000 384286
1487 ALKANANDA B/C TO BHAGIRATHI AT DEVPRAYAG, UT
5 19 15 6.7 11.0 9.8 7.1 8.6 7.6 120 143 128 6.0 6.0 6.0 0.0 2.5 0.9 0.10 0.20 0.17 0.01 0.01 0.01 0 8900 2403 0 2880000 470571
1488 BHAGIRATHI B/C WITH ALAKNANDA AT DEVPRAYAG, UT
5 19 15 8.3 11.0 9.9 7.1 8.6 7.5 95 177 133 6.0 6.0 6.0 0.0 2.9 1.0 0.20 0.30 0.26 0.01 0.04 0.03 0 240 93 0 1200000 251143
1489 ALKANANDA A/C WITH BHAGIRATHI AT DEVPRAYAG, UT
8 20 16 6.9 10.0 9.5 7.2 8.4 7.6 86 154 118 8.0 8.0 8.0 0.0 2.3 0.9 0.20 0.30 0.24 0.01 0.01 0.01 0 1700 453 0 1870000 290129
1060 GANGA AT RISHIKESH U/S, U.T 12 21 19 8.2 9.6 9.1 6.5 8.5 7.4 275 275 275 12.0 12.0 12.0 0.0 2.1 1.2 17 1700 317
1061 GANGA AT HARIDWAR D/S, U.T 12 23 20 6.2 7.6 6.7 6.1 7.8 6.8 482 482 482 18.0 18.0 18.0 3.0 5.6 3.8 23 23 23 1600 1600 1600
1062 GANGA AT GARHMUKTESHWAR, U.P
12 27 21 7.6 11.0 8.8 7.2 7.6 7.5 95 267 202 13.6 20.0 17.1 1.5 3.5 2.5 0.30 0.60 0.44 150 4000 1724 390 11000 3883
1145 GANGA AT NARORA (BULANDSAHAR), U.P.
11 25 19 7.2 10.0 8.5 7.8 8.6 8.2 141 268 195 16.0 30.0 21.7 1.6 3.7 3.1 262 1800 872 2200 9200 4257
1063 GANGA AT KANNAUJ U/S (RAJGHAT), U.P
16 30 25 6.7 9.3 7.8 7.4 8.8 7.9 25 413 71 2.1 5.0 3.4 0.80 2.80 1.77 0.10 3.30 1.17 1500 2300 2033 4300 9300 8080
1066 GANGA AT KANNAUJ D/S, U.P 15 30 25 6.6 9.9 7.7 7.2 8.6 8.0 25 425 72 2.6 6.0 3.9 1.10 2.90 1.80 0.10 0.10 0.10 2000 7500 3389 9300 15000 10440

T
1146 GANGA AT BITHOOR (KANPUR), U.P.
18 30 26 6.2 8.9 7.5 7.3 8.5 8.0 23 53 37 1.9 3.8 2.7 0.10 2.20 1.42 0.10 1.40 0.53 1500 4300 2150 4300 9300 7544
1067 GANGA AT KANPUR U/S (RANIGHAT), U.P
14 30 25 6.0 11.0 7.7 7.2 8.6 8.1 26 4300 419 2.0 6.4 2.9 0.70 2.90 1.80 900 7500 2633 4300 15000 7580
1068 GANGA AT KANPUR D/S (JAJMAU PUMPING STATION), U.P
14 30 25 1.4 7.6 5.5 7.3 8.4 7.9 26 381 75 3.4 9.8 6.1 2.00 3.80 2.82 0.10 2.00 0.50 20000 46000 32889 43000 93000 76100
1147 GANGA AT DALMAU (RAI BAREILLY), U.P.
16 30 24 7.8 9.6 8.6 7.5 8.2 7.8 233 386 323 19.8 26.1 22.4 3.1 3.5 3.3 0.30 0.70 0.62 0.10 0.50 0.30 0.00 0.10 0.03 3300 6700 4833 4300 7300 5817
1046 GANGA AT ALLAHABAD (RASOOLABAD), U.P.
16 31 26 6.7 10.0 8.3 7.9 8.7 8.2 275 632 426 2.8 4.0 3.2 1.40 2.90 2.06 0.03 0.10 0.08 1100 6000 2950 2400 9000 4925
1049 GANGA AT ALLAHABAD D/S (SANGAM), U.P.
17 31 26 6.7 9.3 8.1 7.5 8.7 8.2 294 568 471 3.1 4.7 3.6 1.70 2.80 2.22 0.10 0.10 0.10 1400 9000 5150 2800 14000 7983
1070 GANGA AT VARANASI U/S (ASSIGHAT), U.P
24 30 26 8.6 9.0 8.8 7.1 7.4 7.3 220 249 234 11.2 11.2 11.2 3.1 3.8 3.3 0.10 0.40 0.30 0.20 0.20 0.20 0.10 0.10 0.10 8000 13000 10000 11000 21000 15000
1071 GANGA AT VARANASI D/S (MALVIYA BRIDGE), U.P
25 31 27 6.4 7.9 7.1 7.4 8.8 8.4 250 390 303 24.4 24.4 24.4 10.0 14.0 11.9 0.20 1.80 1.17 0.40 0.40 0.40 1.40 1.40 1.40 8000 94000 81714 90000 180000 125714
1073 GANGA AT TRIGHAT (GHAZIPUR), U.P
25 31 27 7.9 8.4 8.2 7.9 8.7 8.3 254 390 287 13.2 13.2 13.2 3.4 4.6 4.0 0.20 1.60 1.03 0.60 0.60 0.60 1.50 1.50 1.50 17000 22000 20143 22000 43000 29571
1074 GANGA AT BUXAR,BIHAR 20 21 21 8.6 8.9 8.8 8.2 8.3 8.3 326 362 339 2.0 2.3 2.2 0.60 0.70 0.63 800 5000 2933 1400 9000 64671077 GANGA AT KHURJI, PATNA U/S,
BIHAR18 19 19 9.2 9.2 9.2 7.8 8.3 8.1 350 362 356 2.1 2.1 2.1 0.80 1.00 0.90 5000 9000 7000 16000 16000 16000
1079 GANGA AT PATNA D/S (GANGA BRIDGE),BIHAR
17 18 17 9.1 9.1 9.1 7.7 8.8 8.3 341 365 353 2.3 2.4 2.4 1.00 1.20 1.10 5000 16000 10500 24000 24000 24000
1817 GANGA AT MOKAMA (U/S) 20 21 21 8.8 9.1 9.0 8.2 8.2 8.2 332 355 344 2.0 2.1 2.1 0.70 0.80 0.75 3000 9000 6000 9000 16000 125001815 GANGA AT MOKAMA (D/S) 21 21 21 8.7 8.8 8.8 8.1 8.1 8.1 356 372 364 2.3 2.4 2.4 0.60 0.80 0.70 9000 9000 9000 24000 24000 240001818 GANGA AT MUNGER 18 18 18 9.0 9.0 9.0 8.3 8.3 8.3 385 385 385 2.0 2.0 2.0 0.70 0.70 0.70 5000 5000 5000 9000 9000 90001819 GANGA AT BHAGALPUR 16 16 16 9.3 9.3 9.3 8.3 8.3 8.3 360 360 360 2.1 2.1 2.1 0.80 0.80 0.80 5000 5000 5000 16000 16000 160001816 GANGA AT KAHALGAON 18 19 19 9.0 9.0 9.0 7.2 8.2 7.7 345 345 345 2.1 2.2 2.2 0.70 0.80 0.75 9000 9000 9000 16000 24000 200001080 GANGA AT BAHARAMPORE WES
BENGAL18 33 27 1.6 8.9 6.8 7.0 8.3 7.7 165 330 255 25.0 25.0 25.0 1.0 3.9 2.1 0.10 0.80 0.30 0.00 0.30 0.13 11000 70000 33667 17000 110000 57250
1472 GANGA AT SERAMPORE WEST BENGAL
19 31 27 5.4 8.3 6.5 7.9 8.2 8.1 184 331 256 5.0 5.0 5.0 1.4 2.3 1.8 0.10 0.30 0.20 0.00 0.40 0.13 17000 110000 76750 30000 170000 112500
1053 GANGA AT DAKSHINESHWAR WEST BENGAL
21 31 27 4.4 8.9 6.3 7.5 8.5 7.8 181 386 295 6.6 6.6 6.6 2.3 6.2 4.0 0.10 1.00 0.29 0.10 0.80 0.43 20000 700000 237917 110000 1400000 483750
1471 GANGA AT HOWRAH-SHIVPUR WEST BENGAL
21 31 28 5.1 8.5 6.7 7.7 7.9 7.8 245 350 292 3.0 3.0 3.0 1.4 2.5 2.0 0.10 0.30 0.23 0.10 1.00 0.40 70000 350000 140000 135000 700000 433750
1470 GANGA AT GARDEN REACH WEST BENGAL
29 32 30 5.5 6.9 6.0 7.6 8.1 7.9 211 488 330 8.6 8.6 8.6 2.4 4.1 3.5 0.10 0.30 0.20 0.00 0.60 0.30 20000 700000 382500 135000 1400000 746250
1052 GANGA AT ULUBERIA WEST BENGAL
19 32 27 4.7 8.0 6.3 7.6 8.3 7.9 202 383 293 5.0 5.0 5.0 1.3 4.1 2.7 0.10 1.00 0.39 0.10 0.80 0.40 2000 170000 37917 17000 300000 96167
1054 GANGA AT PALTA WEST BENGAL 21 32 27 5.2 7.5 6.5 7.5 8.3 7.8 168 352 259 28.1 28.1 28.1 0.8 4.2 2.3 0.10 0.50 0.29 0.00 0.40 0.16 50000 110000 75455 70000 220000 134545
1469 GANGA AT DIAMOND HARBOUR WEST BENGAL
29 32 31 5.4 8.2 7.0 7.8 7.9 7.9 215 5040 1835 16.0 16.0 16.0 1.5 3.2 2.2 0.10 0.20 0.17 0.40 0.70 0.60 14000 33000 23000 27000 110000 56667
TABLE 5.2 :- WATER QUALITY OF RIVER YAMUNA - 2007
STA
TIO
N C
OD
E
LOCATIONS
TEMPERATURE ºC
D.O. (mg/l) pH CONDUCTIVITY (µmhos/cm)
C.O.D. (mg/l) B.O.D. (mg/l) NITRATE (mg/l) NITRITE (mg/l) AMMONIA - N (mg/l) FECAL COLIFORM (MPN/100ml) TOTAL COLIFORM (MPN/100ml)
MIN
MA
X
MEA
N
MIN
MA
X
MEA
N
MIN
MA
X
MEA
N
MIN
MA
X
MEA
N
MIN
MA
X
MEA
N
MIN
MA
X
MEA
N
MIN
MA
X
MEA
N
MIN
MA
X
MEA
N
MIN
MA
X
MEA
N
MIN
MA
X
MEA
N
MIN
MA
X
MEA
N
1492 YAMUNOTRI, UTTARANCHAL 7 8 7 11.4 11.4 11.4 7.2 7.3 7.2 57 119 88 2.8 2.8 2.8 0.0 0.0 0.0 0 0 0 0 74000 370001493 SHYAMA CHATTI, UTTARANCHAL 8 10 9 9.0 9.0 9.0 7.2 7.2 7.2 102 110 106 3.0 3.0 3.0 0.0 0.0 0.0 0 0 0 0 165000 82500
1494 YAMUNA AT U/S OF LAKHWAR DAM, U.T.
13 23 18 9.1 10.7 9.8 7.1 8.1 7.4 96 280 213 2.0 10.0 6.0 0.0 1.4 0.7 0.17 0.26 0.21 0.01 0.01 0.01 0 2900 1275 0 370000 86333
1490 YAMUNA AT U/S DAK PATTHAR, UTTRANCHAL
14 24 18 7.1 10.2 8.5 6.9 8.0 7.3 187 303 233 2.0 13.0 8.3 0.0 2.1 1.0 0.22 0.41 0.30 0.01 0.01 0.01 0.21 0.21 0.21 0 39000 12550 0 1030000 363000
1553 U/S PAONTA SAHIB, H.P 14 30 22 6.6 10.6 8.5 6.7 8.3 7.7 148 632 423 1.0 43.0 9.2 0.1 2.0 0.9 0.10 0.20 0.15 0.08 1.10 0.39 240 185000 46582 61000 14500000 28215001554 D/S PAONTA SAHIB, H.P 14 27 22 7.3 8.9 8.2 7.1 8.4 7.8 122 431 309 8.0 8.0 8.0 0.2 0.8 0.5 0.10 0.30 0.20 1.20 1.20 1.201117 HATNIKUND 11 27 20 6.6 13.0 9.2 7.4 8.2 7.7 158 427 301 4.0 36.0 9.8 1.0 2.0 1.2 0.07 0.24 0.15 300 230000 44770 12000 33000000 39096671496 KALANAUR 11 30 23 3.2 10.2 7.6 7.4 8.1 7.7 182 470 366 2.0 20.0 10.0 1.0 5.0 2.0 0.05 0.87 0.33 860 1150000 147880 68000 8700000 27023331119 SONEPAT D/S 9 31 21 4.5 8.8 7.1 7.3 8.3 7.7 190 741 492 6.0 20.0 12.6 1.0 5.0 2.8 0.29 2.18 0.97 800 109000 26165 22000 2500000 6912501120 PALLA 15 32 23 5.5 12.1 8.3 7.4 8.1 7.8 204 664 456 3.0 27.0 13.9 1.0 6.0 3.0 1.05 9.0 3.52 0.05 0.21 0.12 0.09 1.40 0.67 200 26000 5617 16000 17700000 16436671121 NIZAMUDDIN BRIDGE 14 33 25 0.0 2.1 0.3 7.0 7.9 7.5 290 1749 1134 16.0 102 66.6 2.0 47.0 23.8 0.20 3.22 0.91 0.03 0.03 0.03 1.68 28.9 15.0 130000 11500000 3757583 64000 260000000 501720001375 OKHLA BRIDGE (INLET OF AGRA
CANAL), DELHI23 28 25 7.0 7.8 7.4 5.0 8.1 7.2 310 610 453 20.0 20.0 20.0 1.0 3.6 1.9 0.90 0.90 0.90 2.10 2.10 2.10 300 300 300
1812 OKHLA AFTER MEETING SHADHARA DRAIN
0.0 0.5 0.0 6.9 7.8 7.4 12.0 93.0 47.7 490000 23000000 7441667 4700000 320000000 64875000
1497 MAZAWALI 11 30 22 0.0 12.1 2.5 7.2 8.1 7.7 495 1940 1152 25.0 407 94.8 5.0 37.0 17.8 0.87 1.05 0.96 0.02 0.37 0.14 1.51 28.3 13.5 8900 2400000 384742 180000 27000000 49425001123 MATHURA U/S 13 31 24 3.7 7.8 5.8 7.5 8.1 7.8 512 1492 1084 19.0 83.0 40.3 6.0 20.0 10.8 0.75 2.06 1.37 0.03 0.65 0.16 2.39 19.1 9.50 1400 47000 17550 29000 2700000 5203331124 MATHURA D/S 14 34 25 4.2 7.6 5.8 7.5 8.2 7.8 519 1490 1050 18.0 59.0 36.9 4.0 15.0 9.3 0.76 2.45 1.65 0.02 0.65 0.21 2.38 19.5 8.95 8500 240000 50692 370000 5500000 14691671125 AGRA U/S 14 32 24 3.8 14.6 7.0 7.4 8.1 7.8 596 1544 1113 21.0 64.0 36.0 5.0 16.0 10.2 1.32 3.49 1.94 0.03 0.49 0.25 0.23 19.1 8.04 2700 460000 70475 97000 4300000 11840001126 AGRA D/S 15 33 24 0.0 9.0 4.9 7.3 8.2 7.8 540 1503 1071 21.0 99.0 53.4 5.0 33.0 16.7 0.45 4.04 1.97 0.05 1.02 0.39 1.03 15.8 6.88 13100 15000000 1483675 240000 77000000 94250001498 BATESHWAR 16 34 26 3.5 17.7 8.2 7.3 8.3 7.8 612 1689 1137 15.0 108 50.2 3.0 20.0 11.4 0.38 15.7 4.25 2300 210000 43167 32000 6800000 19203331127 ETAWAH 16 34 26 5.7 15.1 10.1 7.5 8.2 7.8 620 1429 1073 15.0 93.0 44.3 3.0 16.0 10.2 0.33 14.3 3.39 2100 270000 38417 42000 6700000 9173331499 JUHIKA 14 34 25 6.5 13.2 9.3 7.4 8.0 7.8 298 735 519 8.0 56.0 21.3 2.0 7.0 4.2 0.17 2.06 0.75 1100 75000 21692 47000 3400000 5679171129 YAMUNA AT ALLAHABAD. U.P. 18 23 21 8.5 8.9 8.7 8.0 8.1 8.0 672 672 672 2.2 2.2 2.2 1.80 1.80 1.80 1100 1100 1100 1700 1700 1700
1069 YAMUNA AT ALLAHABAD D/S (BALUA GHAT), U.P
17 32 27 7.3 10.0 8.5 7.3 8.4 8.1 326 735 564 1.8 3.1 2.5 1.80 2.40 2.13 0.10 0.10 0.10 700 5000 1775 1700 8000 3158
TABLE 5.3 :- WATER QUALITY OF RIVER KALINADI, RAMGANGA, GOMTI, SARYU, GHAGARA, HINDON, KALI-HINDON, RIHAND, RAPTI, GANDAK, SAI, SIKRANA, DAHA, SIRSA AND FARMAR - 20
STA
TIO
N C
OD
E
LOCATIONS
TEMPERATURE ºC
D.O. (mg/l) pH CONDUCTIVITY (µmhos/cm)
C.O.D. (mg/l) B.O.D. (mg/l) NITRATE (mg/l) NITRITE (mg/l) AMMONIA - N (mg/l) FECAL COLIFORM (MPN/100ml) TOTAL COLIFORM (MPN/100ml)
MIN
MA
X
MEA
N
MIN
MA
X
MEA
N
MIN
MA
X
MEA
N
MIN
MA
X
MEA
N
MIN
MA
X
MEA
N
MIN
MA
X
MEA
N
MIN
MA
X
MEA
N
MIN
MA
X
MEA
N
MIN
MA
X
MEA
N
MIN
MA
X
MEA
N
MIN
MA
X
MEA
N
1480 KALI (E)AT GULAWATI 18 30 23 0.0 2.5 0.8 7.3 7.8 7.6 356 423 390 17.0 34.0 23.7 0.39 2.11 1.23 0.01 0.01 0.01 12000 130000 52333 24000 35000000 117580001065 KALI (E) AT KANNAUJ (BEFORE
CONF.),U.P13 28 23 0.0 3.0 0.6 6.9 7.5 7.1 742 1305 988 20.0 120 45.3 0.50 7.40 1.75 1.30 1.30 1.30 4300 160000 94573 17000 310000 217909
1477 KALI (W) AT U/S OF MUZAFFAR NAGAR U.P.
26 29 27 7.9 8.4 8.1 8.1 8.5 8.3 240 301 261 3.4 4.1 3.9 0.20 0.88 0.61 17000 22000 19250 22000 34000 26250
1478 KALI (W) AT D/S OF MUZAFFAR NAGAR, U.P.
20 32 26 0.0 0.0 0.0 6.9 7.5 7.3 1230 1450 1303 22.0 24.0 23.5 7.20 8.40 7.65 1.10 1.60 1.33 31000 46000 39000 220000 270000 247500
1064 RAMGANGA AT KANNAUJ (BEFORE CONF.),U.P
25 25 25 7.8 7.8 7.8 7.6 8.6 8.1 310 1250 919 2.5 14.0 5.9 0.10 0.50 0.25 24 1600 812 18 1600 1424
1351 GOMTI AT LUCKNOW U/S AT WATER INTAKE POINT,U.P.
18 30 27 5.8 9.5 7.7 7.6 8.7 8.0 180 593 322 13.2 13.2 13.2 1.6 3.8 2.5 0.10 0.70 0.48 0.10 0.40 0.16 130 23000 8118 300 31000 11127
1352 GOMTI AT LUCKNOW D/S, U.P. 14 30 23 3.4 10.6 7.2 7.6 8.4 8.1 415 643 494 1.0 3.2 2.0 0.30 0.90 0.58 0.10 0.20 0.15 140 2800 1295 1400 4300 2818
1350 GOMTI AT SITAPUR U/S AT WATER INTAKE, U.P.
16 33 25 7.7 8.4 7.9 7.3 8.4 8.0 240 830 446 12.0 22.0 16.6 1.4 4.2 2.1 0.10 1.00 0.34 0.10 0.10 0.10 50 17000 3456 110 26000 5320
1353 GOMTI AT JAUNPUR D/S, U.P. 18 31 23 1.1 7.5 5.7 7.5 8.0 7.8 325 720 545 12.8 12.8 12.8 1.2 12.0 3.4 0.20 0.90 0.57 0.10 0.10 0.10 1300 90000 16850 2400 160000 299001072 GOMTI AT VARANASI, U.P 17 32 24 5.8 9.3 7.6 7.8 8.8 8.3 218 620 386 19.0 28.0 23.5 1.9 3.0 2.2 0.10 0.86 0.39 0.42 0.70 0.56 60 1400 598 160 2800 13001361 SAI AT UNNAO AFTER DRAIN
OUTFALL, U.P.13 31 25 5.2 12.7 9.0 7.5 9.2 8.3 301 579 430 14.2 14.2 14.2 1.0 2.8 1.5 0.10 0.60 0.36 0.10 0.20 0.12 40 1300 608 230 5000 1869
1354 SARYU AT AYODHYA AT MAIN BATHING GHAT, U.P.
17 29 24 8.4 9.5 8.7 7.0 7.8 7.5 133 350 263 18.0 22.1 20.0 2.4 3.3 2.7 0.20 0.60 0.48 0.10 0.30 0.24 0.00 0.10 0.03 2300 5500 3975 3100 6900 4950
1355 GHAGHARA AT DEORIA D/S, U.P. 16 31 24 7.7 8.0 7.8 7.8 8.3 8.1 306 360 330 12.0 28.0 19.7 1.4 3.0 2.2 0.20 0.86 0.42 0.10 0.10 0.10 0.10 0.42 0.24 50 110 73 110 240 167
1076 GHAGHARA NEAR CHAPRA, BIHAR
17 18 18 9.1 9.3 9.2 8.1 8.8 8.5 218 232 225 2.0 2.0 2.0 0.70 0.70 0.70 900 1400 1150 1700 2800 2250
1357 HINDON AT SAHARANPUR D/S,U.P.
17 32 25 0.0 0.0 0.0 6.9 7.5 7.3 950 1450 1238 160.0 196.0 174 20.0 24.0 22.5 7.00 8.40 7.50 1.10 1.60 1.30 31000 46000 38833 220000 310000 253333
1483 HINDON PURA MAHADEV 20 30 25 0.0 0.0 0.0 7.5 7.8 7.6 308 423 363 11.0 34.0 20.7 0.39 2.11 1.23 0.01 0.01 0.01 8500 130000 51167 49000 35000000 90447501358 HINDON AT GHAZIABAD D/S, U.P. 13 28 23 0.0 3.0 0.8 6.9 7.5 7.1 356 1305 933 60.0 576 139 20.0 120 43.8 0.50 1.60 1.18 4300 160000 87108 17000 280000 197583
1359 RIHAND AT RENUKUT U/S, U.P. 20 33 28 7.6 8.8 8.1 7.3 8.3 7.9 144 316 236 1.4 2.6 2.3 1.30 2.30 1.58 0.10 0.10 0.10 500 2200 1200 1300 3000 2200
1360 RIHAND AT RENUKUT D/S, U.P. 21 33 28 7.3 8.8 8.1 7.6 8.3 8.0 126 400 242 1.0 2.7 2.4 1.60 3.00 1.98 0.10 0.10 0.10 800 2200 1400 1700 3500 2450
1363 RAPTI AFTER CONFL. OF R. HONIN NR. DOMINGARH RLY BRIDGE, GORAKHPUR, U.P.
16 30 23 7.6 7.9 7.8 7.8 8.2 8.1 306 384 336 16.0 24.0 19.4 1.6 3.1 2.2 0.10 0.52 0.25 0.10 0.10 0.10 0.08 0.28 0.17 40 120 81 130 260 184
1078 GANDAK AT SONEPUR, PATNA (BEFORE CONFL.),BIHAR
16 17 17 9.0 9.2 9.1 8.3 8.3 8.3 152 166 159 1.8 1.9 1.9 0.90 0.90 0.90 800 900 850 1400 1700 1550
1820 SIKRANA AT CHANPATIYA 15 15 15 4.0 4.0 4.0 7.9 7.9 7.9 127 127 127 8.0 8.0 8.0 1.00 1.00 1.00 9000 9000 9000 16000 16000 160001821 DAHA AT SIWAM 18 18 18 8.6 8.6 8.6 8.2 8.2 8.2 366 366 366 2.0 2.0 2.0 0.70 0.70 0.70 700 700 700 1700 1700 17001822 SIRSA AT RUXOL 21 21 21 6.5 6.5 6.5 7.4 7.4 7.4 129 129 129 2.0 2.0 2.0 1.10 1.10 1.10 800 800 800 1400 1400 14001824 FARMAR AT JOGBANI 17 17 17 9.0 9.0 9.0 8.1 8.1 8.1 375 375 375 2.1 2.1 2.1 0.70 0.70 0.70 700 700 700 1400 1400 1400
TABLE 5.4 :- WATER QUALITY OF RIVER CHAMBAL, KHAN, KSHIPRA, PARVATI, BETWA, SIND, TONS, SONE, JOHILA, SANKH, MANDAKINI AND GOHAD - 200
STA
TIO
N C
OD
E
LOCATIONS
TEMPERATURE ºC
D.O. (mg/l) pH CONDUCTIVITY (µmhos/cm)
C.O.D. (mg/l) B.O.D. (mg/l) NITRATE (mg/l) NITRITE (mg/l) AMMONIA - N (mg/l) FECAL COLIFORM (MPN/100ml) TOTAL COLIFORM (MPN/100ml)
MIN
MA
X
MEA
N
MIN
MA
X
MEA
N
MIN
MA
X
MEA
N
MIN
MA
X
MEA
N
MIN
MA
X
MEA
N
MIN
MA
X
MEA
N
MIN
MA
X
MEA
N
MIN
MA
X
MEA
N
MIN
MA
X
MEA
N
MIN
MA
X
MEA
N
MIN
MA
X
MEA
N
1356 BETWA BEFORE CONF. YAMUNA AT HAMIRPUR, U.P.
15 30 24 7.0 8.5 7.6 7.0 8.2 7.6 244 360 280 18.1 33.2 26.6 1.3 2.8 2.1 11.1 19.3 15.3 21.0 21.0 21.0 70 90 79 310 360 325
1614 R.BETWA NEAR INTAKE POINT, VIDISHA, M.P
19 27 23 7.5 8.2 7.9 7.2 8.0 7.6 242 348 290 28.0 28.0 28.0 1.2 2.6 1.9 0.10 0.20 0.11 0.00 0.00 0.00 262 2400 980
1735 GOVIND SAGAR, U.P 20 34 26 7.1 8.3 7.7 7.2 8.1 7.7 258 273 266 17.6 26.3 21.3 1.7 1.9 1.8 14.2 21.0 17.6 15.0 15.0 15.0 80 90 84 300 400 333

R
A
R
A
DHUBRI
E
DIMAPUR
TABLE 6.3 :- WATER QUALITY OF RIVER SUBANSIRI, BURHIDING, PAGLDIA, JAI BHARALI, KOLONG, MANAS, DISANG, JHANJI, BHOGDOI, MORA BHARALI, BORAK, DIGBOI, KHARSANG, BHARALU, DEPAR BILL - 200
C
1365 CHAMBAL AT NAGDA U/S (WATE 25 25 25 7.9 7.9 7.9 7.6 8.6 8.1 220 794 523 20.0 20.0 20.0 1.0 3.0 2.0 0.10 7.80 3.95 0.60 0.60 0.60 140 140 140 240 1600 545
1366INTAKE POINT) M.P.CHAMBAL AT NAGDA D/S, M.P. 24 29 26 0.0 7.4 3.7 6.8 8.1 7.6 220 10680 6157 64.0 64.0 64.0 1.0 34.0 17.6 0.10 0.40 0.18 2.00 2.00 2.00 1600 1600 1600 40 1600 1220
1288 CHAMBAL AT KOTA U/S (INTAKE PT. NEAR BARRAGE),
21 33 28 4.2 8.1 5.5 7.5 8.7 8.2 220 450 310 1.7 1.7 1.7 0.2 2.0 1.1 0.10 0.58 0.31 0.00 0.24 0.09 3 7 4 4 28 15
1289RAJASTHANCHAMBAL AT KOTA D/S (2 KM. FROM CITY),RAJASTHAN
19 32 27 3.7 8.4 5.6 8.0 8.8 8.4 230 790 451 13.3 13.3 13.3 0.6 5.3 2.4 0.30 1.02 0.58 0.04 0.30 0.15 4 28 12 14 210 126
1510 TON RIVER, H.P. 14 28 18 7.5 11.6 9.0 7.3 8.1 7.6 56 441 217 4.0 8.0 6.0 0.2 1.0 0.6 0.17 0.44 0.28 0.01 0.02 0.01 0.00 0.00 0.00 5 12100 2764 26 1310000 2997391609 R. CHAMBAL AT DHOLPUR, M.P 16 29 23 6.8 7.9 7.5 7.3 7.9 7.6 327 701 472 33.6 33.6 33.6 1.2 1.2 1.2 0.10 1.50 0.55 0.20 0.20 0.20
1376 CHAMBAL AT ETAWAH BEFORE CONFL. TO R. YAMUNA, U.P.
14 32 25 6.7 13.3 8.2 7.4 8.0 7.7 254 547 440 3.0 41.0 12.8 1.0 4.0 2.0 0.14 1.22 0.47 1400 22000 5633 7000 8700000 1092250
1413 CHAMBAL AT RAMESHWARGHAT NR. SAWAIMADHOPUR, RAJASTHAN
19 33 28 2.6 6.8 5.3 7.8 8.8 8.1 220 810 459 5.8 5.8 5.8 0.6 4.3 1.9 0.22 1.40 0.49 0.04 2.00 0.36 4 14 6 14 210 50
1418 CHAMBAL AT GANDHI SAGAR DAM, RAMPURA, MP
23 30 26 7.4 7.8 7.6 7.5 8.2 8.0 310 610 453 20.0 20.0 20.0 1.0 3.6 2.3 0.90 0.90 0.90 2.10 2.10 2.10 110 300 210
1607 GOHAD DAM, GOHAD, M.P 20 33 27 7.8 8.4 8.0 7.3 8.1 7.8 500 830 589 16.8 16.8 16.8 1.5 2.1 1.8 0.10 1.00 0.381611 R.JOHILA NEAR NAROJABAD
NEAR UMARIA ROAD BRIDGE, 21 21 21 8.2 8.2 8.2 7.4 7.4 7.4 1580 1580 1580 1.6 1.6 1.6 0.10 0.10 0.10 50 50 50 170 170 170
1367M.PKHAN AT KABIT KHEDI (NEAR 25 30 27 0.0 0.0 0.0 7.4 8.5 7.9 1219 2261 1813 200 490 345 50.0 125 77.5 10.2 42.0 22.0 0.10 0.30 0.20 15.0 15.0 15.0 20 40 31 1600 19700 8380
1613INDORE) M.P.KOLAR DAM WATER SUPPLY INTAKE WELL, DISTT. SEHORE,
19 35 25 7.1 8.6 7.7 7.1 7.7 7.4 210 298 257 28.5 28.5 28.5 0.8 1.6 1.2 0.0 0.0 0.0 28 2400 272
1369M.PKSHIPRA AT RAMGHAT AT 25 30 28 7.1 8.6 7.9 7.1 8.7 8.2 360 1290 973 40.0 40.0 40.0 3.9 15.0 8.0 0.10 6.90 1.00 1.20 1.20 1.20 1600 1600 1600 1600 1600 1600
1370UJJAIN, M.P.KSHIPRA AT TRIVENISANGAM (1 KM. D/S OF SANGAM), M.P.
24 24 24 7.8 7.8 7.8 7.6 8.6 8.1 310 1250 928 40.0 40.0 40.0 2.5 14.0 5.9 0.10 0.30 0.18 1.40 1.40 1.40 24 1600 812 18 1600 1424
1468 KSHIPRA AT SIDDHAWAT (D/S) 26 26 26 8.4 8.4 8.4 7.4 8.8 8.1 332 1200 980 64.0 64.0 64.0 3.5 8.0 6.2 0.10 0.40 0.28 1.50 1.50 1.50 1600 1600 1600 1600 1600 1600
1372OF UJJAIN.,M.P.MANDAKINI AT CHITRAKUT, M.P. 8.5 8.5 8.5 104 104 104 5.0 5.0 5.0 0.60 0.60 0.60 54 54 54 174 174 174
1432 PARVATI NEAR VILLAGE 20 20 20 9.2 9.2 9.2 8.5 8.5 8.5 2.0 2.0 2.0
1615BATAODAPAR, M.P.R.PARVATI NEAR INTAKE POINT PILLUKHEDI DISTT. RAJGARH,
22 27 25 4.3 8.8 7.4 7.5 8.6 8.0 278 991 569 48.4 48.4 48.4 1.2 4.5 2.6 0.10 0.20 0.13 0.20 0.20 0.20 0.00 0.00 0.00 340 2400 1479
1433M.PSANKH AT TIGRA RESERVOIR, 19 27 23 7.1 7.8 7.5 7.3 8.1 7.7 210 390 313 1.2 1.8 1.5 0.10 0.40 0.21
1608M.P.R. SINDH AT DABRA, M.P 26 30 28 7.9 8.0 8.0 6.9 7.8 7.4 612 755 667 33.6 33.6 33.6 0.20 0.60 0.37
1075 SONE AT KOELWAR, BIHAR 20 20 20 9.0 9.0 9.0 8.8 8.8 8.8 127 218 172 2.0 2.2 2.1 0.70 0.80 0.75 900 5000 2950 1700 9000 53501142 SONE AT CHACHAI, M.P. 22 22 22 6.6 6.6 6.6 7.1 7.1 7.1 237 237 237 1.4 1.4 1.4 0.20 0.20 0.20 33 33 33 150 150 1501143 TONS AT CHAKGHAT, M.P. 22 22 22 6.7 6.7 6.7 7.2 7.2 7.2 284 284 284 1.5 1.5 1.5 0.20 0.20 0.20 40 40 40 170 170 1701144 TONS AT MADHAVGARH, M.P. 8.0 8.0 8.0 1991 1991 1991 8.0 8.0 8.0 0.80 0.80 0.80 36 36 36 174 174 174
TABLE 5.5 :- WATER QUALITY OF RIVER DAMODAR, RUPNARAYAN, BARAKAR AND MAHANANDA - 200
STA
TIO
N C
OD
E
LOCATIONS
TEMPERATURE ºC
D.O. (mg/l) pH CONDUCTIVITY (µmhos/cm)
C.O.D. (mg/l) B.O.D. (mg/l) NITRATE (mg/l) NITRITE (mg/l) AMMONIA - N (mg/l) FECAL COLIFORM (MPN/100ml) TOTAL COLIFORM (MPN/100ml)
MIN
MA
X
MEA
N
MIN
MA
X
MEA
N
MIN
MA
X
MEA
N
MIN
MA
X
MEA
N
MIN
MA
X
MEA
N
MIN
MA
X
MEA
N
MIN
MA
X
MEA
N
MIN
MA
X
MEA
N
MIN
MA
X
MEA
N
MIN
MA
X
MEA
N
MIN
MA
X
MEA
N
1331 DAMODAR AT DISHERGARH VILL.(NR.BIHAR-WEST BENGAL BORDER) WEST BENGAL
20 35 28 7.0 8.8 8.0 6.7 8.0 7.4 108 238 174 0.6 2.4 1.4 0.20 0.70 0.35 0.10 0.50 0.33 800 50000 7527 1100 160000 24045
1332 DAMODAR AT D/S OF IISCO AFTER 3RD OUTFALL AT DHENNVILLAGE, WEST BENGAL
20 36 28 7.0 9.9 8.2 6.9 8.6 7.8 149 295 219 4.4 4.4 4.4 0.7 1.8 1.3 0.10 0.50 0.32 0.10 1.10 0.36 1400 17000 8367 3300 50000 21192
1333 DAMODAR AT NARAINPUR AFTECONFL. OF NUNIA NALLAH, WEST
19 36 29 6.4 9.8 8.0 6.7 8.5 7.7 192 283 235 20.2 20.2 20.2 0.8 4.9 2.0 0.10 0.60 0.40 0.00 0.80 0.26 1400 30000 12564 1700 50000 28064
1334BENGALDAMODAR NEAR MUJHER MANA VILLAGE AFTER CONF. OF TAMLNALLAH, WEST BENGAL
22 36 29 4.5 7.2 6.1 7.0 8.3 7.8 320 549 451 59.8 59.8 59.8 2.1 4.9 3.5 0.10 2.80 0.82 0.60 13.0 4.09 13000 90000 39667 17000 160000 77500
1335 DAMODAR AT HALDIA D/S (2 KM AWAY FROM HALDIA TOWN), WB
22 35 29 3.9 7.4 6.0 5.8 8.2 7.8 269 13840 5691 26.3 26.3 26.3 0.8 4.1 2.5 0.20 0.80 0.51 0.20 1.50 0.58 10000 2500000 586250 20000 4500000 1117083
1336 BARAKAR AT ASANSOL (WATER INTAKE POINT), WEST BENGAL
21 33 28 6.9 8.6 7.7 6.5 7.8 7.4 136 218 169 26.4 26.4 26.4 2.4 3.0 2.6 0.10 1.00 0.45 0.00 0.30 0.15 17000 50000 34250 35000 160000 128750
1337 RUPNARAYAN BEFORE CONFL. TO RIVER GANGA NEAR GEONKHALI, WEST BENGAL
19 32 28 4.1 8.0 5.9 7.2 8.2 7.9 172 357 236 5.4 5.4 5.4 1.0 2.3 1.6 0.10 0.50 0.28 0.10 0.70 0.33 13000 400000 200750 30000 700000 366250
1946 MAHANANDA AT SILIGURI 29 29 29 5.6 5.6 5.6 7.4 7.4 7.4 162 162 162 6.2 6.2 6.2 1.3 1.3 1.3 0.10 0.10 0.10 0.60 0.60 0.60 4000 4000 4000 22000 22000 22000
TABLE 6.1 :- WATER QUALITY OF RIVER BRAHAMPUTRA - 2007
STA
TIO
N C
OD
E
LOCATIONS
TEMPERATURE ºC
D.O. (mg/l) pH CONDUCTIVITY (µmhos/cm)
C.O.D. (mg/l) B.O.D. (mg/l) NITRATE (mg/l) NITRITE (mg/l) AMMONIA - N (mg/l) FECAL COLIFORM (MPN/100ml) TOTAL COLIFORM (MPN/100ml)
MIN
MA
X
MEA
N
MIN
MA
X
MEA
N
MIN
MA
X
MEA
N
MIN
MA
X
MEA
N
MIN
MA
X
MEA
N
MIN
MA
X
MEA
N
MIN
MA
X
MEA
N
MIN
MA
X
MEA
N
MIN
MA
X
MEA
N
MIN
MA
X
MEA
N
MIN
MA
X
MEA
N
1260 BRAHAMPUTRA AT KHERGHAT (AFTER CONFL. WITH DIBANG & DIHANG), ASSAM
20 29 23 5.5 10.0 7.7 6.0 7.9 7.0 107 211 158 6.0 6.0 6.0 0.4 2.4 1.3 0.10 0.20 0.11 0.10 0.10 0.10 0 9300 2267 1 150000 26174
1030 BRAHAMPUTRA AT DIBRUGARH, 21 25 23 6.8 10.2 8.0 6.6 7.6 7.1 111 227 159 5.6 5.6 5.6 0.2 2.5 1.1 0.10 1.00 0.19 0.10 0.10 0.10 300 4300 1119 730 21000 4156
1262ASSAMBRAHAMPUTRA AT NIMATIGHAT, 18 27 22 5.1 8.2 6.8 6.2 7.5 7.0 76 276 158 6.9 6.9 6.9 0.5 2.7 1.7 0.10 1.00 0.19 0.20 0.20 0.20 360 9300 2288 730 46000 9558
1526ASSAMBRAHMPUTRA RIVER AT 18 25 22 6.2 10.6 7.0 6.2 7.6 7.1 85 185 136 4.6 4.6 4.6 0.4 3.1 1.4 0.10 0.10 0.10 0.00 0.00 0.00 360 240000 40660 1500 240001 44092
1031DHENUKHAPAHAR, ASSAMBRAHAMPUTRA AT PANDU, 18 32 24 6.7 9.5 7.8 6.5 7.4 7.1 132 223 167 0.1 2.9 1.2 0.10 2.50 0.35 0 21000 4932 0 240000 48342
1299ASSAMBRAHAMPUTRA AT JOGIJHOGA NEAR BRIDGE, ASSAM
20 31 27 5.1 7.9 6.8 5.9 7.9 7.1 84 645 239 4.6 4.6 4.6 0.2 3.4 1.2 0.10 0.30 0.13 0.00 0.00 0.00 360 2800 1233 910 9300 3593
2069 BRAHMPUTRA RIVER NEAR WATER INTAKE POINT AT KACHARIGHAT, PANBAZAR,
18 31 26 5.9 9.7 7.7 6.7 7.5 7.1 127 220 173 15.4 15.4 15.4 0.5 1.1 0.9 0.10 0.30 0.18 0.00 0.00 0.00 360 720 450 730 7500 2958
2064GUWAHATI, ASSAMBRAHMAPUTRA RIVER AT 19 32 26 6.2 9.2 7.5 6.6 7.2 7.0 131 283 181 9.8 9.8 9.8 1.1 3.3 1.9 0.10 0.10 0.10 0.10 0.10 0.10 360 730 543 730 7500 2660
2067CHANDRAPUR, GUWAHATIBRAHMPUTRA RIVER AT SUALKUCHI, DIST. KAMRUP,
21 28 24 7.3 7.8 7.5 6.8 7.7 7.1 130 188 159 3.1 3.1 3.1 1.3 3.1 2.2 0.10 0.10 0.10 0.00 0.00 0.00 300 360 320 910 1500 1303
2066ASSAMBRAHMAPUTRA RIVER AT 22 30 27 7.0 7.9 7.4 7.0 7.7 7.4 91 167 138 4.5 4.5 4.5 0.7 1.6 1.1 0.10 0.20 0.17 0.00 0.00 0.00 730 2800 1590 2000 15000 7100
TABLE 6.2 :- WATER QUALITY OF RIVER DHANSIRI - 2007
STA
TIO
N C
OD
E
LOCATIONS
TEMPERATURE ºC
D.O. (mg/l) pH CONDUCTIVITY (µmhos/cm)
C.O.D. (mg/l) B.O.D. (mg/l) NITRATE (mg/l) NITRITE (mg/l) AMMONIA - N (mg/l) FECAL COLIFORM (MPN/100ml) TOTAL COLIFORM (MPN/100ml)
MIN
MA
X
MEA
N
MIN
MA
X
MEA
N
MIN
MA
X
MEA
N
MIN
MA
X
MEA
N
MIN
MA
X
MEA
N
MIN
MA
X
MEA
N
MIN
MA
X
MEA
N
MIN
MA
X
MEA
N
MIN
MA
X
MEA
N
MIN
MA
X
MEA
N
MIN
MA
X
MEA
N
1796 DHANSIRI AT FULL NAGARJAN, 19 31 27 5.2 8.0 6.2 6.6 8.5 7.7 46 341 190 0.8 3.6 1.9 1.60 4.60 2.87 1.10 1.10 1.10
1799NAGALANDDHANSIRI AT TOWN BOUNDARY BRIDGE (DIPHU ROAD),
20 35 26 4.0 8.0 5.6 6.5 8.5 7.7 39 415 201 0.8 3.2 2.2 1.70 9.20 4.30 0.50 62.0 16.5
1797NAGALANDDHANSIRI AT BRIDGE NEAR PURANA BAZAAR, NAGALAND
20 32 26 4.0 8.0 6.1 6.5 8.7 7.4 121 259 160 0.8 2.4 1.6 1.20 5.20 2.97 0.50 3.90 1.83
1800 DHANSIRI AT NUTON BASTI, 21 31 25 1.2 5.2 2.7 6.5 7.9 7.1 76 415 201 2.4 4.8 3.7 1.30 8.80 5.03 0.50 1.10 0.70
1798NAGALANDDHANSIRI AT NEAR CHECK GAT(DIMAPUR KHUTKHUTI ROAD),
21 35 28 4.8 7.6 6.2 6.5 9.2 7.9 51 268 151 0.8 3.2 2.0 1.00 5.20 3.27 0.50 1.10 0.70
1259NAGALANDDHANSIRI AT GOLAGHAT, ASSAM 6 30 21 5.6 28.0 12.2 6.8 7.7 7.1 136 220 181 8.9 8.9 8.9 0.3 3.4 1.2 0.10 0.20 0.17 0.80 0.80 0.80 0 730 273 0 1500 840
1928 DHANSIRI AT NAGALAND-ASSAM 20 32 27 4.0 7.6 6.3 6.4 8.2 7.3 134 272 195 0.8 4.0 2.2 1.20 6.40 3.10 0.50 1.10 0.70
1930BORDER, DIMAPURDZU D/S KOHIMA TOWN 18 25 22 5.6 8.0 6.4 6.8 9.3 8.1 179 537 357 0.8 4.4 1.9 1.80 4.90 3.33 0.50 1.60 0.87
1929 CHATHE AT MEDZIPHEMA, 19 29 24 4.8 8.4 6.2 6.5 8.7 7.8 65 133 89 0.8 4.4 2.5 1.80 4.30 2.67 1.10 1.60 1.27
OD
E TEMPERATURE ºC
D.O. (mg/l) pH CONDUCTIVITY (µmhos/cm)
C.O.D. (mg/l) B.O.D. (mg/l) NITRATE (mg/l) NITRITE (mg/l) AMMONIA - N (mg/l) FECAL COLIFORM (MPN/100ml) TOTAL COLIFORM (MPN/100ml)

ASSAM
1229 BOARDER AT KADANADAM
1437 AHMEDABAD, GUJARAT
1236 WITH RIVER NARMADA,M.P.
9 TAPI AT NEPANAGAR M.P. 23 23 23 7.0 7.0 7.0 8.0 8.0 8.0 311 311 311 1.2 1.2 1.2 0.40 0.40 0.40 110 110 110
TABLE 8.1 :- WATER QUALITY OF RIVER SABARMATI & ITS TRIBUTARIES - 2007
TABLE 9.1 :- WATER QUALITY OF RIVER NARMADA & ITS TRIBUTARIES - 2007
TABLE 10.1 :- WATER QUALITY OF RIVER TAPI & ITS TRIBUTARIES - 2007
STA
TIO
N C
LOCATIONS
MIN
MA
X
MEA
N
MIN
MA
X
MEA
N
MIN
MA
X
MEA
N
MIN
MA
X
MEA
N
MIN
MA
X
MEA
N
MIN
MA
X
MEA
N
MIN
MA
X
MEA
N
MIN
MA
X
MEA
N
MIN
MA
X
MEA
N
MIN
MA
X
MEA
N
MIN
MA
X
MEA
N
1261 SUBANSIRI AT GEREKAMUKH,ASSAM,(BEFORE CONFL. WITH BRAH.),ASSAM
20 23 21 6.9 7.7 7.3 7.3 7.6 7.4 77 122 98 6.2 6.2 6.2 1.2 1.6 1.4 0.10 0.10 0.10 0.00 0.00 0.00 0 1500 500 0 15000 5000
2061 RIVER KHARSANG BEFORE CONFLUENCE WITH BURIDIHING NEAR KHARSANG (ASSAM-ARUNANCHAL BORDER)
20 24 22 5.7 12.7 8.2 6.0 7.7 6.9 122 342 236 4.2 4.2 4.2 0.2 1.9 0.8 0.10 0.50 0.23 1.50 1.50 1.50 0 9300 2575 0 9310 2668
2062 BURIDIHING NEAR DULIAJAN AT 22 24 23 6.3 8.9 7.1 6.3 7.7 6.9 204 356 246 7.0 7.0 7.0 0.4 2.3 1.3 0.10 1.00 0.40 0.10 0.10 0.10 0 730 440 0 1500 933
1422D/S, TINSUKIABURHIDIHING AT MARGHERITA, 22 24 23 6.4 8.2 7.0 6.6 7.5 6.9 146 260 208 7.0 7.0 7.0 0.5 7.9 2.6 0.10 1.00 0.33 0.20 0.20 0.20 360 1500 830 730 2800 1765
2065ASSAMPAGLDIA RIVER NEAR NALBARI TOWN, DIST. NALBARI, ASSAM
18 29 24 6.2 8.0 7.2 6.4 7.4 7.0 142 203 172 10.8 10.8 10.8 0.2 1.7 1.0 0.10 0.10 0.10 0.00 0.00 0.00 360 2000 987 730 15000 5910
1530 DIGBOI RIVER AT LAKHIPATHE, RESERVE FOREST, DIGBOI,
22 23 22 6.8 8.7 7.7 6.1 7.5 6.9 205 322 266 25.5 25.5 25.5 0.6 4.4 2.6 0.10 0.10 0.10 0.70 0.70 0.70 0 240000 80667 0 240001 80934
2063ASSAMJAI BHARALI RIVER NEAR BISWANATH CHARALI, SONITPUR
19 24 21 5.3 6.1 5.7 7.4 7.5 7.5 52 102 75 6.2 6.2 6.2 1.0 1.9 1.6 0.10 0.20 0.13 0.00 0.00 0.00 360 730 483 910 3400 1937
2059 KOLONG RIVER AT MARIGAON 20 23 21 7.1 8.2 7.6 6.9 7.6 7.2 81 118 98 8.2 8.2 8.2 1.6 3.9 2.5 0.10 0.20 0.15 0.00 0.00 0.00 0 1500 620 910 2300 1570
2060 MANAS RIVER AT NH-31 CROSSING, BARPETA, DISTRICT
22 30 27 7.5 8.2 7.9 7.2 7.9 7.6 46 472 337 9.6 9.6 9.6 0.6 1.2 0.9 0.10 0.10 0.10 0.00 0.00 0.00 0 910 408 360 3600 1943
2058 DISANG RIVER AT DILLIGHAT, 22 23 22 5.8 9.5 7.4 6.2 7.3 6.8 207 272 244 3.0 3.0 3.0 0.4 1.5 1.0 0.20 0.30 0.25 0.00 0.00 0.00 0 1500 743 1 9300 3344
1298DIBRUGARH DIST., ASSAMDISANG AT GUNDAMGHAT, 19 24 22 6.4 6.9 6.7 7.0 7.5 7.3 128 189 159 1.1 2.1 1.6 0.10 0.10 0.10 0 740 370 730 2000 1365
1258ASSAMJHANJI AT N.H. CROSSING 19 26 23 6.3 7.7 6.7 6.6 7.5 7.2 74 122 91 5.5 5.5 5.5 0.5 1.5 0.9 0.10 1.00 0.35 0.00 0.00 0.00 720 1100 865 1100 2100 1425
1527JORHAT, ASSAMBHOGDOI RIVER AT JORHAT 19 26 23 6.0 7.5 6.5 6.6 7.5 7.1 68 160 122 11.2 11.2 11.2 0.2 1.7 0.9 0.10 0.20 0.13 0.00 0.00 0.00 910 46000 15978 2001 240000 88525
1531,ASSAMMORA BHARALI AT TEZPUR, 18 27 22 5.4 9.3 7.2 7.1 7.5 7.4 83 116 98 4.6 4.6 4.6 1.1 4.5 2.3 0.10 0.10 0.10 0.00 0.00 0.00 730 910 775 1500 2100 1900
1423ASSAMBORAK AT PANCHAGRAM, 18 28 24 6.5 6.8 6.6 6.4 7.4 7.1 37 238 120 4.6 4.6 4.6 0.4 3.5 1.5 0.10 0.20 0.13 0.10 0.10 0.10 0 15000 4353 1500 110000 32125
1528ASSAMBHARALU RIVER AT GUWAHATI 25 32 29 0.0 0.4 0.1 6.8 7.2 7.0 638 777 679 91.5 91.5 91.5 3.5 36.0 21.1 0.10 0.10 0.10 10.6 10.6 10.6 360 240000 62598 730 240001 72183
1529 DEEPAR BILL, ASSAM 20 33 29 5.5 7.6 6.6 7.1 7.3 7.2 139 405 230 32.3 32.3 32.3 0.7 11.0 4.2 0.10 0.10 0.10 0.00 0.00 0.00 0 7300 2005 0 15000 43082068 U/S OF R. KATHAKAL AT
MATIJURI, DIST. HAILAKANDI, 17 28 25 6.0 6.8 6.4 6.6 7.5 7.1 84 146 117 3.1 3.1 3.1 0.3 1.1 0.7 0.10 0.40 0.27 0.10 0.10 0.10 360 9300 2733 2000 46000 16600
TABLE 7 .1 :- WATER QUALITY OF RIVER MAHI & ITS TRIBUTARY - 2007
STA
TIO
N C
OD
E
LOCATIONS
TEMPERATURE ºC
D.O. (mg/l) pH CONDUCTIVITY (µmhos/cm)
C.O.D. (mg/l) B.O.D. (mg/l) NITRATE (mg/l) NITRITE (mg/l) AMMONIA - N (mg/l) FECAL COLIFORM (MPN/100ml) TOTAL COLIFORM (MPN/100ml)
MIN
MA
X
MEA
N
MIN
MA
X
MEA
N
MIN
MA
X
MEA
N
MIN
MA
X
MEA
N
MIN
MA
X
MEA
N
MIN
MA
X
MEA
N
MIN
MA
X
MEA
N
MIN
MA
X
MEA
N
MIN
MA
X
MEA
N
MIN
MA
X
MEA
N
MIN
MA
X
MEA
N
24 24 24 6.8 7.8 7.3 7.6 8.0 7.8 234 422 332 20.0 20.0 20.0 1.2 2.0 1.6 0.10 1.50 0.70 0.10 0.10 0.10 2.80 2.80 2.80 70 160 1181233 MAHI AT BADNAWAR, M.P.MAHI (D/S) CONF WITH R. CHAP (UNDER SAGWARA-SARHI RD.
22 31 27 5.4 8.8 6.4 7.9 8.9 8.3 310 810 498 2.5 2.5 2.5 0.3 3.1 1.4 0.16 1.40 0.49 0.00 0.60 0.20 3 11 6 7 150 29
1232 BDG.),RAJASTHAN
RIVER MAHI AFTER CONF.WITH 25 28 27 7.0 10.8 9.1 7.5 8.6 8.2 249 353 315 7.0 7.0 7.0 1.6 3.9 2.6 0.03 0.15 0.06 0.01 0.05 0.02 0.08 0.08 0.08 2 4 3 3 20 9
1230 ANAS AT PARDI(BANSWADA)
24 31 27 7.2 8.3 7.6 7.5 8.4 8.0 186 590 408 7.0 7.0 7.0 1.4 3.7 2.3 0.09 0.50 0.31 0.10 0.10 0.10 2 4 3 4 21 121863 RIVER MAHI AT UMETA
24 27 26 7.9 10.4 8.8 7.7 8.4 8.1 199 3720 1493 17.0 17.0 17.0 2.0 5.7 3.8 0.04 0.52 0.32 0.04 0.04 0.04 2 4 3 14 15 151864 RIVER MAHI AT MUJPUR
25 28 26 5.8 10.6 8.4 6.9 8.3 7.9 221 421 335 7.0 7.0 7.0 1.4 4.2 2.2 0.07 0.16 0.10 0.08 0.08 0.08 2 4 3 3 28 101231 RIVER MAHI AT VIRPUR
22 30 27 5.4 10.6 8.3 7.8 8.6 8.3 222 438 361 3.0 3.0 3.0 0.6 3.7 2.3 0.04 0.27 0.09 0.10 0.10 0.10 2 4 3 3 20 94 RIVER MAHI AT SEVALIYA
20 30 26 4.6 10.8 8.4 7.8 8.4 8.2 266 480 407 10.0 10.0 10.0 1.1 7.2 3.2 0.01 0.16 0.09 0.08 0.08 0.08 2 4 3 3 28 105 MAHI AT VASAD
26 27 26 7.5 10.7 9.1 7.7 8.2 8.0 204 370 285 10.0 10.0 10.0 1.9 3.7 2.9 0.04 0.08 0.06 0.08 0.08 0.08 2 4 3 4 15 111237 RIVER PANAM AT LUNAWADA
25 28 27 7.2 10.7 9.1 8.0 8.4 8.3 323 471 400 7.0 7.0 7.0 1.4 3.6 2.6 0.04 0.13 0.07 0.05 0.05 0.05 2 3 3 3 15 101228 RIVER ANAS AT KUSHALGADH
MAHI NEAR RAJASTHAN 25 29 27 6.2 9.9 8.2 7.6 8.4 8.0 208 395 329 10.0 10.0 10.0 0.3 8.2 2.7 0.03 0.09 0.05 0.01 0.05 0.02 0.05 0.05 0.05 2 4 3 3 20 10
STA
TIO
N C
OD
E
LOCATIONS
TEMPERATURE ºC
D.O. (mg/l) pH CONDUCTIVITY (µmhos/cm)
C.O.D. (mg/l) B.O.D. (mg/l) NITRATE (mg/l) NITRITE (mg/l) AMMONIA - N (mg/l) FECAL COLIFORM (MPN/100ml) TOTAL COLIFORM (MPN/100ml)
MIN
MA
X
MEA
N
MIN
MA
X
MEA
N
MIN
MA
X
MEA
N
MIN
MA
X
MEA
N
MIN
MA
X
MEA
N
MIN
MA
X
MEA
N
MIN
MA
X
MEA
N
MIN
MA
X
MEA
N
MIN
MA
X
MEA
N
MIN
MA
X
MEA
N
MIN
MA
X
MEA
N
RIVER SABARMATI AT HANSAOL 27 27 27 6.7 6.7 6.7 7.5 7.5 7.5 744 744 744 15.0 15.0 15.0 1.10 1.10 1.10 2.8 2.8 2.8 15000 15000 15000 43000 43000 430001866 BRIDGE, GUJARAT
SABARMATI AT KHEROJ BRIDGE, 28 28 28 2.4 2.4 2.4 7.7 7.7 7.7 292 292 292 12.0 12.0 12.0 1.10 1.10 1.10 0.6 0.6 0.6 5000 5000 5000 75000 75000 750001221 GUJARAT
SABARMATI AT DHAROI DAM, 4.0 4.0 4.01 GUJARAT
SABARMATI AT AHMEDABAD AT 26 26 26 7.1 7.1 7.1 2270 2270 2270 310 310 310 0.10 0.10 0.10 31.9 31.9 31.9 9300 9300 9300 15000 15000 15000
2 V.N. BRIDGE,GUJARAT
SABARMATI AT RAILWAY BRIDGE 26 26 26 5.6 5.6 5.6 7.4 7.4 7.4 536 536 536 29.0 29.0 29.0 1.10 1.10 1.10 1.7 1.7 1.7 15000 15000 15000 43000 43000 43000
1409 AHMEDABAD, GUJARATSABARMATI AT VILL. MIROLI TALUKA DASCROI, AHMEDABAD,
26 26 26 7.2 7.2 7.2 2920 2920 2920 103 103 103 0.20 0.20 0.20 17.9 17.9 17.9 9300 9300 9300 15000 15000 15000
1408 GUJARATSABARMATI AFTER CONF. WITH MESHWA AT VAUTHA (NEAR
26 26 26 7.5 7.5 7.5 2700 2700 2700 203 203 203 105 105 105 0.10 0.10 0.10 0.56 0.56 0.56 1500 1500 1500 2000 2000 2000
1223 DHOKLA),GUJARAT
1222 SHEDHI AT KHEDA, GUJARATKHARI AT LALI VILLAGE NEAR
2327
2729
2528
3.75.3
6.88.0
5.36.7
7.27.3
7.67.5
7.47.4
710610
7351750
7231180
16.035.0
16.035.0
16.035.0
2.07.0
4.019.0
3.013.0
1.000.10
1.100.70
1.050.40
0.100.30
0.100.30
0.100.30
0.560.6
1.11.12
0.830.86
15200
21009300
10584750
431500
750015000
37728250
STA
TIO
N C
OD
E
LOCATIONS
TEMPERATURE ºC
D.O. (mg/l) pH CONDUCTIVITY (µmhos/cm)
C.O.D. (mg/l) B.O.D. (mg/l) NITRATE (mg/l) NITRITE (mg/l) AMMONIA - N (mg/l) FECAL COLIFORM (MPN/100ml) TOTAL COLIFORM (MPN/100ml)
MIN
MA
X
MEA
N
MIN
MA
X
MEA
N
MIN
MA
X
MEA
N
MIN
MA
X
MEA
N
MIN
MA
X
MEA
N
MIN
MA
X
MEA
N
MIN
MA
X
MEA
N
MIN
MA
X
MEA
N
MIN
MA
X
MEA
N
MIN
MA
X
MEA
N
MIN
MA
X
MEA
N
NARMADA AT MANDLA NEAR 30 30 30 7.8 7.8 7.8 1424 1424 1424 2.4 2.4 2.4 5.20 5.20 5.20 15 15 15 1100 1100 11001241 ROAD BDG. M.P.
6.2 6.2 6.2 8.0 8.0 8.0 284 284 284 3.5 3.5 3.5 1600 1600 160044 NARMADA AT SETHANIGHAT M.P.
NARMADA AT NARSINGHPUR 31 31 31 7.9 7.9 7.9 1629 1629 1629 2.8 2.8 2.8 7.20 7.20 7.20 11 11 11 1100 1100 11001240 M.P.
NARMADA AT HOSHANGABAD 25 25 25 7.6 7.6 7.6 8.8 8.8 8.8 244 244 244 19.3 19.3 19.3 1.6 1.6 1.6 64 64 641234 U/S M.P.
NARMADA AT HOSHANGABAD D 26 26 26 7.1 7.1 7.1 7.5 7.5 7.5 372 372 372 3.0 3.0 3.0 542 542 5421235 S M.P.
NARMADA AT D S OF 24 24 24 7.0 7.0 7.0 7.6 7.6 7.6 276 276 276 1.3 1.3 1.3 0.30 0.30 0.30 1.80 1.80 1.80 140 140 1401430 OMKARESHWAR M.P.
NARMADA AT MANDLESHWAR 28 28 28 7.8 7.8 7.8 8.0 8.0 8.0 302 302 302 1.5 1.5 1.5 0.90 0.90 0.90 0.10 0.10 0.10 1.00 1.00 1.00 140 140 14045 M.P.
28 28 28 7.6 7.6 7.6 8.0 8.0 8.0 323 323 323 1.7 1.7 1.7 0.90 0.90 0.90 0.10 0.10 0.10 1.00 1.00 1.00 170 170 1701431 NARMADA AT MAHESHWAR, M. P.
26 26 26 9.1 9.1 9.1 8.2 8.2 8.2 372 372 372 2.0 2.0 2.0 0.06 0.06 0.06 1.00 1.00 1.00 2 2 2 7 7 71239 NARMADA AT BADWANI, M.P.
NARMADA AT GARUDESHWAR, 19 19 19 10.4 10.4 10.4 8.5 8.5 8.5 263 263 263 10.0 10.0 10.0 2.0 2.0 2.0 0.00 1.00 0.50 4 4 4 21 21 217 GUJARAT
23 29 26 7.1 11.6 8.8 7.9 8.4 8.1 194 361 271 7.0 7.0 7.0 0.6 2.9 2.0 0.04 0.08 0.06 0.08 0.08 0.08 2 4 3 3 28 141245 RIVER NARMADA AT CHANOD
24 30 27 6.4 9.8 8.4 7.3 8.4 8.0 196 351 269 3.0 3.0 3.0 1.3 4.2 2.1 0.05 0.17 0.08 0.10 0.10 0.10 2 4 3 3 28 111244 RIVER NARMADA AT PANETHA
RIVER NARMADA AT 20 30 26 7.0 10.0 8.4 7.7 8.3 8.1 214 13250 1357 10.0 10.0 10.0 0.7 5.0 2.4 0.05 0.12 0.08 0.10 0.10 0.10 2 4 3 3 21 111243 ZADESHWAR
CHOTA TAWA BEFORE CONFL. 25 29 27 6.8 8.0 7.0 7.5 7.6 8.0 352 641 491 1.2 1.4 1.0 0.20 0.70 0.00 0.10 0.10 0.10 140 200 160
STA
TIO
N C
OD
E
LOCATIONS
TEMPERATURE ºC
D.O. (mg/l) pH CONDUCTIVITY (µmhos/cm)
C.O.D. (mg/l) B.O.D. (mg/l) NITRATE (mg/l) NITRITE (mg/l) AMMONIA - N (mg/l) FECAL COLIFORM (MPN/100ml) TOTAL COLIFORM (MPN/100ml)
MIN
MA
X
MEA
N
MIN
MA
X
MEA
N
MIN
MA
X
MEA
N
MIN
MA
X
MEA
N
MIN
MA
X
MEA
N
MIN
MA
X
MEA
N
MIN
MA
X
MEA
N
MIN
MA
X
MEA
N
MIN
MA
X
MEA
N
MIN
MA
X
MEA
N
MIN
MA
X
MEA
N

1907 RANGAVALI D/S OF NAVAPUR
1639 ORISSA
1640 BIRUPA AT CHOUDWAR, ORISSA
TABLE 11.1 :- WATER QUALITY OF RIVER MAHANADI- 2007
TABLE 11. 2 :- WATER QUALITY OF RIVER SEONATH, KHAROON, HASDEO, ARPA, KELO, IB, KUAKHAI, KATHAJODI AND BIRUPA - 2007
TABLE 12.1 :- WATER QUALITY OF RIVER BRAHMANI & ITS TRIBUTARIES - 2007
JHARKAND
10 TAPI AT BURHANPUR M.P. 26 26 26 7.4 7.4 7.4 7.9 7.9 7.9 370 370 370 20.0 20.0 20.0 1.1 1.1 1.1 0.60 0.60 0.60 0.10 0.10 0.10 0.90 0.90 0.90 170 170 170
1250 TAPI AT HATHNUR M.P.TAPI AT AJNAND VILLAGE,
2828
2828
2828
7.43.7
7.43.7
7.43.7
8.48.0
8.48.0
8.48.0
584210
584210
584210
1.625.0
1.625.0
1.625.0
1.401.20
1.401.20
1.401.20 25 25 25
140275
140275
140275
1313 MAHARASHTRATAPI AT BHUSAWAL US 28 28 28 4.4 4.4 4.4 8.0 8.0 8.0 447 447 447 18.0 18.0 18.0 1.70 1.70 1.70 20 20 20 40 40 40
1251 MAHARASHTRATAPI AT UPHAD VILLAGE, 31 31 31 3.9 3.9 3.9 7.7 7.7 7.7 220 220 220 22.0 22.0 22.0 1.10 1.10 1.10 7 7 7 17 17 17
1314 MAHARASHTRATAPI AT UKAI, SHERULA BRIDGE, 32 32 32 5.8 5.8 5.8 8.3 8.3 8.3 370 370 370 3.7 3.7 3.7 0.30 0.30 0.30 0.60 0.60 0.60
46 GUJARAT
1247 TAPI AT MANDAVI, GUJARATTAPI AT KATHORE, (NH-8
3123
3123
3123
8.78.6
8.78.6
8.78.6
8.38.1
8.38.1
8.38.1
351587
351587
351587
3.03.2
3.03.2
3.03.2
0.301.20
0.301.20
0.301.20
0.300.30
0.300.30
0.300.30
43015000
43015000
43015000
75046000
75046000
75046000
47 BRIDGE), GUJARATTAPI AT SURAT U/S KATHORE, 25 25 25 7.4 7.4 7.4 8.4 8.4 8.4 498 498 498 3.0 3.0 3.0 0.90 0.90 0.90 0.80 0.80 0.80 1500 1500 1500 7500 7500 7500
1248 GUJARAT
23 23 23 7.8 7.8 7.8 8.1 8.1 8.1 586 586 586 9.0 9.0 9.0 2.6 2.6 2.6 0.36 0.36 0.36 0.80 0.80 0.80 4300 4300 4300 9300 9300 93001982 TAPI AT RANDER BRIDGE, SURAT
GIRNA AT MALEGAON (MANMAD), 26 26 26 4.0 4.0 4.0 7.3 7.3 7.3 217 217 217 23.0 23.0 23.0 3.00 3.00 3.00 11 11 11 25 25 251253 MAHARASHTRA
GIRNA AT JALGAON, 25 25 25 4.6 4.6 4.6 8.5 8.5 8.5 370 370 370 10.0 10.0 10.0 0.80 0.80 0.80 0.30 0.30 0.30 20 20 20 95 95 951252 MAHARASHTRA
39 39 39 6.0 6.0 6.0 8.4 8.4 8.4 325 325 325 36.0 36.0 36.0 9.0 9.0 9.0 0.20 0.20 0.20 0.60 0.60 0.60 20 20 20 95 95 95
TATI
ON
CO
DE
LOCATIONS
TEMPERATURE ºC
D.O. (mg/l) pH CONDUCTIVITY (µmhos/cm)
C.O.D. (mg/l) B.O.D. (mg/l) NITRATE (mg/l) AMMONIA - N (mg/l)
FECAL COLIFORM (MPN/100ml)
TOTAL COLIFORM (MPN/100ml)
MIN
MA
X
MEA
N
MIN
MA
X
MEA
N
MIN
MA
X
MEA
N
MIN
MA
X
MEA
N
MIN
MA
X
MEA
N
MIN
MA
X
MEA
N
MIN
MA
X
MEA
N
MIN
MA
X
MEA
N
MIN
MA
X
MEA
N
MIN
MA
X
MEA
N
S
1851 MAHANADI AT SIHAWAMAHANADI AT RUDRI U/S AT DHAMTORI
3026
3026
3026
7.87.8
7.87.8
7.87.8
7.37.3
7.37.3
7.37.3
358149
358149
358149
23.02.8
23.02.8
23.02.8
2.62.4
2.62.4
2.62.4
0.460.50
0.460.50
0.460.50
0.09 0.09 0.09 13027
13027
13027
1264 RESERVOIR,CHHATISSGARHMAHANADI AT U/S OF RAJIM, 30 30 30 7.6 7.6 7.6 7.9 7.9 7.9 348 348 348 30.0 30.0 30.0 3.2 3.2 3.2 0.50 0.50 0.50 150 150 150
1099 CHHATISSGARH.
30 30 30 6.4 6.4 6.4 7.7 7.7 7.7 176 176 176 22.6 22.6 22.6 2.8 2.8 2.8 0.78 0.78 0.78 0.26 0.26 0.26 27 27 271852 MAHANADI AT ARRANG, RAIPUR
MAHANADI AT KHARAD 30 30 30 6.9 6.9 6.9 8.5 8.5 8.5 218 218 218 2.4 2.4 2.4 0.16 0.16 0.16 0.86 0.86 0.86 54 54 541100 CHHATISSGARH.
MAHANADI AT SHEORINARAYAN 28 28 28 8.1 8.1 8.1 7.6 7.6 7.6 184 184 184 2.6 2.6 2.6 1.89 1.89 1.89 1.33 1.33 1.33 42 42 42
1282 VILLAGE, CHHATISSGARH.
MAHANADI AFTER CONFL. WITH 27 27 27 7.6 7.6 7.6 8.7 8.7 8.7 188 188 188 2.0 2.0 2.0 1.10 1.10 1.10 1.80 1.80 1.80 32 32 32
1467 RIVER MAND,CHHATISSGARHMAHANADI AT INTERSTATE 28 28 28 7.4 7.4 7.4 8.3 8.3 8.3 142 142 142 3.1 3.1 3.1 1.27 1.27 1.27 1.46 1.46 1.46 210 210 210
1101 BOUNDRY CHHATISSGARH.MAHANADI AT HIRAKUD 26 26 26 6.2 6.2 6.2 8.3 8.3 8.3 200 200 200 13.6 13.6 13.6 2.5 2.5 2.5 0.46 0.46 0.46 0.78 0.78 0.78 1300 1300 1300 1700 1700 1700
1281 RESERVOIR, ORISSAMAHANADI AT SAMBALPUR U/S, 26 26 26 8.0 8.0 8.0 8.3 8.3 8.3 181 181 181 9.7 9.7 9.7 2.2 2.2 2.2 0.50 0.50 0.50 0.56 0.56 0.56 1300 1300 1300 2200 2200 2200
1270 ORISSAMAHANADI AT SAMBALPUR D/S, 33 33 33 7.5 7.5 7.5 7.9 7.9 7.9 210 210 210 20.0 20.0 20.0 3.6 3.6 3.6 0.56 0.56 0.56 13000 13000 13000 35000 35000 35000
1271 ORISSAMAHANADI D/S (AFTER CONFL. WITH R. ONG SONEPUR U/S),
27 27 27 7.2 7.2 7.2 7.7 7.7 7.7 104 104 104 11.6 11.6 11.6 2.0 2.0 2.0 0.27 0.27 0.27 0.45 0.45 0.45 700 700 700 940 940 940
1272 ORISSA
MAHANADI AFTER CONFL. WITH 27 27 27 6.9 6.9 6.9 8.1 8.1 8.1 193 193 193 17.6 17.6 17.6 2.0 2.0 2.0 0.78 0.78 0.78 0.67 0.67 0.67 1100 1100 1100 1700 1700 1700
1274 R.TEL (SONEPUR D/S),ORISSAMAHANADI AT TIKARPADA, 29 29 29 8.5 8.5 8.5 8.2 8.2 8.2 280 280 280 9.0 9.0 9.0 1.8 1.8 1.8 0.56 0.56 0.56 1100 1100 1100 2100 2100 2100
1275 ORISSAMAHANADI AT NARSINGHPUR, 30 30 30 7.2 7.2 7.2 7.5 7.5 7.5 203 203 203 11.2 11.2 11.2 1.2 1.2 1.2 0.11 0.11 0.11 1.01 1.01 1.01 700 700 700 1100 1100 1100
1276 ORISSAMAHANADI AT CUTTACK U/S, 22 22 22 7.9 7.9 7.9 7.5 7.5 7.5 102 102 102 6.0 6.0 6.0 1.7 1.7 1.7 0.42 0.42 0.42 0.41 0.41 0.41 790 790 790 1400 1400 1400
1277 ORISSAMAHANADI AT CUTTACK D/S, 28 28 28 6.9 6.9 6.9 7.7 7.7 7.7 229 229 229 24.0 24.0 24.0 3.1 3.1 3.1 0.84 0.84 0.84 17000 17000 17000 35000 35000 35000
1278 ORISSAMAHANADI AT PARADEEPD/S, 27 27 27 8.9 8.9 8.9 7.5 7.5 7.5 813 813 813 19.0 19.0 19.0 1.6 1.6 1.6 0.14 0.14 0.14 0.84 0.84 0.84 1400 1400 1400 2100 2100 2100
TATI
ON
CO
DE
LOCATIONS
TEMPERATURE ºC
D.O. (mg/l) pH CONDUCTIVITY (µmhos/cm)
C.O.D. (mg/l) B.O.D. (mg/l) NITRATE (mg/l) NITRITE (mg/l) AMMONIA - N (mg/l) FECAL COLIFORM (MPN/100ml) TOTAL COLIFORM (MPN/100ml)
MIN
MA
X
MEA
N
MIN
MA
X
MEA
N
MIN
MA
X
MEA
N
MIN
MA
X
MEA
N
MIN
MA
X
MEA
N
MIN
MA
X
MEA
N
MIN
MA
X
MEA
N
MIN
MA
X
MEA
N
MIN
MA
X
MEA
N
MIN
MA
X
MEA
N
MIN
MA
X
MEA
N
S
SEONATH AT U/S 23 32 26 7.2 8.2 7.1 7.0 7.5 6.9 305 326 291 12.0 12.0 6.0 0.8 7.1 1.4 0.40 0.70 0.60 0.60 0.90 0.70 93 93 47 64 460 194
1107 RAJNANDGAON, CHAATISSGARHSEONATH RIVER WATER SUPPLY 23 30 27 7.2 7.9 7.5 7.5 7.5 7.5 316 330 323 16.0 16.0 16.0 1.1 1.8 1.3 0.50 0.80 0.70 0.70 0.90 0.80 75 460 213
1845 WELL, DURG.SEONATH AT SHIMGA AFTER CONFL. WITH R.
27 32 30 7.1 7.7 7.4 7.4 7.8 7.7 198 352 275 20.0 30.0 24.2 2.6 3.1 2.9 0.30 0.80 0.50 23 210 90
1266 KHAROON,CHHATISSGARHKHAROON AT RAIPUR U/S, 27 31 30 7.4 7.7 7.6 7.3 8.8 7.8 186 387 261 20.0 28.8 23.0 1.3 2.4 2.0 0.20 0.80 0.60 0.00 0.40 0.20 21 140 78
1265 CHHATTISGARHKHAROON RIVER B/C KHAPRI DRAIN, DURG, RAIPUR ROAD
22 30 27 7.4 7.6 7.5 7.5 7.5 7.5 304 327 317 16.0 16.0 16.0 1.0 1.5 1.2 0.60 0.70 0.60 0.70 0.90 0.80 75 460 213
1847 BRIDGEKHAROON RIVER A/C KHAPRI 22 31 27 7.2 7.3 7.2 7.5 7.5 7.5 309 329 322 20.0 20.0 20.0 1.4 1.9 1.6 0.60 0.80 0.70 0.70 1.00 0.80 93 1100 437
1846 DRAINKHAROON RIVER BUNDRI, 27 32 30 7.1 7.8 7.6 7.3 8.9 8.0 140 346 241 20.0 38.0 28.7 2.6 3.0 2.8 0.40 0.80 0.60 0.00 0.80 0.30 21 150 89
1853 RAIPURHASDEO AT U/S 24 26 23 6.2 6.5 5.9 6.9 7.3 6.6 2.1 2.9 2.2 1.00 1.60 1.20 110 270 140
1105 KORBA,CHHATISSGARHHASDEO AT U/S OF 21 35 28 6.2 7.9 7.0 7.7 8.3 8.0 106 329 182 0.3 1.6 0.8 0.20 1.70 1.00 0.10 0.10 0.10 0.80 1.30 1.00 15 68 37
1106 CHAMPA,CHHATISSGARH
27 28 28 6.9 7.1 7.0 6.9 6.9 6.9 7 7 7 1.0 1.1 0.9 7.0 7.0 7.0 2.00 2.00 2.00 7.60 8.10 7.90 1.10 1.10 1.10 8 8 8 8 8 81848 ARPA RIVER D/S OF BILASPUR
1849 KELO RIVER U/S OF RAIGARH 21 29 26 6.8 7.9 7.4 7.2 8.1 7.6 72 194 130 1.7 2.9 2.1 1.10 1.20 1.20 1.10 1.40 1.20 43 240 105
1850 KELO RIVER D/S OF RAIGARH 21 29 26 6.7 8.0 7.4 7.2 8.1 7.8 72 198 137 1.8 2.9 2.3 1.10 1.20 1.20 1.10 1.40 1.30 72 240 137
1267 IB AT SUNDARGARH, ORISSAIB AT JHARSUGUDA (INTAKE),
2322
3738
3029
6.67.0
8.78.7
7.87.9
7.47.2
8.08.3
7.67.6
7561
155187
121131
6.06.0
14.216.6
9.710.5
0.30.5
2.31.8
1.01.1
0.100.20
0.700.30
0.200.20
0.400.30
1.101.10
0.800.70
330330
14001700
8121051
790790
79002800
19471832
1268 ORISSA
22 38 29 5.9 9.4 8.0 7.0 8.2 7.6 71 165 137 6.0 15.9 10.7 0.5 2.0 1.0 0.10 0.20 0.20 0.50 0.80 0.60 320 1400 922 390 2100 13191300 IB AT RAJ NAGAR U/S, ORISSA
IB AT BRAJRAJNAGAR (INTAKE) 22 36 29 5.8 8.2 7.5 7.2 8.1 7.6 81 298 172 6.0 25.2 14.6 0.8 2.2 1.4 0.10 0.60 0.20 0.60 2.20 0.90 230 2700 1648 1700 4900 29441269 D/S, ORISSA
KUAKHAI AT BHUBANESWAR D/S, 21 34 27 5.7 8.2 7.2 7.1 8.2 7.7 88 283 209 16.0 36.0 21.8 2.3 4.0 3.1 0.30 3.40 1.30 0.50 2.80 1.20 1400 17000 5856 2100 35000 127221280 ORISSA
KUAKHAI AT BHUBANESWAR U/S, 22 36 27 5.0 8.6 7.2 7.2 8.6 7.8 76 258 173 4.0 18.0 11.1 0.2 1.8 1.3 0.10 0.30 0.20 0.20 1.10 0.70 460 1100 830 1100 2200 14891279 ORISSA
KATHAJODI AT CUTTACK D/S, 23 34 28 6.0 8.3 7.1 7.5 8.5 7.9 95 382 218 18.0 36.0 26.2 2.3 4.2 3.5 0.10 0.30 0.20 0.40 1.70 1.00 24000 92000 54889 54000 160000 1214221301 ORISSA
26 33 29 6.6 9.1 7.8 7.2 8.2 7.7 1289 32800 20747 8.0 42.0 31.2 0.8 4.0 2.3 0.20 0.20 0.20 0.60 1.10 0.80 680 1700 1065 1400 2600 1975
TATI
ON
CO
DE
LOCATIONS
TEMPERATURE ºC
D.O. (mg/l) pH CONDUCTIVITY (µmhos/cm)
C.O.D. (mg/l) B.O.D. (mg/l) NITRATE (mg/l) NITRITE (mg/l) AMMONIA - N (mg/l) FECAL COLIFORM (MPN/100ml) TOTAL COLIFORM (MPN/100ml)
MIN
MA
X
MEA
N
MIN
MA
X
MEA
N
MIN
MA
X
MEA
N
MIN
MA
X
MEA
N
MIN
MA
X
MEA
N
MIN
MA
X
MEA
N
MIN
MA
X
MEA
N
MIN
MA
X
MEA
N
MIN
MA
X
MEA
N
MIN
MA
X
MEA
N
MIN
MA
X
MEA
N
1037
S
BRAHMANI AT U/S PANPOSH, 24 35 28 6.5 8.6 7.6 7.3 8.3 8.0 110 174 151 5.7 14.0 10.0 0.6 2.0 1.3 0.11 0.54 0.37 0.56 1.68 0.96 110 1200 656 210 1700 981
1038ORISSABRAHMANI AT D/S PANPOSH, 23 35 29 5.5 7.5 6.9 7.1 8.2 7.7 164 324 262 20.0 38.0 26.2 1.4 4.8 3.5 0.25 6.00 2.12 0.21 0.21 0.21 0.56 1.4 1.00 4600 22000 12800 7900 54000 25913
1302ORISSABRAHMANI AT ROURKELA D/S, 22 38 29 6.6 7.7 7.3 7.4 8.2 7.8 91 269 210 16.0 36.0 23.2 0.8 3.4 2.6 0.10 2.83 1.23 0.56 1.4 0.95 4900 13000 9063 7900 35000 16863
1039ORISSABRAHMANI AT BONAIGARH, 23 33 27 7.0 8.0 7.6 7.8 8.0 7.9 158 245 189 6.0 10.0 7.9 0.7 1.8 1.1 0.56 1.96 1.06 270 1100 720 390 2200 1230
1040ORISSABRAHMANI AT RENGALI, ORISSA 24 31 27 7.4 8.9 8.1 7.2 8.0 7.7 125 180 145 5.1 10.0 7.0 0.5 1.3 0.8 0.16 0.33 0.25 0.45 1.68 0.9 330 1200 773 1400 1700 1600
1041 BRAHMANI AT SAMAL, ORISSA 24 31 27 7.9 8.9 8.3 7.3 8.0 7.6 132 150 139 9.4 16.0 11.8 0.6 1.8 1.3 0.21 0.41 0.31 0.56 1.4 0.88 630 940 757 1100 1200 1167
1303 BRAHMANI AT TALCHER U/S, 22 39 28 7.1 8.6 7.7 7.2 8.5 7.7 66 181 130 10.0 22.0 16.4 1.0 1.8 1.4 0.12 0.44 0.23 0.56 0.84 0.7 490 1700 1166 1200 2800 2063
1042ORISSABRAHMANI AT KAMALANGA, 26 40 30 6.7 8.4 7.4 6.9 8.4 7.9 134 232 176 12.0 28.0 19.4 1.4 2.8 2.0 0.10 0.40 0.26 0.34 1.68 0.9 1400 2400 1914 2100 9200 4371
1043ORISSABRAHMANI AT BHUBAN, ORISSA 26 33 29 6.4 8.1 7.3 7.8 8.1 8.0 114 252 167 6.0 11.4 7.8 0.4 1.3 0.8 0.22 0.30 0.26 0.62 1.12 0.86 790 1500 1130 1700 2100 1833
1044 BRAHMANI AT DHARMASHALA, 24 27 26 6.8 9.3 8.2 7.6 8.0 7.8 145 223 179 10.0 12.0 11.2 1.0 1.6 1.3 0.35 0.40 0.38 0.67 1.4 0.97 1300 1400 1333 3500 3500 3500
1045ORISSABRAHMANI AT PATTAMUNDAI, 26 34 29 6.4 9.2 7.9 7.2 8.5 7.9 145 574 252 8.0 18.0 12.7 1.0 2.4 1.4 0.13 0.60 0.36 0.56 1.12 0.84 790 1700 1069 1100 2400 1725
1033ORISSAKOEL AT BASIA,DAM 22 39 29 1.8 8.5 7.2 6.7 8.1 7.3 220 410 305 16.0 64.0 34.3 1.1 4.9 2.3 110 350 261 1200 1500 1325
1036U/S,JHARKHANDKOEL AT MANOHARPUR AFTER MEETING KOINA RIVER
23 35 29 6.8 8.3 7.8 7.0 7.8 7.4 153 217 182 8.0 12.0 11.0 0.3 1.2 0.6 1.96 4.12 2.89 0.04 0.48 0.32
1035D/S,JHARKANDKARO AT LOHOJIMI U/S, 21 30 26 6.2 8.5 7.5 6.8 7.6 7.3 180 582 349 20.0 52.0 31.7 0.8 3.2 1.8 200 350 245 750 1500 850

BENGAL
R
1219D/S, A.P.
28 32 29 5.7 6.9 6.3 7.7 8.4 8.1 215 486 281 3.0 3.0 3.0 0.2 6.0 1.0 0.20 0.50 0.40 0.10 0.10 0.10 0.40 0.80 0.50 500 2200 1167 12000 36000 24167
TABLE 12.2 :- WATER QUALITY OF RIVER BAITARNI & ITS TRIBUTARIES - 2007
TABLE 13.1 :- WATER QUALITY OF RIVER SUBARNAREKHA - 2007
TABLE 14.1 :- WATER QUALITY OF RIVER GODAVARI - 2007
TABLE 14.2 :- WATER QUALITY OF RIVER INDRAVTI, SHANKNI, MANER, MANJARA, WARDHA, WAINGANGA, KOLAR, KANHAN, PURNA AND NIRA- 2007
TABLE 15.1 :- WATER QUALITY OF RIVER KRISHNA - 2007
ROAD
1034 SANKH AT BOLBA, JHARKAND 20 35 27 1.9 8.9 7.6 7.1 7.9 7.4 230 462 318 12.0 40.0 27.7 1.0 4.0 2.0 110 350 257 1200 1500 1350
TATI
ON
CO
DE
LOCATIONS
TEMPERATURE ºC
D.O. (mg/l) pH CONDUCTIVITY (µmhos/cm)
C.O.D. (mg/l) B.O.D. (mg/l) NITRATE (mg/l) AMMONIA - N (mg/l)
FECAL COLIFORM (MPN/100ml)
TOTAL COLIFORM (MPN/100ml)
MIN
MA
X
MEA
N
MIN
MA
X
MEA
N
MIN
MA
X
MEA
N
MIN
MA
X
MEA
N
MIN
MA
X
MEA
N
MIN
MA
X
MEA
N
MIN
MA
X
MEA
N
MIN
MA
X
MEA
N
MIN
MA
X
MEA
N
MIN
MA
X
MEA
N
S
1081 BAITARNI AT JODA ORISSA
BAITARNI AT ANANDPUR, ORISSA
22 30 26 6.7 8.8 8.0 7.6 8.2 8.0 143 208 170 7.0 12.0 10.1 0.4 1.4 0.9 0.23 0.23 0.23 0.56 0.84 0.75 220 790 490 790 1100 9431082
1083 BAITARNI AT JAJPUR ORISSA
24
24
30
31
27
27
6.5
6.5
8.0
8.2
7.4
7.4
7.5
7.3
7.6
7.6
7.5
7.4
151
136
158
186
155
164
6.0
12.0
16.9
18.6
9.6
15.5
0.6
1.6
0.7
1.7
0.6
1.6
2.11
0.18
2.11
0.41
2.11
0.29
0.56
0.56
1.4
1.12
0.84
0.77
170
490
1200
2200
720
1363
330
1100
2100
2800
1277
2000
1084 BAITARNI AT CHANDBALI, 25 35 29 5.6 8.4 6.9 7.3 8.2 7.8 210 10330 6400 14.0 19.0 17.0 1.6 2.2 1.9 0.16 0.90 0.53 0.56 1.46 0.95 460 1400 987 1100 2800 1867
1085ORISSABAITARNI AT DHAMRA ORISSA 24 32 27 5.7 7.9 6.9 7.4 8.0 7.8 2110 19450 10447 18.0 20.9 19.6 1.2 1.8 1.5 0.11 0.34 0.23 0.78 0.84 0.82 1100 1300 1233 1700 5400 3167
TATI
ON
CO
DE
LOCATIONS
TEMPERATURE ºC
D.O. (mg/l) pH CONDUCTIVITY (µmhos/cm)
C.O.D. (mg/l) B.O.D. (mg/l) NITRATE (mg/l) AMMONIA - N (mg/l)
FECAL COLIFORM (MPN/100ml)
TOTAL COLIFORM (MPN/100ml)
MIN
MA
X
MEA
N
MIN
MA
X
MEA
N
MIN
MA
X
MEA
N
MIN
MA
X
MEA
N
MIN
MA
X
MEA
N
MIN
MA
X
MEA
N
MIN
MA
X
MEA
N
MIN
MA
X
MEA
N
MIN
MA
X
MEA
N
MIN
MA
X
MEA
N
24
S
SUBARNAREKHA AT 22 37 30 6.6 7.9 7.4 7.4 7.8 7.7 189 278 224 18.0 48.0 30.6 0.9 1.9 1.4 2.42 4.56 3.48 0.86 2.18 1.73
49JAMSHEDPUR, JHARKHANDSUBARNAREKHA AT D/S JAMSHEDPUR, (TATA NAGAR),
23 35 28 4.8 7.0 6.2 7.3 7.8 7.7 214 312 258 32.0 68.0 48.0 1.4 4.4 3.0 3.16 7.18 4.74 3.28 6.86 4.42
48JHARKANDSUBARNAREKHA AT CHANDIL 22 36 29 7.6 8.4 8.1 7.4 7.6 7.5 134 198 175 4.0 16.0 8.0 0.3 0.8 0.6 0.37 3.14 2.17 0.26 3.1 1.13
1641BRIDGE, JHARKAND
SUBARNAREKHA AT RAJGHAT 19 30 25 7.2 7.7 7.5 7.6 7.8 7.7 142 214 189 6.8 12.0 8.6 1.1 1.8 1.4 0.50 1.10 0.70 330 700 497 790 940 840
23NEAR BIHAR BORDER, ORISSASUBARNAREKHA AT RANCHI,(TATISILWAI)
19 33 24 4.6 8.7 5.5 6.0 8.1 6.7 502 740 495 40.0 100 57.5 1.2 8.0 3.5 200 430 269 750 2400 1950
1762JHARKHANDSUBARNAREKHA AT BIHAR - WEST BENGAL BORDER, WEST
29 35 32 5.2 7.2 6.3 6.8 7.8 7.2 310 330 319 33.0 96.0 58.6 1.8 3.8 2.3 280 920 523 540 2400 1100
TATI
ON
CO
DE
LOCATIONS
TEMPERAT D.O. (mg/l) pH CONDUCTIVITY C.O.D. (mg/l) B.O.D. (mg/l) NITRATE (mg/l) NITRITE (mg/l) AMMONIA - N (mg/l) FECAL COLIFORM (MPN/100ml) TOTAL COLIFORM (MPN/100ml)
MIN
MA
X
MEA
N
URE ºC
MIN
MA
X
MEA
N
MIN
MA
X
MEA
N
MIN
(µ
MA
X
mhos/c
MEA
N
m)
MIN
MA
X
MEA
N
MIN
MA
X
MEA
N
MIN
MA
X
MEA
N
MIN
MA
X
MEA
N
MIN
MA
X
MEA
N
MIN
MA
X
MEA
N
MIN
MA
X
MEA
N
1096
S
GODAVARI AT PANCHAVATI AT RAMKUND, MAHARASHTRA
21 37 28 4.7 7.7 5.7 5.9 8.1 7.5 128 458 250 16.0 16.0 16.0 3.0 17.0 8.9 0.10 3.0 1.30 0.00 2.10 0.30 4 550 70 14 1800 492
1095 GODAVARI AT U/S OF GANGAPUDAM, NASIK, MAHARASHTRA
21 36 28 5.9 7.5 6.6 7.2 8.5 7.8 126 311 178 12.0 12.0 12.0 4.0 9.0 5.8 0.10 2.10 0.90 0.00 1.50 0.30 0 13 5 5 40 20
GODAVARI AT NASIK D/S, 1211
1312MAHARASHTRAGODAVARI AT JAYAKWADI DAM, AURNAGABAD, MAHARASHTRA
21
20
37
32
28
27
3.2
5.9
5.9
7.6
4.8
6.8
6.5
7.8
8.2
8.9
7.6
8.2
131
334
549
396
291
371 8.0 8.0 8.0
7.2
2.5
36.0
5.0
15.0
3.9
0.10
0.10
2.90
1.00
1.20
0.40
0.00
0.00
2.90
2.80
0.50
0.30
7
6
250
17
59
8
11
170
1800
350
565
242
GODAVARI AT DHALEGAON, 12MAHARASHTRAGODAVARI AT NANDED,
27 27 27 5.7 7.5 6.9 7.0 8.6 7.9 286 671 386 12.0 12.0 12.0 3.6 5.2 4.5 0.10 2.50 0.70 0.00 5.00 0.57 4 14 7.6 140 300 234
1210MAHARASHTRAGODAVARI AT RAHER,
27 27 27 6.3 7.4 6.9 7.2 8.5 8.1 285 659 407 8.0 8.0 8.0 3.6 5.2 4.3 0.10 2.50 0.80 0.00 1.10 0.20 4 14 8 120 300 232
1209MAHARASHTRAGODAVARI AT MANCHERIAL, A.P.
28 31 29 6.2 7.0 6.7 7.0 8.3 7.9 246 679 490 12.0 12.0 12.0 3.1 5.4 4.2 0.10 1.90 0.70 0.00 1.60 0.20 6 14 9 170 350 243
13
GODAVARI AT POLAVARAM, A.P.
25 29 27 6.3 12.0 8.4 7.2 9.0 8.1 344 918 546 5.0 12.0 10.0 0.2 3.9 2.3 0.10 0.90 0.30 0.10 0.10 0.10 0.00 0.00 0.00 0 3 1 14 460 89
14
GODAVARI AT RAJAHMUNDRY
27 32 29 6.0 7.2 6.5 7.1 7.6 7.3 195 516 268 3.0 3.0 3.0 0.2 0.5 0.3 0.20 0.60 0.40 0.10 3.60 0.50 0 1600 509 8000 28000 18000
1218U/S, A.P.GODAVARI AT RAJAHMUNDRY
27 29 28 6.1 6.7 6.4 7.1 7.9 7.6 190 266 238 2.0 2.0 2.0 0.2 0.4 0.3 0.30 0.60 0.40 0.30 1.20 0.60 0 500 167 18000 22000 20000
TATI
ON
CO
DE
LOCATIONS
TEMPERAT D.O. (mg/l) pH CONDUCTIVITY C.O.D. (mg/l) B.O.D. (mg/l) NITRATE (mg/l) NITRITE (mg/l) AMMONIA - N (mg/l) FECAL COLIFORM (MPN/100ml) TOTAL COLIFORM (MPN/100ml)
MIN
MA
X
MEA
N
URE ºC
MIN
MA
X
MEA
N
MIN
MA
X
MEA
N
MIN
(µ
MA
X
mhos/c
MEA
N
m)
MIN
MA
X
MEA
N
MIN
MA
X
MEA
N
MIN
MA
X
MEA
N
MIN
MA
X
MEA
N
MIN
MA
X
MEA
N
MIN
MA
X
MEA
N
MIN
MA
X
MEA
N
1854
S
INDRAVATI RIVER A/C DANTEWADA RIVER,
22 32 26 6.7 7.8 7.3 7.4 7.9 7.6 44.0 68.0 53.0 2.1 2.8 2.4 0.40 0.40 0.40 0.40 0.50 0.50 8 8 8
1856NELSONNAR, DANTEWADA.SHANKNI RIVER A/C DANKANI RIVER DANTEWADA.
22 33 26 6.5 7.1 6.9 7.0 8.3 7.6 28.2 56.0 45.0 2.0 2.6 2.3 0.30 0.30 0.30 0.40 0.50 0.50 10 10 10
11571781
MANJERA AT RAIPALLU, A.P.
MANJEERA RIVER - NEAR GANAPATHI SUGARS , MEDAK
2525
3131
2828
4.14.0
6.26.0
5.25.1
7.17.1
8.18.7
7.98.0
280288
823510
448389 4.0 4.0 4.0
0.00.0
2.218.0
1.12.4
0.100.10
19.23.30
2.701.20
0.100.10
0.500.10
0.100.10
22
45
33
8011
2500125
28798
DIST., A.PMANJRA AT D/S IN INTAKE POINT 1891TO BIDAR CITYMANER AT WARANGAL U/S, A.P.
25 29 27 8.0 8.4 8.1 7.7 8.7 8.2 300 750 588 11.0 11.0 11.0 1.0 4.0 2.0 0.30 3.80 0.90 0.00 2.80 0.50 0 900 362 17 1600 929
1215
MANER AT SOMNAPALLI, A.P.
26 27 27 2.9 7.3 5.9 7.5 8.3 8.0 113 1108 497 12.0 12.0 12.0 1.9 4.3 2.8 0.40 8.30 4.00 0.10 0.10 0.10 0 3 1 9 150 86
1158
WARDHA AT RAJURA BRIDGE,
25 29 27 6.5 10.5 7.9 7.5 9.2 8.2 312 1006 601 6.0 12.0 8.0 0.7 2.8 1.8 0.10 0.60 0.20 0.10 0.10 0.10 0 3 0 14 1216 179
1212MAHARASHTRAWAINGANGA AT BALAGHAT, M.P.
23 26 24 5.6 6.6 6.0 7.9 8.3 8.1 288 675 478 16.0 16.0 16.0 4.5 6.9 5.8 1.60 2.20 2.00 0.40 3.90 1.60 22 70 48 34 170 136
1213
WAINGANGA AT CHINDWARA,
14 30 23 7.1 7.7 7.5 249 1050 450 1.2 2.7 1.7 0.10 2.10 0.90 0 11 2 7 1100 336
1214M.P.WAINGANGA AFTER CONLUENCE
14 29 21 7.2 7.8 7.6 255 1623 597 1.1 2.7 1.6 0.80 8.20 2.60 0 15 2 39 1100 329
1910WITH KANHANWAINGANGA AT ASHTI,
21 25 24 5.0 6.7 5.6 7.3 8.0 7.7 226 477 336 18.0 18.0 18.0 5.5 8.5 6.7 1.00 2.40 1.70 0.00 3.50 1.20 21 500 170 130 1600 683
11
1908MAHARASHTRAKOLAR BEFORE CONFLUENCE TO KANHAN AT KAMPTEE
20
21
31
25
25
23
4.6
4.8
7.0
5.5
5.5
5.2
7.2
8.0
8.7
8.4
8.1
8.2
211
474
401
651
305
585
14.0
24.0
14.0
24.0
14.0
24.0
4.0
6.0
9.2
9.6
6.6
7.5
0.20
0.40
2.20
2.60
1.10
1.50
0.10
0.10
12.8
2.60
2.30
1.10
14
17
110
23
62
19
33
50
280
240
165
108
1909 KANHAN D/S OF NAGPUR 24 25 25 4.9 6.5 5.5 7.4 8.1 7.7 231 602 422 20.0 20.0 20.0 4.0 9.0 6.7 0.80 1.70 1.30 0.20 3.40 2.20 22 500 201 110 1600 54819131315
PURNA AT DHUPESHWAR
NIRA AT PULGAON COTTON MILL,WARDHA, MAHARASHTRA
242
2835
2724
5.04.6
6.06.2
5.55.5
7.97.8
8.38.6
8.18.2
260288
912538
655428
20.032.0
20.032.0
20.032.0
6.04.5
6.911.5
6.56.9
0.100.10
2.5032.0
0.804.20
0.300.00
3.904.70
1.401.60
5027
300500
143123
240170
900900
498393
TATI
ON
CO
DE
LOCATIONS
TEMPERAT D.O. (mg/l) pH CONDUCTIVITY C.O.D. (mg/l) B.O.D. (mg/l) NITRATE (mg/l) NITRITE (mg/l) AMMONIA - N (mg/l) FECAL COLIFORM (MPN/100ml) TOTAL COLIFORM (MPN/100ml)
MIN
MA
X
MEA
N
URE ºC
MIN
MA
X
MEA
N
MIN
MA
X
MEA
N
MIN
(µ
MA
X
mhos/c
MEA
N
m)
MIN
MA
X
MEA
N
MIN
MA
X
MEA
N
MIN
MA
X
MEA
N
MIN
MA
X
MEA
N
MIN
MA
X
MEA
N
MIN
MA
X
MEA
N
MIN
MA
X
MEA
N
1194
S
KRISHNA AT MAHABALESHWAR DHOM DAM NEAR KOINA DAM,MAHARASHTRA
13 29 22 5.2 6.9 6.5 7.5 8.7 7.9 80 797 178 16.0 16.0 16.0 3.2 8.2 5.4 0.10 1.20 0.57 0.00 2.60 0.41 2 350 54 50 1600 404
KRISHNA AT RAJAPUR WEIR, 1153
36MAHARASHTRAKRISHNA AT KRISHNA BRIDGE, KARAD, MAHARASHTRA
25
19
30
30
28
23
5.1
5.6
6.7
7.0
6.0
6.3
6.7
7.1
7.6
8.7
7.2
7.8
96
69
711
864
357
225 20.0 20.0 20.0
1.6
3.4
4.4
9.8
2.9
6.8
0.40
0.10
2.10
1.70
1.46
0.63
0.10
0.00
0.30
1.20
0.15
0.32
4
6
26
275
10
48
9
85
280
900
113
291
1906 KRISHNA D/S OF ISLAMPUR
KRISHNA AT SANGLI,
23 37 28 5.1 7.6 6.4 6.2 7.6 6.7 108 1160 355 16.0 16.0 16.0 1.2 4.2 2.4 0.30 3.00 1.17 0.10 0.20 0.18 2 14 7 17 110 5537
MAHARASHTRAKRISHNA AT KURUNDWAD IN
22 38 28 3.2 7.8 6.1 6.3 7.7 6.7 176 3166 788 24.0 24.0 24.0 1.4 4.8 2.9 0.10 2.70 1.63 0.10 0.30 0.18 4 26 10 17 220 91
1310
1182KOLHAPUR,MAHARASHTRAKRISHNA AT U/S OF UGARKHURD BARRAGE,KARNATAKA
25
23
33
29
28
26
3.8
3.0
7.2
8.6
5.9
6.1
6.6
7.1
7.8
8.3
7.2
7.8
94
270
667
1220
327
619
32.0
4.0
32.0
4.0
32.0
4.0
1.4
0.1
5.0
9.8
2.9
1.7
0.30
2.60
3.30
21.3
1.53
8.10
0.10
1.10
0.60
1.10
0.17
1.10
2
9
17
1500
8
584
12
95
170
1600
86
1147
1889 KRISHNA - ANKALI BRIDGE ALONG CHIKKODI KAGWAD
24 28 26 4.3 8.5 6.6 7.2 8.5 7.9 310 970 584 4.0 4.0 4.0 0.1 2.1 1.0 3.70 21.1 8.60 80 1600 876 900 1600 1536

1782 HAMSALA DEEVI , GUNTUR DIST, A.P
26 33 29 3.8 7.2 6.3 6.4 8.0 7.5 330 23400 8007 48.0 48.0 48.0 0.6 4.4 1.9 0.1 6.6 2.1 0.10 0.40 0.20 2 21 4 480 3500 1433
1167 BHIMA AT D/S OF BDG. NEAR YADGIR,KARNATAKA
23 34 27 6.0 7.2 6.7 8.0 8.6 8.3 430 820 679 12.0 12.0 12.0 1.0 2.3 1.7 0.10 1.10 0.43 0.00 0.50 0.12 0 1600 783 33 1700 612
1895 KAGINA D/S OF SEWAGE DISPOSAL POINT
27 32 30 5.8 6.8 6.3 7.8 8.5 8.2 510 620 580 19.0 19.0 19.0 1.9 3.2 2.4 0.10 0.30 0.18 0.10 0.50 0.35 0 500 210 220 1600 687
30 PENNAR AT SIDDVATA, NELLORE, A.P.
21 30 25 2.8 6.9 4.3 8.0 8.4 8.2 609 1379 974 10.0 10.0 10.0 0.6 3.0 1.6 0.40 7.60 3.58 0.10 0.10 0.10 4 110 52 14 5000 1886
TABLE 15.2 :- WATER QUALITY OF RIVER PANCHGANGA AND BHIMA - 2007
TABLE 15.3 :- WATER QUALITY OF RIVER GHATPRABHA, MALPRABHA, NIRA, TUNGBHADRA, TUNGA, BHADRA, MUSI, PALLERU, MUNERU, CHANDRABHAGA AND KAGINA - 2007
TABLE 16.1 : - WATER QUALITY OF RIVER PENNAR - 2007
TABLE 17.1 :- WATER QUALITY OF RIVER CAUVERY - 2007
C
URE ºC (µmhos/cm)
1181 KRISHNA AT D/S OF 25 36 30 6.3 13.0 7.5 8.1 9.1 8.4 275 820 477 0.5 1.6 1.2 0.10 0.90 0.37 0.00 0.60 0.20 0 500 131 20 900 298NARAYANPURA DAM,KARNATAKA
1028
1170
KRISHNA AT TINTINI BRIDGE, KARNATAKAKRISHNA AT D/S OF DEVASAGAR
24
25
34
33
28
27
7.0
6.0
10.0
10.0
7.9
7.5
8.0
8.0
8.9
8.8
8.5
8.5
370
440
1410
940
683
720
14.0
10.0
14.0
10.0
14.0
10.0
0.5
1.0
2.0
3.4
1.3
1.8
0.10
0.10
0.30
0.40
0.16
0.21
0.00
0.00
1.20
0.80
0.23
0.20
0
0
1600
900
296
190
8
0
1600
1600
314
398
1784
BDG.,KARNATAKA
THANGADI , MAHABOOBNAGAR 25 32 29 6.7 7.2 7.0 7.4 8.2 7.9 378 845 618 11.0 11.0 11.0 1.2 2.6 1.7 0.80 2.60 1.35 0.10 0.10 0.10 1.80 1.80 1.80 0 3 1 52 210 142DIST., A.P
39
1175
KRISHNA AT GADWAL BRIDGE, A.P.KRISHNA AFTER CONFL. WITH
25
26
33
33
29
28
6.7
6.8
8.2
8.0
7.2
7.5
7.3
7.3
8.3
8.5
7.8
8.0
305
295
870
940
526
608
11.0
12.0
11.0
12.0
11.0
12.0
0.9
1.0
2.3
3.8
1.4
2.6
0.50
0.20
1.90
1.20
0.95
0.46
0.10
0.10
0.10
0.10
0.10
0.10
1.60 1.60 1.60 0
70
3
420
1
168
0
1700
230
71600
115
17058
1465
TUNGABHADRA, SANGAMESHWARAM A.P.KRISHNA AT WADAPALLY AFTER 26 30 27 4.0 6.9 5.1 7.0 8.7 7.7 394 662 501 4.0 4.0 4.0 0.1 2.1 1.0 0.10 5.90 1.36 0.10 0.10 0.10 2 3 3 75 250 100CONFL. WITH R. MUSI, A.P.(SHIFTED FROM 1220)
1786 VEDADRI , GUNTUR DIST., A.P 28 29 29 3.8 7.0 5.7 7.0 8.3 7.6 438 534 472 16.0 16.0 16.0 1.2 1.8 1.5 0.50 5.50 1.78 0.10 0.10 0.10 2 8 3 2400 3000 2688
1787 AMARAVATI , GUNTUR DIST., A.P 32 32 32 5.5 8.8 7.5 7.5 8.5 7.9 440 530 486 16.0 16.0 16.0 1.0 1.8 1.5 0.20 1.50 0.75 0.10 0.10 0.10 2 4 2 2400 16000 5988
25 KRISHNA AT VIJAYWADA, A.P. 27 33 29 4.7 8.6 7.0 7.0 8.0 7.6 176 1223 508 8.0 12.0 10.0 0.8 1.8 1.3 0.60 11.4 4.41 0.10 0.10 0.10 0.00 0.30 0.15 2 12 4 2400 9000 4250
TATI
ON
CO
DE
LOCATIONS
TEMPERAT D.O. (mg/l) pH CONDUCTIVITY C.O.D. (mg/l) B.O.D. (mg/l) NITRATE (mg/l) AMMONIA - N FECAL COLIFORM TOTAL COLIFORM
MIN
MA
X
MEA
N
URE ºC
MIN
MA
X
MEA
N
MIN
MA
X
MEA
N
MIN
(µ
MA
X
mhos/c
MEA
N
m)
MIN
MA
X
MEA
N
MIN
MA
X
MEA
N
MIN
MA
X
MEA
N
MIN
MA
X
(mg/l)
MEA
N
MIN
(M
MA
X
PN/100m
MEA
N
l)
MIN
MA
X
MEA
N
(MPN/100ml)
1311
S
PANCHAGANGA AT 26 32 29 4.2 7.6 6.3 6.4 7.6 7.1 104 483 248 16.0 16.0 16.0 2.2 3.6 2.6 0.30 1.50 0.98 0.10 1.30 0.45 8 17 12 27 350 154ICHALKARANJI, MAHARASHTRA
1904 PANCHAGANGA U/S OF KOLHAPUR TOWN
24 31 27 5.9 7.5 6.6 6.3 8.0 7.2 73 297 134 8.0 8.0 8.0 1.6 2.8 2.1 0.70 2.60 1.27 0.10 0.30 0.13 2 27 10 12 280 102
1905
1189
PANCHAGANGA D/S OF KOLHAPUR TOWNBHIMA AT PUNE U/S VITHALWADI,
24
25
30
30
27
27
2.3
3.0
6.9
4.7
5.2
3.6
6.3
7.1
7.9
7.4
7.1
7.3
91
209
270
434
155
343
16.0
24.0
16.0
24.0
16.0
24.0
2.0
9.8
6.4
16.4
3.8
12.2
0.50
1.60
2.00
2.60
1.15
2.07
0.10
0.00
2.90
2.10
0.43
1.05
9
9
70
35
19
23
34
95
900
350
245
265
1190
MAHARASHTRA
BHIMA AT PUNE, D/S OF 24 29 27 1.7 3.4 2.5 7.0 7.9 7.4 226 515 408 28.0 28.0 28.0 11.4 28.6 18.8 1.20 2.80 1.80 0.00 3.10 1.05 17 350 116 140 1600 629
1191
BUNDGARDEN,MAHARASHTRA
BHIMA AT PARGAON (AFTER 25 31 28 4.5 6.1 5.4 7.4 8.0 7.7 589 1201 788 12.0 12.0 12.0 5.2 16.8 8.9 1.20 1.60 1.38 0.00 3.40 1.80 4 40 18 110 350 178CONFL.WITH MULE MARTHA) MAHARASHTRA.
1192
1188
BHIMA AFTER CONF. WITH DAUNT, MAHARASHTRABHIMA AT NARSINGHPUR,(D/S AF.CONFL.WITH
25
23
30
32
28
25
4.7
4.8
6.3
6.8
5.7
6.0
7.5
7.3
8.2
8.5
7.8
8.1
334
301
1204
4515
753
1088
16.0
16.0
16.0
16.0
16.0
16.0
4.6
3.4
8.8
10.4
6.3
7.2
1.20
0.10
1.60
1.30
1.40
0.57
0.00
0.00
5.80
8.10
3.28
1.42
7
4
350
35
97
18
80
80
1600
350
488
165
R.NIRA),MAHARASHTRA
28
1183
BHIMA AT TAKLI, MAHARASHTRA
BHIMA AT D/S OF ROAD BRIDGE
24
23
29
32
26
27
3.4
5.6
6.9
6.9
5.8
6.5
7.2
7.9
8.5
8.4
8.0
8.2
341
500
1535
1410
816
817
20.0
19.0
20.0
19.0
20.0
19.0
4.4
1.8
10.4
3.4
6.8
2.3
0.10
0.10
3.40
0.70
0.88
0.36
0.00
0.00
11.80
0.50
1.59
0.14
5
0
275
900
65
506
85
80
1600
1600
449
886AT GANGAPUR VILLAGE,KARNATAKA
1184
1888
BHIMA AT FEROZABAD VILLAGE (D/S), KARNATAKABHIMA RIVER AT CONFLUENCE OF JEWARGI TOWN SEWAGE
25
25
34
34
29
29
6.5
6.2
7.0
7.2
6.8
6.6
8.0
8.0
8.8
8.6
8.4
8.4
540
450
1200
1220
768
717
8.0
12.0
8.0
12.0
8.0
12.0
1.0
1.0
2.1
2.0
1.5
1.5
0.10
0.10
1.00
0.80
0.40
0.30
0.00
0.00
0.50
0.50
0.14
0.08
0
0
500
1600
244
532
10
26
1600
1600
793
652
DISPOSAL POINT
TATI
ON
CO
DE
LOCATIONS
TEMPERAT D.O. (mg/l) pH CONDUCTIVITY C.O.D. (mg/l) B.O.D. (mg/l) NITRATE (mg/l) NITRITE (mg/l) AMMONIA - N (mg/l) FECAL COLIFORM (MPN/100ml) TOTAL COLIFORM (MPN/100ml)
MIN
MA
X
MEA
N
URE ºC
MIN
MA
X
MEA
N
MIN
MA
X
MEA
N
MIN
(µ
MA
X
mhos/c
MEA
N
m)
MIN
MA
X
MEA
N
MIN
MA
X
MEA
N
MIN
MA
X
MEA
N
MIN
MA
X
MEA
N
MIN
MA
X
MEA
N
MIN
MA
X
MEA
N
MIN
MA
X
MEA
N
1185
S
GHATPRABHA AT D/S OF 25 36 29 5.2 7.6 6.3 6.5 8.0 7.5 320 950 638 4.0 4.0 4.0 0.5 1.8 1.3 3.90 24.2 11.3 80 500 330 500 1600 900
1163
MUDHOL RD. CROSS BDG., KARNATAKAGHATPRABHA AT W.A. POINT TO 25 29 28 4.2 7.1 5.5 7.1 8.0 7.6 220 430 368 4.0 4.0 4.0 0.2 1.8 1.1 3.50 17.2 8.98 0.10 0.10 0.10 70 600 430 500 1600 1325
1187
GOKAK TOWN,KARNATAKA
MALPRABHA AT D/S OF 19 27 24 4.8 6.6 5.8 7.0 7.6 7.3 150 440 263 8.1 8.1 8.1 0.2 1.6 1.1 1.60 4.30 3.38 200 1500 693 900 1600 1425
1164
KHANAPUR VILLAGE,KARNATAKA
MALPRABHA AT WATER ABSTR. PT. TO HUBLI,DHARWAR,
24 30 26 4.5 7.6 6.2 7.1 7.7 7.5 200 310 248 4.0 4.0 4.0 0.2 1.8 1.0 1.20 5.70 3.10 80 1500 593 140 1600 620
KARNATAKA
1186
1463
MALPRABHA AT D/S OF AIHOLE TOWN, KARNATAKANIRA AT SAROLE BDG.ON PUNE-
24
24
34
30
28
27
6.3
5.7
6.9
7.7
6.7
6.6
6.8
7.3
8.0
8.8
7.5
7.9
380
60
690
283
558
135
8.1
16.0
8.1
16.0
8.1
16.0
1.0
2.8
1.8
9.6
1.3
6.0
2.70
0.10
12.7
1.60
7.63
0.56 0.00 4.80 1.55
100
6
900
225
700
39
1600
120
1600
900
1600
357
38
BANGLORE HIGHWAY, MAHARASHTRATUNGHABHADRA AT HONNALI 24 27 26 7.0 7.4 7.2 6.8 7.9 7.3 170 360 237 0.7 16.5 3.6 0.10 0.60 0.23 0.00 0.20 0.16 23 50 38 30 70 51
1029
BRIDGE, KARNATAKA
TUNGHABHADRA AT 24 32 26 7.3 8.9 8.0 6.8 8.9 7.8 109 680 309 0.6 6.0 2.0 0.10 0.60 0.25 0.10 0.50 0.23 23 50 36 30 60 46HARALAHALLI BRIDGE, KARNATAKA
29
1785
TUNGHABHADRA AT ULLANUR, KARNATAKATUNGABHADRA AT
25
26
28
33
27
28
6.4
5.6
8.2
6.8
7.5
6.4
7.8
7.9
8.9
8.3
8.4
8.1
220
589
1030
866
727
747
16.0
10.0
16.0
10.0
16.0
10.0
0.6
1.8
3.8
3.3
2.1
2.5
0.10
0.20
1.00
5.60
0.47
2.50 0.10 0.10 0.10
0.00 0.50 0.20 0
40
1600
200
533
113
50
1600
1700
9000
1019
4600
1174
MANTHRALAYAM , KURNOOL DIST., A.PTUNGHABHADRA AT KURNOOL 26 34 29 5.6 10.0 7.2 8.0 8.4 8.2 490 1586 1110 10.0 10.0 10.0 1.8 3.0 2.3 0.50 4.80 1.80 0.10 0.10 0.10 6 200 87 27 4800 2707U/S, BAVAPURAM, A.P.
1168
1896
TUNGHA AT D/S OF SHIMOGA TOWN, KARNATAKACONFLUENCE POINT OF TUNGA
24
25
28
27
26
26
6.1
6.3
7.2
7.2
6.7
6.7
7.0
7.0
9.7
7.8
7.4
7.6
130
290
360
460
249
343
0.9
1.8
13.5
3.0
3.0
2.4
0.10
0.10
0.60
0.60
0.25
0.33
0.00
0.00
0.20
0.40
0.18
0.18
30
50
130
80
75
68
50
60
170
110
98
85AND BHADRA AT KUDLI
1091 BHADRA AT MALLESWARAM D/S OF KIOCL KARNATAKA
14 27 23 6.1 7.5 6.7 6.6 7.6 7.2 48 98 78 40.0 40.0 40.0 1.0 2.0 1.2 0.04 2.80 0.49 0.10 0.40 0.20 0.00 3.00 0.66 250 400 321 1300 1800 1617
1387
1169
BHADRA AT D/S OF BHADRAVATHI, KARNATAKABHADRA AT D/S OF KIOCL ROAD
24
23
27
28
26
26
4.6
5.6
7.1
7.1
5.8
6.4
6.7
6.2
7.5
7.9
7.2
7.2
200
200
530
430
348
278
1.4
1.0
22.5
13.5
5.0
3.4
0.10
0.10
0.90
0.60
0.32
0.27
0.00
0.00
0.30
0.20
0.18
0.17
90
50
350
240
239
137
140
70
500
300
335
178BRIDGE, NEAR HOLEHUNNUR,KARNATAKA
1172 MUSI U/S AT HYDERABAD, A.P. 22 30 26 6.8 7.1 7.0 8.0 8.3 8.2 285 435 340 13.0 13.0 13.0 1.1 2.0 1.5 0.40 0.80 0.67 0.10 0.10 0.10 0 0 0 66 190 135
1173
1178
MUSI D/S AT HYDERABAD, A.P.
PALLERU BEFORE CONFL. WITH
20
28
30
31
26
30
0.0
4.0
2.6
8.5
1.0
6.5
6.8
7.2
8.0
8.0
7.6
7.7
956
526
1550
828
1331
665
94.0
12.0
94.0
12.0
94.0
12.0
15.0
0.8
51.0
2.0
21.4
1.3
3.50
0.60
39.5
3.40
9.54
1.73
0.10
0.10
1.50
0.10
0.70
0.10
15.0 15.0 15.0 72
2
550
2
289
2
1440
2200
6500
5000
3263
3038
1177
KRISHNA, JAGGAYYAPET, A.P.
MUNERU BEFORE CONFL. WITH 27 30 29 4.2 8.6 6.6 7.5 8.1 7.8 502 772 645 16.0 16.0 16.0 1.0 1.8 1.3 0.20 0.90 0.58 0.10 0.10 0.10 2 4 2 2400 2800 2625KRISHNA, NANDIGAMA, A.P.
1911 CHANDRABHAGA U/S OF PANDHARPUR TOWN
24 25 24 4.9 6.7 5.8 7.2 8.2 7.7 397 1546 770 12.0 12.0 12.0 4.4 9.6 6.5 0.10 1.40 0.70 0.00 1.20 0.28 4 40 21 70 425 218
1912 CHANDRABHAGA D/S OF PANDHARPUR TOWN
23 25 24 4.7 6.4 5.8 7.3 8.2 7.7 404 1535 791 16.0 16.0 16.0 4.6 10.2 6.8 0.10 1.60 1.03 0.00 0.60 0.20 7 275 67 85 1600 430
TATI
ON
CO
DE
LOCATIONS
TEMPERAT D.O. (mg/l) pH CONDUCTIVITY C.O.D. (mg/l) B.O.D. (mg/l) NITRATE (mg/l) NITRITE (mg/l) AMMONIA - N (mg/l) FECAL COLIFORM (MPN/100ml) TOTAL COLIFORM (MPN/100ml)
MIN
MA
X
MEA
N
URE ºC
MIN
MA
X
MEA
N
MIN
MA
X
MEA
N
MIN
(µ
MA
X
mhos/c
MEA
N
m)
MIN
MA
X
MEA
N
MIN
MA
X
MEA
N
MIN
MA
X
MEA
N
MIN
MA
X
MEA
N
MIN
MA
X
MEA
N
MIN
MA
X
MEA
N
MIN
MA
X
MEA
N
1255
S
PENNAR BEFORE CONFL.WITH CHITRAVATHI,TADPATRI,UNGAN
27 30 28 3.8 6.8 5.3 7.2 8.7 7.8 816 1916 1434 10.0 10.0 10.0 0.5 2.4 1.5 1.10 14.0 9.13 0.10 0.10 0.10 1.00 1.00 1.00 2 63 22 21 2400 658
OOR,A.P.
1256 PENNAR AFTER CONF. WITH PAPAGNI,PUSPAGINI,A.P.
22 31 26 3.1 7.2 4.6 7.3 8.6 8.1 607 1244 828 10.0 10.0 10.0 0.7 3.0 1.6 0.20 8.60 2.68 0.10 0.10 0.10 2 110 50 21 5000 2160
1257 PENNAR AFTER CONF. WITH CHEYYURU,SOMASILE,A.P.
28 31 31 3.6 7.8 6.2 7.0 7.8 7.5 250 1295 504 12.0 12.0 12.0 0.8 2.6 1.2 0.20 0.50 0.36 0.10 0.10 0.10 2 12 4 500 3000 2340
OD
E TEMPERAT D.O. (mg/l) pH CONDUCTIVITY C.O.D. (mg/l) B.O.D. (mg/l) NITRATE (mg/l) NITRITE (mg/l) AMMONIA - N (mg/l) FECAL COLIFORM (MPN/100ml) TOTAL COLIFORM (MPN/100ml)

S
A
1327 CAUVERY AT PITCHAVARAM, TAMILNADU
25 31 29 1.8 8.6 5.9 6.8 8.3 7.6 460 55500 7917 16.0 16.0 16.0 0.1 2.0 1.0 0.10 0.90 0.20 0.10 0.10 0.10 5.00 5.00 5.00 90 3500 689 140 16000 1959
N
1205 BHAVANI AT BHAVANI, TAMILNADU
27 31 29 4.4 8.5 6.8 7.1 8.0 7.6 172 612 427 8.0 8.0 8.0 0.4 4.0 1.4 0.10 0.40 0.10 0.10 0.10 0.10 5.00 5.00 5.00 140 3300 1224 220 22000 3408
BRIDGE SACHIN, GUJARAT
OF PANAJI, GOA
TABLE 17.2 :- WATER QUALITY OF RIVER YAGACHI, HEMAVATI, SHIMSA, AKRAVATI, LAKSHMANTIRTHA, KABBANI, BHAVANI AND AMRAVATI -2007
TABLE 18.1 :- WATER QUALITY OF MEDIUM & MINOR RIVERS IN GUJARAT & DAMAN - 2007
TABLE 18.2 :- WATER QUALITY OF MEDIUM & MINOR RIVERS IN GOA & MAHARASHTRA - 2007
ATI
ON
C
LOCATIONS
MIN
MA
X
MEA
N
MIN
MA
X
MEA
N
MIN
MA
X
MEA
N
MIN
MA
X
MEA
N
MIN
MA
X
MEA
N
MIN
MA
X
MEA
N
MIN
MA
X
MEA
N
MIN
MA
X
MEA
N
MIN
MA
X
MEA
N
MIN
MA
X
MEA
N
MIN
MA
X
MEA
N
ST
1198
1195
CAUVERY AT NAPOKULU BDG (D/S), KARNATAKACAUVERY AT KUSHAL NAGAR U/(NEAR BAICHANAHALLI),
19
21
30
29
25
26
4.5
6.5
8.3
8.4
7.1
7.6
6.8
7.1
8.6
8.6
7.5
7.7
28
50
100
140
58
95
23.0
38.0
23.0
38.0
23.0
38.0
1.0
1.0
1.0
2.0
1.0
1.2
0.10
0.10
0.80
3.30
0.30
0.60
11
15
350
120
82
45
1600
1600
1600
1600
1600
1600
33
KARNATAKA
CAUVERY AT KRS 23 29 26 4.0 12.0 8.6 6.5 8.6 8.0 68 360 236 12.0 12.0 12.0 1.0 2.0 1.1 0.10 0.80 0.40 8 240 50 48 1600 930
1386
DAM,BALAMURIKSHETRA,KARNATAKACAUVERY AT D/S OF KAREKUAR 25 30 27 6.3 12.4 9.1 7.9 8.6 8.3 82 390 253 28.0 28.0 28.0 1.0 1.0 1.0 0.10 0.70 0.40 4 240 66 48 1600 1046
1171
VILLAGE, KARNATAKA
CAUVERY AT SRI 25 30 27 3.1 12.0 8.6 7.8 8.8 8.2 88 400 266 28.0 28.0 28.0 1.0 2.0 1.3 0.10 1.20 0.50 14 280 79 1600 1600 1600
34
RANGAPATTANNA,D/S OF ROAD BDG.,KARNATAKACAUVERY AT SATHYAGALAM 26 30 29 6.7 14.0 9.0 7.7 8.7 8.2 159 410 308 45.0 45.0 45.0 1.0 2.0 1.1 0.20 1.20 0.60 6 79 26 110 1600 825.45BRIDGE, KARNATAKA
50
1322
CAUVERY AT METTUR, TAMIL NADUCAUVERY AT 1KM. D/S OF
24
27
30
31
27
29
4.1
2.4
8.4
8.7
6.2
6.7
7.1
6.9
8.7
8.2
7.8
7.7
272
230
1257
711
465
451
8.0
8.0
8.0
8.0
8.0
8.0
0.2
0.3
3.0
6.0
1.3
1.5
0.10
0.10
1.00
0.50
0.30
0.20
0.10
0.10
1.00
0.20
0.20
0.10
5.00
5.00
5.00
5.00
5.00
5.00
70
110
2200
5000
453
1453
90
270
2800
9000
673
2194
51
BHAVANI RIVER CONFL., TAMILNADUCAUVERY AT PALLIPPALAYAM, 26 30 27 3.8 7.8 5.8 7.3 8.6 7.9 237 610 431 8.0 8.0 8.0 0.6 3.0 1.5 0.10 0.40 0.20 0.01 0.10 0.10 5.00 5.00 5.00 140 2800 794 260 3500 1303
1320
TAMIL NADU
CAUVERY AT ERODE NEAR 28 31 30 0.0 7.8 2.8 7.0 7.9 7.5 276 1835 869 56.0 56.0 56.0 0.8 38.0 13.0 0.10 1.10 0.30 0.10 0.20 0.10 5.00 5.00 5.00 500 17000 4733 800 28000 10375
1323
CHIRAPALAYAM, TAMILNADU
CAUVERY AT VELORE NEAR 26 31 29 4.3 8.4 7.3 7.3 8.6 8.0 270 916 521 8.0 8.0 8.0 0.3 2.0 0.8 0.10 0.40 0.20 0.10 0.10 0.10 5.00 5.00 5.00 60 1100 398 120 1700 700
1324
KATTIPALAYAM, TAMILNADU
CAUVERY AT MOHANUR NEAR 24 30 28 5.7 8.6 7.2 7.1 8.5 7.9 254 988 530 8.0 8.0 8.0 0.2 2.0 0.9 0.10 1.20 0.30 0.10 0.10 0.10 5.00 5.00 5.00 140 1100 468 170 1400 672
1451
PATTAIPALAYAM, TAMILNADU
CAUVERY AT THIRUMUKKUDAL-CONFL. PT.OF R.
30 31 30 6.7 8.2 7.6 7.8 8.5 8.2 360 940 622 8.0 8.0 8.0 0.6 2.0 1.2 0.10 0.25 0.20 0.10 0.10 0.10 5.00 5.00 5.00 20 270 160 40 330 223
AMRAVATI,TAMILNADU
31
1202
CAUVERY AT MUSIRI, TAMIL NADUCAUVERY AT TIRUCHIRAPPALLI
30
30
32
32
31
31
6.8
6.9
8.4
8.3
7.7
7.7
7.4
7.4
8.3
8.5
7.9
8.1
342
306
970
890
641
578
8.0
8.0
8.0
8.0
8.0
8.0
0.5
0.7
2.0
2.0
1.3
1.2
0.10
0.10
0.33
0.19
0.20
0.10
0.10
0.10
0.10
0.10
0.10
0.10
5.00
5.00
5.00
5.00
5.00
5.00
40
90
2200
1700
648
713
140
140
2800
2800
863
1260
1325
U/S, TAMILNADU
CAUVERY AT TIRUCHIRAPPALLI 30 31 30 6.6 7.8 7.0 7.4 8.3 7.9 420 1104 753 8.0 8.0 8.0 0.1 6.0 2.3 0.10 0.30 0.20 0.10 0.10 0.10 5.00 5.00 5.00 140 2200 1188 270 3500 1768
1203
D/S, TAMILNADU
CAUVERY AT TRICHY,GRAND 21 31 28 5.5 8.2 7.3 6.9 8.8 7.9 420 1370 828 16.0 16.0 16.0 0.5 5.0 1.8 0.10 0.40 0.20 0.10 0.10 0.10 5.00 5.00 5.00 60 2800 708 120 3500 1082ANAICUT, TAMILNADU
1206 CAUVERY AT THANJAVUR, TAMILNADU
23 28 26 7.2 8.2 7.7 7.5 8.3 7.8 300 601 414 0.2 1.0 0.5 0.10 0.10 0.10 0.10 0.10 0.10 40 800 323 90 1100 453
1326 CAUVERY AT COLEROON, TAMILNADU
24 32 29 6.7 8.8 7.8 7.5 8.6 7.9 449 56500 10120 16.0 16.0 16.0 0.3 3.0 1.3 0.10 0.30 0.10 0.10 0.30 0.10 70 800 281 80 2800 670
ATI
ON
CO
DE
LOCATIONS
TEMPERAT D.O. (mg/l) pH CONDUCTIVITY C.O.D. (mg/l) B.O.D. (mg/l) NITRATE (mg/l) NITRITE (mg/l) AMMONIA - N (mg/l) FECAL COLIFORM (MPN/100ml) TOTAL COLIFORM (MPN/100ml)
MIN
MA
X
MEA
N
URE ºC
MIN
MA
X
MEA
N
MIN
MA
X
MEA
N
MIN
(µ
MA
X
mhos/c
MEA
N
m)
MIN
MA
X
MEA
N
MIN
MA
X
MEA
N
MIN
MA
X
MEA
N
MIN
MA
X
MEA
N
MIN
MA
X
MEA
N
MIN
MA
X
MEA
N
MIN
MA
X
MEA
N
1893
ST
YAGACHI RIVER NEAR PUMPING 24 27 26 7.1 7.4 7.2 7.0 7.7 7.3 280 550 395 64.0 64.0 64.0 1.0 3.0 1.5 0.30 0.80 0.60 0.10 0.40 0.27 150 250 188 500 1400 825
1199
STATION. HASSAN CITY
HEMAVATI AT D/S OF 23 27 26 6.8 7.1 7.0 7.3 8.0 7.5 300 360 335 120 120 120 1.0 3.0 2.0 0.20 0.60 0.40 0.10 0.70 0.40 300 350 313 1500 1800 1688
1200
HOLENARASIPURA TOWN AT RAMADEVALA WEIRSHIMSHA AT D/S OF HIGHWAY 23 26 25 5.6 9.2 7.7 7.0 8.4 7.6 100 400 267 13.0 13.0 13.0 2.0 3.0 2.7 0.50 2.40 1.50 2.20 2.20 2.20 110 1600 643 900 1600 1367BRIDGE, YEDIYAR, KARNATAKA
1166
1165
SHIMSHA AT D/S OF BRIDGE, HALAGUR, KARNATAKAARKAVATHI AT D/S OF
26
27
29
30
27
29
4.4
5.0
10.0
9.0
7.4
7.0
7.7
7.2
8.4
8.4
8.1
7.8
402
300
690
1000
578
675
48.0 48.0 48.0 1.0
2.0
2.0
5.0
1.3
3.5
0.20
1.20
0.80
8.50
0.50
4.10 1.10 2.80 2.00
13
33
40
300
24
146
540
900
1600
1600
1335
1367
1196
KANAKAPURA TOWN, KARNATAKALAKSHMANTIRTHA AT D/S OF 21 27 25 0.0 8.3 5.5 6.9 8.4 7.5 28 951 401 61.0 61.0 61.0 1.0 10.0 3.2 0.30 1.80 0.80 0.20 0.20 0.20 21 240 105 1600 1600 1600HUNSUR TOWN, KARNATAKA
1207 KABBANI AT MUTHANKARA, KERALA
27 29 27 5.6 7.0 6.5 6.2 6.9 6.7 53 132 86 6.0 6.0 6.0 0.4 0.9 0.6 0.10 0.50 0.30 0.10 0.10 0.10 120 1100 530 300 2200 1175
1197 KABBANI AT SARAGUR VILLAGE D/S, KARNATAKA
25 27 26 6.6 10.0 7.8 6.6 7.7 7.2 76 207 126 42.0 42.0 42.0 1.0 1.0 1.0 0.20 0.70 0.40 24 48 38 1600 1600 1600
41
1445
KABBANI AT CAUSE WAY SATTUR, KARNATAKAKABBANI AT WATER INTAKE OF
25
26
31
33
28
28
7.3
5.3
10.0
12.2
8.7
8.4
7.6
7.2
8.3
8.4
7.9
7.8
61
95
550
410
267
220
15.0
8.0
15.0
8.0
15.0
8.0
1.0
1.0
1.0
1.0
1.0
1.0
0.40
0.20
1.80
0.90
0.90
0.50
12
70
40
540
26
190
150
920
1600
1600
925
1430KIADB AT NANJANGUD,KARNATAKA
1208
1201
BHAVANI AT ELACHIVAZHY, KERALABHAVANI AT PATHIRAKALIAMMA
26
29
29
33
27
31
6.9
7.1
7.0
8.2
6.9
7.7
7.1
6.9
7.6
8.7
7.4
7.7
38
70
248
298
141
147
8.0 8.0 8.0 0.4
0.2
0.9
1.8
0.6
0.7
0.10
0.10
0.60
1.00
0.20
0.40
0.10
0.10
0.10
0.10
0.10
0.10
100
110
170
800
133
278
280
170
600
1700
370
476KOIL, TAMILNADU
1204 BHAVANI AT SIRUMUGAI,TAMILNADU
27 33 30 6.2 7.9 7.4 6.9 8.4 7.5 65 220 139 8.0 8.0 8.0 0.1 3.0 1.0 0.10 0.40 0.20 0.00 0.10 0.10 5.00 5.00 5.00 20 330 187 40 2800 506
1321
1319
BHAVANI AT BHAVANI SAGAR, TAMILNADUAMRAVATI AT 1KM D/S FROM EFF.DIS. PT. AT
25
26
32
30
29
28
2.8
7.6
7.8
8.7
6.2
8.0
6.8
7.0
7.9
8.1
7.2
7.5
79
73
212
490
157
170
16.0 16.0 16.0 0.4
0.2
4.0
1.6
1.3
0.9
0.10
0.10
0.40
0.40
0.10
0.20
0.10
0.10
0.10
0.10
0.10
0.10
5.00 5.00 5.00 170
110
2800
500
930
241
330
220
3500
700
1545
366
MADHUTHUKKULAM,TAMILNADU
ATI
ON
CO
DE
LOCATIONS
TEMPERAT D.O. (mg/l) pH CONDUCTIVITY C.O.D. (mg/l) B.O.D. (mg/l) NITRATE (mg/l) NITRITE (mg/l) AMMONIA - N (mg/l) FECAL COLIFORM (MPN/100ml) TOTAL COLIFORM (MPN/100ml)
MIN
MA
X
MEA
N
URE ºC
MIN
MA
X
MEA
N
MIN
MA
X
MEA
N
MIN
(µ
MA
X
mhos/c
MEA
N
m)
MIN
MA
X
MEA
N
MIN
MA
X
MEA
N
MIN
MA
X
MEA
N
MIN
MA
X
MEA
N
MIN
MA
X
MEA
N
MIN
MA
X
MEA
N
MIN
MA
X
MEA
N
ST
1393
1150
DAMANGANGA AT D/S OF MADHUBAN, DAMANDAMANGANGA AT KACHIGAON 20 27 25 6.8 7.2 7.0
7.3
7.3
7.8
8.1
7.6
7.7
190
171
330
2041
253
448 12.0 12.0 12.0 0.3 1.1 0.4
1.10
0.10
5.70
0.32
2.77
0.16
3.10
1.40
9.90
1.40
5.33
1.40 11 30 17 27 60 42
1246
U\S AT GIDC WIER,GUJARAT
DAMANGANGA AT KACHIGAON 22 28 25 3.1 7.1 4.8 7.1 7.9 7.5 10000 30000 20360 80.0 80.0 80.0 0.8 16 8.8 0.10 0.32 0.22 11.2 11.2 11.2 17 30 23 34 90 65D\S (DAMAN),GUJARAT
1860 BALEHWAR KHADI AT N.H. NO. 8 23 30 27 3.2 6.7 4.9 7.5 8.2 7.7 308 1900 904 10.0 10.0 10.0 2.9 4.7 3.6 0.30 1.90 0.85 0.30 1.10 0.70 7500 24000 13950 15,000 46,000 32,750
1861
1862
RIVER PURNA ON BRIDGE AT SURAT-NAVSARI HIGHWAYRIVER KAVERI ON BRIDGE AT
23
23
31
34
28
29
6.0
6.1
7.0
7.0
6.4
6.7
7.8
7.6
8.4
8.3
8.0
7.9
222
202
755
32000
477
14111
7.0
18.0
7.0
18.0
7.0
18.0
1.0
1.3
3.9
3.6
2.4
2.9
0.20
0.20
1.50
1.00
0.75
0.60
0.30
0.30
0.80
0.60
0.57
0.50
2800
9300
24000
15000
12325
10725
9,300
15,000
46,000
24,000
22,825
21,000BILLIMORA-VALSAD ROAD
1865 RIVER DHADHAR AT KOTHWADA 26 30 28 4.0 6.7 5.7 7.3 8.3 7.6 224 1481 868 46.0 46.0 46.0 2.2 6.3 4.2 0.09 0.94 0.41 4.48 4.48 4.48 2 9 5 15 93 57
1148 AMBIKA AT BILIMORA, GUJARAT 27 33 30 5.0 7.0 6.2 7.6 8.4 8.0 213 2720 899 18.0 18.0 18.0 1.3 4.7 3.1 0.10 0.70 0.33 0.30 1.10 0.63 7500 15000 10275 15,000 21,000 16,500
1149
1435
KOLAK AT PATALIA BDG., GUJARATKOLAK AT RAILWAY BRIDGE NO.
24
26
27
27
26
27
2.8
5.3
6.8
7.3
4.8
6.2
7.4
7.1
7.8
7.8
7.6
7.4
477
14200
41700
43380
14426
29920
93.0
49.0
93.0
49.0
93.0
49.0
1.0
0.8
19.0
8.0
10.4
3.6
0.10
0.14
0.15
0.30
0.14
0.18
3.92
2.24
3.92
2.24
3.92
2.24
22
11
40
21
32
14
70
30
220
60
148
41313 VAPI,VALSAD, GUJARAT
1434
1438
AMLAKHADI AT ANKLESHWAR
MINDHOLA AT STATE HIGHWAY
26
23
28
30
27
27 2.5 6.5 4.2
7.3
7.6
7.9
8.2
7.5
7.8
316
276
9470
865
5414
589
1750
11.0
1750
11.0
1750
11.0
73.0
3.2
522
5.3
359
4.0
0.05 0.13 0.11
0.50 1.30 0.80
258
0.60
258
0.80
258
0.68
2
9300
4
46000
3
23575
4
21,000
28
110,000
14
50,250
ATI
ON
CO
DE
LOCATIONS
TEMPERAT D.O. (mg/l) pH CONDUCTIVITY C.O.D. (mg/l) B.O.D. (mg/l) NITRATE (mg/l) NITRITE (mg/l) AMMONIA - N (mg/l) FECAL COLIFORM (MPN/100ml) TOTAL COLIFORM (MPN/100ml)
MIN
MA
X
MEA
N
URE ºC
MIN
MA
X
MEA
N
MIN
MA
X
MEA
N
MIN
(µ
MA
X
mhos/c
MEA
N
m)
MIN
MA
X
MEA
N
MIN
MA
X
MEA
N
MIN
MA
X
MEA
N
MIN
MA
X
MEA
N
MIN
MA
X
MEA
N
MIN
MA
X
MEA
N
MIN
MA
X
MEA
N
1399
ST
ZUARI AT D/S OF PT. WHERE 26 33 30 5.2 8.6 6.8 6.4 8.1 7.5 380 26090 2870 2.4 40.0 11.8 0.5 5.1 2.5 0.01 0.25 0.11 0.01 0.05 0.03 0.00 0.11 0.05 2 3500 582 5 5400 1114KUMBARJRIA CANAL JOINS, GOA
1475 ZUARI AT PANCHAWADI 28 32 29 4.6 7.8 6.5 6.4 7.8 6.9 220 10050 1690 1.6 24.0 7.4 0.6 3.4 1.5 0.02 0.33 0.12 0.01 0.1 0.05 0.00 0.10 0.03 5 2800 555 8 9200 13311476
1400
MANDOVI AT TONCA, MARCELA, GOAMANDOVI AT NEGHBOURHOOD
27
27
34
34
29
29
4.9
4.6
8.5
7.5
6.5
6.4
6.6
7.4
7.6
8.1
7.1
7.7
330
23000
28210
63000
3110
44000
2.0
3.2
9.2
47.6
5.8
14.1
0.0
0.8
3.3
4.9
1.6
2.3
0.04
0.01
0.15
0.33
0.09
0.08
0.01
0.01
0.05
0.05
0.03
0.03
0.01
0.01
0.08
0.20
0.03
0.06
130
0
3500
3500
1243
814
170
0
5400
5400
2056
1287
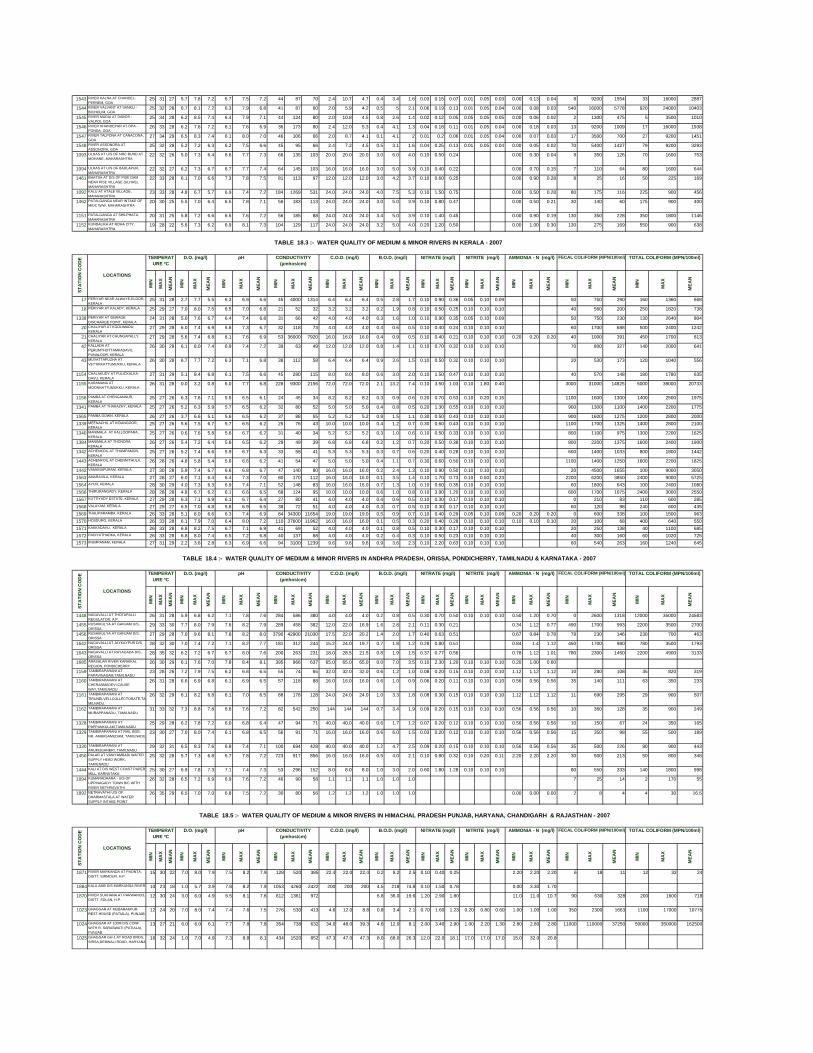
1152 KUNDALIKA AT ROHA CITY, MAHARASHTRA
19 28 22 5.6 7.3 6.2 6.9 8.1 7.3 104 129 117 24.0 24.0 24.0 3.2 5.0 4.0 0.20 1.20 0.50 0.00 1.00 0.30 130 275 169 550 900 638
1573 IRUMPANAM, KERALA 27 31 29 2.2 3.6 2.8 6.3 6.9 6.6 94 3100 1239 9.6 9.6 9.6 0.9 3.6 2.3 0.10 2.20 0.63 0.10 0.10 0.10 60 540 263 160 1240 645
DHARMASTALA AT WATER
TABLE 18.3 :- WATER QUALITY OF MEDIUM & MINOR RIVERS IN KERALA - 2007
TABLE 18.4 :- WATER QUALITY OF MEDIUM & MINOR RIVERS IN ANDHRA PRADESH, ORISSA, PONDICHERRY, TAMILNADU & KARNATAKA - 2007
TABLE 18.5 :- WATER QUALITY OF MEDIUM & MINOR RIVERS IN HIMACHAL PRADESH PUNJAB, HARYANA, CHANDIGARH & RAJASTHAN - 2007
SIRSA,DEBWALI ROAD, HARYANA
1543 RIVER KALNA AT CHANDEL- PERNEM, GOA
25 31 27 5.7 7.8 7.2 6.7 7.5 7.2 44 87 70 2.4 10.7 4.7 0.4 3.4 1.6 0.03 0.15 0.07 0.01 0.05 0.03 0.00 0.13 0.04 8 9200 1554 33 16000 2887
1544 RIVER VALVANT AT SANKLI - BICHOLIM, GOA
25 32 28 6.7 8.1 7.2 6.3 7.9 6.8 41 87 60 2.0 5.9 4.2 0.5 5 2.1 0.06 0.19 0.13 0.01 0.05 0.04 0.00 0.08 0.03 540 16000 5778 920 24000 10403
1545 RIVER MADAI AT DABOS - VALPOI, GOA
25 34 28 6.2 8.5 7.4 6.4 7.9 7.1 44 124 80 2.0 10.8 4.5 0.8 2.6 1.4 0.02 0.12 0.05 0.05 0.05 0.05 0.00 0.06 0.02 2 1300 475 5 3500 1010
1546 RIVER KHANDEPAR AT OPA - PONDA, GOA
26 33 28 6.2 7.6 7.2 6.1 7.6 6.9 36 173 80 2.4 12.0 5.3 0.4 4.1 1.3 0.04 0.18 0.11 0.01 0.05 0.04 0.00 0.18 0.03 13 9200 1009 17 16000 1938
1547 RIVER TALPONA AT CANACONA, GOA
27 34 29 6.5 8.3 7.4 6.1 8.0 7.0 46 106 66 2.0 8.7 4.1 0.1 4.1 2 0.01 0.2 0.06 0.01 0.05 0.04 0.00 0.07 0.03 17 3500 700 27 9200 1451
1548
1093
RIVER ASSONORA AT ASSONORA, GOAULHAS AT U/S OF NRC BUND AT
25
22
32
32
28
26
5.2
5.0
7.2
7.3
6.3
6.4
6.2
6.6
7.5
7.7
6.6
7.3
45
66
95
135
66
103
2.4
20.0
7.2
20.0
4.5
20.0
0.5
3.0
3.1
6.0
1.6
4.0
0.04
0.10
0.25
0.50
0.13
0.24
0.01 0.05 0.04 0.00
0.00
0.05
0.30
0.02
0.04
70
8
5400
350
1427
126
79
70
9200
1600
3293
753MOHANE, MAHARASHTRA
1094
1461
ULHAS AT U/S OF BADLAPUR, MAHARASHTRABHATSA AT D/S OF PISE DAM
22
22
32
33
27
28
6.2
6.1
7.3
7.0
6.7
6.6
6.7
7.3
7.7
7.8
7.4
7.5
64
81
145
113
103
97
16.0
12.0
16.0
12.0
16.0
12.0
3.0
3.0
5.0
4.2
3.9
3.7
0.10
0.10
0.40
0.60
0.22
0.25
0.00
0.00
0.70
0.90
0.15
0.28
7
8
110
25
64
16
80
50
1600
225
644
169NEAR PISE VILLAGE (ULHAS), MAHARASHTRA
1092
1462
KALU AT ATALE VILLAGE, MAHARASHTRAPATALGANGA NEAR INTAKE OF
23
20
33
30
28
25
4.8
5.5
6.7
7.0
5.7
6.4
6.9
6.5
7.4
7.8
7.2
7.1
184
56
1269
183
531
113
24.0
24.0
24.0
24.0
24.0
24.0
4.0
3.0
7.5
5.0
5.3
3.9
0.10
0.10
1.50
0.80
0.75
0.47
0.00
0.00
0.50
0.50
0.28
0.21
80
30
175
140
116
60
225
175
900
900
456
400MIDC W/W, MAHARASHTRA
1151 PATALGANGA AT SHILPHATA, MAHARASHTRA
20 31 25 5.8 7.2 6.6 6.5 7.6 7.2 56 185 88 24.0 24.0 24.0 3.4 5.0 3.9 0.10 1.40 0.45 0.00 0.90 0.19 130 350 228 350 1800 1146
ATI
ON
CO
DE
LOCATIONS
TEMPERAT D.O. (mg/l) pH CONDUCTIVITY C.O.D. (mg/l) B.O.D. (mg/l) NITRATE (mg/l) NITRITE (mg/l) AMMONIA - N (mg/l) FECAL COLIFORM (MPN/100ml) TOTAL COLIFORM (MPN/100ml)
MIN
MA
X
MEA
N
URE ºC
MIN
MA
X
MEA
N
MIN
MA
X
MEA
N
MIN
(µ
MA
X
mhos/c
MEA
N
m)
MIN
MA
X
MEA
N
MIN
MA
X
MEA
N
MIN
MA
X
MEA
N
MIN
MA
X
MEA
N
MIN
MA
X
MEA
N
MIN
MA
X
MEA
N
MIN
MA
X
MEA
N
ST
17 PERIYAR NEAR ALWAYE-ELOOR, KERALA
25 31 28 2.7 7.7 5.5 6.3 6.9 6.6 45 4000 1314 6.4 6.4 6.4 0.5 2.8 1.7 0.10 0.90 0.36 0.05 0.10 0.09 50 750 290 160 1360 668
18 PERIYAR AT KALADY, KERALA 25 29 27 7.0 8.0 7.5 6.5 7.0 6.8 21 52 32 3.2 3.2 3.2 0.2 1.9 0.8 0.10 0.50 0.25 0.10 0.10 0.10 40 560 200 250 1820 738
1338 PERIYAR AT SEWAGE DISCHARGE POINT, KERALA
24 31 28 5.0 7.6 6.7 6.4 7.4 6.8 31 66 42 4.0 4.0 4.0 0.3 1.6 1.0 0.10 0.90 0.35 0.05 0.10 0.09 50 750 230 130 2640 804
20 CHALIYAR AT KOOLIMADU, KERALA
27 29 28 6.0 7.4 6.9 5.8 7.3 6.7 32 118 73 4.0 4.0 4.0 0.4 0.6 0.5 0.10 0.40 0.24 0.10 0.10 0.10 60 1700 688 500 2400 1242
21
42
CHALIYAR AT CHUNGAPALLY, KERALAKALLADA AT
27
26
29
30
28
29
5.6
6.1
7.4
8.0
6.8
7.4
6.1
6.9
7.6
7.4
6.9
7.2
53
39
36000
63
7920
49
16.0
12.0
16.0
12.0
16.0
12.0
0.4
0.8
0.9
1.4
0.5
1.1
0.10
0.10
0.40
0.70
0.21
0.32
0.10
0.10
0.10
0.10
0.10
0.10
0.20 0.20 0.20 40
70
1000
800
391
327
450
140
1700
2000
813
641
43
PERUMTHOTTAMKADAVU, PUNALOOR, KERALAMUVATTAPUZHA AT 26 30 28 6.7 7.7 7.2 6.3 7.1 6.8 38 112 58 6.4 6.4 6.4 0.9 3.6 1.5 0.10 0.50 0.32 0.10 0.10 0.10 20 530 173 120 1040 556VETTIKKATTUMUKKU, KERALA
1154
1155
CHALAKUDY AT PULICKALKA-DAVU, KERALAKARAMANA AT
27
26
31
31
29
28
5.1
0.0
8.4
3.2
6.8
0.8
6.1
6.0
7.5
7.7
6.6
6.8
45
228
280
9300
115
2156
8.0
72.0
8.0
72.0
8.0
72.0
0.6
2.1
3.0
13.2
2.0
7.4
0.10
0.10
1.50
3.50
0.47
1.03
0.10
0.10
0.10
1.80
0.10
0.40
40
3000
570
31000
148
14825
180
5000
1780
39000
635
20733MOONNATTUMUKKU, KERALA
1156 PAMBA AT CHENGANNUR, KERALA
25 27 26 6.3 7.6 7.1 5.5 6.5 6.1 24 45 34 8.2 8.2 8.2 0.3 0.9 0.6 0.20 0.70 0.53 0.10 0.20 0.15 1100 1600 1300 1400 2500 1975
1341 PAMBA AT THAKAZHY, KERALA 25 27 26 5.2 6.3 5.9 5.7 6.5 6.2 32 80 52 5.0 5.0 5.0 0.4 0.8 0.5 0.20 1.30 0.55 0.10 0.10 0.10 900 1300 1100 1400 2200 1775
1565 PAMBA DOWN, KERALA 26 27 26 3.7 6.6 5.1 5.6 6.5 6.2 37 88 55 5.2 5.2 5.2 0.8 1.5 1.1 0.30 0.50 0.43 0.10 0.10 0.10 900 1600 1275 1200 2800 20001339 MEENACHIL AT KIDANGOOR,
KERALA25 27 26 5.6 7.5 6.7 5.7 6.5 6.2 25 76 43 10.0 10.0 10.0 0.4 1.2 0.7 0.30 0.60 0.43 0.10 0.10 0.10 1100 1700 1325 1400 2800 2100
1340 MANIMALA AT KALLOOPARA, KERALA
25 27 26 0.6 7.6 5.8 5.6 6.7 6.2 31 40 34 5.2 5.2 5.2 0.3 1.0 0.6 0.10 0.50 0.33 0.10 0.10 0.10 800 1100 975 1300 2200 1625
1384 MANIMALA AT THONDRA, KERALA
26 27 26 5.4 7.2 6.4 5.8 6.5 6.2 29 49 39 6.8 6.8 6.8 0.2 1.2 0.7 0.20 0.50 0.38 0.10 0.10 0.10 800 2200 1375 1600 2400 1900
1342 ACHENKOIL AT THUMPAMON, KERALA
25 27 26 5.2 7.4 6.6 5.9 6.7 6.3 33 58 41 5.3 5.3 5.3 0.3 0.7 0.6 0.20 0.40 0.28 0.10 0.10 0.10 600 1400 1033 800 1800 1442
1443 ACHENKOIL AT CHENNITHULA, KERALA
26 28 26 4.8 5.8 5.4 5.6 6.6 6.2 41 54 47 5.0 5.0 5.0 0.4 1.1 0.7 0.30 0.60 0.50 0.10 0.10 0.10 1100 1400 1250 1600 2200 1825
1442 VAMANAPURAM, KERALA 27 30 28 5.9 7.4 6.7 6.6 6.8 6.7 47 140 80 16.0 16.0 16.0 0.2 2.4 1.3 0.10 0.90 0.50 0.10 0.10 0.10 20 4500 1655 100 9000 30501563 AMARAVILA, KERALA 27 28 27 6.0 7.1 6.4 6.4 7.3 7.0 80 170 112 16.0 16.0 16.0 0.1 3.5 1.4 0.10 1.70 0.73 0.10 0.50 0.23 2200 6200 3850 2400 9000 57251564 AYUR, KERALA 28 30 29 4.0 7.3 6.3 6.9 7.4 7.1 52 148 83 16.0 16.0 16.0 0.7 1.3 1.0 0.10 0.60 0.35 0.10 0.10 0.10 60 1800 643 100 2400 10801566 THIRURANGADY, KERALA 28 28 28 4.8 6.7 6.2 6.1 6.6 6.5 68 124 95 10.0 10.0 10.0 0.6 1.0 0.8 0.10 3.90 1.20 0.10 0.10 0.10 600 1700 1075 2400 3000 25501567 KUTTIYADY ESTATE, KERALA 27 29 28 6.3 7.1 6.9 6.1 6.7 6.4 27 80 41 4.0 4.0 4.0 0.4 0.6 0.5 0.10 0.30 0.17 0.10 0.10 0.10 0 210 83 110 600 2851568 VALAYAM, KERALA 27 29 27 6.5 7.0 6.8 5.8 6.9 6.5 38 72 51 4.0 4.0 4.0 0.3 0.7 0.5 0.10 0.30 0.17 0.10 0.10 0.10 60 120 98 240 600 4351569 THALIPARAMBA, KERALA 26 33 28 5.1 8.0 6.6 6.3 7.4 6.9 84 34300 11654 19.0 19.0 19.0 0.5 0.9 0.7 0.10 0.40 0.29 0.05 0.10 0.08 0.20 0.20 0.20 0 600 338 100 1500 9631570 HOSDURG, KERALA 26 33 28 6.1 7.9 7.0 6.4 8.0 7.2 110 37600 11962 16.0 16.0 16.0 0.1 0.5 0.3 0.20 0.40 0.28 0.10 0.10 0.10 0.10 0.10 0.10 20 100 68 400 640 5501571 KAKKADAVU, KERALA 26 33 28 6.8 8.2 7.5 6.7 7.1 6.9 41 69 52 4.0 4.0 4.0 0.1 0.8 0.5 0.10 0.30 0.17 0.10 0.10 0.10 20 250 138 40 1100 6851572 PADIYATHADKA, KERALA 26 33 28 6.8 8.0 7.4 6.5 7.2 6.8 40 137 68 4.0 4.0 4.0 0.2 0.4 0.3 0.10 0.50 0.23 0.10 0.10 0.10 40 300 160 60 1020 725
ATI
ON
CO
DE
LOCATIONS
TEMPERAT D.O. (mg/l) pH CONDUCTIVITY C.O.D. (mg/l) B.O.D. (mg/l) NITRATE (mg/l) NITRITE (mg/l) AMMONIA - N (mg/l) FECAL COLIFORM (MPN/100ml) TOTAL COLIFORM (MPN/100ml)
MIN
MA
X
MEA
N
URE ºC
MIN
MA
X
MEA
N
MIN
MA
X
MEA
N
MIN
(µ
MA
X
mhos/c
MEA
N
m)
MIN
MA
X
MEA
N
MIN
MA
X
MEA
N
MIN
MA
X
MEA
N
MIN
MA
X
MEA
N
MIN
MA
X
MEA
N
MIN
MA
X
MEA
N
MIN
MA
X
MEA
N
ST
1448 NAGAVALLI AT THOTAPALLI REGULATOR, A.P.
26 31 28 5.9 6.8 6.2 7.1 7.8 7.6 284 586 380 4.0 4.0 4.0 0.2 0.8 0.5 0.30 0.70 0.50 0.10 0.10 0.10 0.50 1.20 0.70 0 2600 1318 12000 35000 24583
1455 RUSHIKULYA AT GANJAM U/S, ORISSA
29 33 30 7.7 8.0 7.9 7.6 8.2 7.9 289 458 382 12.0 22.0 16.9 1.6 2.8 2.1 0.11 0.30 0.21 0.34 1.12 0.77 490 1700 993 2200 3500 2700
1456 RUSHIKULYA AT GANJAM D/S, ORISSA
27 29 28 7.0 9.6 8.1 7.8 8.2 8.0 3790 42900 21030 17.5 22.0 20.2 1.4 2.0 1.7 0.40 0.63 0.51 0.67 0.84 0.78 78 230 146 230 700 463
1642 NAGAVALLI AT JAYKAYPUR D/S, ORISSA
28 32 30 7.0 7.4 7.2 7.1 8.2 7.7 181 312 244 15.2 24.0 19.7 0.7 1.8 1.2 0.28 0.80 0.51 0.84 1.4 1.12 450 1700 980 780 3500 1793
1643 NAGAVALLI AT RAYAGADA D/S, ORISSA
28 35 32 6.2 7.2 6.7 6.7 8.0 7.6 200 263 231 18.0 28.5 21.5 0.8 1.9 1.5 0.37 0.77 0.56 0.78 1.12 1.01 780 2300 1460 2200 4900 3133
1685 ARASALAR RIVER KARAIKAL REGION, PONDICHERRY
26 30 29 6.1 7.6 7.0 7.8 8.4 8.1 395 966 637 65.0 65.0 65.0 0.0 7.0 3.5 0.10 2.30 1.20 0.10 0.10 0.10 0.20 1.00 0.60
1159
1160
TAMBIRAPARANI AT PAPAVINASAM,TAMILNADUTAMBIRAPARANI AT
23
26
28
31
26
28
7.2
6.6
7.9
6.9
7.5
6.8
6.2
6.1
6.8
6.9
6.5
6.5
55
57
74
118
65
88
32.0
16.0
32.0
16.0
32.0
16.0
0.6
0.6
1.2
1.0
1.0
0.9
0.08
0.06
0.20
0.20
0.15
0.11
0.10
0.10
0.10
0.10
0.10
0.10
1.12
0.56
1.12
0.56
1.12
0.56
10
35
280
140
108
111
35
63
820
350
319
233
1161
CHERANMADEVI,CAUSE WAY,TAMILNADUTAMBIRAPARANI AT 26 32 29 6.1 8.2 6.8 6.1 7.0 6.5 88 178 128 24.0 24.0 24.0 1.0 3.3 1.8 0.08 0.30 0.15 0.10 0.10 0.10 1.12 1.12 1.12 11 690 295 29 900 507
1162
TIRUNELVELI,COLLECTORATE,TAMILNADU.TAMBIRAPARANI AT 31 33 32 7.3 8.8 7.8 6.6 7.6 7.2 82 542 250 144 144 144 0.7 3.4 1.9 0.09 0.20 0.15 0.10 0.10 0.10 0.56 0.56 0.56 10 360 128 35 900 249MURAPPANADU, TAMILNADU
1328
1329
TAMBIRAPARANI AT PAPPANKULAM,TAMILNADUTAMBIRAPARANI AT RAIL BDG.
25
23
29
30
28
27
6.2
7.0
7.8
8.0
7.2
7.4
6.0
6.1
6.8
6.8
6.4
6.5
47
56
94
91
71
71
40.0
16.0
40.0
16.0
40.0
16.0
0.6
0.6
1.7
6.0
1.2
1.5
0.07
0.03
0.20
0.20
0.12
0.12
0.10
0.10
0.10
0.10
0.10
0.10
0.56
0.56
0.56
0.56
0.56
0.56
10
15
150
350
67
98
24
55
350
500
165
189NR. AMBASAMUDAM, TAMILNADU
1330
1450
TAMBIRAPARANI AT ARUMUGANERI, TAMILNADUPALAR AT VANIYAMBADI WATER
29
25
32
32
31
28
6.5
5.7
8.3
7.3
7.6
6.8
6.8
6.7
7.4
7.8
7.1
7.2
100
723
694
917
428
856
40.0
16.0
40.0
16.0
40.0
16.0
1.2
0.5
4.7
4.0
2.5
2.1
0.09
0.10
0.20
0.80
0.15
0.32
0.10
0.10
0.10
0.20
0.10
0.11
0.56
2.20
0.56
2.20
0.56
2.20
35
30
500
500
226
213
80
50
900
800
443
348SUPPLY HEAD WORK, TAMILNADU
1444
1894
KALI AT D/S WEST COAST PAPER MILL, KARNATAKAKUMARADHARA - U/S OF
25
26
30
32
27
28
6.9
6.5
7.8
7.2
7.3
6.9
7.1
6.9
7.4
7.6
7.3
7.2
53
46
296
90
152
58
8.0
1.1
8.0
1.1
8.0
1.1
1.0
1.0
3.0
1.0
2.0
1.0
0.60 1.80 1.28 0.10 0.10 0.10 80
7
550
25
333
14
140
2
1800
170
998
55
1892
UPPINAGADY TOWN B/C WITH RIVER NETHRAVATHINETRAVATHI U/S OF 26 35 29 6.5 7.0 7.0 6.8 7.5 7.2 30 80 56 1.2 1.2 1.2 1.0 1.0 1.0 0.00 0.00 0.00 2 8 4 4 30 16.5
SUPPLY INTAKE POINT
ATI
ON
CO
DE
LOCATIONS
TEMPERAT D.O. (mg/l) pH CONDUCTIVITY C.O.D. (mg/l) B.O.D. (mg/l) NITRATE (mg/l) NITRITE (mg/l) AMMONIA - N (mg/l) FECAL COLIFORM (MPN/100ml) TOTAL COLIFORM (MPN/100ml)
MIN
MA
X
MEA
N
URE ºC
MIN
MA
X
MEA
N
MIN
MA
X
MEA
N
MIN
(µ
MA
X
mhos/c
MEA
N
m)
MIN
MA
X
MEA
N
MIN
MA
X
MEA
N
MIN
MA
X
MEA
N
MIN
MA
X
MEA
N
MIN
MA
X
MEA
N
MIN
MA
X
MEA
N
MIN
MA
X
MEA
N
1871
ST
RIVER MARKANDA AT PAONTA, 15 30 22 7.0 8.0 7.9 7.5 8.2 7.9 128 520 385 22.4 22.0 22.4 0.2 8.2 2.5 0.10 0.40 0.25 2.20 2.20 2.20 6 18 11 12 32 24DISTT. SIRMOUR, H.P.
1884
1870
KALA AMB D/S MARKANDA RIVER
RIVER SUKHANA AT PARWANOO,
10
12
23
30
18
24
1.0
3.0
5.7
6.0
3.9
4.9
7.8
6.5
8.2
8.1
7.9
7.6
1053
612
4260
1361
2422
972
200 200 200 4.5
6.8
218
36.0
74.8
19.6
0.10
1.20
1.50
2.90
0.78
1.80
0.00
11.0
3.30
11.0
1.70
10.7 90 630 328 200 1600 718
1023
DISTT. SOLAN, H.P.
GHAGGAR AT MUBARAKPUR 12 24 20 7.0 8.0 7.4 7.4 7.6 7.5 276 530 413 4.6 12.0 8.8 0.8 3.4 2.1 0.70 1.60 1.23 0.20 0.80 0.60 1.00 1.00 1.00 350 2300 1663 1100 17000 10775
1024
REST HOUSE (PATIALA), PUNJAB
GHAGGAR AT 100M D/S CONF. 13 27 21 6.0 6.0 6.1 7.7 7.8 7.8 354 738 632 34.0 48.0 39.3 4.6 12.0 8.1 2.00 3.40 2.90 1.00 2.20 1.30 2.80 2.80 2.80 11000 110000 37250 50000 350000 162500
1025
WITH R. SARASWATI (PATIALA), PUNJABGHAGGAR GH-1 AT ROAD BRDG. 16 32 24 1.0 7.0 4.9 7.3 8.8 8.1 434 1520 852 47.3 47.0 47.3 8.0 68.0 26.3 12.0 22.0 18.1 17.0 17.0 17.0 15.0 32.0 20.8

1717 KODRA DAM, MOUNT ABU, 15 22 19 4.2 8.6 5.6 6.6 7.9 7.4 50 300 168 14.2 14.2 14.2 0.9 4.8 2.2 0.16 0.70 0.38 0.02 1.00 0.39 3 7 5 7 28 16
1927 SEKMAI RIVER, KAKCHING 20 28 23 3.2 8.7 6.9 6.5 7.7 7.2 112 350 233 2.0 9.0 6.0 0.5 2.3 1.5 30 250 119
1318
1729AGARTALA, TRIPURA
27 27 27 6.1 6.1 6.1 5.3 5.3 5.3 112 112 112 12.2 12.2 12.2 0.04 0.04 0.04 610 610 610 720 720 720
TABLE 18.6 :- WATER QUALITY OF MEDIUM & MINOR RIVERS IN MIZORAM, MANIPUR, MEGHALAYA & TRIPURA - 2007
TABLE 18.7 :- WATER QUALITY OF CREEK & CANAL - 2007
ST
TABLE 19.1 :- WATER QUALITY OF LAKE, POND & TANK IN ANDHRA PRADESH, KARNATAKA, KERALA, TAMILNADU, PONDICHERRY & GOA- 2007
1780 GANDIGUDEM ,MEDAK DISTRICT, A.P
27 30 28 4.2 5.7 5.0 7.3 7.5 7.4 1130 2540 1953 21.0 21.0 21.0 0.4 3.0 1.3 1.50 10.8 6.60 0.10 0.10 0.10 3 3 3 95 100 99
1026 GHAGGAR GH-2 AT 18 35 26 3.0 6.0 4.5 7.7 8.7 8.3 753 1330 996 61.5 62.0 61.5 11.0 42.0 25.3 13.0 18.0 15.8 14.0 24.0 18.7
1295
CHANDARPUR SYPHON, HARYANAGHAGGAR NEAR 12 25 21 6.0 8.0 6.7 7.5 7.7 7.6 280 560 425 20.0 39.0 29.7 4.0 12.0 7.4 1.30 4.80 2.88 0.50 1.80 1.30 1.80 1.80 1.80 5000 70000 22250 15000 170000 78750
1473
BANKARPUR,DERA BASSI,PUNJABGHAGGAR AT RATANHERI, D/S 13 26 21 6.0 7.0 6.3 7.6 7.8 7.7 349 717 619 30.0 44.0 34.7 4.6 10.0 7.3 2.30 4.20 3.28 1.20 2.80 1.80 2.40 2.40 2.40 9000 70000 28250 70000 230000 125000OF PATIALA NADI (A/C), PUNJAB
1698 GHAGGAR AT D/S CHHATBIR, PUNJAB
15 27 22 6.0 7.0 6.4 7.6 7.7 7.7 294 580 439 14.0 28.0 21.3 3.2 4.8 4.2 1.80 3.00 2.20 0.70 1.40 1.00 2.20 2.20 2.20 1100 230000 60275 20000 1700000 440750
1699 GHAGGAR AT U/S DHAKANSU NALLAH, PUNJAB
13 27 22 5.0 7.0 6.5 7.5 7.7 7.7 304 980 686 18.0 40.0 31.3 4.0 18.0 9.8 2.00 2.80 2.60 1.00 1.60 1.30 3.20 3.20 3.20 9000 50000 19750 50000 170000 105000
1700 GHAGGAR AT D/S DHAKANSU NALLAH, PUNJAB
13 26 21 6.0 7.0 6.4 7.6 7.8 7.8 317 990 754 38.0 58.0 46.7 8.0 20.0 13.8 2.00 3.00 2.53 1.00 1.60 1.40 2.40 2.40 2.40 23000 110000 56500 100000 500000 227500
1701 GHAGGAR AT D/S JHARMAL NADI, PUNJAB
15 26 22 5.0 7.0 6.3 7.6 7.7 7.7 317 940 615 22.0 48.0 32.0 4.2 16.0 8.2 1.80 8.00 3.70 0.80 4.60 1.90 3.00 3.00 3.00 2000 90000 34500 10000 2300000 622500
1702 GHAGGAR AT U/S JHARMAL NADI, PUNJAB
15 26 21 6.0 7.0 6.2 7.5 7.7 7.6 302 640 457 20.0 22.0 21.0 3.0 4.2 3.7 1.70 2.80 2.23 0.80 1.60 1.10 2.60 2.60 2.60 900 23000 8633 10000 110000 49000
1703 GHAGGER AT MOONAK, PUNJAB 13 27 21 6.0 6.0 6.0 7.7 7.9 7.8 499 790 690 38.0 52.0 46.0 6.8 14.0 9.6 2.00 3.60 3.00 1.00 1.80 1.30 3.00 3.00 3.00 11000 23000 16250 50000 170000 117500
1704 GHAGGAR AT D/S SARDULGARH, PUNJAB
13 26 21 6.0 6.0 5.9 7.5 7.9 7.8 420 807 692 42.0 68.0 51.3 5.0 20.0 11.1 2.00 5.20 3.50 1.00 3.20 1.80 3.20 3.20 3.20 11000 230000 94000 90000 500000 222500
1705 GHAGGAR AT U/S SARDULGARH, PUNJAB
13 26 21 6.0 6.0 5.9 7.4 7.9 7.7 423 847 699 40.0 64.0 48.1 5.0 18.0 10.4 2.10 4.80 3.33 1.00 3.00 1.60 3.20 3.20 3.20 11000 110000 60500 70000 3500000 967500
1885
1887
RIVER GHAGGAR AT D/S OF SURAJPURGHAGGAR BEFORE OTTU WEIR (BEFORE MIXING OF SATLUJ
17
16
26
33
22
25
6.0
6.0
6.7
7.0
6.5
6.6
7.9
7.4
8.5
8.6
8.2
8.2
1232
618
1480
1390
1315
895 53.6 54.0 53.6
2.2
6.0
2.3
81.0
2.2
26.3
0.10
11.0
0.10
21.0
0.05
15.5
0.00
14.0
0.00
23.0
0.00
17.3
CANAL WATER) (HARYANA)
2047 N-CHOE (ATTAWA CHOE), CHANDIGARH
27 32 29 7.1 7.2 7.2 134 152 143 50.0 50.0 50.0 0.20 0.30 0.27 15.0 15.0 15.0
2048 PATIALA KI RAO, CHANDIGARH 27 34 30 7.3 7.5 7.4 170 200 185 50.0 50.0 50.0 0.30 0.60 0.40 15.0 15.0 15.0
2049 SUKHNA CHOE, CHANDIGARH 27 32 29 1.0 1.0 1.0 7.2 7.4 7.3 74 142 108 49.0 50.0 49.7 0.40 0.80 0.60 15.0 15.0 15.0
RAJASTHAN
ATI
ON
CO
DE
LOCATIONS
TEMPERAT D.O. (mg/l) pH CONDUCTIVITY C.O.D. (mg/l) B.O.D. (mg/l) NITRATE (mg/l) NITRITE (mg/l) AMMONIA - N (mg/l) FECAL COLIFORM (MPN/100ml) TOTAL COLIFORM (MPN/100ml)
MIN
MA
X
MEA
N
URE ºC
MIN
MA
X
MEA
N
MIN
MA
X
MEA
N
MIN
(µ
MA
X
mhos/cM
EAN
m)
MIN
MA
X
MEA
N
MIN
MA
X
MEA
N
MIN
MA
X
MEA
N
MIN
MA
X
MEA
N
MIN
MA
X
MEA
N
MIN
MA
X
MEA
N
MIN
MA
X
MEA
N
ST
2050 TLAWNG UPSTREAM AIZAWL, MIZORAM
22 30 25 4.2 8.5 6.7 7.7 8.0 7.9 75 184 135 0.1 0.8 0.4 0.10 0.10 0.10 0.10 0.10 0.10 3 3 3
2051 TLAWNG DOWNSTREAM AIZAWL, MIZORAM
21 30 25 5.5 7.6 6.5 7.6 8.1 7.9 120 250 195 0.2 1.1 0.6 0.20 0.20 0.20 0.70 0.70 0.70 3 3 3
2052 TUIRIAL UPPER CATCHMENT, MIZORAM
22 27 24 5.9 9.7 7.3 7.4 8.1 7.8 199 230 219 0.4 0.7 0.5 0.10 0.10 0.10 1.70 1.70 1.70
2053 TUIRIAL LOWER CATCHMENT, MIZORAM
21 27 24 6.7 8.8 7.7 7.5 8.1 7.9 130 316 227 0.2 0.7 0.4 0.10 0.10 0.10 15 15 15
1424 IMPHAL AT MAHABALI, MANIPUR 19 26 23 3.4 8.5 6.2 6.7 7.2 7.0 86 193 132 1.0 15.0 7.4 0.3 2.8 1.6 45 230 102
1457 IMPHAL AT KOIRENGEI, MANIPUR 20 26 23 3.9 9.7 6.4 7.1 8.0 7.4 110 180 137 7.0 7.0 7.0 1.0 2.8 2.1 23 100 58
1458 IRIL AT PORAMPET, MANIPUR 18 27 23 4.5 8.5 6.4 7.1 8.0 7.6 136 315 200 0.6 5.2 3.6 0.1 2.6 1.0 4 110 36
1624 LILONG, MANIPUR 19 28 23 5.4 8.3 7.0 7.4 8.0 7.6 131 340 210 3.8 36.0 14.6 1.2 3.0 2.4 100 100 100 27 220 1371625 HUMP BRIDGE, MANIPUR 18 28 23 2.1 5.4 3.6 6.3 7.8 7.2 148 350 249 1.7 48.0 26.6 0.4 14.6 4.9 195 610 3831626 HEIRANGOITHONG, MANIPUR 18 29 23 3.1 4.1 3.7 7.1 7.9 7.5 120 381 224 2.0 35.0 22.0 0.5 12 4.0 210 765 3941627 KIYAMGI, MANIPUR 20 28 24 5.6 8.1 7.1 7.0 7.9 7.3 84 300 156 3.0 6.2 5.0 1.1 2.6 2.0 15 240 891628
1925
MINUTHONG(IMPHAL RIVER, MANIPURKHUGA RIVER
18
19
27
25
23
22
4.8
3.8
8.9
7.1
7.1
5.8
6.7
7.1
7.4
8.0
7.2
7.6
86
90
176
417
127
258
2.4
2.2
6.7
200
4.6
71.4
0.7
0.7
3.3
2.5
2.0
1.7
25
25
130
300
60
118(CHURACHANDPUR DIST.) MANIPUR
1926 KHUJAIROK RIVER, MOREH (CHANDEL DIST.) MANIPUR
20 30 24 6.5 10.5 8.4 7.1 8.3 7.9 200 570 383 2.3 6.0 4.2 0.5 1.0 0.8 10 338 180
1427
1428
UMTREW AT BYRNIHAT EAST, MEGHALAYAKYRHUKHLA NEAR SUTNGA
11
11
25
24
20
18
7.0
4.8
9.4
7.6
8.1
6.1
7.0
2.9
7.4
3.2
7.2
3.1
195
500
241
950
221
738
20.7
26.0
20.7
26.0
20.7
26.0
4.3
3.0
7.7
7.0
5.4
5.5
1.00
1.00
3.50
5.20
1.95
2.73
170
23
240
46
213
32
260
31
540
70
373
45KHLIERIAT,JAINTIA HILLS DT., MEGHALAYA
1631 MYNTDU RIVER JOWAI, MEGHALAYA
10 19 16 7.4 8.8 8.0 7.0 7.0 7.0 140 180 164 1.4 2.0 1.7 0.20 2.70 1.60 1400 1700 1600 1800 2200 2067
1632
1633
GANOL RIVER TURA, MEGHALAYASIMSANG RIVER WILLIAMNAGAR,
10
7
24
23
19
18
1.4
2.0
8.2
10.0
5.4
7.0
7.0
6.8
7.4
7.2
7.2
7.0
123
125
196
191
153
161
10.4
8.4
10.4
8.4
10.4
8.4
1.4
1.0
2.0
2.4
1.7
1.7
0.70
1.00
4.10
5.50
1.78
2.43
140
180
280
350
213
250
220
280
350
540
278
375MEGHALAYA
1403 GUMTI AT U/S SOUTH TRIPURA, TRIPURA
26 28 27 4.8 6.0 5.2 7.1 7.9 7.4 78 160 120 0.9 1.9 1.4 0.05 0.05 0.05 0.05 0.05 0.05 180 230 203 240 320 280
1404
1726
GUMTI AT D/S SOUTH TRIPURA, TRIPURACHANDRAPUR, AGARTALA D/S
25
25
28
29
27
27
3.7
4.9
5.2
5.8
4.7
5.4
7.2
7.2
7.7
7.8
7.4
7.4
120
110
150
160
139
128
1.6
2.5
2.2
3.9
1.9
3.0
0.05
0.02
0.20
0.09
0.11
0.06
0.05
0.05
0.05
0.05
0.05
0.05
210
280
380
440
308
353
350
480
510
620
440
565OF HAORA RIVER, TRIPURA
(THOUBAL DIST.)
ATI
ON
CO
DE
LOCATIONS
TEMPERAT D.O. (mg/l) pH CONDUCTIVITY C.O.D. (mg/l) B.O.D. (mg/l) NITRATE (mg/l) NITRITE (mg/l) AMMONIA - N (mg/l) FECAL COLIFORM (MPN/100ml) TOTAL COLIFORM (MPN/100ml)
MIN
MA
X
MEA
N
URE ºC
MIN
MA
X
MEA
N
MIN
MA
X
MEA
N
MIN
(µ
MA
X
mhos/c
MEA
N
m)
MIN
MA
X
MEA
N
MIN
MA
X
MEA
N
MIN
MA
X
MEA
N
MIN
MA
X
MEA
N
MIN
MA
X
MEA
N
MIN
MA
X
MEA
N
MIN
MA
X
MEA
N
CREEKSBASSEIN CREEK AT BASSIN IN 1316THANE DT., MAHARASHTRA
THANE CREEK AT ELEPHANTA
26 29 28 3.4 5.8 4.7 7.4 7.8 7.6 16000 52980 41665 168 168 168 7.8 10.0 9.1 0.60 2.60 1.68 0.00 0.40 0.15 350 900 538 900 1600 1250
1317ISLAND, MAHARASHTRA
28 32 31 2.6 4.6 3.7 7.3 8.0 7.8 17990 61250 48515 224 224 224 10.0 11.0 10.5 0.70 1.40 0.95 0.00 1.30 0.35 45 170 121 250 900 531
MAHIM CREEK AT MAHIM BAY, 29 32 31 1.1 5.7 3.5 7.4 8.1 7.7 17950 60930 37703 100 100 100 9.0 19.0 13.1 0.60 3.40 1.78 0.00 6.10 1.63 80 900 439 250 1800 1188MAHARASHTRA
CANAL1886
1109
WESTERN YAMUNA CANAL AT TAJEWALAW.YAM. CANAL WC-1(Y.NAGAR)100M D/S AFTER
18
24
28
30
23
27
6.2
0.2
6.8
6.2
6.5
3.4
7.2
7.0
8.2
8.1
7.8
7.6
390
969
801
4220
609
2517
9.2
980
9.2
980
9.2
980
0.6
4.3
1.2
396
0.8
192
0.05
0.05
0.05
1.00
0.05
0.37
0.00
0.00
0.00
48.2
0.00
21.4
RECEIVING IND.&SEW.EFFL HARYANAW.YAM. CANAL WC-2 (NEAR 1110KARNA LAKE)G.T.ROAD KARNAL,HARYANAW.YAM. CANAL WC-6 SIRSA
24 27 26 6.3 6.4 6.4 7.8 8.1 7.9 529 669 599 2.2 2.3 2.2 0.05 1.00 0.53 0.00 0.00 0.00
1114BRANCH AT RD.BRIDGE JIND KAITHAL ROAD HARYANAW.YAM. CANAL C-3 DELHI
10 22 16 6.2 7.1 6.6 7.9 8.0 7.9 551 615 584 1.2 2.6 2.0 0.05 0.50 0.28 0.00 0.00 0.00
1111BRANCH AT R.D.245250,HARYANAW.YAM. CANAL C-3 DELHI
9 27 20 6.1 6.9 6.4 7.4 8.3 7.9 390 645 534 12.0 12.0 12.0 1.0 1.5 1.2 0.05 1.00 0.68 0.50 1.00 0.75 0.00 0.00 0.00
1112BRANCH AT R.D.245250,HARYANAW.YAM. CANAL C-7 DELHI
9 25 20 6.2 7.0 6.4 7.5 8.3 8.0 390 646 535 10.0 10.0 10.0 0.8 1.0 0.9 0.05 1.00 0.53 0.00 1.50 0.75
1115PARALLEL BRANCH AT KHUBRU FALL RD-145250W.YAM. CANAL WC-4 DELHI
11 27 21 5.6 6.2 6.0 7.5 8.3 8.0 395 665 540 14.0 14.0 14.0 1.2 2.2 1.6 0.05 1.00 0.52 1.00 1.00 1.00 0.00 0.00 0.00
1116PARALLEL BRANCH AT PANIPAT
18 20 19 6.2 6.5 6.3 7.6 8.2 8.0 490 668 589 12.8 12.8 12.8 1.5 2.5 2.0 0.05 1.00 0.40 0.50 1.00 0.75 0.00 0.00 0.00
1479HARYANAHAIDERPUR
GURGAON CANAL, GC-1,(NEAR
16 26 21 6.8 8.9 8.1 7.4 8.2 7.8 160 276 226 1.0 2.0 1.3 0.30 0.73 0.48 0.01 0.01 0.01 7500 19000 11633 11000 520000 2640001419
BADARPUR BORDER), HARYANA
NEAR PRAGATI VIDYABHAWAN,
26 32 29 2.1 5.5 3.3 7.1 7.9 7.4 1087 1230 1139 78.0 78.0 78.0 21.0 27.0 23.7 4.00 4.50 4.27
ATI
ON
CO
DE
LOCATIONS
TEMPERAT D.O. (mg/l) pH CONDUCTIVITY C.O.D. (mg/l) B.O.D. (mg/l) NITRATE (mg/l) NITRITE (mg/l) AMMONIA - N (mg/l) FECAL COLIFORM (MPN/100ml) TOTAL COLIFORM (MPN/100ml)
MIN X N
URE ºC
MIN X N
MIN X N
MIN
(µ
X
mhos/c
N
m)
MIN X N
MIN X N
MIN X N
MIN X N
MIN X N
MIN X N
MIN X N
ST
MA
MEA MA
MEA MA
MEA MA
MEA MA
MEA MA
MEA MA
MEA MA
MEA MA
MEA MA
MEA MA
MEA
1391 HUSSAIN SAGAR LAKE, BUDAMERU,A.P.
27 29 28 3.3 4.0 3.6 6.9 7.9 7.6 1150 1755 1481 86.0 86.0 86.0 4.1 16.0 11.5 5.00 10.5 7.20 0.10 0.30 0.17 0 15 8 790 1380 1073
1447 DHARMASAGAR TANK NEAR 26 30 28 5.7 8.4 6.9 7.8 8.6 8.1 265 672 401 8.0 18.0 13.0 2.4 8.0 3.8 0.10 0.30 0.20 0.10 0.10 0.10 0 3 1 16 460 172
1464WARANGAL, A.P.BIBINAGAR TANK, A.P. 27 30 28 4.2 6.0 4.9 7.8 8.1 8.0 150 474 378 9.0 9.0 9.0 0.6 4.8 1.7 0.10 1.10 0.46 0.10 0.10 0.10 0.00 4.20 1.40 3 20 6 98 425 165
1783 KISTAREDDYPET TANK , MEDAK DIST., A.P
27 28 28 5.7 5.7 5.7 7.5 8.1 7.8 2830 2980 2905 0.2 0.8 0.5 10.4 27.0 18.7 0.10 0.10 0.10 3 3 3 100 100 100
1788 SAROONAGAR , RANGA REDDY DIST., A.P
22 29 25 3.1 4.6 3.6 7.4 8.1 7.8 1565 1983 1844 134 134 134 14.1 24.0 18.8 3.7 22.0 12.2 0.80 1.30 0.95 15.0 15.0 15.0 0 22 14 352 2050 1353
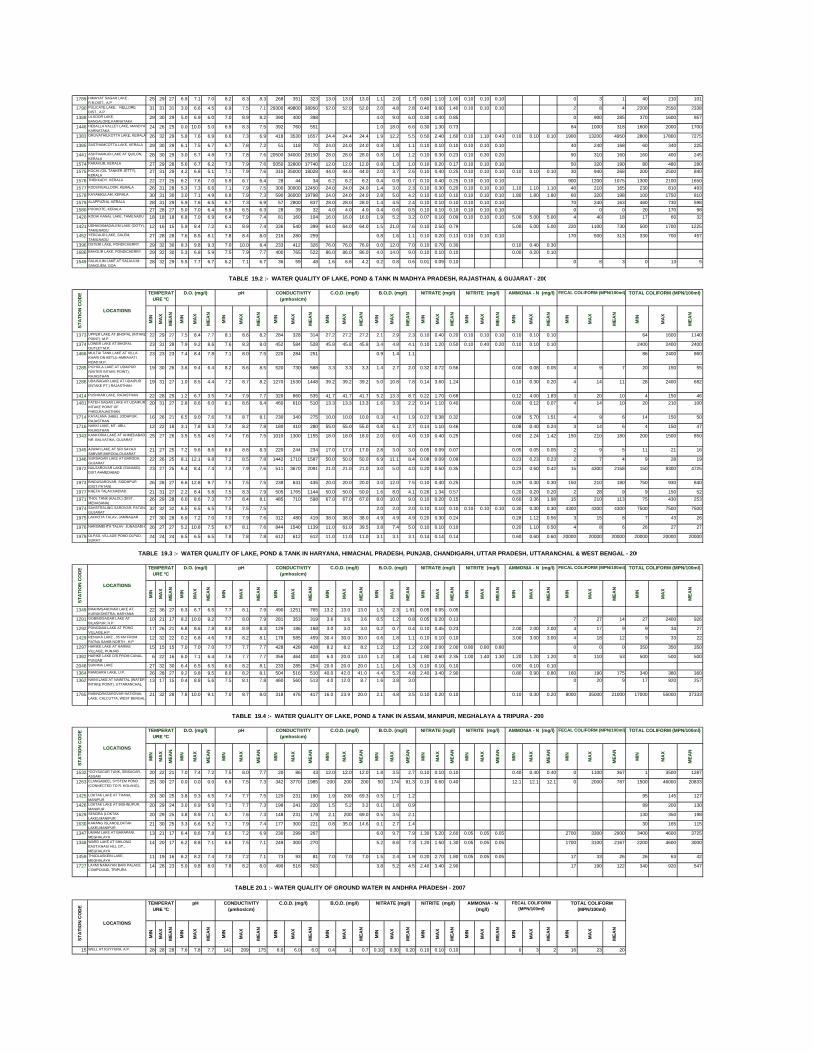
,
1549 SALAULIM LAKE AT SALAULIM - 28 32 29 5.5 7.7 6.7 6.2 7.1 6.7 36 59 48 1.6 6.8 4.2 0.2 0.8 0.6 0.01 0.09 0.10 0 8 3 0 13 5
,
1979 OLPAD, VILLAGE POND:OLPAD, 24 24 24 6.5 6.5 6.5 7.8 7.8 7.8 612 612 612 11.0 11.0 11.0 3.1 3.1 3.1 0.14 0.14 0.14 0.60 0.60 0.60 20000 20000 20000 20000 20000 20000
1765 RABINDRASAROVAR NATIONAL LAKE, CALCUTTA, WEST BENGAL
21 32 28 7.8 10.0 9.1 7.0 8.7 8.0 318 476 417 16.0 23.9 20.0 2.1 4.8 3.5 0.10 0.20 0.10 0.10 0.30 0.20 8000 35000 21000 17000 55000 37333
1727 LAXMI NARAYAN BARI PALACE COMPOUND, TRIPURA
14 28 23 5.0 9.8 8.0 7.8 8.2 8.0 490 516 503 3.8 5.2 4.5 2.40 3.40 2.90 17 190 122 340 920 547
15 WELL AT KUYYURA, A.P. 28 28 28 7.6 7.8 7.7 141 209 175 6.0 6.0 6.0 0.4 1 0.7 0.10 0.30 0.20 0.10 0.10 0.10 0 3 2 16 23 20
1789 HIMAYAT SAGAR LAKE , 25 29 27 6.9 7.1 7.0 8.2 8.3 8.3 268 351 323 13.0 13.0 13.0 1.1 2.0 1.7 0.80 1.10 1.00 0.10 0.10 0.10 0 3 1 40 210 101
1790R.R.DIST., A.PPULICATE LAKE , NELLORE 31 31 31 3.0 6.6 4.5 6.9 7.5 7.1 29300 49800 38950 52.0 52.0 52.0 2.0 4.8 2.8 0.40 3.60 1.40 0.10 0.10 0.10 2 8 4 2200 2550 2338
1388DIST., A.PULSOOR LAKE, 29 30 29 5.0 6.9 6.0 7.0 8.9 8.2 390 400 398 4.0 9.0 6.0 0.30 1.40 0.85 0 900 285 370 1600 957
1446BANGALORE,KARNATAKAHEBALLA VALLEY LAKE, MANDYA 24 26 25 0.0 10.0 5.0 6.9 8.3 7.5 392 760 551 1.0 18.0 6.6 0.30 1.30 0.73 84 1000 318 1600 2000 1700
1383KARNATAKAORUVATHILKOTTA LAKE, KERALA 26 32 29 5.8 7.6 6.9 6.6 7.3 6.9 418 3530 1657 24.4 24.4 24.4 1.9 12.2 5.5 0.50 2.40 1.60 0.10 1.10 0.43 0.10 0.10 0.10 1900 13200 4950 2800 17800 7275
1385 SASTHAMCOTTA LAKE, KERALA 29 30 29 6.1 7.5 6.7 6.7 7.8 7.2 51 118 70 24.0 24.0 24.0 0.8 1.8 1.1 0.10 0.10 0.10 0.10 0.10 0.10 40 240 168 60 340 225
1441 ASHTHAMUDI LAKE AT QUILON, 28 30 29 3.0 5.7 4.8 7.3 7.8 7.6 20500 34000 28150 28.0 28.0 28.0 0.8 1.6 1.2 0.10 0.30 0.23 0.10 0.30 0.20 90 310 160 160 400 245
1574KERALAPARAVUR, KERALA 27 29 28 5.6 6.7 6.2 7.3 7.9 7.6 5050 32800 17740 12.0 12.0 12.0 0.8 1.3 1.0 0.10 0.20 0.17 0.10 0.10 0.10 50 320 190 80 480 280
1575 KOCHI (OIL TANKER JETTY), 27 31 29 4.2 6.8 5.1 7.1 7.9 7.6 310 35000 18028 44.0 44.0 44.0 2.0 3.7 2.6 0.10 0.40 0.25 0.10 0.10 0.10 0.10 0.10 0.10 30 940 268 200 2500 840KERALATHEKKADY, KERALA1576KODUNGALLOOR, KERALA
22 27 25 6.2 7.6 7.0 5.9 6.7 6.4 28 44 34 6.2 6.2 6.2 0.4 0.9 0.7 0.10 0.40 0.25 0.10 0.10 0.10 900 1200 1075 1300 2100 16501577
KAYAMKULAM, KERALA
26 31 28 5.3 7.3 6.6 7.1 7.9 7.5 300 30000 12450 24.0 24.0 24.0 1.4 3.0 2.3 0.10 0.30 0.20 0.10 0.10 0.10 1.10 1.10 1.10 40 210 165 230 810 4931578
ALAPPUZHA, KERALA
30 31 30 3.0 7.1 4.9 6.8 7.9 7.3 590 36000 19798 24.0 24.0 24.0 2.8 5.0 4.2 0.10 0.10 0.10 0.10 0.10 0.10 1.80 1.80 1.80 60 320 198 100 1750 81015791580 POOKOTE, KERALA
2827
3128
2927
5.95.0
7.67.0
6.56.4
6.75.9
7.36.5
6.96.3
5728
280039
83732
28.04.0
28.04.0
28.04.0
1.40.4
4.50.6
2.40.5
0.100.10
0.100.10
0.100.10
0.100.10
0.100.10
0.100.10
700
2400
1630
46020
730170
59898
1420 KODAI KANAL LAKE, TAMILNADU 18 18 18 6.8 7.0 6.9 6.4 7.9 7.4 81 160 104 16.0 16.0 16.0 1.9 5.2 3.2 0.07 0.10 0.09 0.10 0.10 0.10 5.00 5.00 5.00 4 40 18 17 60 32
1421 UDHAGAMADALEM LAKE (OOTY), 12 16 15 5.9 8.4 7.2 6.1 8.9 7.4 336 540 399 64.0 64.0 64.0 1.5 21.0 7.6 0.10 2.50 0.79 5.00 5.00 5.00 220 1100 730 500 1700 1225
1452TAMILNADUYERCAUD LAKE, SALEM, 27 28 28 7.6 8.5 8.1 7.8 8.4 8.0 216 280 259 0.8 1.6 1.1 0.10 0.20 0.13 0.10 0.10 0.10 170 500 313 330 700 457
1396TAMILNADUOSTERI LAKE, PONDICHERRY 29 32 30 8.3 9.8 9.3 7.0 10.0 8.4 233 412 326 76.0 76.0 76.0 0.0 12.0 7.0 0.10 0.70 0.30 0.10 0.40 0.30
1686 BAHOUR LAKE, PONDICHERRY 29 32 30 5.3 6.8 5.9 7.5 7.9 7.7 400 765 522 86.0 86.0 86.0 4.0 14.0 9.0 0.10 0.10 0.10 0.00 0.20 0.10
SANGUEM, GOA
ATI
ON
CO
DE
LOCATIONS
TEMPERAT D.O. (mg/l)
TABLE 19.2 :
pH
- WATER QUALITY
CONDUCTIVITY
OF LAKE, POND
C.O.D. (mg/l)
& TANK IN MADH
B.O.D. (mg/l)
YA PRADESH,
NITRATE (mg/l)
RAJASTHAN, &
NITRITE (mg/l)
GUJARAT - 200
AMMONIA - N (mg/l) FECAL COLIFORM (MPN/100ml) TOTAL COLIFORM (MPN/100ml)
MIN X N
URE ºC
MIN X N
MIN X N
MIN
(µX
mhos/c
N
m)
MIN X N
MIN X N
MIN X N
MIN X N
MIN X N
MIN X A
N
MIN X N
ST
MA
MEA MA
MEA MA
MEA MA
MEA MA
MEA MA
MEA MA
MEA MA
MEA MA
MEA MA
ME MA
MEA
1373 UPPER LAKE AT BHOPAL (INTAKE 22 29 27 7.5 8.4 7.7 8.1 8.6 8.2 284 328 314 27.2 27.2 27.2 2.1 2.9 2.3 0.10 0.40 0.20 0.10 0.10 0.10 0.10 0.10 0.10 64 1600 1140
1374POINT), M.P.LOWER LAKE AT BHOPAL OUTLET M.P.
23 31 28 7.9 9.2 8.6 7.6 8.3 8.0 452 584 528 45.8 45.8 45.8 3.4 4.8 4.1 0.10 1.20 0.50 0.10 0.40 0.20 0.10 0.10 0.10 2400 2400 2400
1466 MULTAI TANK LAKE AT VILLA. KHARI ON BETUL-AMRAVATI ROAD M.P.
23 23 23 7.4 8.4 7.8 7.1 8.0 7.5 220 284 251 0.9 1.4 1.1 86 2400 860
1285 PICHOLA LAKE AT UDAIPUR (WATER INTAKE POINT), RAJASTHAN
19 30 26 3.6 9.4 6.4 8.2 8.6 8.5 520 730 588 3.3 3.3 3.3 1.4 2.7 2.0 0.32 0.72 0.56 0.00 0.08 0.05 4 9 7 20 150 55
1286 UDAISAGAR LAKE AT UDAIPUR (INTAKE PT.) RAJASTHAN
19 31 27 1.0 8.5 4.4 7.2 8.7 8.2 1270 1530 1448 39.2 39.2 39.2 5.0 10.8 7.8 0.14 3.60 1.24 0.10 0.30 0.20 4 14 11 28 2400 682
1414 PUSHKAR LAKE, RAJASTHAN 22 28 25 1.2 6.7 3.5 7.4 7.9 7.7 320 860 535 41.7 41.7 41.7 5.2 13.3 8.7 0.22 1.70 0.68 0.12 4.00 1.83 3 20 10 4 150 461481 FATEH SAGAR LAKE AT UDAIPUR
INTAKE POINT OF 20 31 27 2.8 8.6 6.0 8.1 8.6 8.4 460 610 510 13.3 13.3 13.3 1.6 3.3 2.2 0.14 1.10 0.40 0.00 0.12 0.07 4 14 10 20 210 100
1714PHED,RAJASTHANKAYALANA JHEEL JODHPUR, 16 26 21 6.5 9.0 7.6 7.6 8.7 8.1 230 340 275 10.0 10.0 10.0 0.3 4.1 1.9 0.22 0.38 0.32 0.08 5.70 1.51 4 9 6 14 150 50
1716RAJASTHANNAKKI LAKE, MT. ABU, RAJASTHAN
12 22 18 3.1 7.8 5.3 7.4 8.2 7.8 180 410 280 55.0 55.0 55.0 0.8 6.1 2.7 0.14 1.10 0.46 0.08 0.40 0.24 3 14 6 4 150 47
1343 KANKORIA LAKE AT AHMEDABADNR. BALVATIKA, GUJARAT
25 27 26 3.5 5.5 4.5 7.4 7.6 7.5 1010 1300 1155 18.0 18.0 18.0 2.0 6.0 4.0 0.10 0.40 0.25 0.60 2.24 1.42 150 210 180 200 1500 850
1345 AJWAH LAKE AT SRI SAYAJI 21 27 25 7.2 9.6 8.6 8.0 8.6 8.3 220 244 234 17.0 17.0 17.0 2.8 3.0 3.0 0.05 0.09 0.07 0.05 0.05 0.05 2 9 5 11 21 16
1346SABVAR,BARODA,GUJARATSURSAGAR LAKE AT BARODA, GUJARAT
22 26 25 8.1 12.1 9.8 7.2 8.5 7.8 1442 1710 1587 50.0 50.0 50.0 6.9 11.1 8.4 0.08 0.09 0.09 0.23 0.23 0.23 2 7 4 9 28 19
1972 NALSAROVAR LAKE (SANAND), DIST.AHMEDABAD
23 27 25 6.4 8.4 7.4 7.3 7.9 7.6 511 3670 2091 21.0 21.0 21.0 3.0 5.0 4.0 0.20 0.50 0.35 0.23 0.60 0.42 15 4300 2158 150 9300 4725
1973 BINDUSAROVAR, SIDDHPUR 26 28 27 6.6 12.8 9.7 7.5 7.5 7.5 238 631 435 20.0 20.0 20.0 3.0 12.0 7.5 0.10 0.40 0.25 0.29 0.30 0.30 150 210 180 750 930 840
1977(DIST.PATAN)KHETA TALAV;NADIAD 21 31 27 2.2 8.4 5.8 7.5 8.3 7.9 505 1765 1144 50.0 50.0 50.0 1.6 8.0 4.1 0.26 1.34 0.57 0.20 0.20 0.20 2 28 9 9 150 52
1971 THOL TANK (KALOL) (DIST. 26 29 28 6.0 8.6 7.3 7.7 8.4 8.1 485 710 598 67.0 67.0 67.0 8.0 10.0 9.0 0.10 0.20 0.15 0.60 3.36 1.98 15 210 113 75 430 253
1974MEHASANA)SAHSTRALING SAROVAR, PATAN, 32 32 32 6.5 6.5 6.5 7.5 7.5 7.5 2.0 2.0 2.0 0.10 0.10 0.10 0.10 0.10 0.10 0.30 0.30 0.30 4300 4300 4300 7500 7500 7500
1975GUJARATLAKHOTA TALAV, JAMNAGAR 27 30 28 6.9 7.2 7.0 7.0 7.9 7.6 312 480 419 38.0 38.0 38.0 4.9 4.9 4.9 0.20 0.30 0.24 0.28 1.12 0.56 3 15 8 7 43 26
1976 NARSIMEHTA TALAV- JUNAGADH 26 27 27 5.2 10.8 7.5 6.7 8.1 7.6 844 1540 1139 11.0 61.0 39.5 3.8 7.4 5.0 0.10 0.10 0.10 0.20 1.10 0.50 4 8 6 26 27 27
SURAT
ATI
ON
CO
DE
TA
LOCATIONS
BLE 19.3 :
TEMPERAT
- WATER QUA
D.O. (mg/l)
LITY OF LAKE, PO
pH
ND & TANK IN HAR
CONDUCTIVITY
YANA, HIMACHA
C.O.D. (mg/l)
L PRADESH, PUN
B.O.D. (mg/l)
JAB, CHANDIG
NITRATE (mg/l)
ARH, UTTAR PR
NITRITE (mg/l)
ADESH, UTTARAN
AMMONIA - N (mg/l)
CHAL & WEST BENGAL
FECAL COLIFORM (MPN/100ml)
- 200
TOTAL COLIFORM (MPN/100ml)
MIN X N
URE ºC
MIN X N
MIN X N
MIN
(µ
X
mhos/c
N
m)
MIN X N
MIN X N
MIN X N
MIN X N
MIN X N
MIN X N
MIN X N
ST
MA
MEA MA
MEA MA
MEA MA
MEA MA
MEA MA
MEA MA
MEA MA
MEA MA
MEA MA
MEA MA
MEA
1349 BRAHMSAROVAR LAKE AT 22 36 27 6.3 6.7 6.5 7.7 8.1 7.9 490 1251 765 13.2 13.0 13.0 1.5 2.3 1.91 0.05 0.05 0.05
1291KURUKSHETRA, HARYANAGOBINDSAGAR LAKE AT 10 21 17 8.2 10.0 9.2 7.7 8.0 7.9 281 353 319 3.6 3.6 3.6 0.5 1.2 0.8 0.05 0.20 0.13 7 27 14 27 2400 926
1292BILASPUR, H.P.PONGDAM LAKE AT PONG 17 26 21 6.8 8.6 7.8 8.0 8.9 8.3 129 186 168 3.0 3.0 3.0 0.2 0.7 0.4 0.10 0.45 0.23 2.00 2.00 2.00 4 17 9 9 34 27
1429VILLAGE,H.P.RENUKA LAKE , 35 KM FROM 12 32 22 0.2 6.8 4.6 7.8 8.2 8.1 178 585 459 30.4 30.0 30.0 0.6 1.8 1.1 0.10 0.10 0.10 3.00 3.00 3.00 4 18 12 9 33 22
1297PATNA SAHIB NORTH , H.PHARIKE LAKE AT HARIKE 15 15 15 7.0 7.0 7.0 7.7 7.7 7.7 428 428 428 8.2 8.2 8.2 1.2 1.2 1.2 2.00 2.00 2.00 0.80 0.80 0.80 0 0 0 350 350 350
1382VILLAGE, PUNJABHARIKE LAKE D/S FROM CANAL, 6 22 16 6.0 7.1 6.4 7.6 7.7 7.7 356 464 403 6.0 20.0 13.0 1.2 1.8 1.4 1.80 2.60 2.35 1.00 1.40 1.30 1.20 1.20 1.20 0 110 53 500 500 500PUNJABSUKHNA LAKE2046
1364 RAMGARH LAKE, U.P.
2726
3228
3027
6.49.2
6.59.8
6.59.5
8.08.0
8.28.2
8.18.1
233504
285516
254510
20.0 40.0
20.0 42.0
20.0 41.0
1.14.4
1.65.2
1.34.8
0.10 0.10 0.10 0.00 0.10 0.102.40 3.40 2.90 0.80 0.90 0.80 160 190 175 340 380 360
1362 NAINI LAKE AT NAINITAL (WATER INTAKE POINT), UTTARANCHAL
13 17 15 0.4 8.8 5.6 7.5 8.1 7.8 460 560 513 4.0 12.0 8.7 1.6 3.8 3.0 0 20 9 17 920 257
ATI
ON
CO
DE
LOCATIONS
TEMPERAT D.O. (mg/l)
TABLE 19.4
pH
:- WATER QUALIT
CONDUCTIVITY
Y OF LAKE, POND
C.O.D. (mg/l)
& TANK IN ASS
B.O.D. (mg/l)
AM, MANIPUR, M
NITRATE (mg/l)
EGHALAYA & T
NITRITE (mg/l)
RIPURA - 200
AMMONIA - N (mg/l) FECAL COLIFORM (MPN/100ml) TOTAL COLIFORM (MPN/100ml)
MIN X N
URE ºC
MIN X N
MIN X N
MIN
(µ
X
mhos/c
N
m)
MIN X N
MIN X N
MIN X N
MIN X N
MIN X N
MIN X N
MIN X N
ST
MA
MEA MA
MEA MA
MEA MA
MEA MA
MEA MA
MEA MA
MEA MA
MEA MA
MEA MA
MEA MA
MEA
1532 *GOYSAGAR TANK, SIBSAGAR, ASSAM
20 22 21 7.0 7.4 7.2 7.5 8.0 7.7 20 86 43 12.0 12.0 12.0 1.8 3.5 2.7 0.10 0.10 0.10 0.40 0.40 0.40 0 1100 367 1 3500 1287
1263 ELANGABEEL SYSTEM POND (CONNECTED TO R. KOLANG),
25 30 27 0.0 0.0 0.0 6.9 7.5 7.3 342 3770 1985 200 200 200 50 174 91.3 0.10 0.60 0.40 12.1 12.1 12.1 0 2000 787 1500 46000 20833
1425 LOKTAK LAKE AT THANA, 20 30 25 3.8 9.3 6.5 7.4 7.7 7.5 120 231 190 1.9 200 69.3 0.5 1.7 1.2 95 145 127
1426MANIPURLOKTAK LAKE AT BISHNUPUR, 20 29 24 3.0 8.9 5.9 7.1 7.7 7.3 198 241 220 1.5 5.2 3.2 0.1 1.8 0.9 89 200 130
1629MANIPURSENDRA (LOKTAK 20 29 25 3.8 8.9 7.1 6.7 7.6 7.3 148 231 179 2.1 200 69.0 0.5 3.5 2.1 130 350 198
1630LAKE),MANIPURKARANG ISLAND(LOKTAK 21 30 25 3.3 6.6 5.2 7.1 7.9 7.4 177 300 221 0.8 35.0 14.6 0.1 2.7 1.4 30 165 115
1347LAKE),MANIPURUMIAM LAKE AT BARAPANI, MEGHALAYA
13 21 17 6.4 8.6 7.8 6.5 7.2 6.9 230 299 267 6.0 9.7 7.9 1.30 5.20 2.60 0.05 0.05 0.05 2700 3300 2900 3400 4600 3725
1348 WARD LAKE AT SHILONG EAST,KHASI HILL DT.,
14 20 17 6.2 8.8 7.1 6.8 7.5 7.1 249 300 270 5.2 8.6 7.3 1.20 1.50 1.30 0.05 0.05 0.05 1700 3100 2167 2200 4600 3000
1459MEGHALAYATHADLASKEIN LAKE, MEGHALAYA
11 19 16 6.2 8.2 7.4 7.0 7.2 7.1 73 93 81 7.0 7.0 7.0 1.5 2.4 1.9 0.20 2.70 1.80 0.05 0.05 0.05 17 33 26 26 63 42
ATI
ON
CO
DE
LOCATIONS
TEMPERAT pH
TABLE 20.1
CONDUCTIVITY
:- WATER QUALIT
C.O.D. (mg/l)
Y OF GROUND WA
B.O.D. (mg/l)
TER IN ANDHRA
NITRATE (mg/l)
PRADESH - 20
NITRITE (mg/l)
07
AMMONIA - N FECAL COLIFORM TOTAL COLIFORM
MIN X N
URE ºC
MIN X N
MIN
(µ
X
mhos/cm
N
)
MIN X N
MIN X N
MIN X N
MIN X N
MIN X
(mg/l)
N
MIN
(M
X
PN/100m
N
l)
MIN X N
(MPN/100ml)
ST MA
MEA MA
MEA MA
MEA MA
MEA MA
MEA MA
MEA MA
MEA MA
MEA MA
MEA MA
MEA

1524 O/W. -NEAR PARTAP NAGAR BRIIDGE -KAKINADA , E.G.DIST.,
27 27 27 7.3 7.3 7.3 2040 3120 2580 3.0 3.0 3.0 0.2 0.2 0.2 10.6 16.8 13.7 0.50 0.50 0.50 1.80 1.80 1.80 0 0 0 6000 12000 9000
TRIPURA1734 GANDHIGRAM, AGARTALA, 27 27 27 7.2 7.2 7.2 85 85 85 0.05 0.05 0.05
TWO POINTS IN INDUSTRIAL AREA MALANPUR, M.P
1556 AT PAONTA SAHIB, H.P 21 27 24 6.8 7.5 7.2 700 812 750 32.6 54.0 43.3 0.50 0.60 0.551557 AT PARWANOO, H.P 24 25 25 6.9 7.6 7.3 671 676 674 38.0 43.0 40.5 0.20 0.20 0.20
16 WELL AT TADAVAI A.P. 26 26 26 7.2 7.9 7.6 242 1018 630 8.0 8.0 8.0 0.2 0.5 0.4 0.10 8.10 4.10 0.10 0.10 0.10 0 3 2 12 23 182627
WELL AT VIJAYWADA, A.P.
WELL AT PEDDAVOORA, A.P.
2830
2930
2930
7.67.1
7.67.1
7.67.1
14281650
17431650
15861650
26.06.0
26.06.0
26.06.0
0.80.6
1.70.6
1.30.6
2.203.80
2.403.80
2.303.80
0.100.10
0.100.10
0.100.10
23
23
23
22090
48090
35090
1791 B/W. - EAST OF SAICHERUVU ,PAIDIPALLY (V),WARANGAL DIST., A.P
29 30 30 7.0 8.1 7.6 752 1128 940 14.0 14.0 14.0 2.0 4.8 3.4 5.30 10.3 7.80 0.10 0.10 0.10 0 3 2 0 9 5
1792
1793
B/W -NEAR CKM COLLEGE , ENUMAMULA (V) ,WARANGAL DIST., A.PO/W - BHOOMAIAH NEAR ASHPONDS OF NTPC,
29
27
30
28
30
28
6.3
7.9
7.7
8.6
7.0
8.3
2400
1243
3590
1826
2995
1535
10.0
18.0
10.0
18.0
10.0
18.0
0.9
0.8
2.4
4.0
1.7
2.4
11.2
1.60
11.6
7.00
11.4
4.30
0.10
0.10
0.10
0.10
0.10
0.10
0
0
3
3
2
2
4
9
152
64
78
37
KUNDANPALLY (V) , RAMAGUNDAM , KARIMNAGAR,
1794A.PB/W - MANAKONDUR (V) , KARIMNAGAR DIST., A.P
28 28 28 8.3 8.3 8.3 1080 1080 1080 11.0 11.0 11.0 1.0 1.0 1.0 9.30 9.30 9.30 0.10 0.10 0.10 3 3 3 7 7 7
1795
1525
B/W. - PANCHAYAT OFFICE ,,BOLLARAM (V) MEDAK DIST., A.P
B/W - IDA , NEAR CHAITANYA
28
30
29
30
29
30
6.6
7.6
6.9
7.6
6.8
7.6
3004
446
5720
446
4362
446
4.0
3.0
4.0
3.0
4.0
3.0
0.3 0.8 0.6 3.30
0.20
3.50
0.20
3.40
0.20
0.10
0.10
0.10
0.10
0.10
0.10
3
3
3
3
3
3
90
85
98
85
94
85
1811
CHLORIDES ,PASHAMAYLAM , MEDAK DIST.
B/W. - PRIMARY SCHOOL - 27 29 28 7.6 7.8 7.7 1133 1134 1134 12.0 12.0 12.0 0.1 1.1 0.6 0.80 0.90 0.90 0.10 0.10 0.10 3 3 3 96 100 98
1810
RUDRAVELLI (V) , BIBINAGAR (M), NALGONDA DIST., A.P
B/W - SRI RAMNAGAR COLONY, 28 30 29 7.4 7.5 7.5 835 1465 1150 18.0 18.0 18.0 0.2 0.2 0.2 0.60 2.60 1.60 0.10 0.10 0.10 3 3 3 96 100 98
1513
SAKKAR NAGAR, BODHAN, NIZAMABAD DIST. , A.P
B W. - KRISHNA MURTHY, D.NO. 31 31 31 7.8 7.8 7.8 1180 1180 1180 22.0 22.0 22.0 1.7 1.7 1.7 20.1 20.1 20.1 0.10 0.10 0.10 2 2 2 1100 1100 110048-16-43 AUTONAGAR VIJJAYAWADA, KRISNA DIST., A.P.
1514 B/W. - VIJAY KUMAR AUTONAGAR VIJAYAWADA, KRISHNA DIST., A.P.
28 30 29 7.8 8.0 7.9 1174 1903 1539 24.0 24.0 24.0 0.8 1.7 1.3 2.40 27.4 14.9 0.10 0.10 0.10 2 2 2 300 1100 700
1515 B/W. - NAGARAM(V), PALVONCHA, KHAMMAM DIST.,
30 30 30 7.5 8.0 7.8 1106 1820 1463 10.0 10.0 10.0 1.0 1.4 1.2 2.20 3.90 3.10 0.10 0.10 0.10 2 2 2 280 800 540
1516A.P.B W OF NAVLOK GARDENS 31 31 31 7.6 7.6 7.6 584 584 584 20.0 20.0 20.0 1.6 1.6 1.6 0.50 0.50 0.50 0.10 0.10 0.10 2 2 2 2400 2400 2400
1517NELLORE APB/W. - TUNGBHADRA RIVER 26 28 27 7.5 7.8 7.7 1437 2080 1677 10.0 10.0 10.0 1.2 1.3 1.2 5.70 14.0 11.2 0.10 0.10 0.10 4 11 8 17 160 79
1518NEAR KURNOOL, A.P.B/W. - NANDYAL, KURNOOL DIST., 26 29 28 7.4 7.5 7.5 1628 1645 1637 10.0 10.0 10.0 1.0 1.0 1.0 13.6 28.0 20.8 0.10 0.10 0.10 4 16 10 14 100 57
1519A.P.B/W. - NAGIRI, CHITTOOR DIST., A.P
22 25 23 7.7 7.8 7.8 1860 2350 2105 10.0 10.0 10.0 1.2 1.2 1.2 6.30 11.2 8.80 0.10 0.10 0.10 2 6 4 14 27 21
1520 B/W. - SWARNAMUKHI RIVER, SRIKALAHASTI, CHITTOOR DIST., A.P.
24 25 25 7.7 7.8 7.8 2030 2330 2180 10.0 10.0 10.0 1.0 1.4 1.2 8.40 9.50 9.00 0.10 0.10 0.10 2 4 3 12 26 19
1521 O/W. - NEAR RAMA TEMPLE , WARD No.2 , MINDI ,
28 28 28 7.3 7.6 7.5 5040 7380 6210 3.0 3.0 3.0 0.4 0.5 0.5 5.10 6.50 5.80 0.10 0.10 0.10 4.20 4.20 4.20 0 0 0 4000 5000 4500
1522VISAKHAPATNAM, A.PO/W. PEDDANUYYI - VIZIANAGARAM, A.P
29 29 29 7.3 7.3 7.3 1056 2350 1703 4.0 4.0 4.0 0.2 0.2 0.2 31.6 42.7 37.2 0.10 0.10 0.10 1.50 1.50 1.50 0 0 0 5000 8000 6500
1523 B/W. - NEAR M/S ANDHRA SUGARS LTD. , KOVVUR , W.G.DIST., A.P
28 28 28 6.9 7.2 7.1 280 2040 1160 2.0 2.0 2.0 0.0 0.2 0.1 0.10 45.8 23.0 0.10 0.10 0.10 0.50 0.50 0.50 0 9 5 250 10000 5125
A.P
ATI
ON
CO
DE
LOCATIONS
TEMPERAT
TABL
pH
E 20.2 :- WATER Q
CONDUCTIVITY
UALITY OF GROUN
C.O.D. (mg/l)
D WATER IN ASS
B.O.D. (mg/l)
AM, MEGHALAY
NITRATE (mg/l)
A, MIZORAM & T
NITRITE (mg/l)
RIPURA - 2007
AMMONIA - N FECAL COLIFORM TOTAL COLIFORM
X N
URE ºC
X N
(µ
X
mhos/cm
N
)
X N X N X N X N X
(mg/l)
N
(M
X
PN/100m
N
l)
X N
(MPN/100ml)
ST MIN
MA
MEA MIN
MA
MEA MIN
MA
MEA MIN
MA
MEA MIN
MA
MEA MIN
MA
MEA MIN
MA
MEA MIN
MA
MEA MIN
MA
MEA MIN
MA
MEA
1533 *DIGBOI, TINSUKIA DISTT., 7 26 16 6.6 7.2 6.9 338 355 347 19.5 19.5 19.5 0.6 1.5 1.1 0.20 0.30 0.30 0.50 0.50 0.50 0 360 180
1534ASSAM*KARBI ANGLONG DISTT., ASSAM 23 23 23 6.8 6.8 6.8 309 309 309 4.4 4.4 4.4 1.6 1.6 1.6 0.10 0.10 0.10 0.90 0.90 0.90
1535 *SIBSAGAR , ASSAM 23 25 24 6.6 6.8 6.7 240 469 355 16.5 16.5 16.5 0.2 4.5 2.4 0.10 0.30 0.20 0.50 0.50 0.50 0 730 365 0 1500 7501536 *SIBSAGAR, ASSAM 21 23 22 6.8 6.9 6.9 238 270 254 6.0 6.0 6.0 2.5 4.3 3.4 0.10 0.10 0.10 0.10 0.10 0.10 0 2100 1050 0 9300 46501537 *(JORHAT, ASSAM 20 26 23 6.9 7.4 7.2 97 360 229 2.8 2.8 2.8 0.8 1.1 1 0.30 1.00 0.70 0 910 455 360 1400 8801538 *SILCHAR, ASSAM 26 28 27 6.0 6.7 6.4 316 405 361 9.3 9.3 9.3 0.5 1.6 1.1 0.10 0.70 0.40 1500 1500 1500 2800 240000 1214001539 *BARPETA, ASSAM 28 29 29 7.2 8.1 7.7 441 538 490 11.0 11.0 11.0 0.3 6.8 3.6 0.10 0.10 0.10 0.40 0.40 0.40 720 1500 1110 2700 9300 60001540 *BONAIGAON, ASSAM 26 27 27 6.8 6.8 6.8 492 1294 893 3.1 3.1 3.1 0.2 0.9 0.6 0.40 0.40 0.40 910 4300 2605 4300 9300 680015411542
*GUWAHATI, ASSAM
*GUWAHATI, ASSAM
1925
3029
2627
6.46.1
7.86.5
7.36.3
142157
454329
288243
6.85.6
12.65.6
9.65.6
1.11.0
2.412.0
1.786.5
0.100.10
0.862.50
0.391.30
0.10 1.12 0.60 3300.40 0.40 0.40 360
43002100
12301230
790910
930015000
26647955
1634 POLICE BAZAR, SHILLONG, 17 19 18 7.2 7.5 7.4 160 183 172 6.0 6.0 6.0 2.8 3 2.9 6.70 8.20 7.50 0.10 0.10 0.10 23 33 28 46 70 58
1635MEGHALAYAMAWLAI, SHILLONG, 17 20 18 6.9 7.1 7.0 235 245 240 2.5 2.8 2.7 9.20 12 10.6 0.10 0.10 0.10 23 140 82 43 170 107
1636MEGHALAYAINDUSTRIAL ESTATE, BYRNIHAT, 20 25 23 7.0 7.2 7.1 236 250 243 10.8 10.8 10.8 1.2 1.7 1.5 1.20 9.10 5.20 0.10 0.10 0.10 17 23 20 26 33 30
1637MEGHALAYASOHRA CHERRAPUNJEE, 20 24 22 6.5 6.8 6.7 109 145 127 6.4 6.4 6.4 0.3 0.4 0.4 2.80 7.20 5.00 0.10 0.10 0.10 17 21 19 26 33 30
1638MEGHALAYASHANGPUNG, MEGHALAYA 15 19 17 7.0 7.1 7.1 125 137 131 9.6 9.6 9.6 0.6 1.1 0.9 0.20 4.20 2.20 0.10 0.10 0.10 21 22 22 26 33 30
2054 RAMHLUM (NORTHERN PART), MIZORAM
19 25 22 6.0 6.8 6.4 318 474 415 0.3 1.2 0.7 0.20 0.20 0.20 7 7 7
2055 MISSION VENGTHLANG (SOUTHERN PART), MIZORAM
19 24 21 6.6 7.6 7.1 394 740 594 0.2 2 0.9 0.10 0.10 0.10 3 3 3
1405 WELL AT UDAIPUR (TUBEWELL), 25 28 26 6.8 8.0 7.3 470 513 490 0.05 1.70 1.03 0.10 0.10 0.10
1406TRIPURAWELL AROUND UDAIPUR 25 28 26 7.1 8.0 7.6 280 350 308 0.03 1.40 0.62 0.10 0.10 0.10
1730(TUBEWELL), TRIPURAKUNJBAN, AGARTALA, TRIPURA 27 27 27 5.6 5.6 5.6 130 130 130 0.05 0.05 0.05
1731 LANKAMURA, TRIPURA 28 28 28 6.5 6.5 6.5 48 48 48 0.05 0.05 0.05 0.10 0.10 0.101732 A.D.NAGAR, AGARTALA, TRIPURA 26 26 26 5.9 5.9 5.9 62 62 62 0.05 0.05 0.05
1733 SHIBNAGAR, AGARTALA, 26 26 26 6.6 6.6 6.6 110 110 110 0.05 0.05 0.05
TRIPURA
ATI
ON
CO
DE
LOCATIONS
TEMPERAT
TA
pH
BLE 20.3 :- WATE
CONDUCTIVITY
R QUALITY OF GR
C.O.D. (mg/l)
OUND WATER IN C
B.O.D. (mg/l)
HATTISGARH &
NITRATE (mg/l)
MADHYA PRAD
NITRITE (mg/l)
ESH - 2007
AMMONIA - N TOTAL COLIFORM
X N
URE ºC
X N
(µ
X
mhos/cm
N
)
X N X N X N X N X
(mg/l)
N
(M
X
PN/100m
N
l)
ST MIN
MA
MEA MIN
MA
MEA MIN
MA
MEA MIN
MA
MEA MIN
MA
MEA MIN
MA
MEA MIN
MA
MEA MIN
MA
MEA MIN
MA
MEA
1620 AT RAIPUR REGION, 25 30 28 7.1 7.9 7.5 426 788 610 19.2 38.4 27.7 0.2 0.8 0.7 2.70 2.80 2.74 0.10 0.40 0.30 2 9 5
1621CHHATISSGARHAT RAIPUR 25 30 29 6.8 8.9 7.6 438 1398 760 19.2 40.0 28.8 0.2 2.8 1.2 2.50 8.50 4.53 0.70 0.70 0.70 0.10 0.70 0.40 2 12 5
1622REGION,CHHATISSGARHAT BILASPUR REGION, 28 30 29 7.0 7.9 7.5 738 1869 1304 0.1 0.6 0.4 1.27 4.00 2.64 0.05 0.05 0.05 0.10 1.20 0.60 0 8 4
1623CHHATISSGARHAT BILASPUR REGION, 28 30 29 7.1 7.8 7.5 210 1939 1075 0.1 0.5 0.3 1.19 3.00 2.09 0.05 0.05 0.05 1.20 1.30 1.30 0 6 3
52CHHATISSGARHWELL, SHRI RAO PRAJAPATI WELL , M. P.
25 25 25 7.5 7.8 7.6 866 1049 942 10.0 10.0 10.0 0.3 0.9 0.7 0.60 1.80 1.33 0.10 0.10 0.10 0.10 0.10 0.10 70 120 95
1616
1617
OPEN WELL/TUBE WELL INDUSTRIAL AREA, GOVINDPURA, BHOPAL, M.POPEN WELL/TUBE WELL 30 30 30
6.1
7.3
6.7
8.2
6.5
7.7
1262
576
2225
888
1657
783
36.6
29.0
36.6
29.0
36.6
29.0
1.4
1.2
3
2.5
2.2
2
1.10
0.10
2.50
0.60
1.60
0.35
0.20
0.20
0.60
0.20
0.40
0.20
0.10
0.10
0.10
0.10
0.10
0.10
104
32
1600
980
704
415
1618
INDUSTRIAL AREA MANDIDEEP, DISTT. RAISEN, M.P
GROUND WATER SAMPLING AT 25 27 26 6.6 7.8 7.3 1280 1290 1285 33.6 33.6 33.6 2.7 2.7 2.7 0.10 5.50 1.98
1619
TWO POINTS IN INDUSTRIAL AREA MALANPUR, M.P
GROUND WATER SAMPLING AT 18 28 22 7.2 7.9 7.7 1300 1480 1370 37.8 37.8 37.8 0.20 5.50 1.56
ATI
ON
CO
DE
LOCATIONS
TEMPERAT
TABLE 2
pH
0.4:- WATER QUAL
CONDUCTIVITY
ITY OF GROUND W
C.O.D. (mg/l)
ATER IN HIMACH
B.O.D. (mg/l)
AL PRADESH, C
NITRATE (mg/l)
HANDIGARH AN
NITRITE (mg/l)
D PUNJAB - 200
AMMONIA - N
7
FECAL COLIFORM TOTAL COLIFORM
X N
URE ºC
X N
(µ
X
mhos/cm
N
)
X N X N X N X N X
(mg/l)
N
(M
X
PN/100m
N
l)
X N
(MPN/100ml)
ST MIN
MA
MEA MIN
MA
MEA MIN
MA
MEA MIN
MA
MEA MIN
MA
MEA MIN
MA
MEA MIN
MA
MEA MIN
MA
MEA MIN
MA
MEA MIN
MA
MEA
1555 AT KALA AMB, H.P 24 24 24 8.0 8.7 8.3 810 976 893 58.2 97.0 77.6

LUDHIANA
KANNUR DISTTM , KERALA
PONDICHERRY
AURANGABAD1994 TPS-DURGAPUR, CHANDRAPUR 17 25 22 6.7 8.2 7.5 297 787 582 28.0 28.0 28.0 1.6 8.0 5.2 1.20 2.60 1.70 0.10 4.00 1.60 4 9 7 6 130 68
1558 AT BADDI, H.P 27 28 28 7.3 7.8 7.5 455 457 456 5.7 6.0 5.9 0.60 0.70 0.701559 AT BAROTIWALA, H.P 27 27 27 7.1 7.1 7.1 465 465 465 9.0 9.0 9.0 0.70 0.70 0.701560 AT NALAGARH, H.P 27 33 30 6.9 7.8 7.3 1335 1337 1336 92.6 107 99.8 1.10 1.20 1.201561 AT DAMTAL, H.P 16 28 22 7.2 8.0 7.6 373 823 598 86.5 86.5 86.5 0.1 0.1 0.1 0.30 5.10 2.70 2 2 2 4 4 415621872
AT UNA, H.P
SHIMLA D/S OF MSW DUMPING
2615
2715
2715
7.48.8
8.08.8
7.78.8
735578
1047578
891578
110 114 11210.0 10.0 10.0
0.600.70
0.800.70
0.700.70 80 80 80 390 390 390
1873SIOTDHARAMSHALA KANGRA D/S OF 12 21 17 6.3 7.8 7.1 327 336 332 35.4 35.4 35.4 0.2 0.2 0.2 0.40 3.40 1.90 2 2 2 11 11 11
1875MSW DUMPING SIOTMANDI-D/S OF MSW DUMPING 18 18 18 7.8 7.8 7.8 304 304 304 19.0 19.0 19.0 0.40 0.40 0.40SIOT
1876 PARWANOO INDUSTRIAL AREA 24 24 24 7.7 7.7 7.7 771 771 771 82.0 82.0 82.0 0.30 0.30 0.30
18771878
BADDI INDUSTRIAL AREA
BAROTIWALA INDUSTRIAL AREA
2727
2927
2827
7.37.0
7.87.8
7.67.4
613538
1327564
970551
42.417.3
27320.0
15818.7
0.901.10
1.201.30
1.101.20
1879 NALAGARH INDUSTRIAL AREA 29 32 31 7.3 7.3 7.3 1310 1481 1396 166 202 184 1.20 1.40 1.30
1880 KALA AMB INDUSTRIAL AREA 24 24 24 7.7 8.0 7.8 629 790 710 34.0 59.6 46.8 0.10 0.10 0.10
1881 PAONTA SAHIB INDUSTRIAL 27 27 27 7.6 7.6 7.6 555 555 555 19.8 19.8 19.8 0.60 0.60 0.60AREA
1882 MEHATPUR INDUSTRIAL AREA 27 27 27 7.8 8.1 7.9 447 708 578 35.6 42.0 38.8 0.70 0.80 0.80
1883 UNA INDUSTRIAL AREA 27 27 27 7.7 7.8 7.7 384 599 492 17.0 37.6 27.3 0.30 0.40 0.402039 SECTOR 15, CHANDIGARH 25 28 27 6.8 6.9 6.9 842 852 847 28.0 28.0 28.0 0.0 0.1 0.1 4.30 4.80 4.55 0.10 0.10 0.102040 SECTOR 22, CHANDIGARH 27 27 27 7.1 7.1 7.1 838 838 838 22.0 22.0 22.0 0.1 0.1 0.1 4.90 4.90 4.902041 SECTOR 34, CHANDIGARH 25 26 26 7.0 7.1 7.1 670 899 785 40.0 40.0 40.0 0.1 0.2 0.2 4.60 6.30 5.4520422043
SECTOR 47, CHANDIGARH
PALSORA VILLAGE, CHANDIGARH
2525
2627
2626
7.26.9
7.47.3
7.37.1
6501095
6701476
6601286
40.028.0
40.028.0
40.028.0
0.00.6
0.11.3
0.11
0.100.10
6.300.40
3.200.25
2044 DHANAS VILLAGE, CHANDIGARH 25 25 25 6.9 7.1 7.0 867 950 909 14.0 14.0 14.0 0.1 0.2 0.2 1.10 6.30 3.70
20451898
DADU MAJRA, CHANDIGARH
PETROL PUMP OPP. HERO CYCLE, LUDHIANA
2520
2720
2620
6.87.2
7.27.2
7.07.2
8421290
8711346
8571318
26.0 26.0 26.0 0.0 0.3 0.2 1.700.10
4.800.20
3.250.15 0.10 0.10 0.10
1899 BHAGWAN SINGH, H.NO.907, DASMESH NAGAR, GALI NO. 6, LUDHIANA
21 21 21 4.2 7.2 5.7 1360 1467 1414 2.20 2.20 2.20
1900 GURCHAARAN SINGH HAIBOWAL DAIRY COMPLEX, LUDHIANA
20 20 20 7.1 7.1 7.1 422 711 567 1.10 1.10 1.10
1901 DUSSHERA GROUND INDUSTRIAL ESTATE, LUDHIANA
21 21 21 7.4 7.4 7.4 428 569 499 2.10 2.10 2.10
1902 SHUKLA TEA STAL POINT, 19 19 19 7.3 7.3 7.3 1437 1520 1479 2.40 2.40 2.40
1903 PUNJAB AGRICULTUREAL UNIVERSITY, LUDHIANA
20 20 20 7.2 7.2 7.2 461 478 470 2.60 2.60 2.60
ATI
ON
CO
DE
LOCATIONS
TEMPERAT pH
TABLE
CONDUCTIVITY
20.5 :- WATER QU
C.O.D. (mg/l)
ALITY OF GROUN
B.O.D. (mg/l)
D WATER IN KE
NITRATE (mg/l)
RALA - 2007
NITRITE (mg/l) AMMONIA - N FECAL COLIFORM TOTAL COLIFORM
X N
URE ºC
X N
(µ
X
mhos/cm
N
)
X N X N X N X N X
(mg/l)
N
(M
X
PN/100m
N
l)
X N
(MPN/100ml)
ST MIN
MA
MEA MIN
MA
MEA MIN
MA
MEA MIN
MA
MEA MIN
MA
MEA MIN
MA
MEA MIN
MA
MEA MIN
MA
MEA MIN
MA
MEA MIN
MA
MEA
19 WELL AT ELOOR, KERALA 24 28 25 5.6 7.1 5.8 146 330 181 3.2 3.2 1.6 0.3 2.0 0.8 1.80 10.6 4.28 0.10 0.10 0.09 0 140 30 12 960 28022 WELL AT CHUNGAPALLY,
KERALA27 29 28 5.3 6.6 6.0 94 117 106 4.0 4.0 4.0 0.6 1.0 0.8 0.30 1.40 0.85 0.10 0.10 0.10 0 60 30 110 140 125
351581
WELL AT PUNALUR, KERALA
PAPPANAMKODE,THIRUVANANT
2827
2830
2829
6.65.3
6.95.7
6.85.5
242138
457330
350234
16.08.0
16.08.0
16.08.0
1.00.5
1.12.8
1.11.7
4.700.40
7.500.50
6.100.45
0.100.10
0.100.10
0.100.10
4.50 4.50 4.50 400
7090
5545
800
100220
90110
1582HAPURAM, KERALANEDUMANGAD,THIRUVANANTHA 27 29 28 5.7 6.4 6.1 240 700 470 8.0 8.0 8.0 1.8 3.0 2.4 0.50 1.20 0.85 0.10 0.10 0.10 0 80 40 0 170 85
1583PURAM, KERALAKUNDARA,KOLLAM DISTT. , 28 28 28 4.0 4.7 4.4 178 190 184 6.0 6.0 6.0 0.8 1.2 1.0 4.10 5.80 4.95 0.10 0.10 0.10 80 1280 680 120 1700 910
1584KERALACHERTHALA,ALLEPPY, KERALA 27 28 27 6.0 6.7 6.4 120 220 170 3.2 3.2 3.2 1.0 1.0 1.0 0.20 0.30 0.25 0.10 0.10 0.10 190 240 215 800 1670 1235
1585 VYTTILA,ERNAKULAM DISTT. , 26 28 27 6.7 7.6 7.2 310 515 413 3.2 3.2 3.2 0.8 1.2 1.0 0.70 1.40 1.05 0.10 0.20 0.15 60 60 60 310 540 425
1586KERALAEDAYAR ERNAKULAM DISTT., 28 28 28 5.8 6.6 6.2 141 200 171 1.6 1.6 1.6 0.4 0.5 0.5 2.50 4.60 3.55 0.10 0.10 0.10 0 30 15 3 120 62
1587KERALAKALAMASSERY ERNAKULAM 27 27 27 4.5 5.1 4.8 123 193 158 3.2 3.2 3.2 0.5 0.5 0.5 8.00 8.40 8.20 0.10 0.10 0.10 10 50 30 100 100 100DISTT. , KERALA
1588 PUNKUNNAM TRISSUR DISTT. , KERALA
28 28 28 5.6 5.8 5.7 181 190 186 3.2 3.2 3.2 1.2 1.6 1.4 3.20 4.60 3.90 0.05 0.10 0.08 4 10 7 40 90 65
15891590
MALAPURAM , KERALA
MAVOOR, KOZHIKKODE DISTT. ,
2628
2728
2728
5.85.5
6.06.2
5.95.9
320112
420156
370134
6.06.0
6.06.0
6.06.0
0.70.4
1.01.0
0.90.7
3.202.30
4.402.70
3.802.50
0.050.10
0.100.10
0.080.10
0.10 0.10 0.10 800
120170
10085
300140
400400
350270
1591KERALAKANNUR (MUNICIPALITY) 26 30 28 4.6 5.1 4.9 90 123 107 8.0 8.0 8.0 1.0 1.6 1.3 2.70 4.30 3.50 0.10 0.10 0.10 0 80 40 160 200 180
1592 PAYYANNUR, KANNUR DISTT. , KERALA
26 30 28 6.0 6.1 6.1 168 204 186 10.0 10.0 10.0 0.3 0.4 0.4 2.30 3.40 2.85 0.10 0.10 0.10 0 20 10 80 200 140
ATI
ON
CO
DE
LOCATIONS
TEMPERAT pH
TABLE 20.6:- WA
CONDUCTIVITY
TER QUALITY OF
C.O.D. (mg/l)
GROUND WATER
B.O.D. (mg/l)
IN TAMILNADU &
NITRATE (mg/l)
PONDICHERRY
NITRITE (mg/l)
- 2007
AMMONIA - N FECAL COLIFORM TOTAL COLIFORM
X N
URE ºC
X N
(µ
X
mhos/cm
N
)
X N X N X N X N X
(mg/l)
N
(M
X
PN/100m
N
l)X N
(MPN/100ml)
1449
ST
COLLECTOR WELL AT
MIN
27
MA
28
MEA
28
MIN
7.1
MA
7.6
MEA
7.4
MIN
792
MA
1068
MEA
930
MIN
16.0
MA
16.0
MEA
16.0
MIN
2.3
MA
3.2
MEA
2.8
MIN
0.09
MA
0.10
MEA
0.09
MIN
0.10
MA
0.10
MEA
0.10
MIN
5.00
MA
5.00
MEA
5.00
MIN
2
MA
7
MEA
5
MIN
6
MA
21
MEA
14THIRUPUVANAM FOR MADURAI WAT. SUPPLY SCHEME,
1397TAMILNADUWELL AT MUTHIALPET AREA(I), 29 29 29 7.9 7.9 7.9 1565 1565 1565 0.10 0.10 0.10
1398PONDICHERRYWELL AT THENGAITHITTU AREA,(II) PONDICHERRY
29 31 30 6.2 7.7 7.0 1301 1544 1423 23.0 23.0 23.0 0.0 1.0 0.5 0.10 0.10 0.10
1453 WELL AT MUTHARAPLATYAM (PWD), PONDICHERRY
28 31 29 6.3 8.1 7.2 666 781 724 14.0 14.0 14.0 0.0 2.0 1.0 0.10 0.20 0.15 0.10 0.10 0.10
1454 WELL AT KALAPET,PONDI. UNIVER. ADMN.
20 32 26 5.9 6.6 6.3 82 256 169 12.0 39.0 25.5 0.0 1.3 0.7 0.10 0.30 0.20 0.10 0.10 0.10 2 2 2
1687BLOCK,PONDICHERRYNEHRU STATUE, PONDICHERRY 28 31 30 6.7 7.8 7.2 1490 5240 3365 32.0 32.0 32.0 0.0 8.0 4.0 0.08 0.10 0.09
1688 KATTERIKUPPAM, PODICHERRY 27 31 29 7.3 8.9 8.1 767 925 846 41.0 41.0 41.0 0.08 0.10 0.09
1689 CHUNMBAR RIVER, 30 35 32 7.5 8.8 8.1 1153 37650 18672 48.0 48.0 48.0 0.0 9.0 5.7 0.10 0.10 0.10 0.20 1.00 0.70
2009PONDICHERRYKURUMBAPET, PONDICHERRY 28 31 30 6.3 7.6 6.9 467 560 514 12.0 12.0 12.0 0.09 0.10 0.10
2010 METTUPALAYAM, PONDICHERRY 28 31 30 6.1 7.8 7.0 614 782 698 6.0 6.0 6.0 0.10 2.80 1.45
20112012
URUVAIYAR, PONDICHERRY
KARUVADIKUPPAM,
2930
3331
3130
6.97.0
8.47.2
7.77.1
1472330
1632708
1552519
22.038.0
22.038.0
22.038.0
0.100.10
2.002.00
1.051.05
1.001.00
1.001.00
1.001.00
2013PONDICHERRYT.R.PATTINAM, KARAIKAL, 26 30 28 7.6 9.0 8.3 2070 2526 2298 41.0 41.0 41.0 0.0 3.0 1.5 2.90 2.90 2.90 1.10 1.10 1.10
2014 VADAMATTAM, KARAIKAL, PONDICHERRY
25 30 28 7.1 8.4 7.8 1344 4120 2732 32.0 32.0 32.0 2.70 2.70 2.70 1.30 1.30 1.30
ATI
ON
CO
DE
LOCATIONS
TEMPERAT
TA
pH
BLE 20.7:- WATER
CONDUCTIVITY
QUALITY OF GRO
C.O.D. (mg/l)
UND WATER IN D
B.O.D. (mg/l)
AMAN, MAHARA
NITRATE (mg/l)
SHTRA & GUJA
AMMONIA - N
RAT - 2007
FECAL COLIFORM TOTAL COLIFORM
X N
URE ºC
X N
(µ
X
mhos/cm
N
)
X N X N X N X
(mg/l)
N
(M
X
PN/100
N
ml) (M
X
PN/100m
N
l)
ST MIN
MA
MEA MIN
MA
MEA MIN
MA
MEA MIN
MA
MEA MIN
MA
MEA MIN
MA
MEA MIN
MA
MEA MIN
MA
MEA MIN
MA
MEA
1440 WELL AT SOMNATH INDUSTRIAL 7.0 7.5 7.2 990 1740 1398 11.1 35.0 19.4 3.30 8.90 6.70ESTATE, DAMAN
1984 INDL. ESTATE TARAPUR 26 29 28 7.5 7.6 7.6 1312 1980 1646 28.0 28.0 28.0 6.5 8.0 7.3 5.00 8.00 6.50 0.10 0.10 0.10 0 110 55 13 1800 9071985 MIRA-BHAYANDER 23 29 26 7.3 7.8 7.6 3725 6424 5075 28.0 28.0 28.0 7.0 7.0 7.0 2.10 2.20 2.15 0.00 0.10 0.10 45 550 298 550 1800 11751986 DAHANU 28 29 29 7.2 7.4 7.3 1511 2017 1764 24.0 24.0 24.0 4.4 5.0 4.7 0.80 2.40 1.60 0.00 0.30 0.20 21 25 23 80 130 1051987 VASAI 24 28 26 7.1 7.8 7.5 1089 1127 1108 28.0 28.0 28.0 5.0 7.0 6.0 0.80 1.00 0.90 0.50 0.70 0.60 25 350 188 900 1600 12501988 PALGHAR 27 28 28 7.2 7.7 7.4 687 2424 1526 28.0 28.0 28.0 4.4 6.0 5.2 0.10 4.50 2.30 0.00 0.40 0.20 7 14 11 80 85 831989 MSW SITE, TALOJA, RAIGAD 23 23 23 7.6 7.8 7.7 185 185 185 24.0 24.0 24.0 3.0 7.0 5.0 0.40 0.40 0.40 1.30 1.30 1.30 0 0 0 13 13 131990 BMW SITE, BURUDGAON,
AHMEDNAGAR27 28 28 8.4 8.5 8.5 105 300 182 28.0 28.0 28.0 5.5 12.0 7.7 0.04 0.40 0.18 2.80 3.30 3.00 5 7 6 14 30 25
19911992
MSW SITE, PATHARDI, NASIK
MSW SITE, PIMPRI-CHINCHWAD,
2529
2929
2729
7.67.1
7.77.1
7.77.1
178972
1555972
867972
56.0 56.0 56.0 23.06.8
28.06.8
25.56.8
0.400.10
3.300.10
1.850.10
3.900.20
3.900.20
3.900.20
917
1417
1217
40425
70425
55425
1993PUNEPHANDARPUR, GANGAPUR, 28 32 30 7.6 7.8 7.7 1714 1976 1845 4.4 5.0 4.7 0.60 11.80 6.20 0.00 0.10 0.10 6 9 8 220 280 250

1965HAJIRA
28 28 28 8.0 8.0 8.0 1900 1900 1900 8.0 8.0 8.0 3.4 3.4 3.4 11.1 11.1 11.1 0.60 0.60 0.60 430 430 430 750 750 750
,
2031 NEAR 9 NO. PETROL PUMP, NEARADARSH NAGAR GATE, AJMER
26 26 26 7.7 8.0 7.8 1080 1560 1320 42.5 42.5 42.5 1.2 1.7 1.4 0.58 15.20 7.89 0.10 0.10 0.10 0.10 0.60 0.30 4 4 4 9 20 15
1995 KHAPERKHEDA, NAGPUR 29 29 29 7.2 8.2 7.7 815 869 842 28.0 28.0 28.0 5.9 6.0 6.0 3.30 6.10 4.70 0.80 4.90 2.90 11 11 11 27 27 271996 KORADI, NAGPUR 27 29 28 7.2 7.8 7.5 1438 1507 1473 40.0 40.0 40.0 6.5 9.0 7.8 11.5 11.9 11.7 0.70 4.50 2.60 4 4 4 21 21 211997 RAIPUR, NAGPUR 27 28 28 7.0 8.2 7.6 1110 1857 1484 22.0 22.0 22.0 5.5 5.6 5.6 10.0 12.6 11.3 0.40 3.80 2.10 4 4 4 33 33 331998 BHAHMNI, KALMESHWAR,
NAGPUR17 29 23 7.4 7.5 7.5 1675 2594 2135 36.0 36.0 36.0 8.0 10.0 9.0 2.40 3.30 2.85 0.80 4.60 2.70 9 11 10 12 25 19
1999 SANGERA GONDIA 27 32 30 7.4 7.9 7.7 410 1248 829 24.0 24.0 24.0 4.5 6.5 5.5 0.10 9.30 4.70 0.40 4.70 2.60 17 17 17 30 30 302000 BHANDEWARI, NAGPUR 29 29 29 7.8 8.0 7.9 1301 1346 1324 32.0 32.0 32.0 5.0 6.5 5.8 0.80 2.90 1.85 0.70 5.90 3.30 25 350 188 170 900 5352001 SUKALI, AMRAVATI 27 27 27 7.5 8.3 7.9 458 1329 894 5.5 5.5 5.5 5.5 6.2 5.9 1.00 12.80 6.90 0.00 3.30 1.70 2 2 2 4 4 42002 AKOT, AKOLA 27 32 30 8.2 8.5 8.4 543 688 616 16.0 16.0 16.0 4.0 6.1 5.1 2.90 4.00 3.45 0.40 5.40 2.90 8 110 59 17 280 1492003 SAWARGAON, YAVATMAL
PARVATI INDL. ESTATE, YADRAV,
2028
2728
2428
7.46.3
8.26.3
7.86.3
3573562
13553562
8563562
14.0 14.0 14.0 4.02.2
5.82.2
4.92.2
1.300.20
1.400.20
1.350.20
1.200.10
3.600.10
2.400.10
42
42
42
114
124
1242004
SHIROL2005 KHANJIRENAGAR, ICHALKARANJI 28 28 28 6.1 6.1 6.1 3812 3812 3812 2.0 2.0 2.0 0.10 0.10 0.10 0.70 0.70 0.70 2 2 2 6 6 6
2006 MIDC, SHINOLI, CHENDGAD 27 27 27 6.3 6.3 6.3 1531 1531 1531 2.2 2.2 2.2 0.10 0.10 0.10 0.70 0.70 0.70 2 2 2 4 4 420072008
SAVALI, SANGLI
RASULWADI-SAMBARWADI,
2222
3230
2726
6.36.3
6.97.2
6.66.8
32403295
36734278
34573787
16.024.0
16.024.0
16.024.0
1.41.8
2.23.4
1.82.6
1.702.10
5.205.20
3.453.65
0.100.20
0.200.20
0.200.20
117
217
217
2130
9280
6205
3SANGLIWELL AT AHMEDABAD, GUJARAT 27 28 28 7.0 7.4 7.2 1600 1920 1760 8.0 8.0 8.0 1.0 3.0 2.0 3.20 3.50 3.35 0.10 0.10 0.10 2 2 2 5 5 5
1226 WELL AT NAROL, AHMEDABAD, GUJARAT
28 30 29 7.0 7.4 7.2 2190 2450 2320 16.0 16.0 16.0 1.0 2.0 1.5 0.40 4.60 2.50 0.10 0.10 0.10 2 2 2 5 5 5
1950 JUNAGADH 25 28 27 6.9 7.0 7.0 1590 1690 1640 15.0 28.0 21.5 1.3 1.3 1.3 0.10 0.10 0.10 0.20 0.50 0.401951 RAJKOT 27 30 29 6.9 7.0 7.0 1540 1630 1585 4.0 26.0 15.0 1.0 1.5 1.3 0.10 0.10 0.10 0.20 0.20 0.201952 SURENDRANAGAR 33 33 33 7.1 7.1 7.1 2420 2420 2420 1.0 1.0 1.0 0.20 0.20 0.201953 JAMNAGAR 28 29 29 7.3 7.9 7.6 1430 1612 1521 6.0 6.0 6.0 2.23 4.54 3.39 0.28 0.56 0.42 3 3 3 7 7 71954 BHUJ 27 27 27 7.4 8.3 7.9 2210 2270 2240 6.0 6.0 6.0 0.10 0.29 0.20 0.56 0.56 0.56 3 4 4 7 15 111955 PALANPUR 28 29 29 7.5 7.6 7.6 1060 1700 1380 18.0 18.0 18.0 2.0 3.0 2.5 8.40 16.00 12.20 0.20 0.40 0.30 2 2 2 5 5 51956 MEHASANA 26 27 27 7.5 7.7 7.6 2250 2480 2365 16.0 16.0 16.0 1.0 2.0 1.5 1.20 4.00 2.60 0.10 0.20 0.10 2 2 2 5 5 51957 SIDDHPUR (DIST.PATAN) 27 27 27 7.8 7.8 7.8 1940 1940 1940 16.0 16.0 16.0 2.0 2.0 2.0 15.0 15.0 15.0 0.20 0.20 0.20 2 2 2 5 5 51958 HIMATNAGAR 26 27 27 7.3 8.0 7.6 728 1280 1004 12.0 12.0 12.0 0.9 2.0 1.5 4.00 6.30 5.15 0.10 0.20 0.10 2 2 2 5 5 51959 BOREWELL AT NADIAD 22 30 26 7.5 7.8 7.6 2360 2420 2390 7.0 7.0 7.0 1.8 3.8 2.8 0.08 1.56 0.82 0.18 0.18 0.18 2 3 3 4 9 71962 BOREWELL NO-3,GIDC-
NANDESARI21 30 26 7.5 7.7 7.6 1927 2360 2144 3.0 3.0 3.0 1.3 3.8 2.5 0.08 0.80 0.44 0.15 0.15 0.15 2 3 3 4 7 6
1961 BOREWELL AT GODHRA 26 27 27 7.0 7.7 7.4 1214 1619 1417 1.4 2.4 1.9 0.13 1.95 1.04 3 4 4 3 20 121960 WELL WATER AT DAHOD
PANDESARA (INDSTRIAL) SURAT
27 27 27 7.4 8.0 7.7 753 1803 1278 1.0 2.0 1.5 0.31 3.99 2.15 2 3 3 4 14 91964
MORA-HAJIRA (INDUSTRIAL),
29 29 29 8.5 8.5 8.5 2000 2000 2000 11.0 11.0 11.0 2.7 2.7 2.7 3.22 3.22 3.22 0.60 0.60 0.60 150 150 150 430 430 430
1966 GABHENI VILLAGE, SURAT (INDUSTRIAL)
32 32 32 8.4 8.4 8.4 760 760 760 6.0 6.0 6.0 1.2 1.2 1.2 0.12 0.12 0.12 0.80 0.80 0.80 430 430 430 750 750 750
ION
CO
DE
LOCATIONS
TEMPERAT pH
TABLE
CONDUCTIVITY
20.8:- WATER QUA
C.O.D. (mg/l)
LITY OF GROUND
B.O.D. (mg/l)
WATER IN RAJA
NITRATE (mg/l)
STHAN - 2007
NITRITE (mg/l) AMMONIA - N FECAL COLIFORM TOTAL COLIFORM
X N
URE ºC
X N
(µ
X
mhos/cm
N
)
X N X N X N X N X
(mg/l)
N
(M
X
PN/100m
N
l)
X N
(MPN/100ml)
1415
STA
T
WELL OF LOOMJI, CHAUDHARY, NEAR NAYAGAON, PALI, (U/S 1
MIN
21
MA
23
MEA
22
MIN
8.0
MA
8.1
MEA
8.1
MIN
5900
MA
6500
MEA
6200
MIN
36.7
MA
36.7
MEA
36.7
MIN
0.3
MA
2.5
MEA
1.4
MIN
0.14
MA
0.58
MEA
0.36M
IN
MA
MEA MIN
0.20
MA
0.40
MEA
0.30
MIN
4
MA
7
MEA
6
MIN
20
MA
1100
MEA
560
KM. FROM PALI TOWN), RAJASTHAN
1416 WELL OF BHOPAL SINGH, 24 Km. FROM PALI TOWN, RAJASTHAN
20 22 21 8.2 8.6 8.4 4600 16900 10750 118 118 118 0.6 6.5 3.6 0.14 0.58 0.36 0.20 3.10 1.60 3 7 5 14 150 82
1417 WELL (U/S 1 KM FROM JODHPUR TOWN), RAJASTHAN
17 25 21 7.5 7.9 7.7 15000 15700 15350 36.7 36.7 36.7 2.1 4.6 3.3 0.14 0.58 0.36 0.40 7.20 3.80 7 11 9 150 210 180
1706 RIICO PUMP HOUSE NEAR MONTO MOTORS, MIA, ALWAR, RAJASTHAN
29 29 29 7.3 7.4 7.4 1160 1160 1160 10.4 10.4 10.4 0.6 1.2 0.9 0.16 0.38 0.27 0.20 0.80 0.50 4 4 4 9 9 9
1707 BORE WELL IN MODI ALKALIS & CHEMICALS, MIA, ALWAR, RAJASTHAN
29 29 29 7.3 7.4 7.4 890 960 925 11.2 11.2 11.2 0.8 1.1 0.9 0.22 0.58 0.40 0.40 0.40 0.40 3 3 3 4 4 4
1708 WELL KOTHI IN VILLAGE BAGAR RAJPUT, ALWAR, RAJASTHAN
WELL AT VILLAGE SANTHLA
24 26 25 7.4 7.4 7.4 4100 5300 4700 88.8 88.8 88.8 0.6 0.9 0.8 0.32 0.48 0.40 0.00 0.10 0.10 3 3 3 4 4 4
1709VERY NEAR BHIWADI INDUSTRIAL AREA, BHIWADI, RAJASTHANWELL AT VILLAGE ALUPUR, VERY
27 29 28 7.6 8.2 7.9 2000 2400 2200 13.3 13.3 13.3 0.7 1.8 1.2 0.30 0.38 0.34 0.30 0.40 0.40 4 4 4 9 20 15
1710
1711
NEAR BHIWADI INDUSTRIAL AREA, BHIWADI, RAJASTHAN
WELL AT VILLAGE HARCHANDPUR, VERY NEAR,
26
28
29
29
28
29
7.8
7.8
8.0
7.9
7.9
7.8
700
1350
910
2900
805
2125
20.0
5.0
20.0
5.0
20.0
5.0
1.1
0.8
1.8
1.2
1.4
1
0.38
0.14
0.58
0.48
0.48
0.31
0.10
0.10
0.20
10.00
0.10
5.10
4
3
4
4
4
4
11
4
21
20
16
12
BHIWADI TO BHIWADI INDUSTRIAL AREA, BHIWADI, RAJASTHANWELL AT VILLAGE BHIWADI , 1712VERY NEARTO BHIWADI INDUSTRIAL AREA, BHIWADI, RAJASTHANWELL AT VILLAGE GATTAL, NEAR
27 29 28 7.9 8.4 8.2 1110 1140 1125 3.3 3.3 3.3 0.2 1.1 0.6 0.14 0.48 0.31 0.10 0.10 0.10 4 4 4 4 14 9
1713
1715
BHIWADI TO BHIWADI INDUSTRIAL AREA, BHIWADI, RAJASTHANHAND PUMP NEAR SECONDARY SCHOOL ABOUT 300mt. FROM
27
28
29
30
28
29
8.0
7.5
8.4
8.2
8.2
7.9
750
2100
1150
3100
950
2600
5.8
2.5
5.8
2.5
5.8
2.5
0.4
0.4
1.2
0.4
0.8
0.4
0.14
0.74
0.48
0.74
0.31
0.74
0.00
0.20
0.00
7.20
0.00
3.70
3
3
4
4
4
4
4
7
14
14
9
11
1720
KANSUA NALLAH KOTA, RAJASTHAN
CHAUDHARY KA WELL VILLAGE PANIALA, KOTAPUTALI NEAR ASSOCIATED ALCOHOL
19 19 19 7.8 7.8 7.8 1000 1000 1000 8.3 8.3 8.3 1.7 1.7 1.7 0.16 0.16 0.16 0.00 0.00 0.00 4 4 4 14 14 14
BREVERIES LTD JAIPUR, RAJASTH
1721 PHED WELL NEAR RAILWAY LINE JHOTAWARA, JAIPUR,
26 29 28 7.5 8.2 7.8 600 680 640 2.5 2.5 2.5 0.6 1.7 1.2 0.14 0.58 0.36 0.00 0.00 0.00 3 3 3 4 7 6
1722RAJASTHANPHED WELL NEAR NEI, KHATIPURA, RAJASTHAN
25 26 26 7.3 8.3 7.8 700 750 725 35.0 35.0 35.0 0.6 0.7 0.6 0.38 0.42 0.40 0.00 0.10 0.10 3 4 4 4 9 7
1723 HAND PUMP OF VIDHANI VILLAGE GONER ROAD JAIPUR, RAJASTHANWELL OF GOOJARON KI TALAI,
27 28 28 7.4 8.1 7.8 2800 2900 2850 3.3 3.3 3.3 0.7 1.1 0.9 0.22 0.48 0.35 0.00 0.20 0.10 3 4 4 7 9 8
1724MOHANA ROAD SANGANER JAIPUR, RAJASTHAN
27 28 28 8.0 8.5 8.2 1150 1500 1325 10.0 10.0 10.0 0.6 2.1 1.3 0.32 0.38 0.35 0.00 0.60 0.30 3 4 4 4 75 40
1725 PUBLIC HAND PUMP BEFORE SANGANER PULIA, RAJASTHAN
25 26 26 7.5 7.6 7.5 1300 1680 1490 30.9 30.9 30.9 0.3 1 0.7 0.16 0.58 0.37 0.10 0.40 0.30 3 3 3 7 9 8
2015 PABUPURA ROAD NEAR CIVIL AIR PORT, JODHPUR (MANGILAL RATHOR)
17 24 21 7.5 7.9 7.7 3600 4500 4050 88.4 88.4 88.4 1.7 4 2.8 0.74 1.66 1.20 0.40 3.90 2.20 20 28 24 460 1100 780
2016 VILLAGE VINAYAKIA, JODHPUR (HIRALAL KUMHAR)
17 24 21 7.2 7.5 7.4 2800 3000 2900 82.6 82.6 82.6 1.4 2.7 2 0.30 0.58 0.44 1.40 2.40 1.90 7 7 7 28 28 28
2017 VILLAGE VINAYAKIA, JODHPUR (BADRI KUMHAR)
17 24 21 7.2 7.4 7.3 3200 3500 3350 118 118 118 0.5 2 1.3 0.14 0.48 0.31 0.60 0.70 0.70 7 14 11 93 93 93
2018 VILLAGE VINAYAKIA, JODHPUR 17 24 21 7.4 7.6 7.5 7400 10200 8800 47.5 47.5 47.5 1 2.5 1.7 10.0 11.8 10.9 0.80 1.50 1.20 7 11 9 150 150 150
2019
(HUKUM SINGH RATHORE)
NEAR UIT BRIDGE, UDAIPUR 26 29 28 7.1 8.6 7.8 1000 1500 1250 37.5 37.5 37.5 0.5 0.7 0.6 0.74 1.02 0.88 0.10 0.50 0.30 4 4 4 14 14 142020 NEW FATEHPURA, 200 FT.FROM
PANCHWATI NALLAH, UDAIPUR
NEAR ARVIND GENERAL STORE,
25 29 27 6.9 8.5 7.7 1300 1800 1550 40.0 40.0 40.0 0.5 1.2 0.9 0.74 1.02 0.88 0.00 2.10 1.10 3 7 5 4 14 9
2021ALOO FACTORY, KACCHI BASTI, SARDARPURA, UDAIPUR
26 27 27 7.0 8.8 7.9 1180 1800 1490 35.9 35.9 35.9 0.7 0.9 0.8 0.48 0.48 0.48 0.00 0.50 0.30 3 4 4 7 7 7
2022 NEAR RANA PRATAP NAGAR, RAILWAY STATION, UDAIPUR
27 28 28 7.0 8.4 7.7 2000 2100 2050 40.9 40.9 40.9 0.4 0.6 0.5 0.30 0.48 0.39 0.20 0.60 0.40 3 3 3 4 7 6
2023 HOTEL ORIENT PLACE, SUBHAS NAGAR, UDAIPUR
25 28 27 7.0 7.7 7.4 2700 2800 2750 11.7 11.7 11.7 0.1 1 0.5 0.22 0.58 0.40 0.70 0.90 0.80 4 4 4 14 20 17
2024 IN SIDE SHIV TEMPLE NEAR AIR FORCE STATION AMER ROAD, JAIPURNEAR SHREE KALYANESHWAR
25 26 26 7.1 7.2 7.1 2300 2400 2350 36.7 36.7 36.7 0.3 0.9 0.6 0.38 0.38 0.38 0.00 1.00 0.50 3 7 5 4 20 12
2025MAHADEV TEMPLE, JAI SINGH PURA KHURD, JAIPUR.
25 25 25 7.4 7.5 7.5 200 2500 1350 39.2 39.2 39.2 0.2 0.9 0.6 0.16 0.58 0.37 0.00 0.40 0.20 3 3 3 7 14 11
2026 NEAR FOJI NAGAR, KACCHI BASTI, AMBABARI, JAIPUR.
26 28 27 7.4 8.0 7.7 770 800 785 18.4 18.4 18.4 0.2 0.4 0.3 0.32 0.32 0.32 0.00 0.10 0.10 3 3 3 4 4 4
2027 NEAR ABN CENTRAL ACADEMY, SUSILPURA, SODALA, JAIPUR.
25 27 26 7.8 8.6 8.2 500 540 520 22.5 22.5 22.5 0.6 0.7 0.7 0.16 0.32 0.24 3 3 3 4 4 4
2028 NEAR SAMSHAN VISHWAKARMA NAGAR, MAHARANIFARM, JAIPUR
21 28 25 7.5 8.3 7.9 700 780 740 38.4 38.4 38.4 0.3 0.5 0.4 0.16 0.38 0.27 0.10 0.10 0.10 3 3 3 4 4 4
NEAR GANDHI BHWAN, AJMER2029
2030 OPPOSITE PRIVATE BUS STAND, AJMER
22
21
25
25
24
23
7.7
7.5
7.9
7.7
7.8
7.6
810
2000
1210
2700
1010
2350
30.0
136
30.0
136
30.0
136
0.4
0.8
1
2.3
0.7
1.5
0.48
0.62
15.60
1.66
8.04
1.14
0.10
0.10
0.10
0.10
0.10
0.10
0.00
0.20
0.10
0.30
0.10
0.20
3
3
4
3
4
3
14
4
20
11
17
8

2032 NEAR KHANPURA TALAB, AJMER 21 27 24 7.1 7.6 7.3 5200 9100 7150 151 151 151 1.5 1.5 1.5 1.02 2.76 1.89 0.10 0.10 0.10 0.20 0.50 0.30 4 4 4 14 20 17
1748 HANDPUMP IN VILLAGE DAMAUDA AT KASHIPUR NEAR
21 22 22 7.4 7.8 7.6 410 410 410 3 4 3.5 1.2 1.4 1.3 10 22 16
4
1944 KHARAGPUR INDUSTRIAL AREA 30 31 31 6.5 7.4 7.0 135 157 146 8.7 8.7 8.7 0.2 0.9 0.6 0.10 0.10 0.10 0.10 0.50 0.30
0.40 0.40 0.40 14 14 14 17 17 17
1648 CUTTACK, ORISSA 28 28 28 8.0 8.0 8.0 301 301 301 10.0 10.0 10.0 2.0 2.0 2.0 1.53 1.53 1.53 0.80 0.80 0.80
1649KHANDAGIRI AREA, BHUBANESWAR, ORISSA 27 27 27 7.1 7.1 7.1 228 228 228 3.0 3.0 3.0 0.2 0.2 0.2 7.92 7.92 7.92 0.80 0.80 0.80
2033 OUTSIDE JLN HOSPITAL, AJMER 21 25 23 7.3 7.7 7.5 2000 2900 2450 40.9 40.9 40.9 0.4 1.1 0.7 0.74 1.40 1.07 0.20 0.40 0.30 3 4 4 4 14 9
ION
CO
DE
LOCATIONS
TEMPERAT
T
pH
ABLE 20.9 :- WATE
CONDUCTIVITY
R QUALITY OF GR
C.O.D. (mg/l)
OUND WATER IN
B.O.D. (mg/l)
UTTAR PRADES
NITRATE (mg/l)
H & UTTARANC
NITRITE (mg/l)
HAL- 2007
AMMONIA - N FECAL COLIFORM TOTAL COLIFORM URE º
N
C
N
(µmhos/cm
N
)
N N N N
(mg/l)
N
(MPN/100m
N
l) (MPN/100m
N
l)
STA
T
MIN
MA
X
MEA MIN
MA
X
MEA MIN
MA
X
MEA MIN
MA
X
MEA MIN
MA
X
MEA MIN
MA
X
MEA MIN
MA
X
MEA MIN
MA
X
MEA MIN
MA
X
MEA MIN
MA
X
MEA
1736 GROUND WATER QUALITY 27 27 27 6.6 6.6 6.6 1280 1280 1280 62.0 62.0 62.0 6.2 6.2 6.2 3.60 3.60 3.60 2.10 2.10 2.10 100 100 100 220 220 220
1737
STATION SARDARNAGAR, U.P
GROUND WATER QUALITY 26 26 26 6.9 6.9 6.9 794 794 794 38.0 38.0 38.0 4.0 4.0 4.0 3.00 3.00 3.00 1.30 1.30 1.30 60 60 60 100 100 100
1738STATION CAPTANGANJ, U.PSITE 1, INDUSTRIAL AREA NEAR M/S WOODWARM CHEMICAL
20 20 20 7.6 7.9 7.8 728 894 811 1.80 1.80 1.80 0.10 0.10 0.10
1739LTD., UNNAO, U.PSITE 2, INDUSTRIAL AREA NEAR 20 20 20 7.5 7.9 7.7 1080 1092 1086 9.80 9.90 9.85 0.40 0.50 0.45
1740
M/S AMIN SONS, UNNAO,U.P
AT ROADWAYS BUS STATION, 7.1 7.1 7.1 2439 2439 2439 24.2 24.2 24.2 0.50 0.50 0.50
1741UNNAO, U.PMAGAWARA INDUSTRIAL AREA NEAR M/S JAMJAM TANNERS, UNNAO, U.P
20 20 20 7.6 7.8 7.7 762 795 779 8.90 9.10 9.00 0.40 0.40 0.40
1742 CHINHAT INDUSTRIAL AREA IN LUCKNOW NEAR M/S INDIA PESTICIDES LUCKNOW, U.P
7.0 7.9 7.5 656 860 758 8.20 8.40 8.30 0.20 0.20 0.20
1743 AISHBAGH INDUSTRIAL AREA AT LUCKNOW NEAR M/S EVEREADY
7.3 7.3 7.3 884 1390 1137 12.1 13.2 12.7 0.20 0.20 0.20
1744
INDUSTRIES LTD. LUCKNOW, U.P
JAJMAU INDUSTRIAL AREA No. 6 KANPUR, U.P
7.9 7.9 7.9 650 650 650
1745 PANKI INDUSTRIAL AREA NEAR INDUSTRY OF AMMONIA
8.1 8.1 8.1 757 757 757
1746
FERTIZER KANPUR, U.P
NAGAR PALIKA TUBE WELL, 27 32 30 7.5 7.5 7.5 655 1145 900 0.30 0.30 0.30 0.10 0.10 0.10
1747SULTANPUR, U.PINDIA MARKA HAND PUMP IN 26 30 28 7.5 8.5 8.0 737 1260 999 0.20 0.20 0.20SAROWNI BLOCK AT RAIBAREILLY, U.P
1749 TUBE WELL AT MEERUT CITY, U.P
20 24 22 7.7 7.8 7.8 740 748 744 24.0 28.0 26.0 8 12 10
1750 TUBE WELL AT BAGPAT CITY, U.P 20 25 23 7.7 7.8 7.8 860 872 866 32.0 36.0 34.0 0.4 0.6 0.5 9 17 13
1752 SAHIBABAD INDUSTRIAL AREA, GHAZIABAD, U.P
7.5 7.5 7.5 2260 2260 2260
1753 MEERUT ROAD INDUSTRIAL AREA GHAZIABAD, U.P
7.5 7.5 7.5 960 960 960
1754 HAPUR ROAD INDUSTRIAL AREA GHAZIABAD, U.P
7.5 7.5 7.5 680 680 680
1755 PILKHUA INDUSTRIAL AREA GHAZIABAD, U.P
7.5 7.5 7.5 1280 1280 1280
1757 MIRZAPUR INDUSTRIAL AREA, U.P
25 26 26 6.5 7.2 6.9 754 780 767
1759 IFFCO, PHOOLPUR,ALLAHABAD, U.P
25 26 26 6.9 7.1 7.0 833 1313 1073
1760
1761
M/S KANORIA CHEMICAL SONBHADRA, U.PTUBE WELL IN SINGRAULI INDUSTRIAL AREA, U.P
26
24
26
26
26
25
6.2
6.5
7.1
7.2
6.7
6.9
693
499
791
762
742
631
M/S INDIA GLYCOLES LTD., U.P
ION
CO
DE
LOCATIONS
TEMPERAT pH
TABLE 20
CONDUCTIVITY
.10 :- WATER QUAL
C.O.D. (mg/l)
ITY OF GROUND
B.O.D. (mg/l)
WATER IN WEST
NITRATE (mg/l)
BENGAL- 2007
AMMONIA - N FECAL COLIFORM TOTAL COLIFORM URE º
N
C
N
(µmhos/cm
N
)
N N N
(mg/l)
N
(MPN/100N
ml) (MPN/100m
N
l)
TAT
MIN
MA
X
MEA MIN
MA
X
MEA MIN
MA
X
MEA MIN
MA
X
MEA MIN
MA
X
MEA MIN
MA
X
MEA MIN
MA
X
MEA MIN
MA
X
MEA MIN
MA
X
MEA
S
1813
1766
RISHRA, NEAR ICI COMPLEX,WEST BENGALMINE PIT WATER ASSANSOL,
30
30
30
30
30
30
7.2
8.1
7.2
8.1
7.2
8.1
873
783
873
783
873
783
1.1
2.3
1.1
2.3
1.1
2.3
0.10
0.30
0.10
0.30
0.10
0.30
0.15
0.20
0.15
0.20
0.15
0.20 130 130 130 300 300 300
1767WEST BENGALDURGAPUR TOWN,NEAR IISCO, 27 29 28 7.2 7.2 7.2 904 1025 965 8.8 8.8 8.8 0.3 0.3 0.3 0.20 0.65 0.42 0.20 0.50 0.35
1768
BURDWAN, WEST BENGAL
DURGAPUR TOWN, BURDWAN, 28 29 29 6.6 6.8 6.7 818 855 837 8.6 8.6 8.6 0.3 0.3 0.3 6.99 9.60 8.30 0.30 0.49 0.40 0 700 350 0 900 450
1769WEST BENGALINSIDE HINDUSTAN LIVER 31 35 33 7.5 7.8 7.7 2070 2130 2100 7.3 7.3 7.3 1.2 4.0 2.6 0.10 1.00 0.55 0.50 0.60 0.55 0 2 1FACTORY, HALDIA, WEST BENGAL
1770 NEAR IOC REFINERY HALDIA, WEST BENGAL
27 36 31 7.6 7.8 7.7 1662 1938 1800 17.8 17.8 17.8 0.8 1.4 1.1 0.30 1.00 0.65 0.30 0.40 0.35 0 4 2
1771 KALYANI INDUSTRIAL AREA, NADIA, WEST BENGAL
29 29 29 7.3 8.0 7.6 496 695 596 4.9 4.9 4.9 0.2 1.6 0.9 0.10 0.11 0.11 0.20 0.62 0.41
1772 BARSAT MUNICIPALITY NORTH 2P, WEST BENGAL
27 27 27 7.8 8.3 8.1 890 2060 1475 6.1 6.1 6.1 0.2 0.8 0.5 0.10 0.31 0.21 0.20 0.25 0.23
1773 TANGRA, CALCUTTA ,WEST BENGAL
31 37 34 7.3 7.3 7.3 2000 2010 2005 5.5 5.5 5.5 0.4 0.7 0.6 0.10 0.10 0.10 0.40 0.50 0.45 0 2 1 0 4 2
1774 TOPSIA CALCUTTA, WEST BENGAL
29 30 30 7.3 7.5 7.4 1847 1870 1859 5.5 5.5 5.5 1.6 1.7 1.7 0.10 0.10 0.10 0.20 0.40 0.30 22 400 211 80 900 490
1775 DHAPA CALCUTTA, WEST BENGAL
27 28 28 7.6 7.7 7.7 1691 1721 1706 3.7 3.7 3.7 0.8 0.9 0.9 0.03 0.10 0.07 0.20 0.55 0.38
1776 GARIA CALCUTTA, WEST BENGAL 29 29 29 7.4 8.2 7.8 1035 1060 1048 2.0 2.0 2.0 0.2 1.3 0.8 0.10 0.10 0.10 0.30 0.40 0.35 2 13 8 4 23 14
1777 BEHALA CALCUTTA, WEST BENGAL
29 29 29 7.5 7.6 7.6 847 958 903 1.6 1.6 1.6 0.6 1.1 0.9 0.10 1.00 0.55 0.20 0.60 0.40 0 80 40 0 170 85
1778 DOMJUR HOWRAH, WEST BENGAL
28 29 28 7.6 7.7 7.7 1113 1131 1122 2.0 2.0 2.0 0.6 0.6 0.6 0.10 1.00 0.55 0.60 0.70 0.65 2 7 5 4 11 8
1779 DANKUNI (NEAR COAL COMPLEX), WEST BENGAL
29 29 29 7.2 7.4 7.3 952 998 975 1.0 1.0 1.0 0.5 1.2 0.9 0.10 0.10 0.10 0.10 0.10 0.10
1931 COSSIPORE - NORTH KOLKATA 26 27 27 7.6 7.8 7.7 2420 2420 2420 7.0 7.0 7.0 0.2 0.8 0.5 0.10 0.10 0.10 0.60 0.90 0.75
1932 CENTRAL KOLKATA 25 29 27 8.0 8.2 8.1 2540 2590 2565 2.0 2.0 2.0 0.2 0.6 0.4 0.10 0.10 0.10 0.40 0.90 0.65 0 2 1 0 4 21933 NEAR GALVANISATION UNIT,
HOWRAH26 27 27 7.8 7.8 7.8 1159 1229 1194 3.2 3.2 3.2 0.6 3.9 2.3 0.10 0.10 0.10 0.30 0.80 0.55 0 4 2 0 7 4
1934 CENTRAL HOWRAH-RESIDENTAIL AREA
25 28 26 7.5 7.8 7.7 2540 2570 2555 6.4 6.4 6.4 1.2 1.2 1.2 0.10 0.10 0.10 0.60 0.60 0.60
1935 INSIDE KOLKATA LEATHER COMPLEX
27 28 27 7.6 7.9 7.8 1476 1491 1484 4.0 4.0 4.0 0.1 0.5 0.3 0.10 0.10 0.10 0.30 0.60 0.45
1936 RESIDENTIAL AREA - SONARPUR 26 30 28 7.6 8.1 7.9 875 908 892 3.2 3.2 3.2 0.2 0.3 0.3 0.10 0.10 0.10 0.30 0.60 0.45 2 8 5 4 17 11
1937 RAJARHAT - NEW TOWNSHIP 26 28 27 7.5 7.8 7.7 2140 2160 2150 3.0 3.0 3.0 0.3 1.0 0.7 0.10 0.10 0.10 0.40 0.50 0.4519381939
BASIRHAT MUNICIPALITY
BARRACKPORE MUNICIPALITY
3228
3228
3228
8.27.7
8.48.2
8.38.0
1098443
2140448
1619446
7.46.8
7.46.8
7.46.8
0.30.1
0.90.3
0.60.2
0.100.10
0.210.24
0.160.17
0.400.31
0.650.60
0.53 0 1 1 0 2 10.46
1940 NEAR PHOSPHATE COMPANY,M.G
30 30 30 7.3 7.6 7.5 781 789 785 1.0 1.0 1.0 0.1 1.1 0.6 0.10 0.10 0.10 0.10 0.42 0.26
SARANI,RISHRA,WEST BENGAL
1941 NEAR FLY ASH DUMPING SITE-KUNTIGHAT, BANDEL
29 34 31 7.3 7.4 7.4 461 464 463 1.0 1.0 1.0 0.6 0.8 0.7 0.10 0.10 0.10 0.10 0.50 0.30
1942 NEAR EXIDE INDUSTRIES-HALDIA 31 35 33 7.8 7.9 7.9 1430 1521 1476 4.2 4.2 4.2 0.1 0.3 0.2 0.10 0.10 0.10 0.50 1.00 0.75
1943 INSIDE TATA METALIKS, KHARAGPUR
31 31 31 7.5 7.9 7.7 529 619 574 3.3 3.3 3.3 0.0 1.0 0.5 0.10 0.10 0.10 0.30 0.50 0.40
1945 ENGLISH BAZAR- MALDAH 29 29 29 7.3 7.3 7.3 668 668 668 8.0 8.0 8.0 0.4 0.4 0.4 0.10 0.10 0.10
Stat
ion
Cod
e LOCATIONS TEMPERAT pH
TABLE 20.11 :- WA
CONDUCTIVITY
TER QUALITY OF G
C.O.D. (mg/l)
ROUND WATER I
B.O.D. (mg/l)
N ORISSA- 2007
NITRATE (mg/l) AMMONIA - N URE ºC (µmhos/cm) (mg/l)
X N X N X N X N X N X N X N
1644JAGATPUR INDUSTRIAL AREA, CUTTACK ORISSA
MIN
28
MA
28
MEA
28
MIN
7.8
MA
7.8
MEA
7.8
MIN
1266
MA
1266
MEA
1266
MIN
3.0
MA
3.0
MEA
3.0
MIN
0.4
MA
0.4
MEA
0.4
MIN
8.76
MA
8.76
MEA
8.76
MIN
0.60
MA
0.60
MEA
0.60
MADHUPATNA- KALYAN NAGAR 1645 AREA, CUTTACK, ORISSA
BIDANASHI - TULASIPUR AREA, 28 28 28 8.2 8.2 8.2 1606 1606 1606 3.0 3.0 3.0 0.8 0.8 0.8 6.28 6.28 6.28 0.60 0.60 0.60
1646 CUTTACK, ORISSABADAMBARI AREA, CUTTACK,
28 28 28 8.0 8.0 8.0 120 120 120 6.0 6.0 6.0 0.8 0.8 0.8 0.63 0.63 0.63 0.60 0.60 0.60
1647 ORISSARANIHAT- MANGALABAGH AREA,
28 28 28 8.3 8.3 8.3 408 408 408 3.0 3.0 3.0 0.4 0.4 0.4 2.41 2.41 2.41 0.60 0.60 0.60

1657MAUSHIMA TEMPLE AREA, PURI, ORISSA 30 30 30 7.8 7.8 7.8 785 785 785 3.0 3.0 3.0 0.4 0.4 0.4 7.48 7.48 7.48 0.60 0.60 0.60
1658NEAR RIVER KUSHABHADRA, PURI, ORISSA 28 28 28 8.3 8.3 8.3 448 448 448 3.0 3.0 3.0 0.2 0.2 0.2 0.25 0.25 0.25 0.60 0.60 0.60
1650CAPITAL HOSPITAL AREA, BHUBANESWAR, ORISSA 25 25 25 8.0 8.0 8.0 330 330 330 9.0 9.0 9.0 0.2 0.2 0.2 0.82 0.82 0.82 0.80 0.80 0.80
OLD TOWN- SAMANTARAAIPUR AREA, BHUBANESWAR,ORISSA1651
KALPNA - LAXMINAGAR AREA,
25 25 25 8.2 8.2 8.2 213 213 213 6.0 6.0 6.0 0.36 0.36 0.36 0.60 0.60 0.60
1652
1653
BHUBANESWAR, ORISSA
MANCHESWAR INDUSTRIAL AREA, BHUBANESWAR, ORISSA
25
27
25
27
25
27
7.0
7.0
7.0
7.0
7.0
7.0
157
196
157
196
157
196
3.0
6.0
3.0
6.0
3.0
6.0
0.2 0.2 0.2 6.22
3.72
6.22
3.72
6.22
3.72
0.60
1.10
0.60
1.10
0.60
1.10
SECRETARIAT- GOVERNOR
1654HOUSE- OLDBUS STAND AREA, BHUBANESWAR, ORISSA 26 26 26 8.0 8.0 8.0 507 507 507 6.0 6.0 6.0 8.68 8.68 8.68 1.70 1.70 1.70
1655 NEAR SEA BEACH, PURI, ORISSANEAR JAGANNATH TEMPLE,
29 29 29 8.2 8.2 8.2 1003 1003 1003 6.0 6.0 6.0 0.6 0.6 0.6 14.7 14.7 14.7 0.80 0.80 0.80
1656 PURI, ORISSAHOSPITAL - BUSSTAND-
29 29 29 8.4 8.4 8.4 1299 1299 1299 3.0 3.0 3.0 0.2 0.2 0.2 22.0 22.0 22.0 0.60 0.60 0.60