wfp’s draft 2014 2017 strategic results...
TRANSCRIPT

Draft WFP Strategic Results Framework – 28 May 2013
WFP’s Draft 2014-2017 Strategic Results Framework
What is the Strategic Results Framework?
WFP’s 2014-2017 Strategic Results Framework (SRF) is a key normative instrument for project design, monitoring and reporting, and
serves to operationalize the 2014-2017 Strategic Plan. The SRF serves several salient purposes: (1) it aligns outcomes and outputs with
the higher level Strategic Objectives of the Strategic Plan, thereby translating the organization’s high level objectives into actionable
results and deliverables; (2) it provides a normative framework around which all WFP projects are designed; (3) it provides a list of
corporate indicators used by all offices for outcome and output monitoring; (4) it informs corporate reporting with achievement values
for the indicators in the SRF being included in WFP’s Standard Project Reports (SPRs) and the Annual Performance Report (APR).
In serving these varied purposes, the SRF is a core element of WFP’s performance management and accountability framework and
ensures harmonized approaches to project design, monitoring and reporting across WFP operations. The framework also helps WFP
demonstrate its contributions to the Millennium Development Goals, in particular to MDGs 1 and 4. The SRF is complemented by
WFP’s Management Results Framework (MRF), which captures WFP’s managerial results and indicators, and by Country Strategy
Documents, which describe WFP’s strategic orientation at country level.
What the SRF is not…
The SRF is primarily a normative instrument used to inform project design and project level monitoring and reporting. As such, it
includes planning elements and indicators of relevance to the project level, and does not purport to reflect country, regional or global
level results and indicators. WFP projects are typically established under the umbrella of a Country Strategy, UNDAF or similar country
level arrangement. The SRF therefore does not purport to capture country level objectives. The only exception to this are the SRF
outcomes concerning capacity development, which are intended to effect change at the national level. Other outcome statements speak to
intended results in particular communities or with specific population groups. The SRF also makes no reference to the managerial
dimensions of WFP’s work as these are found in the Management Results Framework (MRF), which contains the organization’s
managerial results and indicators including indicators of organizational efficiency and effectiveness.

Draft WFP Strategic Results Framework – 28 May 2013
Process for developing the SRF
The SRF has been developed through a robust consultative process. In addition to the engagement of WFP managers and technical staff
at Headquarters, Regional Bureaux and Country Offices, the SRF has been developed in consultation with other UN funds, programmes
and agencies in line with the Quadrennial Comprehensive Policy Review (QCPR), particularly UNDP, UNICEF, UNFPA and UN-
Women, and with other sister agencies and stakeholders including FAO, IFAD, UNHCR, WHO, UNAIDS, OCHA, ICRC and ISDR.
Informal consultations with WFP’s Executive Board on the SRF are also foreseen. This collaborative process has improved the quality of
the SRF and strengthened harmonization with sister agencies, while avoiding gaps and redundancies in work with key partners.
Structure of the SRF
In line with the QCPR, WFP has agreed with other UNDG agencies, funds and programmes to take steps towards converging strategic
planning, particularly with respect to results frameworks. Consequently, WFP’s SRF relies on the same results chain and the same
definitions included in the UNDG RBM Guidelines.
The structure of the SRF reflects the four Strategic Objectives of the 2014-2017 Strategic Plan:
- SO 1: Save Lives and Protect Livelihoods in Emergencies;
- SO 2: Support or restore food security and nutrition and establish or rebuild livelihoods in fragile settings and following
emergencies;
- SO 3: Reduce risk and enable people, communities and countries to meet their own food and nutrition needs;
- SO 4: Reduce undernutrition and break the intergenerational cycle of hunger.
For each of the four Strategic Objectives, the goals included in the 2014-2017 Strategic Plan are listed. Also included under each
Strategic Objective is the set of outcomes and outputs that have been developed for 2014-2017. Each of the outcomes is linked to one or
more outputs, with the output statements describing the tangible deliverables WFP can be held accountable for. Outcomes are linked
upwards to the Strategic Objectives and downward to outputs. Outputs, in turn, are linked downwards to activities and inputs (not shown
in the SRF). This hierarchical linkage from inputs through to impacts describes the WFP results chain.
Draft WFP Strategic Results Framework – 28 May 2013
Content of the SRF
The 2014-2017 Strategic Plan does not purport to chart a new direction for WFP, but aims to consolidate the shift from food aid to food
assistance described in the 2008-2013 Strategic Plan. In line with the new Strategic Plan, the SRF aims to better reflect WFP’s efforts to
prepare and respond to shocks, restore and rebuild lives and livelihoods, reduce vulnerability and build lasting resilience. The
mainstreaming of capacity development work (previously under SO 5) into the four Strategic Objectives, reflects the intent to strengthen
capacity development across all Strategic Objectives. The 2014-2017 SRF also gives greater attention to and better integrates, gender,
protection and partnership work through inclusion of a set of Cross-cutting results and indicators.
The SRF provides a comprehensive compendium of WFP’s outcomes and outputs. Each of the outcomes and outputs included in the
SRF has at least one corporate indicator. The indicators included in the SRF are restricted to those which: (1) are deemed to be of
relevance to most WFP operations; and (2) are considered to be of strategic importance. Other indicators not meeting these two criteria
are considered ‘project-specific’, and are available to WFP staff in the indicator compendium.
Business rules for using the SRF
Application of the following business rules will ensure harmonized approaches to project design, monitoring and reporting at all WFP
locations:
1. The SRF shall be used for the design of all EMOP, PRRO and DEV/CP projects.
2. The design of project logframes shall begin with the selection of the SO(s) described in the narrative section of the project
document. Depending on the operational context and programmatic scope, a project may contain only one SO or multiple SOs.
3. Each project objective in the narrative section must be aligned to only one SO.
4. For each SO selected for the project, at least one outcome must be selected from the SRF.
5. For each outcome selected, at least one corresponding outcome indicator must be selected from the SRF.
6. For each outcome selected, at least one linked output must also be selected from the SRF.
7. For each output selected, all linked output indicators of relevance to the programme must be selected from the SRF.
8. Corporate indicators (those selected from the SRF) can be complemented by indicators from the Project-specific indicator
compendium.
9. Project targets must be established for all corporate indicators, both at outcome and output levels.
10. All corporate indicators included in project logframes must be monitored as per the periodicity defined in Annex 1.

Draft WFP Strategic Results Framework – 28 May 2013
STRATEGIC OBJECTIVE 1: Save Lives and Protect Livelihoods in Emergencies
GOALS:
1: Meet urgent food and nutrition needs of vulnerable people and communities and reduce under nutrition to
below emergency levels
2: Protect lives and livelihoods while enabling safe access to food and nutrition for women and men
3: Strengthen the capacity of governments and regional organisations and enable the humanitarian community to prepare for, assess and respond to shocks
IMPACT
Contribution to:
Eradication of extreme hunger (MDG 1/SDG)
Reduction in child mortality (MDG 4/SDG)
CROSS-CUTTING RESULTS AND INDICATORS:
GENDER: Gender equality and empowerment improved; INDICATORS: Number of women/men in leadership positions of project management committees; Number and
percentage of women project management committee members trained on modalities of food, cash, or voucher distribution.
PROTECTION: WFP assistance delivered and utilized in safe, accountable and dignified conditions; INDICATORS: Proportion of assisted people reporting having had safety
problems to or from or at WFP programme sites; Proportion of assisted people reporting having received information about the programme (who is included, what people
will receive, where people can complain).
PARTNERSHIP: Food assistance interventions coordinated and partnerships developed; INDICATORS: Amount of complementary funds provided to the project by partners
(including NGOs, INGOs, Civil Society, Private Sector organizations, International Financial Institutions, Regional development banks); Proportion assessments jointly
conducted with partners.
SO 1 Outcomes Indicators Corporate targets Project targets and data sources
Outcome 1.1 Reduced or stabilized under
nutrition among children under 5 years of age
and Pregnant and Lactating Women
Main transfer tools include:
General distribution (Food, cash, vouchers);
Supplementary Feeding; Specialized nutritional
product
1.1.A Moderate Acute
Malnutrition (MAM) treatment
Performance Rate (Recovery,
Mortality, Default and Non-
response)
Project target met for 80 %
of projects
Target: Mortality <3%;
Recovery rate >75%;
Default rate <15%Data source: MoH/ WFP patient
register;
Monthly CP reports
1.1.B Proportion of eligible
population who participate in
programme coverage
Project target met for 80 %
of projects
Target: MAM Treatment Coverage > 50% Rural areas;
>70% Urban areas;
>90% Camp situations;
Prevention >70%Data source: Survey; SQUEC method
Draft WFP Strategic Results Framework – 28 May 2013
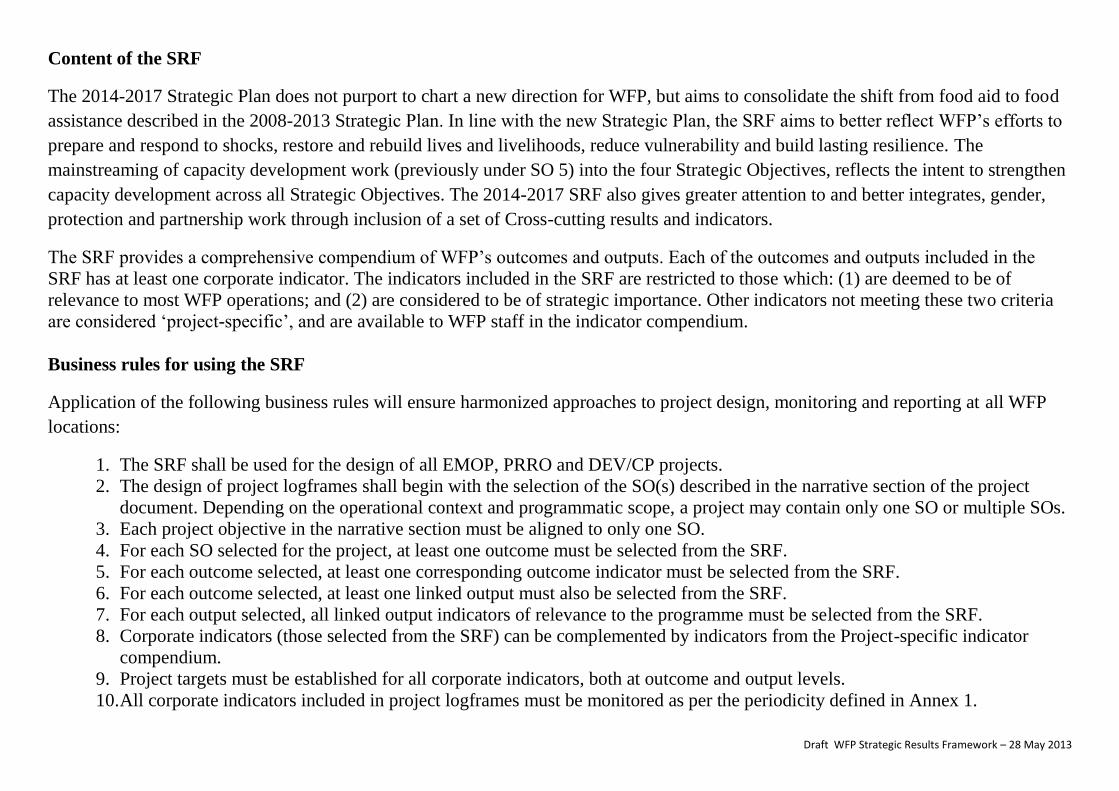
1.2 Stabilized or improved food consumption
over assistance period for target households
Main transfer tools include:
General distribution (Food, cash, vouchers)
1.2.A Food consumption score
Project target met for 80 %
of projects
Target: 1.2.A 80% targeted HHs have at least borderline
consumption
Data source: EFSA, PDM, FSOM
1.2.B Daily Average Dietary
Diversity
Project target met for 80 %
of projects
Target: 1.2.B 80% targeted HHs consume at least 3 food
groups on average per day
Data source: EFSA, PDM, FSOM
1.2.C Coping strategy index
(food strategies)
Project target met for 80 %
of projects
Target: 1.2.C CSI of 80% of targeted HHs is stabilized or
reduced
Data source: EFSA, PDM, FSOM
1.2.D Coping strategy index
(assets depletion strategies)
Project target met for 80 %
of projects
Target: 1.2D 80% of targeted HHs are not applying asset
depletion strategies
Data source: EFSA, PDM, FSOM
Outcome 1.3 Restored or stabilized access to
basic services and critical community assets
Main transfer tools include:
School Feeding; Food, cash, vouchers for
training; HIV/TB/PMTC treatment, Food
Assistance for Assets (Food, cash and vouchers)
1.3.A Retention rate for boys
and girls
Project target met for 80 %
of projects
Target: 70% retention of enrolled boys and girls
Data source: EMIS, school records, surveys
1.3.B Defaulter Rate of
HIV/TB/PMTC treatment
Project target met for 80 %
of projects
Target: Default rate <15%
Data source: Partner reports
1.3.C Critical Community Asset
Score (Critical CAS) Project target met for 80 %
of projects
Target: At least 50% of damaged/destroyed critical
assets restored during the emergency
Data source: PDM, FSOM
Outcome 1.4 National institutions, regional
bodies, and the humanitarian community are
enabled to assess and respond to emergencies
Main transfer tools include:
Policy and programmatic advice, logistics
1.4.A Emergency Preparedness
and Response Capacity Index
(EPCI)
Project target met for 80 %
of projects
Target: EPCI is increased from baseline
Data source: Capacity analysis
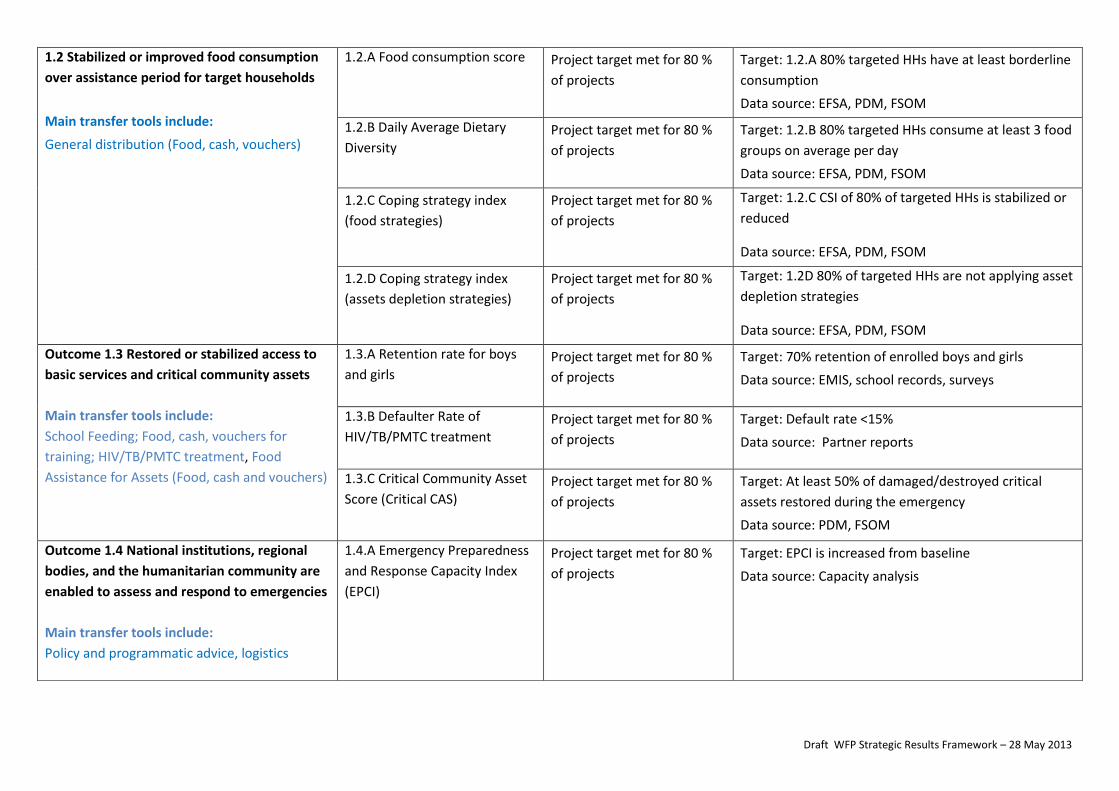
Draft WFP Strategic Results Framework – 28 May 2013
services, Information and communications
technology, assessments and monitoring,
Infrastructure, Advocacy, Training
1.4.B User satisfaction rate Project target met for 80 %
of projects
Target: project specific
Data source: User satisfaction survey
Outputs
Indicators
Output 1.1.1 Food, nutritional products and
non-food items, cash transfers and vouchers
distributed in sufficient quantity, quality and in
a timely manner to targeted households
1.1.1.a Number of beneficiaries receiving assistance as % of planned (disaggregated by activity; by food, non-food items,
cash transfers and vouchers; and by women, men, girls, boys
1.1.1.b Quantity of food assistance distributed, as % of planned distribution (disaggregated by type)
1.1.1.c Quantity of non-food items distributed as % of planned distribution (disaggregated by type)
1.1.1.d Total amount of cash transferred to beneficiaries (disaggregated by women, men, girls, boys)
1.1.1.e Total value of vouchers distributed (expressed in food/cash, disaggregated by women, men, girls, boys)
1.1.1.f Total planned beneficiaries reached by week 4 for sudden on-set emergencies
Output 1.2.1 Food, nutritional products and
non-food items, cash transfers and vouchers
distributed in sufficient quantity, quality and in
a timely manner to targeted households
1.2.1.a Number of beneficiaries receiving assistance as % of planned (disaggregated by activity; by food, non-food items,
cash transfers and vouchers; and by women, men, girls, boys
1.2.1.b Quantity of food assistance distributed, as % of planned distribution (disaggregated by type)
1.2.1.c Quantity of non-food items distributed as % of planned distribution (disaggregated by type)
1.2.1.d Total amount of cash transferred to beneficiaries (disaggregated by women, men, girls, boys)
1.2.1.e Total value of vouchers distributed (expressed in food/cash, disaggregated by women, men, girls, boys)
Output 1.3.1 Food, nutritional products and
non-food items, cash transfers and vouchers
distributed in sufficient quantity, quality and in
a timely manner to targeted households
1.3.1.a Number of beneficiaries receiving assistance as % of planned (disaggregated by activity; by food, non-food items,
cash transfers and vouchers; and by women, men, girls, boys
1.3.1.b Quantity of food assistance distributed, as % of planned distribution (disaggregated by type)
1.3.1.c Quantity of non-food items distributed as % of planned distribution (disaggregated by type)
1.3.1.d Total amount of cash transferred to beneficiaries (disaggregated by women, men, girls, boys)
1.3.1.e Total value of vouchers distributed (expressed in food/cash, disaggregated by women, men, girls, boys)

Draft WFP Strategic Results Framework – 28 May 2013
1 Output 1.4.1 refers to the urgent repair or maintenance of physical and natural assets that enable physical access by targeted communities to humanitarian assistance, critical
infrastructures and services (e.g. roads to access markets and basic social services; emergency water supply and sanitation) and/or reduce additional risk to lives e.g. health and critical livelihood assets (e.g. immediate drainage of canals/clearing of debris before or during the rainy season to reduce the risk of flood, etc.) 2 Early Warning Information system, response activation and coordination mechanisms, response framework, food security and vulnerability analysis, humanitarian supply chain
management; emergency telecommunications; hazard analysis and early warning; support to national disaster response planning, etc.
Output 1.3.2 Critical community assets
restored or maintained during the emergency
by targeted communities and individuals1
1.3.2.a Number of critical community assets restored or maintained during the emergency by targeted communities and
individuals, by type and unit of measure
Output 1.4.1 Logistics augmentation, UNHAS and/or Emergency Telecommunications services provided
1.4.1.a UNHRD items provided against requests by type
1.4.1.b Number of goods and services provided by type
1.4.1.c Number of passengers transported
1.4.1.d Metric tons/Cubic Meters of cargo transported
Output 1.4.2 Emergency management capacity created and/or supported
1.4.2.a Number of technical assistance activities provided by type2
1.4.2.b Number of people trained by type

Draft WFP Strategic Results Framework – 28 May 2013
STRATEGIC OBJECTIVE 2: Support or restore food security and nutrition and establish or rebuild livelihoods in fragile settings and following emergencies GOALS: 1: Restore or support food security and nutrition of people and communities and contribute to stability, resilience and self-reliance 2: Assist communities and countries to rebuild or establish livelihoods, connecting to markets and managing food systems 3: Through food and nutrition assistance, support the safe, voluntary return and reintegration of refugees and IDPs 4: Ensure equitable access to and control over food and nutrition assistance for women and men
IMPACT
Contribution to:
Eradication of extreme hunger (MDG 1/SDG)
Reduction in child mortality (MDG 4/SDG)
CROSS-CUTTING RESULTS AND INDICATORS:
GENDER: Gender equality and empowerment improved; INDICATORS: Number of women/men in leadership positions of project management committees; Number and
percentage of women project management committee members trained on modalities of food, cash, or voucher distribution.
PROTECTION: WFP assistance delivered and utilized in safe, accountable and dignified conditions; INDICATORS: Proportion of assisted people reporting having had safety
problems to or from or at WFP programme sites; Proportion of assisted people reporting having received information about the programme (who is included, what people
will receive, where people can complain).
PARTNERSHIP: Food assistance interventions coordinated and partnerships developed; INDICATORS: Amount of complementary funds provided to the project by partners
(including NGOs, INGOs, Civil Society, Private Sector organizations, International Financial Institutions, Regional development banks); Proportion of assessments jointly
conducted with partners.
SO 2 Outcomes Indicators Corporate targets Project targets and data sources
Outcome 2.1 Adequate food consumption
reached or maintained by targeted households
Main transfer tools include:
General distribution (Food, cash, vouchers)
2.1.A Food Consumption Score Project target met for 80 % of projects Target: 80 % of targeted HH have acceptable
food consumption
Data source: EFSA, PDM, FSOM based on
statistically representative household
interviews
2.1.B Daily Average Dietary
Diversity
Project target met for 80 % of projects Target: 80 % of targeted HH consume at
least 3 food groups on average per day
Data source: EFSA, PDM, FSOM based on
statistically representative household
interviews

Draft WFP Strategic Results Framework – 28 May 2013
2.1.C Coping strategy index
(food strategies)
Project target met for 80% of projects Target: 80 % of targeted HH have reduced or
stabilized CSI (for food);
Target: 80% of targeted HH not applying
asset depletion strategies (for assets)
Data source: EFSA, PDM, FSOM based on
statistically representative household
interviews
2.1.D Coping strategy index
(assets depletion strategies)
Outcome 2.2 Improved access to assets,
including community and market
infrastructure
Main transfer tools include:
Food assistance for assets (food, cash,
vouchers), Insurance for assets
2.2.A Community Asset Score
(CAS)
Project target met for 80% of projects Target: 80% of targeted communities with
community assets over baseline level
Data source: EFSA, PDM, FSOM based on
statistically representative household
interviews
Outcome 2.3 National food security and food
information systems established or
strengthened to assess and monitor food
security, address national food insecurity
needs and respond to disasters and shocks
Main transfer tools include:
Technical assistance, partnerships, advocacy
2.3.A National Capacity Index
Project target met for 80% of projects Project specific
Outputs Indicators
Output 2.1.1 Food, nutritional products and
non-food items, cash transfers and vouchers
distributed in sufficient quantity, quality and in
a timely manner to targeted households
2.1.1.a Number of beneficiaries receiving assistance as % of planned (disaggregated by activity; by food, non-food items,
cash transfers and vouchers; and by women, men, girls, boys
2.1.1.b Quantity of food assistance distributed, as % of planned distribution (disaggregated by type)
2.1.1.c Quantity of non-food items distributed as % of planned distribution (disaggregated by type)
2.1.1.d Total amount of cash transferred to beneficiaries (disaggregated by women, men, girls, boys)
2.1.1.e Total value of vouchers distributed (expressed in food/cash, disaggregated by women, men, girls, boys)

Draft WFP Strategic Results Framework – 28 May 2013
3 Types of technical support activities include: training events, secondments, guidance materials and information products.
Output 2.2.1 Food, nutritional products and
non-food items, cash transfers and vouchers
distributed in sufficient quantity, quality and in
a timely manner to targeted households
2.2.1.a Number of beneficiaries receiving assistance as % of planned (disaggregated by activity; by food, non-food items,
cash transfers and vouchers; and by women, men, girls, boys
2.2.1.b Quantity of food assistance distributed, as % of planned distribution (disaggregated by type)
2.2.1.c Quantity of non-food items distributed as % of planned distribution (disaggregated by type)
2.2.1.d Total amount of cash transferred to beneficiaries (disaggregated by women, men, girls, boys)
2.2.1.e Total value of vouchers distributed (expressed in food/cash, disaggregated by women, men, girls, boys)
Output 2.2.2 Livelihood assets restored and/or built by targeted households and communities
2.2.2. Number of community assets restored or maintained by targeted communities and individuals, by type and unit of
measure
Output 2.3.1 Policy advice and technical support provided to enhance management of food supply chain, food assistance and food security systems including, food security information systems
2.3.1.a Number of national assessments/data collection exercises in which food security and nutrition were integrated
with WFP support
2.3.1.b Number of technical support activities3 provided on food security monitoring and food assistance by type
Output 2.3.2 National Systems to Monitor trends in food security and nutrition strengthened
2.3.2.a Number of government counterparts trained in data collection and analysis on food and nutrition security based information
2.3.2.b Number of food security and nutrition monitoring/surveillance reports produced with WFP support

Draft WFP Strategic Results Framework – 28 May 2013
STRATEGIC OBJECTIVE 3: Reduce risk and enable people, communities and countries to meet their own food and nutrition needs GOALS: 1: Support people, communities and countries to strengthen their resilience to shocks, reduce disaster risks, and adapt to climate change through food and nutrition assistance 2: Leverage WFP’s purchasing power to connect smallholder farmers to markets, reduce post-harvest losses, support economic empowerment of women and men and transform food assistance into a productive investment in local communities 3: Strengthen the capacity of communities and governments to establish, manage and scale up sustainable, effective and equitable food security and nutrition institutions, infrastructure, and safety net systems, including systems linked to local agricultural supply chains
IMPACT
Contribution to:
Eradication of extreme hunger (MDG 1/SDG)
Reduction in child mortality (MDG 4/SDG)
CROSS-CUTTING RESULTS AND INDICATORS:
GENDER: Gender equality and empowerment improved; INDICATORS: Number of women/men in leadership positions of project management committees; Number and
percentage of women project management committee members trained on modalities of food, cash, or voucher distribution.
PROTECTION: WFP assistance delivered and utilized in safe, accountable and dignified conditions; INDICATORS: Proportion of assisted people reporting having had safety
problems to or from or at WFP programme sites; Proportion of assisted people reporting having received information about the programme (who is included, what people
will receive, where people can complain).
PARTNERSHIP: Food assistance interventions coordinated and partnerships developed; INDICATORS: Amount of complementary funds provided to the project by partners
(including NGOs, INGOs, Civil Society, Private Sector organizations, International Financial Institutions, Regional development banks); Proportion of assessments jointly
conducted with partners.
SO 3 Outcomes Indicators Corporate baselines and targets Project targets and data sources
Outcome 3.1 1 Improved access to livelihood
assets has enhanced resilience and reduced
risk of disaster and shocks of targeted food
insecure communities and households
Main transfer tools include:
Food assistance for assets (food, cash and
voucher), Insurance for assets
3.1.A Community Asset Score (CAS)
Project target met for 80% of
projects
Target: Asset score threshold set to capture
increase (created or restored) in community
disaster mitigation assets over base level
Data source: Survey data
3.1.B Food Consumption Score
Project target met for 80% of
projects
Target: 100% targeted HHs have acceptable
consumption
Data source: PDM, FSOM
3.1.C Daily Average Dietary Diversity
Project target met for 80% of
projects
Target: 100% target HHs consume at least 4
food groups on average per day
Data source: PDM, FSOM

Draft WFP Strategic Results Framework – 28 May 2013
3.1.D Coping strategy index (food strategies)
Project target met for 80% of
projects
Target: CSI of 100% target HHs is stabilized or
reduced
Data source: PDM, FSOM
3.1.E Coping Strategy index (assets depletion strategies)
Project target met for 80% of
projects
Target: 100% of target HHs are not applying
asset depletion strategies
Data source: PDM, FSOM
Outcome 3.2 Increased marketing
opportunities for agricultural products and
commodities at regional, national and local
levels
Main transfer tools include:
Procurement, Advocacy, P4P, Partnerships
3.2.A Food purchased from regional, national and local suppliers, as % of food distributed by WFP in-country
80% of food distributed by WFP in-
country are purchased from regional,
national and local suppliers
Target: Project specific
Data source: Food Procurement Tracking
System (FPTS)
3.2.B
Fortified foods purchased from
local and regional suppliers, as
% of fortified food distributed
by WFP in-country
Target: Project specific
Data source: Food Procurement Tracking
System (FPTS)
3.2.C
Food purchased from
aggregation systems in which
smallholders are participating,
as % of regional, national and
local purchases
Target: 10% of LRP volume is procured from
pro-smallholder aggregation systems
3.2.D
Share of active WFP vendors
that demonstrate use of pro-
smallholder aggregation
systems
Target: 30% of active WFP vendors on the
vendor list aggregate commodities sold to WFP
in a pro-smallholder manner

Draft WFP Strategic Results Framework – 28 May 2013
4 Refers to communities with preparedness plans (areas at risk, safe routes, tracking mechanism such as measurement of water level, training, safe-storage, communication gear, etc), and
prevention measures related to asset creation and capacity development efforts, amongst others.
Outcome 3.3 Strengthened government and
community capacities to establish, strengthen
and manage safety nets, disaster risk
reduction, resilience and climate change
adaptation systems
Main transfer tools include:
Policy and programmatic advice, advocacy,
technical assistance
3.3.A
National Capacity Index
Target: Project specific
Data source: Capacity assessment analysis
3.3.B
% of targeted communities
supported by WFP reporting an
improved capacity to manage
climatic shocks and risks
Target: Project specific
Data source:
3.3.C
% of targeted communities
supported by WFP with
community-based plans that
include preparedness and
prevention activities4
Target: Project specific
Data source:
Outputs Indicators
Output 3.1.1 Food, nutritional products and
non-food items, cash transfers and vouchers
distributed in sufficient quantity, quality and in
a timely manner to targeted households
3.1.1.a Number of beneficiaries receiving assistance as % of planned (disaggregated by activity; by food, non-food items,
cash transfers and vouchers; and by women, men, girls, boys
3.1.1.b Quantity of food assistance distributed, as % of planned distribution (disaggregated by type)
3.1.1.c Quantity of non-food items distributed as % of planned distribution (disaggregated by type)
3.1.1.d Total amount of cash transferred to beneficiaries (disaggregated by women, men, girls, boys)
3.1.1.e Total value of vouchers distributed (expressed in food/cash, disaggregated by women, men, girls, boys)
Output 3.1.2 Assets that reduce risk of
disasters and shocks, developed, built or
3.1.2.a Number of risk reduction and disaster mitigation assets created or restored, by capital category , type and unit of measure

Draft WFP Strategic Results Framework – 28 May 2013
5
In this context, ‘’assets’’ refers to the five capital categories i.e. natural, physical, financial, social and human capital.
6 This refers to WFP activity related to improved household and community access to livelihood assets (e.g. Food for Assets, Food for Training, Cereal Banks, Insurance for Assets, etc.) that
are nutrition sensitive. They consider the nutrition needs of target groups by not negatively impacting infant and young children feeding practices (e.g. breastfeeding) and/or actively promoting improved diet of women, infants, and young children. 7 E.g. collecting, analysing and disseminating information and data on risk, vulnerability, food security and nutrition; designing and supporting community-based and government-led safety
net strategies, policies and programmes that provide food assistance and technical support for food and nutrition security (targeting, conditionality, transfer selection, monitoring and evaluation, graduation criteria, etc.); evaluating and generating evidence on safety nets; cross-cutting technical and analytical activities aiming to enhance ownership, raise awareness and influence policy-making in safety nets for food assistance; etc. 8 In output 3.3.2, ‘’activities’’ refers to food security monitoring system, comprehensive risk and vulnerability food security and nutrition assessments, and context analysis, seasonal
livelihood programming, and community-based participatory planning, etc.
restored5
3.1.2.b Number of people trained (disaggregated by sex, type)
Output 3.1.3 Improved diet and positive
feeding practices promoted through WFP
assistance
3.1.3a Proportion of activities6 including promotion of adequate diet for women and children and positive feeding practices of infants and young
Output 3.2.1 Increased WFP food purchase
from regional, national and local markets and
smallholder farmers
3.2.1.a Quantity of food purchased locally through Local and Regional Purchases (expressed in MT) 3.2.1.b Quantity of food purchased locally from pro-smallholder aggregation systems (expressed in MT) 3.2.1.c Number of WFP vendors that have adopted demonstrable pro-smallholder aggregation practices 3.2.1.d Number of FOs trained in market access and post-harvest handling skills
Output 3.2.2 Increased WFP fortified foods,
complementary foods and special nutrition
products produced purchased from local
suppliers
3.2.2.a Quantity of fortified foods, complementary foods and special nutrition products purchased from local suppliers
Output 3.3.1 Establishment and/or
strengthening of national safety net ,
government and community based systems
3.3.1.a Number of technical assistance activities provided by type7
3.3.1.b Number of people trained by type
Output 3.3.2 Government and community
based food security and nutrition related
disaster risk management supported
3.3.2.a Number of technical assistance activities provided by type8 3.3.2.b Number of people trained (disaggregated by sex and type of training)
Output 3.3.3 Public institutions promoting
smallholder farmer market development
supported
3.3.3.a Quantity of food procured by public institutions receiving WFP support

Draft WFP Strategic Results Framework – 28 May 2013
STRATEGIC OBJECTIVE 4: Reduce undernutrition and break the intergenerational cycle of hunger GOALS: 1:Prevent stunting and wasting, treat moderate acute malnutrition and address micronutrient deficiencies particularly among young children, pregnant and lactating women and those affected by HIV/AIDS and tuberculosis HIV/AIDS and tuberculosis by providing access to appropriate food assistance 2: Increase access to education, contribute to learning and improve nutrition and health for children, adolescent girls and their families 3: Strengthen the capacity of communities and governments to design, manage and scale-up nutrition programmes and create an enabling environment that promotes gender equality and brings undernutrition below critical levels
IMPACT
Contribution to:
Eradication of extreme hunger (MDG 1/SDG)
Reduction in child mortality (MDG 4/SDG)
CROSS-CUTTING RESULTS AND INDICATORS:
GENDER: Gender equality and empowerment improved; INDICATORS: Number of women/men in leadership positions of project management committees; Number and
percentage of women project management committee members trained on modalities of food, cash, or voucher distribution.
PROTECTION: WFP assistance delivered and utilized in safe, accountable and dignified conditions; INDICATORS: Proportion of assisted people reporting having had safety
problems to or from or at WFP programme sites; Proportion of assisted people reporting having received information about the programme (who is included, what people
will receive, where people can complain).
PARTNERSHIP: Food assistance interventions coordinated and partnerships developed; INDICATORS: Amount of complementary funds provided to the project by partners
(including NGOs, INGOs, Civil Society, Private Sector organizations, International Financial Institutions, Regional development banks); Proportion of assessments jointly
conducted with partners.
SO 4 Outcomes Indicators Corporate targets Project targets and data sources
Outcome 4.1 Reduced and/or stabilized under
nutrition, including micronutrient deficiencies
Main transfer tools include:
General distribution (Food, cash, vouchers);
Supplementary Feeding; Mother-Child-Health-
Nutrition programmes, Specialized nutritional
product
4.1.A MAM treatment Performance Rate (Recovery, Mortality, Default and Non-response)
Project target met for 80% of projects Target: Mortality rate <3%
Recovery rate >75%
Default rate <15%
Non-response rate <15%
Data source: Source: MoH/ WFP patient
register; Monthly CP reports
4.1.B Proportion of eligible population who participate in programme (coverage)
Project target met for 80% of projects Target: MAM Treatment Coverage > 50%
Rural areas; >70% Urban areas; >90% Camp
situations; Prevention >70%
Data source: SQUEC method/ Survey

Draft WFP Strategic Results Framework – 28 May 2013
4.1 C Proportion of target population who participate in an adequate number of distributions
Project target met for 80% of projects Target:
Data source: PDM
Outcome 4.2 Increased equitable access to and utilisation of education
Main transfer tools include:
School feeding
4.2.A Enrolment of girls and boys
Project target met for 80% of projects Target: Annual rate increase of 6 %
Data source: EMIS, School records
4.2.B Retention rate for girls and boys
Project target met for 80% of projects Target: Retention rate of 85%
Data source: EMIS, School records
4.2.C Gender ratio of boys and girls
Project target met for 80% of projects Target: Gender ratio: 1
Data source: EMIS, School records
Outcome 4.3 Regional and national and
community ownership and capacity
strengthened to reduce under nutrition and
increase access to education
Main transfer tools include:
Policy and programmatic advice, advocacy,
technical assistance, Vulnerability analysis and
mapping
4.3.A National Capacity Index (NCI)
Project target met for 80% of projects Target: Project specific
Data source: Capacity assessment analysis
Outputs Indicators
Output 4.1.1 Food, nutritional products and non-food items, cash transfers and vouchers distributed in sufficient quantity, quality and in a timely manner to targeted households
4.1.1.a Number of beneficiaries receiving assistance as % of planned (disaggregated by activity; by food, non-food items,
cash transfers and vouchers; and by women, men, girls, boys
4.1.1.b Quantity of food assistance distributed, as % of planned distribution (disaggregated by type)
4.1.1.c Quantity of non-food items distributed as % of planned distribution (disaggregated by type)
4.1.1.d Total amount of cash transferred to beneficiaries (disaggregated by women, men, girls, boys)
4.1.1.e Total value of vouchers distributed (expressed in food/cash, disaggregated by women, men, girls, boys)

Draft WFP Strategic Results Framework – 28 May 2013
9 Technical expertise seconded to national government; provision of expertise to draft policy guidance; provision of expertise in institutional strengthening support; continuous engagement
with national institutions; provision of expertise in project design, management and monitoring
Output 4.1.2 Messaging and counselling on specialised nutritious foods and Infant and Young child feeding (IYCF) practices implemented effectively
4.1.2.a Proportion of women/men exposed to nutrition messaging supported by WFP against proportion planned 4.1.2.b Number of women/men receiving nutrition counseling supported by WFP against proportion of planned 4.1.2.c Proportion of targeted caregivers (male and female) receiving 3key messages delivered through WFP supported messaging and counseling
Output 4.2.1 Food, nutritional products and non-food items, cash transfers and vouchers distributed in sufficient quantity, quality and in a timely manner to targeted households
4.2.1.a Number of beneficiaries receiving assistance as % of planned (disaggregated by activity; by food, non-food items,
cash transfers and vouchers; and by women, men, girls, boys
4.2.1.b Quantity of food assistance distributed, as % of planned distribution (disaggregated by type)
4.2.1.c Quantity of non-food items distributed as % of planned distribution (disaggregated by type)
4.2.1.d Total amount of cash transferred to beneficiaries (disaggregated by women, men, girls, boys)
4.2.1.e Total value of vouchers distributed (expressed in food/cash, disaggregated by women, men, girls, boys)
Output 4.3.1 Food/nutrient approaches are incorporated into national programmes for nutrition
4.3.1.a Number of government people trained by WFP in nutrition programme design and implementation and other
nutrition related areas (technical/strategic/managerial)
4.3.1.b Number of technical assistance activities provided by type9
Output 4.3.2 National nutrition, school feeding, safety net policies and or regulatory frameworks in place with WFP support
4.3.2.a Number of national programmes developed with WFP support (nutrition, school feeding, safety net)
Output 4.3.3 Nutrition integrated or strengthened in national safety nets
4.3.3.a Number of national safety net policies that are nutrition sensitive
4.3.3.b Number of technical assistance activities provided by type
Output 4.3.4 Increased production capacity for fortified foods, including complementary foods and special nutritional products
4.3.4.a Number of technical assistance activities provided by type
4.3.4.b. Number of regional and national manufacturers producing FFs, CFs and SNF

Draft WFP Strategic Results Framework – 28 May 2013
ANNEX 1: SRF outcome indicators: Data Sources, Collection Methods, Periodicity and Reporting
Indicators Data Source Collection Method
Project Target
Periodicity (frequency of tracking)
Reporting (format to be
used) Food consumption score
EFSA, PDM, FSOM Household interviews (random sampling if feasible)
SO1: Beneficiary HHs have at least borderline consumption So2, SO3: Beneficiary HHs have acceptable consumption
Pre-intervention/during intervention For ongoing interventions: at least bi-annual
SPR Quarterly or bi-annual outcome monitoring bulletin
Daily Average Dietary Diversity EFSA, PDM, FSOM Household interviews (random sampling if feasible)
SO1: Beneficiary HHs consume at least 3 food groups on average per day SO2, SO3: Beneficiary HHs consume at least 4 food groups on average per day
Pre-intervention/during intervention For ongoing interventions: at least bi-annual
SPR Quarterly or bi-annual outcome monitoring bulletin
Coping strategy index (food strategies)
EFSA, PDM, FSOM Household interviews (random sampling if feasible)
80% CSI of HHs is stabilized or reduced
Pre-intervention/during intervention For ongoing interventions: at least bi-annual
SPR Quarterly or bi-annual outcome monitoring bulletin
Coping strategy index (asset depletion strategies)
EFSA, PDM, FSOM Household interviews (random sampling if feasible)
80% Beneficiary HHs are not applying asset depletion strategies
Pre-intervention/during intervention For ongoing interventions: at least bi-annual
SPR Quarterly or bi-annual outcome monitoring bulletin
MAM Treatment Performance (Recovery Rate, Death Rate, Default Rate and Non-respondent Rate)
MoH/ WFP patient register; Monthly partner reports
Health centre register
Mortality <3%; Recovery rate >75%; Default rate <15%
Monthly SPR/global nutrition update (bi-annual/ annual)
Proportion of eligible population who participate in programme (coverage)
1. Survey; 2 Squec method survey
HH interview MAM Treatment > 50% Rural areas; >70% Urban areas; >90% Camp situations; Prevention >70%
Prevention: Annually or based on project objective or duration. Squeac: annually
SPR/ Global nutrition updates (bi-annual/annual)

Draft WFP Strategic Results Framework – 28 May 2013
Proportion of target population who consume the appropriate amount of Specialized Nutritious Foods
PDM HH interview 70% consume appropriate amount (consuming most of the portion most of the time is appropriate)
Monthly (PDM)/ Less frequently if not based on project cycle
SPR/global nutrition update (bi-annual/ annual)
Defaulter Rate of HIV/TB/PMTC treatment
Partner reports Heath centre register (Outpatient records)
Default rate <15% Monthly SPR/ UBRAF report (annual)
Community Asset Score (CAS) PDM Focus Group Discussion
Increased in at least 80 percent of the targeted communities
End of Asset Creation Activity SPR
Critical Community Assets Score PDM Focus Group Discussion
At least 50% of damaged/destroyed critical assets
6 months from the start of a rapid onset emergency or at the end of the Emergency
SPR
Food purchased from regional, national and local suppliers, as % of food distributed by WFP in-country
Food Procurement Tracking System (FPTS)
Extraction from FPTS
N/A continuous SPR
Fortified foods purchased from local and regional suppliers, as % of fortified food distributed by WFP in-country
Food Procurement Tracking System (FPTS)
Extraction from FPTS
N/A continuous SPR
Enrolment Rate of girls and boys EMIS, School records
Physical count Annual rate increase of 6% Annually SPR
Retention Rate of girls and boys EMIS, School records
Physical count SO1: Retention rate of 70% SO4: Retention rate of 85%
Annually SPR
Gender Ratio of boys and girls EMIS, School records
Physical count Gender ratio 1 Annually SPR
National Capacity Index (NCI) Capacity analysis Consultative process with govt partners
Set for country – threshold set to capture increase in national capacity (based on initial assessment)
Annually or in accordance with the agreed milestones in the country strategy
SPR
Emergency Preparedness and Response Index (EPCI)
Capacity analysis Consultative process with govt partners, Secondary data
Increase of index (based on initial assessment)
At least beginning and end, depending on duration of intervention
SPR