west virginia economic developmentauthority … report with financi… · 300 chase tower, 707...
TRANSCRIPT

WEST VIRGINIAECONOMIC DEVELOPMENT AUTHORITY
AUDITED FINANCIAL STATEMENTS
Years Ended June 30, 2019 and 2018

CONTENTS
Page
INDEPENDENT AUDITOR’S REPORT................................................................................................ 1
MANAGEMENT’S DISCUSSION AND ANALYSIS - (UNAUDITED) ............................................. 3
COMBINED FINANCIAL STATEMENTS
Combined Statements of Net Position ............................................................................................... 7
Combined Statements of Revenues, Expenses, and Changes in Fund Net Position.......................... 8
Combined Statements of Cash Flows ................................................................................................ 9
Notes to Combined Financial Statements ........................................................................................ 11
REQUIRED SUPPLEMENTARY INFORMATION
Schedule of the Proportionate Share of the Net Pension Liability................................................... 53
Schedule of Contributions to the PERS ........................................................................................... 54
Schedule of the Proportionate Share of the Net OPEB Liability ..................................................... 55
Schedule of Contributions to the RHBT.......................................................................................... 56
Notes to Required Supplementary Information ............................................................................... 57
INDEPENDENT AUDITOR'S REPORT ON INTERNAL CONTROL OVER FINANCIAL REPORTING AND ON COMPLIANCE AND OTHER MATTERS BASED ON AN AUDIT OF FINANCIAL STATEMENTS
PERFORMED IN ACCORDANCE WITH GOVERNMENT AUDITING STANDARDS .................. 60

Your Success is Our Focus
300 Chase Tower, 707 Virginia Street, East • Charleston, WV 25301 • 304-343-4188 • Fax: 304-344-5035 • www.BEcpas.com
INDEPENDENT AUDITOR’S REPORT
To the Board of DirectorsWest Virginia Economic Development AuthorityCharleston, West Virginia
Report on the Combined Financial Statements
We have audited the accompanying combined financial statements of the West Virginia Economic Development Authority (the Authority), a component unit of the State of West Virginia, as of and for the years ended June 30, 2019 and 2018, and the related notes to the financial statements, which collectively comprise the Authority’s basic financial statements as listed in the table of contents.
Management’s Responsibility for the Combined Financial Statements
Management is responsible for the preparation and fair presentation of these combined financial statements in accordance with accounting principles generally accepted in the United States of America; this includes the design, implementation, and maintenance of internal control relevant to the preparation and fair presentation of financial statements that are free from material misstatement, whether due to fraud or error.
Auditor’s Responsibility
Our responsibility is to express an opinion on these combined financial statements based on our audits. We conducted our audits in accordance with auditing standards generally accepted in the United States of America and the standards applicable to financial audits contained in Government Auditing Standards, issued by the Comptroller General of the United States. Those standards require that we plan and perform the audit to obtain reasonable assurance about whether the combined financial statements are free from material misstatement.
An audit involves performing procedures to obtain audit evidence about the amounts and disclosures in the combined financial statements. The procedures selected depend on the auditor’s judgment, including the assessment of the risks of material misstatement of the combined financial statements, whether due to fraud or error. In making those risk assessments, the auditor considers internal control relevant to the entity’s preparation and fair presentation of the combined financial statements in order to design audit procedures that are appropriate in the circumstances, but not for the purpose of expressing an opinion on the effectiveness of the entity’s internal control. Accordingly, we express no such opinion. An audit also includes evaluating the appropriateness of accounting policies used and the reasonableness of significant accounting estimates made by management, as well as evaluating the overall presentation of the combined financial statements.
We believe that the audit evidence we have obtained is sufficient and appropriate to provide a basis for our audit opinion.

2
Opinion
In our opinion, the combined financial statements referred to above present fairly, in all material respects, the respective financial position of the West Virginia Economic Development Authority as of June 30, 2019 and 2018, and the respective changes in its financial position and its cash flows for the years then ended in accordance with accounting principles generally accepted in the United States of America.
Other Matters
Required Supplementary Information
Accounting principles generally accepted in the United States of America require that the management’s discussion and analysis on pages 3 through 6 and the schedule of the proportionate share of the net pension liability, the schedule of contributions to the PERS, the schedule of the proportionate share of the net OPEB liability, and the schedule of contributions to the RHBT on pages 53 through 59 be presented to supplement the basic financial statements. Such information, although not a part of the basic financial statements, is required by the Governmental Accounting Standards Board, who considers it to be an essential part of financial reporting for placing the basic financial statements in an appropriate operational, economic, or historical context. We have applied certain limited procedures to the required supplementary information in accordance with auditing standards generally accepted in the United States of America, which consisted of inquiries of management about the methods of preparing the information and comparing the information for consistency with management’s responses to our inquiries, the basic financial statements, and other knowledge we obtained during our audit of the basic financial statements. We do not express an opinion or provide any assurance on the information because the limited procedures do not provide us with sufficient evidence to express an opinion or provide any assurance.
Other Reporting Required by Government Auditing Standards
In accordance with Government Auditing Standards, we have also issued our report dated September 26, 2019, on our consideration of the Authority’s internal control over financial reporting and on our tests of its compliance with certain provisions of laws, regulations, contracts, and grant agreements and other matters. The purpose of that report is solely to describe the scope of our testing of internal control over financial reporting and compliance and the results of that testing, and not to provide an opinion on the effectiveness of the Authority’s internal control over financial reporting or on compliance. That report is an integral part of an audit performed in accordance with Government Auditing Standards in considering the Authority’s internal control over financial reporting and compliance.
CERTIFIED PUBLIC ACCOUNTANTS
Charleston, West VirginiaSeptember 26, 2019

WEST VIRGINIA ECONOMIC DEVELOPMENT AUTHORITY MANAGEMENT’S DISCUSSION AND ANALYSIS
(Unaudited)
3
This section will discuss the financial performance of the West Virginia Economic Development Authority (WVEDA) and its blended combined entities, West Virginia Enterprise Advancement Corporation (WVEAC) and West Virginia Enterprise Capital Fund (WVECF); collectively referred to as “the Authority.” The annual combined financial report presents our discussion and analysis of the Authority for fiscal years ended on June 30, 2019, 2018, and 2017. Please read it in conjunction with the Authority’s combined financial statements and accompanying notes.
FINANCIAL HIGHLIGHTS
• The Authority’s total net position increased approximately $5.22 million for the year endedJune 30, 2019 and $763 thousand net of the restatement for a change in accounting principleas of July 1, 2017, for the year ended June 30, 2018.
• Total assets increase by approximately $12.67 million for the year ended June 30, 2019 anddecreased by approximately $19.01 million for the year ended June 30, 2018.
• Total liabilities increased by approximately $7.27 million for the year ended June 30, 2019and decreased by approximately $21.01 million for the year ended June 30, 2018.
• Loan and lease originations for the year totaled approximately $20.02 million for the yearended June 30, 2019 and approximately $15.7 million for the year ended June 30, 2018.
OVERVIEW OF THE COMBINED FINANCIAL STATEMENTS
The annual combined financial statements consist of: Management’s Discussion and Analysis (this section), the combined financial statements and notes to combined financial statements, and other required supplementary information related to pensions and OPEB.
• The Authority’s combined financial statements provide information about the overall financialposition and results of operations. These statements, which are presented on the accrual basis,consist of Combined Statements of Net Position, Combined Statements of Revenues,Expenses, and Changes in Fund Net Position, and Combined Statements of Cash Flows.
• The basic combined financial statements also include “Notes to Combined FinancialStatements,” which provide explanations and additional information related to amountsreported in the combined financial statements.
The remainder of this overview section of management’s discussion and analysis explains the structure and content of each of the combined financial statements. The prior year results referred to throughout this section for comparison purposes are as previously reported.
The combined financial statements report information about the Authority’s use of accounting methods which are similar to those used by private sector companies. These combined financial statements are presented in a manner similar to a private business, such as real estate development, investment banking, commercial lending, construction management, and private consulting, subject to the provisions of generally accepted accounting principles followed by governments for special purpose governments engaged in business type activities.

WEST VIRGINIA ECONOMIC DEVELOPMENT AUTHORITY MANAGEMENT’S DISCUSSION AND ANALYSIS
(Unaudited)
(Continued) 4
FINANCIAL ANALYSIS OF THE AUTHORITY Combined Statements of Net Position: The following table summarizes the balances in the Combined Statements of Net Position as of June 30, 2019, 2018, and 2017.
% Change % Change2019 2018 2017 FY 19-18 FY 18-17
Current assets 96.51$ 83.27$ 79.53$ 15.90 4.70 Capital assets, net 23.37 24.40 30.54 (4.22) (20.10) Other noncurrent assets 173.19 172.73 190.24 0.27 (9.20) Total assets 293.07 280.40 300.31 4.52 (6.63)
Deferred outflows of resources 0.09 0.12 0.25 (0.25) (52.00)
Total assets and deferred outflows of resources 293.16$ 280.52$ 300.56$ 4.51 (6.67)
Current liabilities 14.18$ 13.80$ 19.85$ 2.75 (30.48) Noncurrent liabilities 112.29 105.40 120.36 6.54 (12.43) Total liabilities 126.47 119.20 140.21 6.10 (14.98)
Deferred inflows of resources 0.38 0.23 0.02 65.22 1,050.00
Total liabilities and deferred inflows of resources 126.85 119.43 140.23 6.21 (14.83)
Net position:Net investment in capital assets 22.82 23.19 27.62 (1.60) (16.04) Restricted 7.33 7.15 5.56 2.52 28.60 Unrestricted 136.16 130.75 127.15 4.14 2.83
Total net position 166.31 161.09 160.33 3.24 0.47
Total liabilities, deferred inflows of resources, and net position 293.16$ 280.52$ 300.56$ 4.51 (6.67)
(in millions)
The Authority’s overall net position increased by approximately $5.22 million for the year ended June 30, 2019. Net position increased $763 thousand which was a net of the change in net position of $1.43 million and a decrease related to a change in accounting principle of $667 thousand for the year ended June 30, 2018. Net position increased $3.16 million for the year ended 2017. Total assets increased by approximately $12.67 million for the year ended June 30, 2019, decreased by approximately $19.91 million for the year ending June 30, 2018 and increased approximately $3.83 million for the year ended June 30, 2017.

WEST VIRGINIA ECONOMIC DEVELOPMENT AUTHORITY MANAGEMENT’S DISCUSSION AND ANALYSIS
(Unaudited)
(Continued) 5
FINANCIAL ANALYSIS OF THE AUTHORITY (Continued) Combined Statements of Revenues, Expenses, and Changes in Fund Net Position: The following table summarizes the balances in the Combined Statements of Revenues, Expenses, and Changes in Fund Net Position for fiscal years 2019, 2018, and 2017.
% Change % Change
2019 2018 2017 FY 19-18 FY 18-17Operating revenues:
Interest on loans 4.82$ 5.19$ 3.95$ (7.13) 31.39 Lease revenues 4.52 4.69 4.74 (3.62) (1.05) Other revenues 0.16 0.23 0.69 (30.43) (66.67)
Total operating revenues 9.50 10.11 9.38 (6.03) 7.78
Operating expenses:Administrative 1.26 1.88 1.51 (32.98) 24.50 Depreciation 1.05 1.06 1.24 (0.94) (14.52) Provision for loan losses 1.47 0.97 0.16 51.55 506.25 Loss in equity investments 0.45 0.17 0.68 164.71 (75.00)
Total operating expenses 4.23 4.08 3.59 3.68 13.65
Operating income 5.27 6.03 5.79 (12.60) 4.15
Nonoperating revenues (expenses):Interest on invested cash 1.80 0.74 0.49 143.24 51.02 Interest expense (1.87) (1.15) (0.60) 62.61 91.67 Distributions of the State of WV - - (3.50) - (100.00) OPEB revenue 0.02 0.03 - (33.33) 100.00 Donation of land - 1.18 - (100.00) 100.00 Gain (loss) on sale of asset - (5.40) 0.98 (100.00) (651.02)
Total nonoperating revenues (expenses) (0.05) (4.60) (2.63) (98.91) 74.90
Change in net position 5.22 1.43 3.16 265.03 (54.75)
Net position, beginning of year 161.09 159.66 ** 157.17 0.90 1.58 Net position, end of year 166.31$ 161.09$ 160.33$ 3.24 0.47
** Restated by (.667) for implementation of GASB No. 75
(in millions)

WEST VIRGINIA ECONOMIC DEVELOPMENT AUTHORITY MANAGEMENT’S DISCUSSION AND ANALYSIS
(Unaudited)
6
FINANCIAL ANALYSIS OF THE AUTHORITY (Continued)
Within the Authority’s activities, the primary revenue sources are interest income on active loans and lease revenue. Nonoperating revenue includes interest income on invested cash. Total revenues exceeded total expenses by $5.22 million and $1.43 million for the years ending June 30, 2019, and 2018, respectively.
During 2019, the Authority had write-offs of uncollectible loans of $501,055, or 0.38% of the total loans. The allowance for loan loss is 5.78% of the total loan portfolio at June 30, 2019.
During 2018, the Authority had write-offs of uncollectible loans of $1,007,348, or 0.75% of the total loans. The allowance for loan loss is 4.93% of the total loan portfolio at June 30, 2018.
CAPITAL ASSET AND DEBT ADMINISTRATION
Capital Assets - The Authority independently, or in cooperation with private and/or other governmental entities, acquires, invests in, and/or develops vacant industrial sites, existing facilities, unimproved land, equipment, and other real estate for private or governmental use. Sites developed and equipment purchased for private use are marketed or leased to businesses that will create new job opportunities and tax ratables for the municipalities. Sites developed for governmental use are leased to the State or State entities. For the majority of these leases, future minimum lease rental payments are equal to the debt service payments related to the bonds or notes issued for the applicable property.
Debt - Total notes payable increased by approximately $7.44 million. This was primarily related to an increase in net borrowing on our revolving loan agreement with the West Virginia Board of Treasury Investments to finance loans and leases for economic development purposes. Net change was approximately $10.69 million. The offsetting decrease stemmed from other monthly repayments of approximately $1.00 million and debt forgiveness of approximately $2.25 million based on meeting performance standards defined in certain debt agreements.
Additional information regarding capital assets and debt can be found in the notes to combined financial statements.
CURRENTLY KNOWN FACTS AND CONDITIONS HAVING A SIGNIFICANT EFFECT ON FINANCIAL POSITION
There are currently no known facts and conditions recognized by management that would have a significant effect on the financial position of the Authority.
REQUESTS FOR INFORMATION
The combined financial report is designed to provide an overview of the finances of the Authority for those with an interest in this organization. Questions concerning any of the information provided in this report or requests for additional financial information should be addressed to the West Virginia Economic Development Authority at Northgate Business Park, 180 Association Drive, Charleston, West Virginia 25311.

2019 2018ASSETS AND DEFERRED OUTFLOWS OF RESOURCESCURRENT ASSETS Cash and cash equivalents (Note 2) 71,386,477$ 61,130,504$ Restricted cash due to others (Note 2) 297,377 297,377 Current portion of loans receivable, net of allowance (Note 6, 7 and 8) 14,909,427 12,559,294 Current portion of investment in direct financing leases (Note 9) 5,843,013 5,738,342 Accrued interest receivable 4,077,791 3,546,512 Total current assets 96,514,085 83,272,029
NONCURRENT ASSETS Investments (Note 3) 1,736,472 2,169,496 Restricted cash and cash equivalents (Note 2 and 5) 7,325,215 7,149,794 Loans receivable, less current portion (Note 6 and 8) 116,472,002 114,693,378 Investment in direct financing leases, less current portion (Note 9) 47,651,471 48,716,964 Real estate, property, and equipment, less accumulated depreciation (Note 9) 23,369,259 24,396,412
196,554,419 197,126,044
Total assets 293,068,504 280,398,073
DEFERRED OUTFLOWS OF RESOURCESDeferred outflows of resources related to pension amounts (Note 14) 68,770 97,415Deferred outflows of resources related to OPEB amounts (Note 15) 19,733 26,930
88,503 124,345
Total assets and deferred outflows of resources 293,157,007$ 280,522,418$
LIABILITIES, DEFERRED INFLOWS OF RESOURCES AND NET POSITIONCURRENT LIABILITIES Accounts payable 53,010$ 20,640$ Accrued interest payable 2,815,559 2,738,088 Amounts due to other State agencies (Note 11) 325,615 258,948 Current portion of compensated absences 21,216 31,484 Current portion of loans payable (Note 10) 10,966,410 10,747,916
Total current liabilities 14,181,810 13,797,076
NONCURRENT LIABILITIES Other noncurrent liabilities 281,780 281,780 Compensated absences, less current portion 17,600 35,386 Loans payable, less current portion (Note 10) 111,610,338 104,391,227 Net pension liability (Note 14) 118,736 196,216 Net OPEB liability (Note 15) 260,666 495,130
112,289,120 105,399,739
Total liabilities 126,470,930 119,196,815
DEFERRED INFLOWS OF RESOURCES
Deferred inflows of resources related to pension amounts (Note 14) 70,645 59,293
Deferred inflows of resources related to OPEB amounts (Note 15) 308,870 173,970
379,515 233,263
Net position: Net investment in capital assets 22,817,238 23,194,261 Restricted (Note 5) 7,325,215 7,149,794 Unrestricted 136,164,109 130,748,285 Total net position 166,306,562 161,092,340
Total liabilities, deferred inflows of resources and net position 293,157,007$ 280,522,418$
WEST VIRGINIA ECONOMIC DEVELOPMENT AUTHORITY
COMBINED STATEMENTS OF NET POSITIONJune 30, 2019 and 2018
The accompanying notes are an integral part of these financial statements. 7

The accompanying notes are an integral part of these financial statements. 8
2019 2018OPERATING REVENUES Interest on loans 4,821,446$ 5,194,892$ Lease revenue 4,519,593 4,687,585 Other 161,802 230,175
Total operating revenues 9,502,841 10,112,652
OPERATING EXPENSES Administrative 1,258,301 1,876,365 Depreciation 1,053,196 1,059,998 Provision for loan losses 1,467,040 972,157 Loss on equity investments (Note 3) 449,154 169,092 Total operating expenses 4,227,691 4,077,612
Operating income 5,275,150 6,035,040
NONOPERATING REVENUE (EXPENSE) Net, interest earnings on cash and investments 1,795,420 737,231 Interest expense (1,872,815) (1,146,962) On behalf OPEB contribution 16,467 31,220 Donation of land - 1,178,842 Net gain (loss) on disposal of real estate - (5,405,375)
Total nonoperating revenue (expense) (60,928) (4,605,044)
Change in net position 5,214,222 1,429,996
NET POSITION, beginning of year 161,092,340 159,662,344
NET POSITION, end of year 166,306,562$ 161,092,340$
WEST VIRGINIA ECONOMIC DEVELOPMENT AUTHORITY
COMBINED STATEMENTS OF REVENUES, EXPENSES,
Years ended June 30, 2019 and 2018AND CHANGES IN FUND NET POSITION
(Continued)9
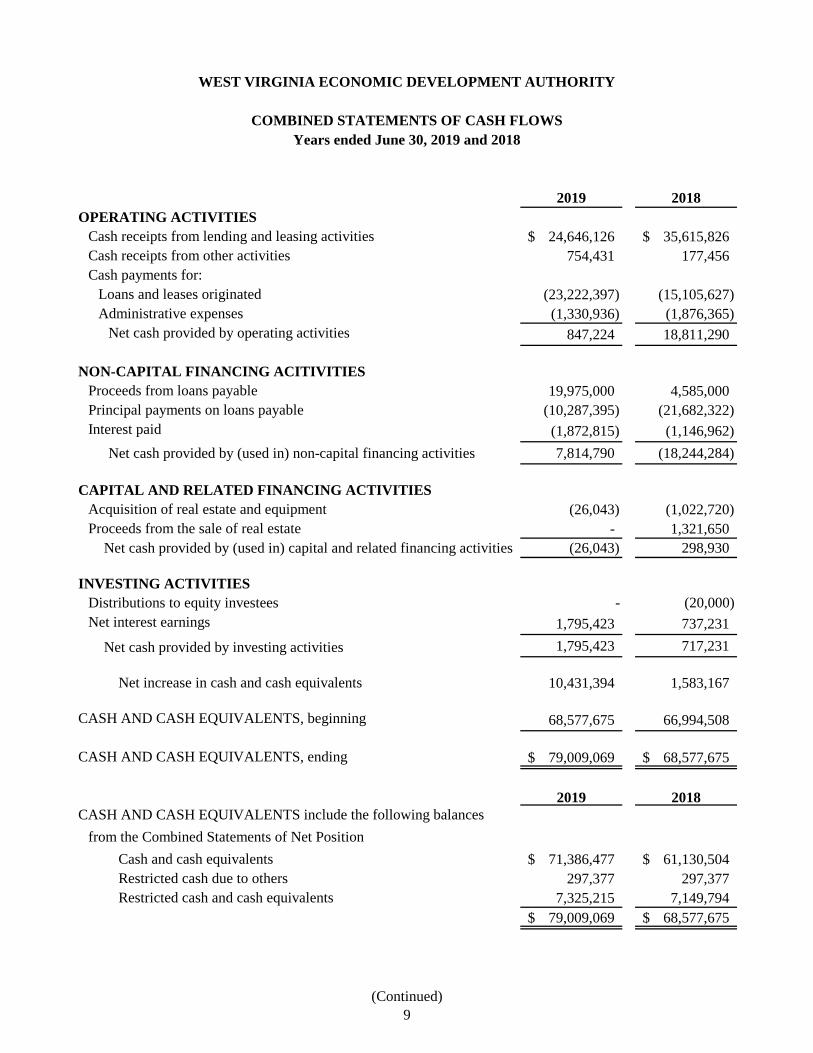
2019 2018OPERATING ACTIVITIES
Cash receipts from lending and leasing activities 24,646,126$ 35,615,826$ Cash receipts from other activities 754,431 177,456 Cash payments for:
Loans and leases originated (23,222,397) (15,105,627) Administrative expenses (1,330,936) (1,876,365)
Net cash provided by operating activities 847,224 18,811,290
NON-CAPITAL FINANCING ACITIVITIESProceeds from loans payable 19,975,000 4,585,000 Principal payments on loans payable (10,287,395) (21,682,322) Interest paid (1,872,815) (1,146,962)
Net cash provided by (used in) non-capital financing activities 7,814,790 (18,244,284)
CAPITAL AND RELATED FINANCING ACTIVITIESAcquisition of real estate and equipment (26,043) (1,022,720) Proceeds from the sale of real estate - 1,321,650
Net cash provided by (used in) capital and related financing activities (26,043) 298,930
INVESTING ACTIVITIESDistributions to equity investees - (20,000)Net interest earnings 1,795,423 737,231
Net cash provided by investing activities 1,795,423 717,231
Net increase in cash and cash equivalents 10,431,394 1,583,167
CASH AND CASH EQUIVALENTS, beginning 68,577,675 66,994,508
CASH AND CASH EQUIVALENTS, ending 79,009,069$ 68,577,675$
2019 2018CASH AND CASH EQUIVALENTS include the following balances
from the Combined Statements of Net PositionCash and cash equivalents 71,386,477$ 61,130,504$ Restricted cash due to others 297,377 297,377 Restricted cash and cash equivalents 7,325,215 7,149,794
79,009,069$ 68,577,675$
WEST VIRGINIA ECONOMIC DEVELOPMENT AUTHORITY
COMBINED STATEMENTS OF CASH FLOWSYears ended June 30, 2019 and 2018
The accompanying notes are an integral part of these financial statements. 10
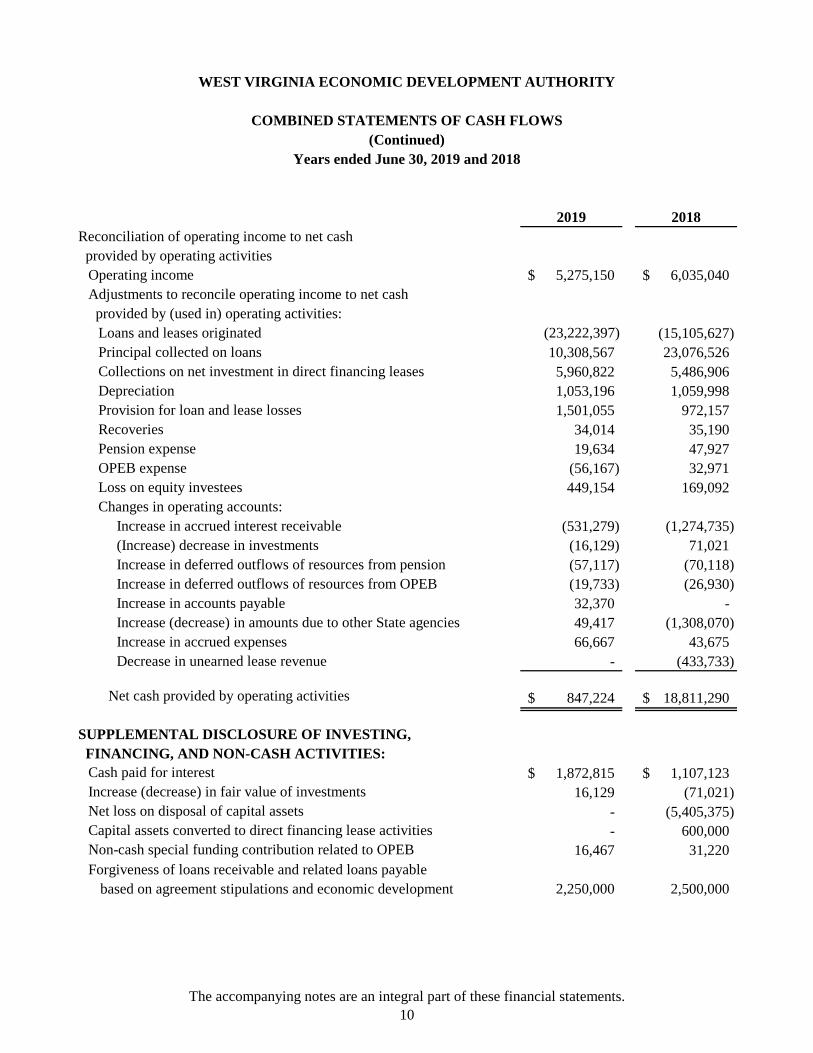
2019 2018Reconciliation of operating income to net cash provided by operating activities
Operating income 5,275,150$ 6,035,040$ Adjustments to reconcile operating income to net cash provided by (used in) operating activities:
Loans and leases originated (23,222,397) (15,105,627) Principal collected on loans 10,308,567 23,076,526 Collections on net investment in direct financing leases 5,960,822 5,486,906 Depreciation 1,053,196 1,059,998 Provision for loan and lease losses 1,501,055 972,157 Recoveries 34,014 35,190 Pension expense 19,634 47,927 OPEB expense (56,167) 32,971 Loss on equity investees 449,154 169,092 Changes in operating accounts: Increase in accrued interest receivable (531,279) (1,274,735) (Increase) decrease in investments (16,129) 71,021 Increase in deferred outflows of resources from pension (57,117) (70,118) Increase in deferred outflows of resources from OPEB (19,733) (26,930) Increase in accounts payable 32,370 - Increase (decrease) in amounts due to other State agencies 49,417 (1,308,070) Increase in accrued expenses 66,667 43,675 Decrease in unearned lease revenue - (433,733)
Net cash provided by operating activities 847,224$ 18,811,290$
SUPPLEMENTAL DISCLOSURE OF INVESTING, FINANCING, AND NON-CASH ACTIVITIES:
Cash paid for interest 1,872,815$ 1,107,123$ Increase (decrease) in fair value of investments 16,129 (71,021) Net loss on disposal of capital assets - (5,405,375) Capital assets converted to direct financing lease activities - 600,000 Non-cash special funding contribution related to OPEB 16,467 31,220 Forgiveness of loans receivable and related loans payable
based on agreement stipulations and economic development 2,250,000 2,500,000
(Continued)Years ended June 30, 2019 and 2018
WEST VIRGINIA ECONOMIC DEVELOPMENT AUTHORITY
COMBINED STATEMENTS OF CASH FLOWS

WEST VIRGINIA ECONOMIC DEVELOPMENT AUTHORITY
NOTES TO COMBINED FINANCIAL STATEMENTSJune 30, 2019
(Continued)11
Note 1. Description of Organization and Summary of Significant Accounting Policies
Description of entities
West Virginia Economic Development Authority (WVEDA)
The West Virginia Economic Development Authority (WVEDA) is a public corporation and government instrumentality under Chapter 31, Article 15, of the West Virginia Code (the Code). The WVEDA is administered by a nine member Board of Directors comprised of the Governor, Tax Commissioner, and seven at-large members appointed by the Governor. The WVEDA has statutory authority to borrow funds from the West Virginia Board of Treasury Investments to loan to borrowers.
Under the Code, the WVEDA is charged with the responsibility to develop and advance the business prosperity and economic welfare of the State of West Virginia by providing financial assistance in the form of loans and direct financing and operating leases to industrial development agencies and enterprises for the promotion and retention of new and existing commercial and industrial development. The WVEDA is empowered to borrow money and issue bonds, notes, commercial paper, and other debt instruments and to furnish money, credit, or credit enhancement for the promotion of business development projects. Credit enhancement is available through the WVEDA’s loan guarantee programs, which were created to ensure payment or repayment of bonds and notes issued by the WVEDA and certain other public bodies, or other types of debt instruments entered into by an enterprise or state public body with a financial institution.
The WVEDA’s loans are secured by deeds of trust on property, security interests in equipment, promissory notes, and, in certain cases, have supplemental collateral comprised of letters of credit, lease assignments, and/or personal guarantees. The WVEDA’s loan terms are set by its Board of Directors (the Board) whose members periodically review market conditions. The amount the WVEDA may lend for projects varies depending upon the nature of the project and form of lending, as prescribed by the Board.
In evaluating how to define the WVEDA for financial reporting purposes, management has considered all potential component units. The decision to include or exclude a potential component unit in the reporting entity is made by applying the criteria set forth in accounting principles generally accepted in the United States of America (GAAP) for governments. GAAP defines component units as those entities which are legally separate organizations for which the members of the board are financially accountable, or the organizations for which the nature and significance of their relationship with the WVEDA are such that exclusion would cause the WVEDA’s statements to be misleading. In accordance with GAAP, the WVEDA’s statements are prepared on a blended, or combined, basis and include the activities of the WVEDA, the West Virginia Enterprise Advancement Corporation, and the West Virginia Enterprise Capital Fund.

WEST VIRGINIA ECONOMIC DEVELOPMENT AUTHORITY
NOTES TO COMBINED FINANCIAL STATEMENTSJune 30, 2019
(Continued)12
Note 1. Description of Organization and Summary of Significant Accounting Policies (Continued)
Description of entities (Continued)
West Virginia Enterprise Advancement Corporation (WVEAC)
The WVEAC is a nonprofit organization created to advance the economic development and social welfare of the State of West Virginia and its people. Its objectives include the promotion and assistance of business growth and development to foster increased employment opportunities throughout the State of West Virginia through the promotion and development of accessible risk capital. To further these objectives, WVEAC has invested in and is the 100% owner of the West Virginia Enterprise Capital Fund. The WVEAC is exempt from federal income tax on its exempt purpose activities as an organization described in Section 501(c)(3) of the Internal Revenue Code.
West Virginia Enterprise Capital Fund, LLC (WVECF)
The WVECF was incorporated on September 24, 2001. The WVECF is in the business of making venture capital available to companies doing business in the State of West Virginia through investments in venture capital companies as provided under the West Virginia Venture Capital Act. The WVECF is managed by its sole member, the WVEAC.
The WVECF operates as a Limited Liability Company as permitted under West Viginia State Code. As such, the WVECF’s net income or loss is allocated to its sole member, a nonprofit organization, in accordance with the regulations of the Internal Revenue Service. Accordingly, no income tax provision has been included in these financial statements.
The WVEDA, WVEAC, and the WVECF are collectively referred to as the “Authority” in these financial statements.
Basis of presentation
The Authority is a component unit of the State of West Virginia, and is accounted for as a proprietary fund special purpose government engaged in business-type activities. In accordance with GAAP, the combined financial statements are prepared on the accrual basis of accounting with a flow of economic resources measurement focus, which requires recognition of revenue when earned and expenses when incurred.
The Authority is included in the State’s financial statements as a discretely presented component unit. Because of the Authority’s presentation in these financial statements as a special purpose government engaged in business-type activities, there may be differences in presentation of amounts reported in these financial statements and the financial statements of the State of West Virginia as a result of major fund determination.

WEST VIRGINIA ECONOMIC DEVELOPMENT AUTHORITY
NOTES TO COMBINED FINANCIAL STATEMENTSJune 30, 2019
(Continued)13
Note 1. Description of Organization and Summary of Significant Accounting Policies (Continued)
Use of estimates
Certain estimates and assumptions are required by management in the preparation of the financial statements in accordance with generally accepted accounting principles (GAAP). The significant estimates and assumptions that affect the reported amounts of assets and liabilities at the statement of net position dates and revenues and expenses for the years then ended are those required in the determination of the allowance for loan losses, accumulated depreciation of capitalized assets, and the valuation of investments in venture capital companies. Actual results in the near-term could differ from the estimates used to prepare these financial statements.
Cash and cash equivalents
Cash and cash equivalents include short-term investments with original maturities of 90 days or less. Cash and cash equivalents principally consist of amounts on deposit with the State Treasurer’s Office (STO) and those that are pooled funds managed by the West Virginia Board of Treasury Investments (BTI). Balances maintained in the West Virginia Money Market and West Virginia Government Money Market pools are recorded at amortized cost. Balances maintained in the West Virginia Short Term Bond Pool are recorded at fair value. Net investment income is allocated to participants in the pools based upon the funds that have been invested in each pool. The amounts on deposit are available for immediate withdrawal and, accordingly, are presented as cash and cash equivalents in the accompanying combined financial statements.
Investments
Venture Capital Investments
The WVECF invests in venture capital entities which are managed by various fund managers. The investments involve risks not normally associated with investing, including equity interests in development stage companies. The risks associated with these investments are affected by many factors, such as economic outlook, ability to raise capital, and ability to attract customers. Collateral values securing venture capital investments are not readily determinable.
Venture capital investments are not readily marketable, and, therefore, no quoted prices are available. The Fund manager has estimated the value of these investments after consideration of such factors as the cost of the investment, actual performance compared to expected performance, earnings potential, and other relevant factors. Because of uncertainties in the estimation process, estimated values may change in the near term, and those changes may be material.
Other Investments
Other investments include certain amounts held by the BTI for the Authority in a participant directed investment account which maintains a single U.S. Treasury Bond which matures August 15, 2023 and is recorded at fair value.

WEST VIRGINIA ECONOMIC DEVELOPMENT AUTHORITY
NOTES TO COMBINED FINANCIAL STATEMENTSJune 30, 2019
(Continued)14
Note 1. Description of Organization and Summary of Significant Accounting Policies (Continued)
Loans
The Authority extends commercial loans to customers. A substantial portion of the loan portfolio is represented by commercial loans throughout West Virginia. The ability of the Authority’s debtors to honor their contracts is dependent upon the operating results of the customers and the value of real and personal property held as collateral.
Loans are stated at unpaid principal balances, net of the allowance for loan losses.
Interest on loans is recognized over the term of the loan and is calculated using the simple interest method on principal amounts outstanding.
Allowance for loan and credit losses
The allowance for loan and credit losses consists of an allowance for loan losses on outstanding loansand certain credit financial instruments of the Authority.
The allowance for loan losses reflects management’s judgment of probable loan losses inherent in the portfolio at the statement of net position date. The Authority uses a process to establish the allowance for loan losses semi-annually. To determine the total allowance for loan losses, management estimates the reserves needed for each loan. The allowance for loan losses consists of amounts applicable to (1) commercial - real estate portfolio, (2) commercial - equipment, and (3) commercial-both real estate and equipment.
The establishment of the allowance for loan losses relies on a consistent process that requires layers of management review and significant judgment in determining the estimation method that fits the credit risk characteristics of each portfolio segment, including responses to changes in economic conditions, customer behavior, and collateral value, among other influences. From time to time, events or economic factors may affect the loan portfolio, causing management to provide additional amounts or to release balances from the allowance for loan losses. The Authority’s allowance for loan losses is sensitive to risk ratings assigned to individually evaluated loans and economic assumptions. Individual loan risk ratings are evaluated based on each specific situation by experienced staff.
Management monitors differences between estimated and actual incurred loan losses. This monitoring process includes periodic assessments by staff of loan portfolio performance. Additions to the allowance for loan losses are made by charges to the provision for loan losses. Credit exposures deemed to be uncollectible are charged against the allowance for loan losses. Recoveries of previously charged off amounts are credited to the allowance for loan losses.
Real estate and equipment held under lease
Real estate and equipment held under lease are carried at cost or, if contributed, at the market value of the property as of the date contributed. Depreciation on equipment and buildings is computed using the straight-line method with estimated useful lives of 5 to 40 years.

WEST VIRGINIA ECONOMIC DEVELOPMENT AUTHORITY
NOTES TO COMBINED FINANCIAL STATEMENTSJune 30, 2019
(Continued)15
Note 1. Description of Organization and Summary of Significant Accounting Policies (Continued)
Compensated absences
Employees fully vest in all earned but unused annual leave, and the Authority accrues for obligations that may arise in connection with compensated absences for vacation at the current rate of employee pay. The estimated obligation for such benefits, as they relate to employees of the Authority, are recorded as a liability in the accompanying combined financial statements.
Deferred outflows of resources / deferred inflows of resources
The statement of net position reports a separate financial statement element called deferred outflows of resources. This financial statement element represents a consumption of net position that applies to a future period and so will not be recognized as an outflow of resources (expense) until that time. The Authority reports certain pension and OPEB related amounts as deferred outflows of resources on the combined statements of net position.
The statement of net position reports a separate financial statement element called deferred inflows of resources. This financial statement element represents an acquisition of net position that applies to a future period and so will not be recognized as an inflow of resources (revenue) until that time. The Authority reports certain pension and OPEB related amounts as deferred inflows of resources on the combined statements of net position.
Unearned lease revenue
The Authority reports lease payments received in advance as unearned lease revenue and recognizeslease revenue over the remaining term of the lease.
Net position
The Authority displays net position in three components: net investment in capital assets, restricted, and unrestricted.
Net Investment in Capital Assets - This component of net position consists primarily of capital assets, including restricted capital assets (if any), net of accumulated depreciation and reduced by the outstanding balances of any bonds, mortgages, notes, or other borrowings that are attributable to the acquisition, construction, or improvement of those assets.
Restricted Net Position - Restricted net position consists of assets whose use or availability has been externally restricted, and the restrictions limit the Authority’s ability to use the resources to pay current liabilities. When both restricted and unrestricted resources are available for use, it is the Authority’s policy to use restricted resources first, then unrestricted resources as needed.
Unrestricted Net Position - Unrestricted net position consists of net position that does not meet the definition of “restricted” or “net investment in capital assets.” In the governmental environment, net position is often designated to indicate that management does not consider it to be available for general operations. These types of constraints on resources are internal, and management can remove or modify them. Such internal designations are not reported on the face of the statement of net position.

WEST VIRGINIA ECONOMIC DEVELOPMENT AUTHORITY
NOTES TO COMBINED FINANCIAL STATEMENTSJune 30, 2019
(Continued)16
Note 1. Description of Organization and Summary of Significant Accounting Policies (Continued)
Operating revenues and expenses
Operating revenues and expenses are those that result from providing services and producing and delivering goods and/or services. It also includes all revenue and expenses not related to capital and related financing, non-capital financing, or investing activities.
Nonoperating revenues and expenses
Nonoperating revenues and expenses include activities that do not have the characteristics of operating revenues and expenses, such as contributions, investment income, other revenues, and interest expense that are defined as nonoperating by GAAP.
Pension
For purposes of measuring the net pension liability, deferred outflows of resources and deferred inflows of resources related to pensions, and pension expense, information about the fiduciary net position of the West Virginia Public Employees Retirement System (PERS) and additions to/deductions from PERS fiduciary net position have been determined on the same basis as they are reported by PERS. For this purpose, benefit payments (including refunds of employee contributions) are recognized when due and payable in accordance with the benefit terms. Investments of the PERS are reported at fair value.
Postemployment benefits other than pensions (OPEB)
For purposes of measuring the net OPEB liability, deferred outflows of resources and deferred inflows of resources related to OPEB, and OPEB expense, information about the fiduciary net position of the RHBT and additions to/deductions from RHBT's fiduciary net position have been determined on the same basis as they are reported by The West Virginia Retiree Health Benefit Trust Fund (RHBT). For this purpose, RHBT recognizes benefit payments when due and payable in accordance with the benefit terms. Investments are reported at fair value, except for certain pooled investments, money market investments and participating interest-earning investment contracts that have a maturity at the time of purchase of one year or less, which are reported at amortized cost.
Loan insurance program
The Authority extends non-exchange financial guarantees under its Loan Insurance Program. This program administered by the Authority, provides up to a 90% guarantee of actual loss from a bank to its borrower. The maximum liability to the Authority may not exceed $500,000 per transaction. The Authority is required to recognize a liability when qualitative, historical and other factors indicate that it is more likely than not that the Authority will be required to make a payment on the financial guarantee, including the evaluation of whether the participating bank has liquidated all collateral of the borrower, including the pursuit of personal guarantees.
Broadband loan insurance program
House Bill 3093 enacted by the West Virginia Legislature on April 8, 2017 and effective as of July 7, 2017 provided that the BTI would provide up to $50,000,000 to the Authority to provide loan insurance for debt instruments to expand broadband within West Virginia subject to the requirements set forth in the legislation.

WEST VIRGINIA ECONOMIC DEVELOPMENT AUTHORITY
NOTES TO COMBINED FINANCIAL STATEMENTSJune 30, 2019
(Continued)17
Note 2. Cash and Cash Equivalents
At June 30, 2019 and 2018, the carrying amount of deposits with financial institutions, the STO, and the BTI were as follows:
2019 2018Deposits:
WV Money Market Pool at BTI $ 43,015,322 $ 30,199,634WV Government Money Market Pool at BTI 7,625,215 7,449,794WV Short Term Bond Pool at BTI 18,332,309 17,539,126Cash held at State Treasurer’s Office 9,710,212 13,069,131Cash held at outside financial institutions 326,011 319,990
$ 79,009,069 $ 68,577,675
The State Treasurer has statutory responsibility for the daily cash management activities of the State’s agencies, departments, boards and commissions and transfers funds to the BTI for investment in accordance with West Virginia statutes, policies set by the BTI and by provisions of bond indentures and trust agreements when applicable and thus the Authority follows these investment policies.
In accordance with West Virginia Code §31-15-23, the economic development fund, to which shall be credited any appropriation made by the Legislature to the authority, any funds which the authority is authorized to receive under any provision of this code, other funds which the board directs to be deposited into the fund, and such other deposits as are provided for in this section, is hereby continued in the state treasury as a special account. Whenever the Authority determines that the balance in the fund is in excess of the immediate requirements for loans, it may request that such excess be invested until needed for loan purposes, in which case such excess shall be invested in a manner consistent with the investment of other temporary state funds. If the Authority determines that funds held in the fund are in excess of the amount needed to carry out the purposes of this article, it may take such action as is necessary to release such excess and transfer it to the general fund of the treasury.
Credit risk
Credit risk is the risk that an issuer or other counterparty to an investment will not fulfill its obligations. Two of the BTI pools, the WV Money Market and WV Government Money Market Pools, have been rated AAAm by Standard & Poor’s. A fund rated AAAm has extremely strong capacity to maintain principal stability and to limit exposure to principal losses due to credit, market, and/or liquidity risks. AAAm is the highest principal stability fund rating assigned by Standard & Poor’s. Neither the BTI itself nor any other of the BTI pools or accounts has been rated for credit risk by any organization.
The BTI limits the exposure to credit risk in the WV Money Market Pool by requiring all corporate debt to be rated A+ or higher by Standard & Poor’s (or its equivalent). Commercial paper must be rated at least A-1 by Standard & Poor’s and P-1 by Moody’s. The pool must have at least 15% of its assets in U.S. Treasury obligations or obligations guaranteed as to repayment of interest and principal by the United States of America.

WEST VIRGINIA ECONOMIC DEVELOPMENT AUTHORITY
NOTES TO COMBINED FINANCIAL STATEMENTSJune 30, 2019
(Continued)18
Note 2. Cash and Cash Equivalents (Continued)
Credit risk (Continued)
At June 30, 2019 and 2018, the WV Money Market Pool investments had a total carrying value of $3,956,476,000 and $3,264,060,000, respectively, of which the Authority’s ownership represents 1.09% and .92%, respectively. The following table provides information on the credit ratings of the WV Money Market pool’s investments (in thousands):
2019 2018
Credit Rating
Carrying Percent of Carrying Percent of
Security Type Moody's S&P Value Pool Assets Value Pool Assets
U.S. Treasury notes * Aaa AA+ 24,927$ 0.63 % 90,330$ 2.77 %
U.S. Treasury bills * P-1 A-1+ 329,390 8.33 252,084 7.72
Commercial paper P-1 A-1+ 733,411 18.54 473,172 14.50
P-1 A-1 1,494,297 37.77 1,351,128 41.39
P-2 A-1 8,490 0.21 44,600 1.37
Corporate bonds and notes P-1 A-1 - - 18,078 0.55
Negotiable certificates
of deposit P-1 A-1+ 179,251 4.53 205,501 6.30
P-1 A-1 534,891 13.52 458,300 14.04
Money market funds Aaa AAAm 178,619 4.51 143,067 4.38
Repurchase agreements
(underlying securities):
U.S. Treasury notes * Aaa AA+ 426,000 10.77 227,800 6.98
U.S. agency bonds and notes Aaa AA+ 47,200 1.19 - -
3,956,476$ 100.00 % 3,264,060$ 100.00 %
* U.S. Treasury issues are explicitly guaranteed by the United States government and are not considered to have credit risk.
The BTI limits the exposure to credit risk in the WV Government Money Market Pool by limiting the pool to U.S. Treasury issues, U.S. government agency issues, money market funds investing in U.S. Treasury issues and U.S. government agency issues, and repurchase agreements collateralized by U.S. Treasury issues and U.S. government agency issues. The pool must have at least 15% of its assets in U.S. Treasury obligations or obligations guaranteed as to repayment of interest and principal by the United States of America.

WEST VIRGINIA ECONOMIC DEVELOPMENT AUTHORITY
NOTES TO COMBINED FINANCIAL STATEMENTSJune 30, 2019
(Continued)19
Note 2. Cash and Cash Equivalents (Continued)
Credit risk (Continued)
At June 30, 2019 and 2018, the WV Government Money Market Pool investments had a total carrying value of $252,144,000 and $212,304,000, respectively, of which the Authority’s ownership represents 3.02% and 3.51%, respectively. The following table provides information on the credit ratings of the WV Government Money Market pool investments (in thousands):
2019 2018
Credit Rating
Carrying Percent of Carrying Percent of
Security Type Moody's S&P Value Pool Assets Value Pool Assets
U.S. agency bonds and notes Aaa AA+ 30,975$ 12.28 % 52,300$ 24.63 %
U.S. Treasury notes * Aaa AA+ - - 10,973 5.17
U.S. Treasury bills * P-1 A-1+ 57,785 22.93 23,950 11.28
U.S. agency discount notes P-1 A-1+ 110,373 43.77 76,734 36.14
Money market funds Aaa AAAm 111 0.04 247 0.12
Repurchase agreements (underlying securities)
U.S. Treasury notes * Aaa AA+ - - 41,614 19.60
U.S. agency bond and notes Aaa AA+ 52,900 20.98 6,486 3.06
252,144$ 100.00 % 212,304$ 100.00 %
* U.S. Treasury issues are explicitly guaranteed by the United States government and are not considered to have credit risk.
The BTI limits the exposure to credit risk in the WV Short Term Bond Pool by requiring all long term corporate debt to be rated BBB- or higher by Standard & Poor’s (or its equivalent) and all short-term corporate debt to be rated A-1 or higher by Standard & Poor’s (or its equivalent). Mortgage-backed and asset-backed securities must be rated AAA by Standard & Poor’s (or its equivalent). The pool must have at least 15% of its assets in U.S. Treasury obligations or obligations guaranteed as to repayment of interest and principal by the United States of America.
At June 30, 2019 and 2018, the WV Short Term Bond Pool investments had a total carrying value of $731,969,000 and $712,582,000, respectively, of which the Authority’s ownership represents 2.50% and 2.47%, respectively. The following table provides information on the credit ratings of the WV Short Term Bond Pool’s investments (in thousands):

WEST VIRGINIA ECONOMIC DEVELOPMENT AUTHORITY
NOTES TO COMBINED FINANCIAL STATEMENTSJune 30, 2019
(Continued)20
Note 2. Cash and Cash Equivalents (Continued)
Credit Risk (Continued)Credit Rating 2019 2018
Carrying Percent of Carrying Percent of
Security Type Moody's S&P Value Pool Assets Value Pool Assets
U.S. Treasury notes * Aaa AA+ 115,292$ 15.75 % 86,189$ 12.10 %
U.S. agency NR BBB- - - 1,953 0.28
mortgage backed securities * Aaa AA+ - - 32,546 4.57
U.S. agency collateralized mortgage obligations
U.S government guaranteed * Aaa AA+ 26,472 3.62 - -
Non-U.S. government guaranteed Aaa AA+ 23,674 3.23 - -
Corporate fixed-and floating-rate bonds and notes Aaa AAA - - 2,878 0.40
Aaa AA+ 2,147 0.30 - -
Aa1 AA+ - - 5,012 0.70
Aa2 AA+ 5,024 0.69 3,990 0.56
Aa2 AA 5,577 0.76 - 0.00
Aa2 AA- - - 7,094 1.00
Aa2 A+ 8,566 1.17 9,940 1.39
Aa2 NR 2,784 0.38 - -
Aa3 AA+ 5,042 0.69 - -
Aa3 AA- 16,616 2.27 13,999 1.96
Aa3 A+ 13,139 1.80 5,084 0.71
Aa3 A 2,765 0.38 - -
A1 AA- 18,323 2.50 11,813 1.66
A1 A+ 15,880 2.17 10,595 1.49
A1 A 7,426 1.01 6,306 0.88
A1 A- 8,612 1.18 3,273 0.46
A1 NR 5,223 0.71 - -
A2 A+ - - 5,968 0.84
A2 A 19,418 2.65 27,673 3.89
A2 A- 24,214 3.31 11,531 1.62
A3 A+ 8,592 1.17 - -
A3 A 13,148 1.80 8,974 1.26
A3 A- 35,050 4.79 29,872 4.19
A3 BBB+ 30,732 4.20 27,112 3.80
Baa1 A - - 2,828 0.40
Baa1 A- 6,889 0.94 8,922 1.25
Baa1 BBB+ 14,806 2.02 28,242 3.96
Baa1 BBB 5,213 0.71 13,078 1.84
Baa2 A- 6,143 0.84 1,016 0.14
Baa2 BBB+ 14,524 1.98 8,353 1.17
Baa2 BBB 37,277 5.09 30,250 4.25
Baa2 BBB- 6,369 0.87 2,946 0.41
Baa2 NR - - 2,135 0.30
Baa3 BBB+ 1,091 0.15 3,003 0.42
Baa3 BBB 9,193 1.26 8,548 1.20
Baa3 BBB- 36,044 4.92 12,378 1.74
Ba1 A- - - 350 0.05
Ba1 BBB 2,013 0.28 2,007 0.28
Ba1 BBB- 4,214 0.58 6,219 0.87
NR A 8,761 1.20 - -
NR BBB+ 2,658 0.36 2,572 0.36
Collateralized mortgage obligations Aaa AAA - - 14,773 2.07
Aaa NR - - 3,308 0.46
NR AAA 5,958 0.81 - -
Commercial mortgage-backed securities Aaa NR 377 0.05 3,014 0.42
Asset-backed securities Aaa AAA 45,739 6.25 87,146 12.23
Aaa NR 75,441 10.31 88,599 12.44
NR AAA 35,020 4.78 66,039 9.27
Money market funds Aaa AAAm 523 0.07 5,054 0.71
731,969$ 100.00 % 712,582$ 100.00 %
NR = Not Rated
* U.S. Treasury issues and certain U.S. agency collaterized mortgage obligations are explicitly guaranteed by the
United States government and are not considered to have credit risk.

WEST VIRGINIA ECONOMIC DEVELOPMENT AUTHORITY
NOTES TO COMBINED FINANCIAL STATEMENTSJune 30, 2019
(Continued)21
Note 2. Cash and Cash Equivalents (Continued)
Interest rate risk
Interest rate risk is the risk that changes in interest rates will adversely affect the fair value of an investment.
The overall weighted average maturity of the investments of the WV Money Market Pool cannot exceed 60 days. Maximum maturity of individual securities cannot exceed 397 days from date of purchase, except for government floating rate notes, which can be up to 762 days. The following table provides information on the weighted average maturities for the various asset types in the WV Money Market Pool at June 30, 2019 and 2018:
2019 2018Carrying Value WAM Carrying Value WAM
Security Types (In Thousands) (Days) (In Thousands) (Days)
Repurchase agreements $ 473,200 3 $ 227,800 3 U.S. Treasury notes 24,927 125 90,330 73 U.S. Treasury bills 329,390 34 252,084 69 Commercial paper 2,236,198 57 1,868,900 36 Negotiable certificates of deposit 714,142 33 663,801 29 Corporate bonds and notes - - 18,078 21 Money market funds 178,619 3 143,067 3
$ 3,956,476 42 $ 3,264,060 34
The overall weighted average maturity of the investments of the WV Government Money Market Pool cannot exceed 60 days. Maximum maturity of individual securities cannot exceed 397 days from date of purchase, except for government floating rate notes, which can be up to 762 days. The following table provides information on the weighted average maturities for the various asset types in the WV Government Money Market Pool:
2019 2018Carrying Value WAM Carrying Value WAM
Security Types (In Thousands) (Days) (In Thousands) (Days)
Repurchase agreements $ 52,900 3 $ 48,100 3 U.S. Treasury notes - - 10,973 76 U.S. Treasury bills 57,785 65 23,950 43 U.S. agency discount notes 110,373 35 76,734 20 U.S. agency bonds and notes 30,975 75 52,300 17 Money market funds 111 3 247 3
$ 252,144 40 $ 212,304 21

WEST VIRGINIA ECONOMIC DEVELOPMENT AUTHORITY
NOTES TO COMBINED FINANCIAL STATEMENTSJune 30, 2019
(Continued)22
Note 2. Cash and Cash Equivalents (Continued)
Interest Rate Risk (Continued)
The overall effective duration of the investments of the WV Short Term Bond Pool is limited to a +/-20 percent band around the effective duration of the portfolio’s benchmark (the ICE BofAML 1-3 US Corporate & Government Index). As of June 30, 2019, the effective duration of the benchmark was 657 days. Maximum effective duration of individual securities cannot exceed 1,827 days (five years) from date of purchase. The following table provides information on the effective duration for the various asset types in the WV Short Term Bond Pool:
2019 2018Effective Effective
Carrying Value Duration Carrying Value Duration Security Types (In Thousands) (Days) (In Thousands) (Days)
Corporate floating-rate bonds and notes $ 38,121 286 $ 147,817 44 Corporate fixed-rate bonds
and notes 365,352 847 178,097 696 Commercial paper - - 18,081 106 U.S. Treasury notes and bonds 115,292 816 86,189 472 U.S. agency collateralized mortgage obligations 50,146 976 32,546 56 Commercial mortgage-backed securities 377 15 - - Collateralized mortgage obligations 5,958 752 3,014 52 Asset-backed securities 156,200 393 241,784 374 Money market funds 523 1 5,054 1
$ 731,969 723 $ 712,582 372
Other risks of investing
Other risks of investing can include concentration of credit risk, custodial credit risk, and foreign currency risk.
Concentration of credit risk is the risk of loss attributed to the magnitude of a pool or account’sinvestment in a single corporate issuer. The BTI investment policy prohibits those pools and accountspermitted to hold corporate securities from investing more than 5% of their assets in any one corporate name or one corporate issue.
The custodial credit risk for investments is the risk that, in the event of the failure of the counterparty to a transaction, the BTI will not be able to recover the value of investment or collateral securities that are in the possession of an outside party. Repurchase agreements are required to be collateralized by at least 102% of their value, and the collateral is held in the name of the BTI. The BTI or its agent does not release cash or securities until the counterparty delivers its side of the transaction.

WEST VIRGINIA ECONOMIC DEVELOPMENT AUTHORITY
NOTES TO COMBINED FINANCIAL STATEMENTSJune 30, 2019
(Continued)23
Note 2. Cash and Cash Equivalents (Continued)
Other risks of investing (Continued)
Foreign currency risk is the risk that changes in exchange rates will adversely affect the fair value of an investment or a deposit. None of the BTI investment pools or accounts hold interests in foreign currency or interests valued in foreign currency.
Cash held in outside financial institutions
Limited cash and cash equivalents are held outside of the STO and the BTI and consist of demand deposits maintained with high credit quality financial institutions. At times, the balances with the institutions may exceed amounts covered by FDIC insurance limit; however, management believes that the financial institutions are credit worthy.
Note 3. Investments2019 2018
Investments:WVEDA - American Woodmark at BTI $ 1,736,472 $ 1,720,343Investments in Venture Capital Companies - 449,153
Total $ 1,736,472 $ 2,169,496
WV Economic Development Authority - American Woodmark
This account holds a U.S. Treasury bond that matures on August 15, 2023. The Authority’s Board of Directors approved this investment by resolution dated March 18, 2006. This security is not exposed to credit risk, custodial credit risk, concentration of credit risk, or foreign currency risk.
Investments in venture capital companies
A portion of the Authority’s investment portfolio is comprised of various equity investments in venture capital companies. The investments described below involve risks not normally associated with investing, including interests in development stage companies. The risks associated with these investments are dependent on many factors, such as economic outlook, ability to raise capital, and building a customer base. Collateral values securing the venture capital investments are not readily determinable. The Authority informed all remaining investees during the year end June 30, 2019, that they would not fund any future capital calls. The Authority has committed and funded amounts in exchange for ownership interests in venture capital companies at June 30 as follows:
Fair Total Total Unfunded2019 Value Funded Commitment
Innova (WV High Tech Consortium, LP) $ - $ 734,620 $ -Mountaineer Capital, LP - 3,800,000 -Novitas, LP - 3,950,000 -
Total $ - $ 8,484,620 $ -

WEST VIRGINIA ECONOMIC DEVELOPMENT AUTHORITY
NOTES TO COMBINED FINANCIAL STATEMENTSJune 30, 2019
24
Note 3. Investments (Continued)
Investments in venture capital companies (Continued)
Fair Total Total Unfunded2018 Value Funded Commitment
Innova (WV High Tech Consortium, LP) $ 386,595 $ 734,620 $ 15,380Mountaineer Capital, LP 53,675 3,800,000 200,000Novitas, LP 8,883 3,950,000 50,000
Total $ 449,153 $ 8,484,620 $ 265,380
When the Authority’s basis in the venture capital investments reaches zero, the Authority ceases reporting losses unless the Authority has guarantees of debt or future funding commitments.
Fund managers of the venture capital companies recommend individual investments based on predetermined selection criteria. These investments vary widely from start-up companies to operating businesses. Individual fund managers determine investment goals for their venture capital companies. To meet the unfunded commitments, the Authority has its investment securities available.
The following is a summary of remaining venture capital investments:
Innova, LP is developing investment strategies and investigating potential investments.
Mountaineer Capital, LP’s investment portfolio consists of technology transfer, information technology, and software development.
Novitas, LP has investments in healthcare, communications, and information technology.
The following is a reconciliation of the beginning and ending carrying balances for venture capital company investments using the Authority’s assumptions during the years ended June 30, 2019 and 2018.
Balance, July 1, 2017 $ 598,246Total net unrealized/realized losses included in earnings (169,092)Purchases, issuances, and settlements 20,000
Balance, June 30, 2018 449,154
Total net unrealized/realized losses included in earnings (449,154)Purchases, issuances, and settlements -
Balance, June 30, 2019 $ -

WEST VIRGINIA ECONOMIC DEVELOPMENT AUTHORITY
NOTES TO COMBINED FINANCIAL STATEMENTSJune 30, 2019
25
Note 4. Fair Value
Fair value is defined as the price that would be received to sell an asset or paid to transfer a liability in an orderly transaction between market participants at the measurement date, an exit price. Fair value is a market-based measurement, not an enitity-specific measurement. The Authority categorizes fair value measurements within the fair value hierarchy established by accounting principles generally accepted in the United States of America.
The fair value heirarchy established under GAAP categorizes the inputs to valuation techiniques used to measure fair value into three levels as follows:
Level 1 inputs - Quoted prices (unadjusted) for identical assets or liablities in active markets that a government can access at the measurement date.
Level 2 inputs - Inputs - other than quoted prices included within Level 1 - that are observable for an asset or liablity, either directly or indirectly.
Level 3 - Unobservable inputs for an asset or liability.
The fair value hierarchy gives the highest priority to Level 1 inputs and the lowest priority to Level 3 inputs. The recurring fair value measurements of the investments of the Authority as of June 30, 2019and 2018 were as follows (there were no Level 2 or Level 3 investments):
Level 1Quoted Price in Active Market
2019 2018
U.S. Treasury Bond $ 1,736,472 $ 1,720,343
Note 5. Restricted Net Position
The West Virginia Legislature enacted legislation creating and funding a program to enhance the availability of loans from commercial lending institutions for economic development purposes. Cash balances relating to this program are invested in the BTI’s amortized cost investment pools and have been set aside, together with interest earnings thereon, to meet these objectives by serving to guarantee portions of certain loans made for economic development purposes. See Note 12 to the financial statements for further disclosure of the guarantee program.
The West Virginia Legislature enacted legislation creating and funding a program to make available insurance on qualifying debt instruments for the purpose of the deployment of broadband in West Virginia, subject to certain legislative restrictions. Cash balances relating to this program are invested in the BTI’s amortized cost investment pools and have been set aside, together with interest earnings thereon, to meet these objectives by serving this restrictive purpose. The restricted net position balancesfor these two programs amounted to $7,325,215 and $7,149,794 at June 30, 2019 and 2018, respectively.

WEST VIRGINIA ECONOMIC DEVELOPMENT AUTHORITY
NOTES TO COMBINED FINANCIAL STATEMENTSJune 30, 2019
(Continued)26
Note 6. Loans
Loans by class are summarized as follows:
2019 2018Commercial: Real estate $ 40,901,658 $ 40,546,364 Real estate and equipment 9,685,828 10,548,451 Equipment 8,831,075 9,181,809Service: Real estate 24,916,126 18,711,122 Real estate and equipment 3,931,890 3,155,886 Equipment 162,205 177,250Industrial: Real estate 24,841,552 24,274,980 Real estate and equipment 11,823,602 10,612,865 Equipment 13,887,493 16,643,945Total loans 138,981,429 133,852,672 Less allowance for loan loss (7,600,000) (6,600,000) Loans receivable net of allowance 131,381,429 127,252,672Less current portion (14,909,427) (12,559,294)
Noncurrent loans receivable $ 116,472,002 $ 114,693,378
The Authority’s loans have been extended to customers operating in West Virginia.
Commercial loans may be collateralized by the assets underlying the borrower’s business such as equipment, inventory, or real property. Commercial real estate loans are generally secured by the underlying real property. The ultimate collectability of a substantial portion of the Authority’s loan portfolio is susceptible to changes in the local market conditions.
Note 7. Loan Credit Quality
Management monitors the credit quality of loans on an ongoing basis. Measurement of delinquency and past due status are based on the contractual terms of each loan.
For all loan classes, past due loans are reviewed on a monthly basis to identify loans for nonaccrual status. Generally, when full collection of the principal and interest is jeopardized, the loan is placed on nonaccrual. The accrual of interest income generally is discontinued when a loan becomes 90 days or more past due as to principal or interest. However, regardless of the delinquency status, if a loan is fully secured or in the process of collection and resolution of collection is expected in the near term (generally less than 90 days), then the loan may not be placed on nonaccrual. When interest accruals are discontinued, unpaid interest recognized in income in the current year is reversed, and unpaid interest accrued in prior years is charged to the allowance for loan losses. The Authority’s method of income recognition for loans that are classified as nonaccrual is to recognize interest income on a cash basis or to apply the cash receipt to principal when the ultimate collectability of the principal is in doubt. Management may elect to continue the accrual of interest when the estimated net realized value of collateral exceeds the principal balance and accrued interest, and the loan is in the process of collection.

WEST VIRGINIA ECONOMIC DEVELOPMENT AUTHORITY
NOTES TO COMBINED FINANCIAL STATEMENTSJune 30, 2019
(Continued)27
Note 7. Loan Credit Quality (Continued)
Nonaccrual loans will not normally be returned to accrual status unless all past due principal and interest have been paid.
The following table sets forth the Authority’s age analysis of its past due loans, segregated by class of loans:
90 Days 90 Days30-59 Days 60-89 Days or More Total Total Loans or MorePast Due Past Due Past Due Past Due Current Receivable and Accruing
As of June 30, 2019:
Secured by real estate:Commercial $ - $ - $ 171,673 $ 171,673 $40,729,985 $40,901,658 $ 171,673Service - - 17,553,230 17,553,230 7,362,896 24,916,126 11,566,699Industrial - - 1,794,864 1,794,864 23,046,688 24,841,552 -
Secured by equipment:Commercial 43,921 - - 43,921 8,787,154 8,831,075 -Service - - - - 162,205 162,205 -Industrial - - 296,244 296,244 13,591,249 13,887,493 296,244
Secured by real estate &equipment:Commercial - - - - 9,685,828 9,685,828 -Service - - - - 3,931,890 3,931,890 -Industrial - - 473,537 473,537 11,350,065 11,823,602 473,537
Total loans $ 43,921 $ - $20,289,548 $20,333,469 $118,647,960 $138,981,429 $12,508,153
90 Days 90 Days30-59 Days 60-89 Days or More Total Total Loans or MorePast Due Past Due Past Due Past Due Current Receivable and Accruing
As of June 30, 2018:
Secured by real estate:Commercial $ - $ - $ 171,673 $ 171,673 $40,374,691 $ 40,546,364 $ 171,673Service - - 6,181,783 6,181,783 12,529,339 18,711,122 -Industrial - - 1,893,064 1,893,064 22,381,916 24,274,980 -
Secured by equipment:Commercial - 52,130 - 52,130 9,129,678 9,181,808 -Service - - - - 177,250 177,250Industrial - - - - 16,643,945 16,643,945 -
Secured by real estate &equipment:Commercial - - 501,055 501,055 10,047,396 10,548,451 -Service - - - - 3,155,886 3,155,886 -Industrial - 445,340 194,257 639,597 9,973,268 10,612,865 194,257
Total loans $ - $ 497,470 $ 8,941,832 $ 9,439,302 $124,413,369 $133,852,672 $ 365,930

WEST VIRGINIA ECONOMIC DEVELOPMENT AUTHORITY
NOTES TO COMBINED FINANCIAL STATEMENTSJune 30, 2019
(Continued)28
Note 7. Loan Credit Quality (Continued)
The Authority generally places loans on nonaccrual status when the full and timely collection of interest or principal becomes uncertain, part of the principal balance has been charged off and no restructuring has occurred, or the loans reach a certain number of days past due. The following table sets forth the Authority’s nonaccrual loans, segregated by class of loans (as applicable) as of:
June 30, 2019 June 30, 2018Secured by real estate:
Commercial $ 1,447,550 $ -Service 5,986,532 6,181,783Industrial 1,794,864 1,893,064
Secured by real estate and equipment:Commercial - 501,055
Total $ 9,228,946 $ 8,575,902
The Authority assigns credit quality indicators of pass, special mention, substandard, and doubtful to its loans. The loans are internally assigned a grade based on a combination of the known creditworthiness of the borrower and on the loan’s delinquency status. The Authority updates these grades on a semi-annual basis.
A loan classified as pass has strong asset quality and liquidity along with a multi-year track record of profitability.
Special mention loans have a potential weakness that deserves management’s close attention. If left unmonitored, these potential weaknesses may result in deterioration of the repayment prospects for such loans or the borrower’s credit position at some future date. Adverse economic or market conditions may also support a special mention rating. Other nonfinancial reasons for rating a credit exposure as special mention can include known borrower problems, pending litigation, or lending agreement issues.
A substandard loan contains weaknesses that, if left uncorrected, create some degree of doubt as to the likelihood of full collection of principal and interest. These loans require intensive supervision by management. Such loans are generally characterized by current or expected unprofitable operations, inadequate debt service coverage, inadequate liquidity, or marginal capitalization. Repayment may depend on collateral or other credit risk mitigants.
A loan classified as doubtful exhibits all the weaknesses inherent in one classified as substandard with the additional characteristic that the weaknesses make its collection in full, based on currently existing facts, conditions, and values, highly questionable and improbable. A doubtful loan has a high probability of total or substantial loss, but because of specific pending events that may strengthen the credit, its classification as loss is deferred at the present time. Doubtful borrowers are usually in default, lack adequate liquidity or capital, and lack the resources necessary to remain operationally solvent. Specific pending events may include mergers, acquisitions, liquidations, capital injections, the perfection of liens of additional collateral, the valuation of collateral, and refinancing. Loans classified as doubtful are also considered impaired. Generally, credit exposures are charged-off prior to being classified as doubtful.

WEST VIRGINIA ECONOMIC DEVELOPMENT AUTHORITY
NOTES TO COMBINED FINANCIAL STATEMENTSJune 30, 2019
(Continued)29
Note 7. Loan Credit Quality (Continued)
Loans classified as loss are loans with expected loss of entire principle balance. The loan may be carried in this classified status if circumstances indicate a remote possibility that the amount will be repaid.
The following table sets forth the Authority’s credit quality indicators information, segregated by class of loans (there were no loans graded as doubtful):
Special Sub- June 30, 2019 Pass Mention Standard Total
Secured by real estate: Commercial $ 17,589,017 $ 23,312,641 $ - $ 40,901,658 Service 7,362,896 11,566,698 5,986,532 24,916,126 Industrial 15,762,308 7,284,380 1,794,864 24,841,552Secured by equipment: Commercial 8,787,154 43,921 - 8,831,075 Service 162,205 - - 162,205 Industrial 13,591,249 296,244 - 13,887,493Secured by real estate and equipment: Commercial 4,053,333 5,632,495 - 9,685,828 Service 3,931,890 - - 3,931,890 Industrial 11,282,929 362,807 177,866 11,823,602
Total $ 82,522,981 $ 48,499,186 $ 7,959,262 $ 138,981,429
Special Sub- June 30, 2018 Pass Mention Standard Total
Secured by real estate: Commercial $ 19,490,056 $ 21,056,309 $ - $ 40,546,365 Service 12,529,338 1 6,181,783 18,711,122 Industrial 11,577,609 10,804,306 1,893,064 24,274,979Secured by equipment: Commercial 9,181,809 - - 9,181,809 Service 177,250 - - 177,250 Industrial 14,230,746 2,413,199 - 16,643,945Secured by real estate and equipment: Commercial 7,657,630 2,389,766 501,055 10,548,451 Service 3,155,886 - - 3,155,886 Industrial 8,537,234 1,881,374 194,257 10,612,865
Total $ 86,537,558 $ 38,544,955 $ 8,770,159 $ 133,852,672

WEST VIRGINIA ECONOMIC DEVELOPMENT AUTHORITY
NOTES TO COMBINED FINANCIAL STATEMENTSJune 30, 2019
30
Note 7. Loan Credit Quality (Continued)
Loans are designated as impaired when, in the opinion of management, based on current information and events, the collection of principal and interest in accordance with the loan contract is doubtful. Typically, such loans have exhibited a sustained period of delinquency or there have been significant events (such as bankruptcy, eminent foreclosure, or natural disasters) that impact repayment probability. Impairment is evaluated on an individual loan basis. Consistent with the Authority’s existing method of income recognition for loans, interest on impaired loans, except those classified as nonaccrual, is recognized as income using the accrual method. Impaired loans, or portions thereof, are charged off when deemed uncollectible.
The following table sets forth the Authority’s impaired loans information, segregated by class of loans(there were no amounts of recgonized interest income on these loans):
UnpaidPrincipal Related
June 30, 2019 Balance Allowance
With an allowance recorded: Secured by real estate:
Commercial $ 1,447,550 $ 250,000Service 5,986,532 650,000Industrial 1,794,864 1,000,000
Total secured by real estate $ 9,228,946 $ 1,900,000
UnpaidPrincipal Related
June 30, 2018 Balance Allowance
With an allowance recorded: Secured by real estate:
Service $ 6,181,783 $ 500,000Industrial 1,893,064 1,000,000
Total secured by real estate $ 8,074,847 $ 1,500,000
Secured by real estate andequipment:Commercial 501,055 200,000
Total secured by real estate and equipment $ 501,055 $ 200,000

WEST VIRGINIA ECONOMIC DEVELOPMENT AUTHORITY
NOTES TO COMBINED FINANCIAL STATEMENTSJune 30, 2019
(Continued)31
Note 8. Allowance for Credit Losses
The allowance for loan losses is management’s estimate of the probable credit losses inherent in the loan portfolio. Management’s evaluation of the adequacy of the allowance for loan losses and the appropriate provision for credit losses is based upon a semi-annual evaluation of the portfolio. This evaluation is inherently subjective and requires significant estimates, including the amounts and timing of estimated future cash flows and consideration of current economic trends, all of which are susceptible to constant and significant change. Allocations are made for specific loans based upon management’s estimate of the borrowers’ ability to repay and other factors impacting collectability. In addition, a portion of the allowance accounts is for the inherent imprecision in the allowance for credit losses analysis. During the year ended June 30, 2019, there were no material changes to the accounting policy or methodology related to the allowance for loan losses.
Loans deemed to be uncollectible are charged against the allowance for loan losses, while recoveries of previously charged-off amounts are credited to the allowance for loan losses. When a loan or a portion of a loan is identified to contain a loss, a charge-off recommendation is directed to management to charge off all or a portion of that loan.
If secured, the charge-off is generally made to reduce the loan balance to a level equal to the liquidation value of the collateral when payment of principal and interest is 120 days delinquent. Any loan, on which a principal or interest payment has not been made within 30 days, is reviewed monthly for appropriate action.
The Authority considers the allowance for loan losses of $7,600,000 and $6,600,000 adequate to cover loan losses inherent in the loan portfolio as of June 30, 2019 and 2018, respectively. The following table presents by portfolio segment, the changes in the allowance for loan losses and the recorded investment in loans.
June 30, 2019 Commercial Service Industrial Unallocated Total
Allowance for credit losses: Beginning balance $ 600,000 $ 500,000 $ 2,670,000 $ 2,830,000 $ 6,600,000 Charge-offs (501,055) - - - (501,055) Recoveries 2,825 - 31,189 - 34,014 Provision 898,230 750,000 (451,189) 270,000 1,467,041
Ending balance $ 1,000,000 $ 1,250,000 $ 2,250,000 $ 3,100,000 $ 7,600,000
Ending balance: Individuallyevaluated for impairment $ 1,000,000 $ 1,250,000 $ 2,250,000 $ - $ 4,500,000
Ending balance: Collectivelyevaluated for impairment $ - $ - $ - $ 3,100,000 $ 3,100,000
Loans receivable: Ending balance $ 59,418,561 $29,010,221 $50,552,647 $ - $138,981,429

WEST VIRGINIA ECONOMIC DEVELOPMENT AUTHORITY
NOTES TO COMBINED FINANCIAL STATEMENTSJune 30, 2019
32
Note 8. Allowance for Credit Losses (Continued)
June 30, 2018 Commercial Service Industrial Unallocated Total
Allowance for credit losses: Beginning balance $ 850,000 $ 600,000 $ 3,740,000 $ 1,410,000 $ 6,600,000 Charge-offs - (123,526) (883,821) - (1,007,347) Recoveries 4,001 - 31,189 - 35,190 Provision (254,001) 23,526 (217,368) 1,420,000 972,157
Ending balance $ 600,000 $ 500,000 $ 2,670,000 $ 2,830,000 $ 6,600,000
Ending balance: Individuallyevaluated for impairment $ 600,000 $ 500,000 $ 2,670,000 $ - $ 3,770,000
Ending balance: Collectivelyevaluated for impairment $ - $ - $ - $ 2,830,000 $ 2,830,000
Loans receivable: Ending balance $ 60,276,624 $22,044,259 $51,531,789 $ - $133,852,672
Note 9. Capital Asset and Leasing Activities
The Authority leases land, buildings, and equipment to commercial entities which are accounted for as operating leases. The leases expire over the next 1 to 10 years. Lessees of the property have the option to purchase the property at the end of the lease term at designated prices which are not considered bargain prices.
Real estate, property, and equipment include the following at June 30:
2019 2018Held for lease:Land $ 7,276,963 $ 7,276,963Buildings and improvements 29,986,056 29,986,056Equipment 234,627 203,420
37,497,646 37,466,439Less accumulated depreciation - buildings (13,944,777) (12,894,903)Less accumulated depreciation - equipment (183,610) (175,124)
$ 23,369,259 $ 24,396,412
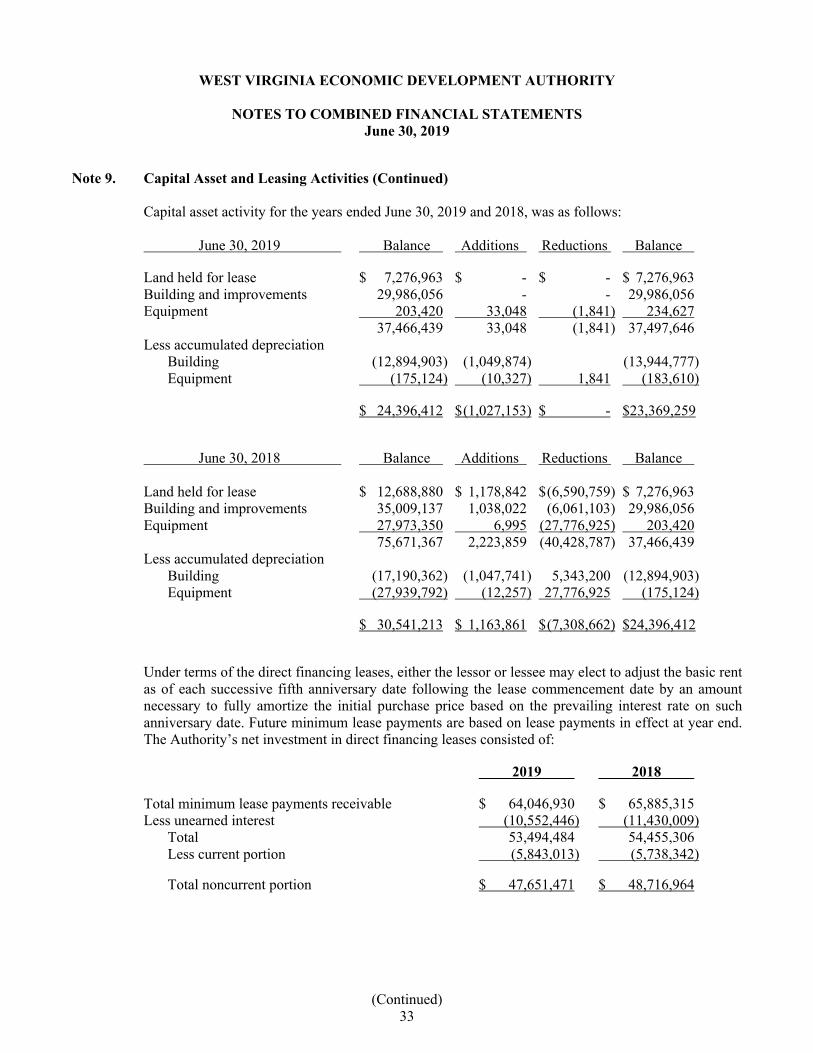
WEST VIRGINIA ECONOMIC DEVELOPMENT AUTHORITY
NOTES TO COMBINED FINANCIAL STATEMENTSJune 30, 2019
(Continued)33
Note 9. Capital Asset and Leasing Activities (Continued)
Capital asset activity for the years ended June 30, 2019 and 2018, was as follows:
June 30, 2019 Balance Additions Reductions Balance
Land held for lease $ 7,276,963 $ - $ - $ 7,276,963Building and improvements 29,986,056 - - 29,986,056Equipment 203,420 33,048 (1,841) 234,627
37,466,439 33,048 (1,841) 37,497,646Less accumulated depreciation
Building (12,894,903) (1,049,874) (13,944,777)Equipment (175,124) (10,327) 1,841 (183,610)
$ 24,396,412 $(1,027,153) $ - $23,369,259
June 30, 2018 Balance Additions Reductions Balance
Land held for lease $ 12,688,880 $ 1,178,842 $(6,590,759) $ 7,276,963Building and improvements 35,009,137 1,038,022 (6,061,103) 29,986,056Equipment 27,973,350 6,995 (27,776,925) 203,420
75,671,367 2,223,859 (40,428,787) 37,466,439Less accumulated depreciation
Building (17,190,362) (1,047,741) 5,343,200 (12,894,903)Equipment (27,939,792) (12,257) 27,776,925 (175,124)
$ 30,541,213 $ 1,163,861 $(7,308,662) $24,396,412
Under terms of the direct financing leases, either the lessor or lessee may elect to adjust the basic rent as of each successive fifth anniversary date following the lease commencement date by an amount necessary to fully amortize the initial purchase price based on the prevailing interest rate on such anniversary date. Future minimum lease payments are based on lease payments in effect at year end. The Authority’s net investment in direct financing leases consisted of:
2019 2018
Total minimum lease payments receivable $ 64,046,930 $ 65,885,315Less unearned interest (10,552,446) (11,430,009)
Total 53,494,484 54,455,306Less current portion (5,843,013) (5,738,342)
Total noncurrent portion $ 47,651,471 $ 48,716,964

WEST VIRGINIA ECONOMIC DEVELOPMENT AUTHORITY
NOTES TO COMBINED FINANCIAL STATEMENTSJune 30, 2019
(Continued)34
Note 9. Capital Asset and Leasing Activities (Continued)
At June 30, 2019, future minimum lease payments receivable under direct financing leases and non-cancellable operating leases in excess of one year are as follows:
DirectOperating Financing
June 30 Leases Leases Total
2020 $ 2,522,794 $ 7,518,247 $ 10,041,0412021 2,522,794 7,518,247 10,041,0412022 2,408,794 7,518,247 9,927,0412023 2,408,794 7,518,247 9,927,0412024 1,590,968 5,131,183 6,722,151
Thereafter 4,772,904 28,842,759 33,615,663
$ 16,227,048 $ 64,046,930 $ 80,273,978
Lease revenue includes interest from direct financing leases of $1,798,647 and $1,608,663 for the yearsended June 30, 2019 and 2018, respectively.
Note 10. Loans Payable
The Authority receives financing from various funding sources in the form of direct borrowings. There are no direct placements. Direct borrowing includes the following:
June 302019 2018
Revolving loan agreement with the West Virginia Board of Treasury Investments to borrow up to $175 million to be re-loaned for economic development purposes, interest equal to the twelve-month average of the Board’s yield on its cash liquidity pool, which was.38% for July 2017 and .89% for the remainder of fiscal year 2018, and 1.60% for fiscal year 2019 and adjustable annually thereafter on July 1 of each consecutive year, monthly payments of principal and interest payable in an amount sufficient to repay the outstanding principal balance over 10 years, secured by a security interest in the investments derived from the loan. $ 117,370,977 $ 106,680,600

WEST VIRGINIA ECONOMIC DEVELOPMENT AUTHORITY
NOTES TO COMBINED FINANCIAL STATEMENTSJune 30, 2019
(Continued)35
Note 10. Loans Payable (Continued)
June 302019 2018
Revolving loan agreement with the West Virginia Board of Treasury Investments to borrow up to $50 million to provide loan insurance for broadband projects, interest equal to the twelve-month average of the Board’s yield on its money market pool, which was1.3% and 2.26% at the end of fiscal year 2018 and2019, respectively, and adjustable quarterly thereafter, quarterly payments of interest will be made as long as a principal balance remains outstanding. Note repayments are dependent upon moneys received from the broadband loan insurance recipients. 1,480,000 1,480,000
Note payable to West Virginia Board of Treasury Investments, non-recourse not to exceed $25 million, interest at 3% per annum, principal due in annual installments through June 30, 2022, unsecured. Note repayments are dependent upon the proceeds received from the investments in venture capital funds. 324,155 494,414
Note payable to West Virginia Infrastructure and Jobs Development Council due in monthly installments of principal of $10,417, final payment due October 1, 2023, note is noninterest bearing and secured by real estate. 552,021 677,025
Note payable to West Virginia Infrastructure and Jobs Development Council due in monthly installments of $20,703, final payment due March 1, 2024, interest rate at 3% and secured by real estate. 1,098,465 1,310,480
Note payable to West Virginia Infrastructure and Jobs Development Council due in monthly installments of $16,641, final payment due June 1, 2029, interest rate at 3% and secured by real estate. 1,723,130 1,868,749
Note payable to West Virginia Infrastructure and Jobs Development Council due in monthly installments of $29,703, final payment made July 12, 2019, interest rate at 3% and secured by equipment. 28,000 377,875

WEST VIRGINIA ECONOMIC DEVELOPMENT AUTHORITY
NOTES TO COMBINED FINANCIAL STATEMENTSJune 30, 2019
36
Note 10. Loans Payable (Continued)
June 302019 2018
Note payable to West Virginia Infrastructure and Jobs Development Council with payments deferred until March 1, 2021, final payment due February 1, 2025, interest rate at 3% and secured by equipment. Principal and interest were forgiven during fiscal year 2019 as performance standards defined in theagreement were met. - 1,500,000
Note payable to West Virginia Infrastructure and Jobs Development Council with payments deferred until January 1, 2019, final payment due June 1, 2026, interest rate at 3% and secured by equipment. Principal and interest were forgiven during fiscal year 2019 as performance standards defined in the agreement were met. - 750,000
Total 122,576,748 115,139,143Less current portion (10,966,410) (10,747,916)
Long term portion $ 111,610,338 $ 104,391,227
June 30 Principal Interest Total
2020 $ 10,966,410 $ 2,810,078 $ 13,776,4882021 11,251,757 2,613,789 13,865,5462022 11,854,841 2,334,861 14,189,7022023 11,816,616 2,048,929 13,865,5452024 11,969,888 1,760,647 13,730,535
2025-2029 63,237,236 4,226,405 67,463,6412030-2034 - 176,957 176,9572035-2039 1,480,000 179,864 1,659,864
$ 122,576,748 $ 16,151,530 $ 138,728,278
Changes in loans payable for the years ended June 30, 2019 and 2018 were as follows:
AmountsBeginning Ending Due WithinBalance Additions Reductions Balance One Year
June 30, 2019 $ 115,139,143 $ 19,975,000 $ (12,537,395) $ 122,576,748 $ 10,966,410
June 30, 2018 $ 134,736,465 $ 4,585,000 $ (24,182,322) $ 115,139,143 $ 10,747,916

WEST VIRGINIA ECONOMIC DEVELOPMENT AUTHORITY
NOTES TO COMBINED FINANCIAL STATEMENTSJune 30, 2019
37
Note 11. Related Party Transactions with the State of West Virginia
The Authority enters into certain transactions with various agencies of the State of West Virginia for financing, employee benefits, and other services.
Amounts due to other State of West Virginia agencies as of June 30 consisted of the following:
2019 2018 Balances included in loans payable:
WV Infrastructure & Jobs Development Council $ 3,401,616 $ 6,484,129 WV Board of Treasury Investments 119,175,132 108,655,014
Balances included in amount due to the State Agencies: Lottery Commission 8,597 8,597 Development Office 273,667 207,000 Governor’s Office 43,351 43,351
$ 122,902,363 $ 115,398,091
Note 12. Commitments and Contingencies
Commitments to extend credit are agreements between the Authority and borrowers which generally require the borrowers to meet certain conditions regarding the extension of credit and which expire on specified dates. In making these commitments, the Authority evaluates each borrower’s creditworthiness. Upon extension of credit, the Authority requires the loan to be collateralized by equipment and/or real estate. At June 30, 2019, the Authority had committed to make loans of $52,072,010. In order to fund these loans, the Authority will borrow $46,805,160 from the BTI. The remaining $5,266,850 will be provided from the Authority’s available funds.
The Authority guarantees repayment of portions of certain loans made for economic development purposes under its Loan Insurance Program. These guarantees represent conditional commitments by the Authority to guarantee the performance of a borrower to a third party lender. The Authority annually reviews the outstanding Loan Insurance Program obligations with its established loan loss allowance account, and records a liability if and when the Authority recognizes that a claim is likely. As of June 30, 2019, the Authority’s maximum exposure to financial guarantees expiring at various intervals through March 2028, is $3,703,781. As of June 30, 2019 and 2018, loans of $5,463,741 and $5,285,070, respectively, were guaranteed under this program. Since the inception of the Loan Insurance Program, the maximum liability to the Authority, assuming no collateral value, has been less than the specified cash reserves set aside for future claims and liabilities. During the years ended June 30, 2019 and 2018, the Authority did not pay any claims under the Loan Insurance Program.

WEST VIRGINIA ECONOMIC DEVELOPMENT AUTHORITY
NOTES TO COMBINED FINANCIAL STATEMENTSJune 30, 2019
(Continued)38
Note 13. Risk Management
The Authority is exposed to various risks of losses related to torts; theft of, damage to, and destruction of assets; errors and omissions; injuries to employees; employee health and life coverage; and natural disasters. The State of West Virginia has established the Board of Risk and Insurance Management (BRIM) and the Public Employees Insurance Agency (PEIA) as risk pools to account for and finance uninsured risks of losses for State agencies, institutions of higher education, and component units.
BRIM is a public entity risk pool that provides coverage for general, property, medical malpractice, and automobile liability. PEIA is also a public entity risk pool that provides coverage for employee and dependent health, life and prescription drug insurance. The Authority retains the risk of loss on certain tort and contractor claims in excess of the amount insured or covered by BRIM’s insurance carrier.
Through its participation in the PEIA, the Authority has obtained health coverage for its employees. In exchange for payment of premiums to PEIA, the Authority has transferred its risks related to health coverage of its employees.
The Authority carries workers compensation insurance coverage through a commercial carrier. The carrier is paid a quarterly premium to provide compensation for injuries sustained in the course of employment. In exchange for the payment of premiums, the Authority has transferred its risks for job-related injuries of employees.
There have been no changes in the coverages or amounts of coverage and there have been no claims in excess of coverage related to the Authority’s risk management plan for the years ended June 30, 2019and 2018.
Note 14. Pension Plan
Plan Description
The Authority contributes to the PERS, a cost-sharing multiple-employer defined benefit pension plan administered by the West Virginia Consolidated Public Retirement Board (CPRB). PERS covers substantially all employees of the State and its component units, as well as employees of participating non-state governmental entities who are not participants of another state or municipal retirementsystem. Benefits under PERS include retirement, death and disability benefits, and have been established and may be amended by action of the State Legislature. The CPRB issues a publicly available financial report that includes financial statements for PERS that may be obtained at www.wvretirement.com.

WEST VIRGINIA ECONOMIC DEVELOPMENT AUTHORITY
NOTES TO COMBINED FINANCIAL STATEMENTSJune 30, 2019
(Continued)39
Note 14. Pension Plan (Continued)
Benefits Provided
PERS provides retirement benefits as well as death and disability benefits. Qualification for normal retirement is age 60 with five years of service or at least age 55 with age and service equal to 80 or greater. For all employees hired July 1, 2015 and later, qualification for normal retirement is age 62 with 10 years of service. The straight-life annuity retirement benefit is equivalent to 2% of average salary multiplied by years of service. Average salary is the average of the highest annual compensationduring any period of three consecutive years within the last fifteen years of earnings. For all employees hired July 1, 2015 and later, average salary is the average of the five consecutive highest annual earnings out of the last fifteen years of earnings. Terminated members with at least five years of contributory service who do not withdraw their accumulated contributions may elect to receive their retirement annuity beginning at age 62. For all employees hired July 1, 2015 and later, this age increases to 64.
Contributions
Contributions as a percentage of payroll for members are established by statutes, subject to legislative limitations and are not actuarially determined. Contributions as a percentage of payroll for employers are established by the CPRB. Current funding policy requires contributions, consisting of member contributions of 4.5% of annual earnings and employer contributions of 10%, 11%, and 12%, of covered payroll for the years ended June 30, 2019, 2018, and 2017, respectively. All members hired after July 1, 2015, will contribute 6% of annual earnings.
During the years ended June 30, 2019, 2018, and 2017, the Authority’s contributions to PERS required and made were approximately $57,117, $70,118, and $75,237, respectively.
Pension Liabilities, Pension Expense, and Deferred Outflows of Resources and Deferred Inflows of Resources Related to Pensions
At June 30, 2019 and 2018, respectively, the Authority reported a liability of $118,736 and $196,216for its proportionate share of the net pension liability. The net pension liability reported at June 30, 2019, was measured as of June 30, 2018, and the total pension liability used to calculate the net pension liability was determined by an actuarial valuation as of June 30, 2017, rolled forward to the measurement date of June 30, 2018. The Authority’s proportion of the net pension liability was based on the Authority’s share of contributions to the pension plan relative to the contributions of all employers participating in PERS for the year ended June 30, 2018. At June 30, 2018, the Authority’s proportion was .045977%, which was an increase of .000519 from its proportion measured as of June 30, 2017.
For the years ended June 30, 2019 and 2018, respectively, the Authority recognized pension expense of $19,634 and $47,927, respectively. At June 30, 2019 and 2018, respectively, the Authority reported deferred outflows of resources and deferred inflows of resources related to pensions from the following sources:

WEST VIRGINIA ECONOMIC DEVELOPMENT AUTHORITY
NOTES TO COMBINED FINANCIAL STATEMENTSJune 30, 2019
(Continued)40
Note 14. Pension Plan (Continued)
Pension Liabilities, Pension Expense, and Deferred Outflows of Resources and Deferred Inflows of Resources Related to Pensions (Continued)
June 30, 2019Deferred Deferred
Outflows of Inflows ofResources Resources
Net difference between projected and actual earnings on pension plan investments $ - $ 69,871Difference between expected and actual experience 5,890 294Changes in assumptions - -Changes in proportion and differences between the Authority’s contributions and proportionate share of contributions 5,763 514The Authority’s contributions made subsequent to the measurement date of June 30, 2018 57,117 -
Total $ 68,770 $ 70,679
June 30, 2018Deferred Deferred
Outflows of Inflows ofResources Resources
Net difference between projected and actual earnings on pension plan investments $ - $ 47,703Difference between expected and actual experience 17,462 434Changes in assumptions - 10,178Changes in proportion and differences between the Authority’s contributions and proportionate share of contributions 9,835 978The Authority’s contributions made subsequent to the measurement date of June 30, 2017 70,118 -
Total $ 97,415 $ 59,293
Deferred outflows of resources related to pensions of $57,117 resulting from the Authority’scontributions subsequent to the measurement date will be recognized as a reduction of the net pension liability in the year ended June 30, 2020. Other amounts reported as deferred outflows of resources and deferred inflows of resources related to pensions will be recognized in pension expense as follows:

WEST VIRGINIA ECONOMIC DEVELOPMENT AUTHORITY
NOTES TO COMBINED FINANCIAL STATEMENTSJune 30, 2019
(Continued)41
Note 14. Penson Plan (Continued)
Year ending June 30,
2020 $ 11,3482021 (7,890)2022 (50,656)2023 (11,828)
Actuarial Assumptions
The total pension liability in the June 30, 2018 and 2017 actuarial valuation was determined using the following actuarial assumptions:
Inflation 3.0 percentSalary increases 3.0 –6.0 percent, average, including inflationInvestment rate of return 7.5 percent, net of pension plan investment expense
Mortality rates were based on 100% of RP-2000 Non-Annuitant, scale AA fully generational for active employees, 110% of the RP-2000 Non-Annuitant, scale AA fully generational for retired healthy males, 101% of RP-2000 Non-Annuitant, scale AA fully generational for retired healthy females, 96% of RP-2000 Disabled Annuitant scale AA for disabled males, and 107% of RP-2000 Disabled Annuitant, scale AA for disabled females.
An experience study, which was based on years 2009 through 2014, was completed prior to the 2015 actuarial valuation.
The long-term expected rate of return on pension plan investments was determined using the buildingblock method in which estimates of expected future real rates of return (expected returns, net of pension plan investment expense and inflation) are developed for each major asset class. These ranges are combined to produce the long-term expected rate of return by weighting the expected future real rates of return by the target asset allocation percentages and by adding expected inflation. Best estimates of long-term geometric rates of return are summarized in the following table:

WEST VIRGINIA ECONOMIC DEVELOPMENT AUTHORITY
NOTES TO COMBINED FINANCIAL STATEMENTSJune 30, 2019
42
Note 14. Pension Plan (Continued)
Actuarial Assumptions (Continued)
Long-term Weighted Average
Target Expected Rate Expected Real Rate
Asset Class Allocation of Return of Return
Domestic equity 27.5% 4.5% 1.24%
International equity 27.5% 8.6% 2.37%
Fixed income 15.0% 3.3% 0.50%
Real estate 10.0% 6.0% 0.60%
Private equity 10.0% 6.4% 0.64%
Hedge funds 10.0% 4.0% 0.40%
Total 100.00% 5.75%
Inflation (CPI) 2.10%
7.85%
Discount Rate
The discount rate used to measure the total pension liability was 7.5 percent. The projection of cash flows used to determine the discount rate assumed that employer contributions will continue to follow the current funding policies. Based on those assumptions, the pension plan’s fiduciary net position was projected to be available to make all projected future benefit payments of current plan members.Therefore, the long-term expected rate of return on pension plan investments was applied to all periods of projected benefit payments to determine the total pension liability. Although discount rates are subject to change between measurement dates, there were no changes in the discount rate in the current period.
Sensitivity of the Authority’s Proportionate Share of the Net Pension Liability to Changes in the Discount Rate
The following presents the Authority’s proportionate share of the net pension liability calculated using the discount rate of 7.5 percent , as well as what the Authority’s proportionate share of the net pension liability would be if it were calculated using a discount rate that is one-percentage-point lower or one-percentage-point higher than the current rate:
1% Decrease Current Discount 1% Increase(6.5%) Rate (7.5%) (8.5%)
Authority’s proportionate share of the net pension liability (asset) $ 478,172 $ 118,736 $ (185,343)

WEST VIRGINIA ECONOMIC DEVELOPMENT AUTHORITY
NOTES TO COMBINED FINANCIAL STATEMENTSJune 30, 2019
(Continued)43
Note 15. Other Post Employment Benefits (OPEB)
Plan Description
The West Virginia Other Postemployment Benefit Plan (the OPEB Plan) is a cost-sharing, multiple-employer, defined benefit other post-employment benefit plan and covers the retirees of State agencies, colleges and universities, county boards of education, and other government entities as set forth in the West Virginia Code Section 5-16D-2 (the Code). The financial activities of the OPEB Plan are accounted for in the West Virginia Retiree Health Benefit Trust Fund (RHBT), a fiduciary fund of the State of West Virginia. The OPEB Plan is administered by a combination of the West Virginia Public Employees Insurance Agency (PEIA) and the RHBT staff. OPEB Plan benefits are established and revised by PEIA and the RHBT management with approval of their Finance Board. The PEIA issues a publically available financial report of the RHBT that can be obtained at www.peia.wv.gov or by writing to the West Virginia Public Employees Insurance Agency, 601 57th Street, SE Suite 2, Charleston, WV 25304
Benefits Provided
The Authority’s employees who retire are eligible for PEIA health and life benefits, provided they meet the minimum eligibility requirements of the PERS or meet certain other eligibility requirements of other West Virginia Consolidated Public Retirement Board CPRB sponsored retirement plans. RHBT provides medical and prescription drug insurance and life insurance benefits to those qualified participants. Life insurance is provided through a vendor and is fully funded by member contributions. The medical and prescription drug insurance is provided through two options; Self-Insured Preferred Provider Benefit Plan - primarily for non-Medicare-eligible retirees and spouses or External Managed Care Organizations - primarily for Medicare-eligible retirees and spouses.
The RHBT Medicare-eligible retired employees and their Medicare-eligible dependents receive medical and drug coverage from a Medicare Advantage Plan administered by a vendor. Under this arrangement, the vendor assumes the financial risk of providing comprehensive medical and drug coverage with limited copayments. Non-Medicare retirees continue enrollment in PEIA's Preferred Provider Benefit or the Managed Care Option. The RHBT collects employer contributions for Managed Care Organization (MCO) participants and remits capitation payments to the MCO. Survivors of retirees have the option of purchasing the medical and prescription drug coverage.
Eligible participants hired after June 30, 2010, will be required to fully fund premium contributions upon retirement. The Plan is a closed plan to new entrants.
Contributions
West Virginia Code section 5-16D-6 assigns to the PEIA Finance Board the authority to establish and amend contribution requirements of the plan members and the participating employers. Participating employers are required by statute to contribute at a rate assessed each year by the RHBT. The annual contractually required rate is the same for all participating employers. Employer contributions represent what the employer was billed during the respective year for their portion of the pay as you go premiums, commonly referred to as paygo, retiree leave conversion billings, and other matters, including billing adjustments.

WEST VIRGINIA ECONOMIC DEVELOPMENT AUTHORITY
NOTES TO COMBINED FINANCIAL STATEMENTSJune 30, 2019
44
Note 15. Other Post Employment Benefits (OPEB) (Continued)
Contributions (continued)
The annual contractually required per active policyholder per month rates for State non-general funded agencies and other participating employers effective June 30, 2019, 2018, and 2017, respectively, were:
2019 2018 2017 20171/1/17 – 6/30/17 7/1/16-12/31/16
Paygo Premium $ 183 $ 177 $ 135 $ 196
Contributions to the OPEB plan from the Authority were $19,733, $26,930 and $41,358 for the years ended June 30, 2019, 2018, and 2017 respectively.
Members retired before July 1, 1997, pay retiree healthcare contributions at the highest sponsor subsidized rate, regardless of their actual years of service. Members retired between July 1, 1997 and June 30, 2010, pay a subsidized rate depending on the member's years of service. Members hired on or after July 1, 2010, pay retiree healthcare contributions with no sponsor provided implicit or explicit subsidy.
Retiree leave conversion contributions from the employer depend on the retiree's date of hire and years of service at retirement as described below;
• Members hired before July 1, 1988, may convert accrued sick or leave days into 100% of the required retiree healthcare contribution.
• Members hired from July 1, 1988, to June 30, 2001, may convert accrued sick or leave days into 50% of the required retiree healthcare contribution.
The conversion rate is two days of unused sick and annual leave days per month for single healthcare coverage and three days of unused sick and annual leave days per month for family healthcare coverage.
Contributions by Nonemployer Contributing Entities in Special Funding Situations
The State of West Virginia is a nonemployer contributing entity that provides funding through SB 419, effective July 1, 2012, amended by West Virginia Code §11-21-96. The State provides a supplemental pre-funding source dedicating $30 million annually to the RHBT Fund from annual collections of the Personal Income Tax Fund and dedicated for payment of the unfunded liability of the RHBT. The $30 million transferred pursuant to this Code shall be transferred until the Governor certifies to the Legislature that an independent actuarial study has determined that the unfunded liability of RHBT has been provided for in its entirety or July 1, 2037, whichever date is later. This funding is to the advantage of all RHBT contributing employers.

WEST VIRGINIA ECONOMIC DEVELOPMENT AUTHORITY
NOTES TO COMBINED FINANCIAL STATEMENTSJune 30, 2019
(Continued)45
Note 15. Other Post Employment Benefits (OPEB) (Continued)
Contributions by Nonemployer Contributing Entities in Special Funding Situations (Continued)
The State is a nonemployer contributing entity that provides funding through West Virginia State Code §11B-2-32. The Financial Stability Fund is a plan to transfer an annual amount of $5 million to the RHBT from special revenue funds to be used to lower retiree premiums, to help reduce benefit cuts, to help reduce premium increases or any combination thereof. The $5 million transferred pursuant to this Code shall be transferred annually into the RHBT through June 30, 2020. This funding is to the advantage of all RHBT contributing employers.
The State is a nonemployer contributing entity that provides funding through SB 469 which was passed February 10, 2012, granting OPEB liability relief to the 55 County Boards of Education effective July 1, 2012. The public school support plan (PSSP) is a basic foundation allowance program that provides funding to the local school boards for "any amount of the employer's annual required contribution allocated and billed to the county boards for employees who are employed as professional employees, employees who are employed as service personnel and employees who are employed as professional student support personnel", within the limits authorized by the State Code. This special funding under the school aid formula subsidizes employer contributions of the county boards of education.
OPEB Liabilities, OPEB Expense, and Deferred Outflows of Resources and Deferred Inflows of Resources Related to OPEB
At June 30, 2019, and 2018, the Authority reported a liability for its proportionate share of the RHBT net OPEB liability that reflected a reduction for State OPEB support provided to the Authority. The amount recognized by the Authority as its proportionate share of the net OPEB liability, the related State support, and the total portion of the net OPEB liability that was associated with the Authority was as follows:
2019 2018The Authority’s proportionate share of the net OPEB liability. $ 260,666 $ 495,130State’s special funding proportionate share of the net OPEB liability associated with the Authority. 53,873 101,700Total portion of net OPEB liability associated with the Authority. $ 314,539 $ 596,830
The net OPEB liability reported at June 30, 2019 was measured as of June 30, 2018, and the total OPEB liability used to calculate the net OPEB liability was determined by an actuarial valuation as of June 30, 2017. The Authority’s proportion of the net OPEB liability was based on its proportionate share of employer and non-employer contributions to the OPEB Plan for the fiscal year ended on the measurement date. At June 30, 2018, the Authority’s proportion was .0121498%, which is a decreaseof .0079857 from its proportion measured as of June 30, 2017.
For the years ended June 30, 2019, and 2018, respectively, the Authority recognized OPEB expense of $(56,167) and $32,971 and for support provided by the State under special funding situations revenue of $16,467 and $31,220. At June 30, 2019, and 2018, the Authority reported deferred outflows of resources and deferred inflows of resources related to OPEB from the following sources:

WEST VIRGINIA ECONOMIC DEVELOPMENT AUTHORITY
NOTES TO COMBINED FINANCIAL STATEMENTSJune 30, 2019
46
Note 15. Other Post Employment Benefits (OPEB) (Continued)
OPEB Liabilities, OPEB Expense, and Deferred Outflows of Resources and Deferred Inflows of Resources Related to OPEB (Continued)
June 30, 2019
Deferred Outflowsof Resources
Deferred Inflows of Resources
Differences between expected and actual experience $ - $ 3,856
Changes in assumptions - 26,027
Net difference between projected and actual earnings on OPEB plan investments - 4,825
Changes in proportion and differences between the Authority’s contributions and proportionate share of contributions - 274,162
The Authority’s contributions subsequent to the measurement date of June 30, 2018 19,733 -
Total $ 19,733 $ 308,870
June 30, 2018
Deferred Outflowsof Resources
Deferred Inflows of Resources
Differences between expected and actual experience $ - $ 1,658
Net difference between projected and actual earnings on OPEB plan investments - 7,903
Changes in proportion and differences between theAuthority’s contributions and proportionate share of
contributions - 164,409
The Authority’s contributions subsequent to the measurement date of June 30, 2017 26,930 -
Total $ 26,930 $ 173,970
Deferred outflows of resources related to OPEB of $19,733 resulting from the Authority’s contributions subsequent to the measurement date will be recognized as a reduction of the net OPEB liability in the year ended June 30, 2020. Other amounts reported as deferred outflows of resources and deferred inflows of resources related to OPEB will be recognized in OPEB expense as follows:
Year ended June 30:
2020 $(96,404)
2021 (96,404)
2022 (83,666)
2023 (32,396)

WEST VIRGINIA ECONOMIC DEVELOPMENT AUTHORITY
NOTES TO COMBINED FINANCIAL STATEMENTSJune 30, 2019
(Continued)47
Note 15. Other Post Employment Benefits (OPEB) (Continued)
Actuarial assumptions
The total OPEB liability was determined by an actuarial valuation as of June 30, 2017, rolled forward to June 30, 2018 using the following actuarial assumptions, applied to all periods included in the measurement, unless otherwise specified:
Inflation 2.75%
Salary increases Dependent upon pension system ranging from 3.00% to 6.50%, including inflation
Investment rate of return 7.15%, net of OPEB plan investment expense, including inflation
Healthcare cost trend rates Actual trend used for fiscal year 2018. For fiscal years on and after 2019, trend starts at 8.00% and 10.00% for pre and post-Medicare, respectively, and gradually decreases to an ultimate trend of 4.50%. Excess trend rate of 0.13% and 0.00% for pre and post-Medicare, respectively, is added to healthcare trend rates pertaining to per capita claims costs beginning in 2022 to account for the Excise Tax.
Actuarial cost method Entry Age Normal Cost Method
Amortization method Level percentage of payroll over a 20 year closed period
Remaining amortization period 20 years closed as of June 30, 2017
Post-retirement mortality rates were based on the RP-2000 Healthy Annuitant Mortality Table projected with Scale AA on a fully generational basis for PERS and Teachers’ Retirement System (TRS) and RP-2014 Healthy Annuitant Mortality Table projected with scale MP-2016 on a fully generational basis for West Virginia Death, Disability, and Retirement Fund (Troopers A) and West Virginia State Police Retirement System (Troopers B). Pre-retirement mortality rates were based on RP-2000 Non-Annuitant Mortality Table projected with scale AA on a fully generational basis for PERS and TRS and RP-2014 Employee Mortality Table projected with Scale MP-2016 on a fully generational basis for Troopers A and B.
The total OPEB liability was determined by an actuarial valuation as of June 30, 2016, rolled forward to June 30, 2017 using the following actuarial assumptions, applied to all periods included in the measurement, unless otherwise specified:
Inflation 2.75%
Salary increases Dependent upon pension system ranging from 3.00% to 6.50%, including inflation

WEST VIRGINIA ECONOMIC DEVELOPMENT AUTHORITY
NOTES TO COMBINED FINANCIAL STATEMENTSJune 30, 2019
48
Note 15. Other Post Employment Benefits (OPEB) (Continued)
Actuarial assumptions (Continued)
Investment rate of return 7.15%, net of OPEB plan investment expense, including inflation
Healthcare cost trend rates Actual trend used for fiscal year 2017. For fiscal years on and after 2018, trend starts at 8.50% and 9.75% for pre and post-Medicare, respectively, and gradually decreases to an ultimate trend of 4.50%. Excess trend rate of 0.14% and 0.29% for pre and post-Medicare, respectively, is added to healthcare trend rates pertaining to per capita claims costs beginning in 2020 to account for the Excise Tax.
Actuarial cost method Entry Age Normal Cost Method
Amortization method Level percentage of payroll over a 21 year closed period
Remaining amortization period 21 years closed as of June 30, 2016
Mortality rates were based on the RP-2000 Healthy Annuitant Mortality Table projected with Scale AA on a fully generational basis for PERS and Teachers’ Retirement System (TRS). RP-2000 Healthy Annuitant Mortality Table projected to 2025 with scale BB for West Virginia Death, Disability, and Retirement Fund (Troopers A) and West Virginia State Police Retirement System (Troopers B). Pre-Retirement: RP-2000 Non-Annuitant Mortality Table projected with Scale AA on a fully generational basis for PERS and TRS. RP-2000 Non-Annuitant Mortality Table projected to 2020 with Scale BB for Troopers A and B.
The actuarial assumptions used in the June 30, 2016 and 2017 valuations were based on the results of an actuarial experience study for the period July 1, 2011 - June 30, 2015.
Certain assumptions have been changed since the prior measurement date. The assumption changes that most significantly impacted the Net OPEB Liability are as follows: the inclusion of waived annuitants increased the liability by approximately $17 million; a 15% reduction in the retirement rate assumption decreased the liability by approximately $68 million; a change in certain healthcare-related assumptions decreased the liability by approximately $232 million; and an update to the mortality tables increased the liability by approximately $25 million. Certain other assumption changes were noted but did not materially impact the Net OPEB Liability.
The long-term expected rate of return of 7.15% on OPEB plan investments was determined by a combination of an expected long-term rate of return of 7.50% for long-term assets invested with the West Virginia Investment Management Board (WVIMB) and an expected short-term rate of return of 3.0% for assets invested with the WVBTI. Long-term pre-funding assets are invested with the WVIMB. The strategic asset allocation consists of 55% equity, 15% fixed income, 10% private equity, 10% hedge fund and 10% real estate invested. Short-term assets used to pay current year benefits and expenses are invested with the WVBTI.

WEST VIRGINIA ECONOMIC DEVELOPMENT AUTHORITY
NOTES TO COMBINED FINANCIAL STATEMENTSJune 30, 2019
(Continued)49
Note 15. Other Post Employment Benefits (OPEB) (Continued)
Actuarial assumptions (continued)
The long-term rate of return on OPEB plan investments were determined using a building block method in which estimates of expected future real rates of return (expected returns, net of OPEB planinvestment expense and inflation) was developed for each major asset class. These ranges were combined to produce the long-term expected rate of return by weighting the expected future real rates of return by the target asset allocation percentages and by adding expected inflation. Best estimates of long-term geometric rates are summarized in the following table:
Asset ClassLong-Term Expected Real Rate of Return
Large Cap Domestic 17.0%Non-Large Cap Domestic 22.0%International Qualified 24.6%International Non-Qualified 24.3%International Equity 26.2%Short-Term Fixed 0.5%Total Return Fixed Income 6.7%Core Fixed Income 0.1%Hedge Fund 5.7%Private Equity 19.6%Real Estate 8.3%Opportunistic Income 4.8%Cash 0.0%
Discount rate
The discount rate used to measure the total OPEB liability was 7.15%. The projection of cash flows used to determine the discount rate assumed that RHBT contributions would be made at rates equal to the actuarially determined contribution rates, in accordance with prefunding and investment policies. Future pre-funding assumptions include a $30 million annual contribution from the State through 2037. Based on those assumptions, and that the Plan is expected to be fully funded by fiscal year ended June 30, 2037, the OPEB plan's fiduciary net position was projected to be available to make all projected future benefit payments of current plan members. Therefore, the long-term expected rate of return on OPEB plan investments was applied to all periods of projected benefit payments to determine the total OPEB liability. Discount rates are subject to change between measurement dates.

WEST VIRGINIA ECONOMIC DEVELOPMENT AUTHORITY
NOTES TO COMBINED FINANCIAL STATEMENTSJune 30, 2019
50
Note 15. Other Post Employment Benefits (OPEB) (Continued)
Other key assumptions
The projection assumes that the capped subsidy aggregate contribution limit of $160 million for 2018would increase by $10 million per year on and after 2019. Additionally, the per member subsidy is projected to increase by at least 3.0% per year but no more than the healthcare trend inflation assumption such that the product of the projected subsidy and projected members is less than the projected aggregated capped costs; and the member's share of plan costs is expected remain stable as a percentage of total costs following the year that the program is fully funded. After 2037, the program is projected to be fully funded and the sponsor is assumed to contribute the residual portion of normal cost and operational expenses needed to maintain a funded ratio of 100% in future years. In addition, after 2035, the member's share of total plan costs is assumed to remain stable at approximately 61% of total plan costs. These assumptions produced per member annual capped subsidy increases of 3.0% per year from 2018 to 2023 and 4.5% per year after 2023.
Members hired on or after July 1, 2010, are required to pay 100% of expected cost of coverage, resulting in no implicit or explicit employer cost. Consequently, these members are excluded from the actuarial valuation.
Subsequent event
Subsequent to the June 30, 2018, measurement date, on August 21, 2018 RHBT executed a contract renewal with Humana’s Medicare Advantage Plan (Humana MAPD) for the Plan years 2019 and 2020. This renewal included reduced per member per month capitation costs which decreased from $224 to $175 per member per month, due to favorable experience and the removal of the health insurance fee.
The estimated impact of these reduced rates is not recognized in the estimated net OPEB liability measured at June 30, 2018, since the contract was executed subsequent to the measurement date. Per GASB Statement 75, if a change occurs in a factor relevant to measurement of the net OPEB liability between the measurement date of the net OPEB liability and the employer’s current fiscal year-end, the employer should report the effect on the net OPEB liability of that change as of the next measurement date. The estimated impact of the reduced capitation rates on the net OPEB liability is a decrease of approximately 9.0%, or $280 million, which will be considered in the next actuarial valuation estimating the net OPEB liability measured as of June 30, 2019. The future actuarial measurement may differ significantly from this estimate due to various other factors such as the following: plan experience differing from that anticipated by the economic or demographic assumptions; changes in economic or demographic assumptions due to changing conditions; increases or decreases expected as part of the natural operation of the methodology used for these measurements; and changes in plan provisions or applicable law.
Sensitivity of the Authority’s proportionate share of the net OPEB liability to changes in the discount rate
The following presents the Authority’s proportionate share of the net OPEB liability calculated using the current discount rate, as well as what the Authority’s proportionate share of the net OPEB liability would be if it were calculated using a discount rate that is 1-percentage point lower or 1-percentage-point higher than the current rate:

WEST VIRGINIA ECONOMIC DEVELOPMENT AUTHORITY
NOTES TO COMBINED FINANCIAL STATEMENTSJune 30, 2019
51
Note 15. Other Post Employment Benefits (OPEB) (Continued)
Sensitivity of the Authority’s proportionate share of the net OPEB liability to changes in the discount rate (continued)
1% Decrease(6.15%)
Current Discount Rate
(7.15%)1% Increase
(8.15%)
The Authority’s proportionate share of the net OPEB liability
$ 306,361 $ 260,666 $ 222,574
Sensitivity of the Authority’s proportionate share of net OPEB liability to changes in the healthcare cost trend rates.
The following presents the Authority’s proportionate share of the net OPEB liability, as well as what the Authority’s proportionate share of the net OPEB liability would be if it were calculated using healthcare cost trend rates that are 1-percentage-point lower or 1-percentage point higher than the current rates:
1% Decrease
Current Healthcare Cost Trend
Rates 1% Increase
The Authority’s proportionate share of the net OPEB liability
$ 215,687 $ 260,666 $ 315,471
Note 16. Conduit Debt Obligations
The Authority has issued Industrial Development Revenue Bonds and Residential Care Facility First Mortgage Revenue Bonds to provide financial assistance to private-sector and governmental entities for the acquisition and construction of commercial and residential care facilities deemed to be in the public interest. The Authority has also issued Revenue Bonds to provide financial assistance to state and local governmental entities for the acquisition and construction of facilities deemed to be in the public interest. All of the bonds are secured by the property financed and revenues generated with the bond proceeds and are payable solely from payments received on the underlying obligations. Upon repayment of the bonds, ownership of the acquired facilities transfers to the private-sector or governmental entity served by the bond issuance. The Authority, nor any political subdivision thereof is obligated in any manner for repayment of the bonds. Accordingly, the bonds are not reported as liabilities of the Authority in the accompanying financial statements.
As of June 30, 2019 and 2018, there were 49 and 48 revenue bonds, respectively with principal amounts payable consisting of the following:
2019 2018
Bonds backed by leases with other State agencies $ 551,796,811 $ 527,125,127Other bonds outstanding 2,983,800,340 2,101,285,805
$ 3,535,597,151 $ 2,628,410,932

WEST VIRGINIA ECONOMIC DEVELOPMENT AUTHORITY
NOTES TO COMBINED FINANCIAL STATEMENTSJune 30, 2019
52
Note 17. New Accounting Pronouncements
The GASB has issued the following accounting pronouncements which are not yet effective.
The GASB issued Statement No. 84, Fiduciary Activities in January 2017. This Statement establishes standards of accounting and financial reporting for fiduciary activities. The requirements of this Statement are effective for periods beginning after December 15, 2018.
The GASB has also issued Statement No. 87, Leases, which improves accounting and financial reporting for leases by governments. This Statement increases the usefulness of government’s financial statements by requiring recognition of certain lease assets and liabilities for leases that previously were classified as operating leases and recognized as inflows of resources or outflows of resources based on the payment provisions of the contract. It establishes a single model for lease accounting based on the foundational principle that leases are financings of the right to use an underlying asset. Under this Statement, a lessee is required to recognize a lease liability and an intangible right-to-use lease asset, and a lessor is required to recognize a lease receivable and a deferred inflow of resources. The requirements of this statement are effective for reporting periods beginning after December 15, 2019. The Authority’s management has not determined the effect this statement will have on its financial statements.
The GASB issued Statement No. 90, Majority Equity Interests, an amendment of GASB Statements No. 14 and No. 61 in August 2018. This Statement improves the consistency and comparability of reporting a government’s majority equity interest in a legally separate organization and improves the relevance of financial statement information for certain component units. The requirements of this Statement are effective for periods beginning after December 15, 2018. The requirements should be applied retroactively, except for the provisions related to (1) reporting a majority equity interest in a component unit and (2) reporting a component unit if the government acquires a 100 percent equity interest. Those provisions should be applied on a prospective basis.
The GASB issued Statement No. 91, Conduit Debt Obligations in May 2019. This Statement provides a single method of reporting conduit debt obligations by issuers and eliminates diversity in practice associated with (1) commitments extended by issuers, (2) arrangements associated with conduit debt obligations, and (3) related note disclosures. The requirements of this Statement are effective for reporting periods beginning after December 15, 2020.
Management has not determined the effects these new accounting pronouncements may have on itsfinancial statements.

REQUIRED SUPPLEMENTARY INFORMATION

WEST VIRGINIA ECONOMIC DEVELOPMENT AUTHORITY
SCHEDULE OF THE PROPORTIONATE SHARE OF THE NET PENSION LIABILITY
Public Employees Retirement System Plan
See Independent Auditor’s Report and accompanying notes to Required Supplementary Information53
Year Ended June 30
2019 2018 2017 2016 2015
West Virginia Economic Development Authority's proportion 0.045977% 0.045458% 0.044215% 0.044515% 0.042673%
(percentage) of the net pension liability
West Virginia Economic Development Authority's proportionate 118,736$ 196,216$ 406,384$ 248,573$ 157,492$
share of the net pension liability
West Virginia Economic Development Authority's covered payroll 637,500$ 626,980$ 609,274$ 603,684$ 571,445$
West Virginia Economic Development Authority's proportionate share of the
net pension liability as a percentage of its covered payroll 18.63% 31.30% 66.70% 41.18% 27.56%
Plan fiduciary net position as a percantage of the total pension liability 96.33% 93.67% 86.11% 91.29% 93.98%
Note: All amounts presented are as of the measurement date,
which is one year prior to the fiscal year end date.

WEST VIRGINIA ECONOMIC DEVELOPMENT AUTHORITY
SCHEDULE OF CONTRIBUTIONS TO THE PERS
See Independent Auditor’s Report and accompanying notes to Required Supplementary Information54
Year Ended June 30
2019 2018 2017 2016 2015 2014 2013
Statutorily required contribution 57,117$ 70,118$ 75,237$ 82,252$ 84,516$ 82,859$ 77,531$
Contributions in relation to the statutorily
required contribution 57,117 70,118 75,237 82,252 84,516 82,859 77,531
Contribution defiency (excess) -$ -$ -$ -$ -$ -$ -$
West Virginia Economic Development Authority's
covered payroll 571,080$ 637,500$ 626,980$ 609,274$ 603,684$ 571,445$ 553,778$
Contributions as a percentage of covered-employee
payroll 10.00% 11.00% 12.00% 13.50% 14.00% 14.50% 14.00%

WEST VIRGINIA ECONOMIC DEVELOPMENT AUTHORITY
SCHEDULE OF PROPORTIONATE SHARE OF THE NET OPEB LIABILITY
Retiree Health Benefit Trust
See Independent Auditor’s Report and accompanying notes to Required Supplementary Information55
Year Ended June 30
2019 2018
West Virginia Economic Development Authority's proportion 0.012149% 0.020135%
(percentage) of the net OPEB liability
West Virginia Economic Development Authority's proportionate 260,666$ 495,130$
share of the net OPEB liability
West Virginia's special funding proportionate share of the net OPEB 53,873$ 101,700$
liability associated with the Authority
Total portion of the net OPEB liability associated with the Authority 314,539$ 596,830$
West Virginia Economic Development Authority's covered-employee payroll 568,260$ 577,507$
West Virginia Economic Development Authority's proportionate share of the
net OPEB liability as a percentage of its covered-employee payroll 45.87% 85.74%
Plan fiduciary net position as a percantage of the total OPEB liability 30.98% 25.10%
Note: All amounts presented are as of the measurement date,
which is one year prior to the fiscal year end date.

WEST VIRGINIA ECONOMIC DEVELOPMENT AUTHORITY
SCHEDULE OF CONTRIBUTIONS TO THE RHBT
See Independent Auditor’s Report and accompanying notes to Required Supplementary Information56
Year Ended June 30
2019 2018 2017
Required contribution 19,733$ 26,930$ 41,358$
Contributions in relation to the required contribution 19,733 26,930 41,358
Contribution defiency (excess) -$ -$ -$
West Virginia Economic Development Authority's covered-employee payroll 525,351$ 568,260$ 577,507$
Contributions as a percentage of covered-employee payroll 3.76% 4.74% 7.16%

WEST VIRGINIA ECONOMIC DEVELOPMENT AUTHORITY
NOTES TO REQUIRED SUPPLEMENTARY INFORMATION
57
Note 1. Trend Information Presented
The accompanying schedules of the West Virginia Economic Development Authority’s proportionate share of the net OPEB and pension liabilities and contributions to RHBT and PERS are required supplementary information to be presented for 10 years. However, until a full 10 year trend is compiled, information is presented in the schedules for those years for which information is available.
Note 2. OPEB Changes in Assumptions
Below are changes in assumptions between the 2017 and 2016 valuations:
The assumption changes that most significantly impacted the Net OPEB Liability are as follows: the inclusion of waived annuitants increased the liability by approximately $17 million; a 15% reduction in the retirement rate assumption decreased the liability by approximately $68 million; a change in certain healthcare-related assumptions decreased the liability by approximately $232 million; and an update to the mortality tables increased the liability by approximately $25 million. Certain other assumption changes were noted but did not materially impact the Net OPEB Liability.
Below are changes in the assumptions between the 2016 and 2015 valuations:
Certain economic and behavioral assumptions are unique to healthcare benefits. These assumptions include the healthcare trend, per capita claims costs, the likelihood that a member selects healthcare coverage and the likelihood that a retiree selects one-person, two person or family coverage. These assumptions were updated based on a recent experience study performed by the RHBT actuaries using five-year experience data through June 30, 2015. The updated per capita claims costs were also based on recent claims, enrollment and premium information as of the valuation date.
For the June 30, 2016 valuation, the retiree healthcare participation assumption for each retirement plan is slightly higher than the previous assumption used in the June 30, 2015 OPEB valuation. More members who were covered as actives will be assumed to participate as retirees.
The 2016 and 2015 valuations include consideration of the $30 million annual appropriations under Senate Bill 419, through July 1, 2037, or if earlier, the year the benefit obligation is fully funded. Additionally, the presentation of covered payroll was changed for the June 30, 2015, actuarial valuation. Participating employees hired before July 1, 2010, pay retiree premiums that are subsidized based on years of service at retirement. Participating employees hired on or after July 1, 2010, are required to fully fund premium contributions upon retirement. Consequently, beginning June 30, 2015, actuarial valuation covered payroll represents only the payroll for those OPEB eligible participating employees that were hired before July 1, 2010, allowing a better representation of the UAAL as a percentage of covered payroll, whereas, for the prior years, covered payroll is in total for all participating employees.

WEST VIRGINIA ECONOMIC DEVELOPMENT AUTHORITY
NOTES TO REQUIRED SUPPLEMENTARY INFORMATION
(Continued)58
Note 3. Plan Plan Amendment
The PERS was amended to make changes which apply to benefits earned by new employees hired July 1, 2015 and later as follows:
For employees hired prior to July 1, 2015, qualification for normal retirement is age 60 withfive years of service or at least age 55 with age and service equal to 80 or greater. A membermay retire with the pension reduced actuarially if the member is at least age 55 and has atleast 10 years of contributory service, or at any age with 30 years of contributory service.For employees hired July 1, 2015 and later, qualification for normal retirement is 62 with 10years of service. A member hired after July 1, 2015 may retire with the pension reducedactuarially if the member is between ages 60 and 62 with at least ten years of contributoryservice, between the ages of 57 and 62 with at least twenty years of contributory service, orbetween the ages 55 and 62 with at least thirty years of contributory service.
The straight life annuity retirement benefit is equivalent to 2% of average salary multipliedby years of service. For employees hired prior to July 1, 2015, average salary is the averageof the three consecutive highest annual earnings out of the last fifteen years of earnings. Forall employees hired July 1, 2015 and later, average salary is the average of the fiveconsecutive highest annual earnings out of the last fifteen years of earnings.
For employees hired prior to July 1, 2015, terminated members with at least five years ofcontributory service who do not withdraw their accumulated contributions may elect toreceive their retirement annuity beginning at age 62. For all employees hired July 1, 2015and later, this age increases to 64 with at least ten years of contributory service, or age 63with at least twenty years of contributory service.
For all employees hired prior to July 1, 2015, employees are required to contribute 4.5% ofannual earnings. All employees hired July 1, 2015 and later, are required to contribute 6%of annual earnings.
Note 4. Pension Plan Assumptions
An experience study, which was based on the years 2009 through 2014, was completed prior to the 2015 actuarial valuation. As a result, several assumptions were changed for the actuarial valuations as follows:
2015 - 2018 2014
Projected salary increases:State 3.0-4.6% 4.25-6.0%Nonstate 3.35-6.0% 4.25-6.0%
Inflation rate 3.0% (2016-2018) ; 1.9% (2015) 2.2%Mortality rates Active RP
2000 Non-Annuitant, Scale AAfully generational
Retired healthy males – 110% of RP- Healthy males – 1983 GAM200 Non-Annuitant, Scale AAfully generational Healthy females – 1971 GAM

WEST VIRGINIA ECONOMIC DEVELOPMENT AUTHORITY
NOTES TO REQUIRED SUPPLEMENTARY INFORMATION
59
Note 4. Pension Plan Assumptions (Continued)
2015 - 2018 2014
Retired healthy females - 101% of RP- Disabled males - 1971 GAM 2000 Non-Annuitant, Scale AA fully generational Disabled females - Revenue Disabled males - 96% of RP-2000 ruling 96-7 Disabled Annuitant, Scale AA fully generational Disabled females -107% of RP-2000 Disabled Annuitant, Scale AA fully generational
Withdrawal ratesState 1.75-35.1% 1 - 26%Non-state 2-35.8% 2 - 31.2%
Disability rates 0 - .675% 0 - .8%

Your Success is Our Focus
300 Chase Tower, 707 Virginia Street, East • Charleston, WV 25301 • 304-343-4188 • Fax: 304-344-5035 • www.BEcpas.com
INDEPENDENT AUDITOR’S REPORT ON INTERNAL CONTROL OVER FINANCIAL REPORTING AND ON COMPLIANCE AND OTHER MATTERS BASED ON AN AUDIT
OF FINANCIAL STATEMENTS PERFORMED IN ACCORDANCE WITH GOVERNMENT AUDITING STANDARDS
To the Board of Directors West Virginia Economic Development Authority Charleston, West Virginia
We have audited, in accordance with the auditing standards generally accepted in the United States of America and the standards applicable to financial audits contained in Government Auditing Standards, issued by the Comptroller General of the United States, the combined financial statements of the West Virginia Economic Development Authority (the Authority), a component unit of the State of West Virginia, as of and for the year ended June 30, 2019, and the related notes to the combined financial statements, which collectively comprise the Authority’s basic financial statements, and have issued our report thereon dated September 26, 2019.
Internal Control over Financial Reporting
In planning and performing our audit of the combined financial statements, we considered the Authority’s internal control over financial reporting (internal control) to determine the audit procedures that are appropriate in the circumstances for the purpose of expressing our opinion on the combined financial statements, but not for the purpose of expressing an opinion on the effectiveness of the Authority’s internal control. Accordingly, we do not express an opinion on the effectiveness of the Authority’s internal control.
A deficiency in internal control exists when the design or operation of a control does not allow management or employees, in the normal course of performing their assigned functions, to prevent, or detect and correct misstatements on a timely basis. A material weakness is a deficiency, or a combination of deficiencies, in internal control, such that there is a reasonable possibility that a material misstatement of the entity’s financial statements will not be prevented, or detected and corrected on a timely basis. A significant deficiency is a deficiency, or a combination of deficiencies, in internal control that is less severe than a material weakness, yet important enough to merit attention by those charged with governance.
Our consideration of internal control was for the limited purpose described in the first paragraph of this section and was not designed to identify all deficiencies in internal control that might be material weaknesses, or significant deficiencies. Given these limitations, during our audit we did not identify any deficiencies in internal control that we consider to be material weaknesses. However material weaknesses may exist that have not been identified.

61
Compliance and Other Matters As part of obtaining reasonable assurance about whether the Authority’s financial statements are free from material misstatement, we performed tests of its compliance with certain provisions of laws, regulations, contracts, and grant agreements, noncompliance with which could have a direct and material effect on the determination of financial statement amounts. However, providing an opinion on compliance with those provisions was not an objective of our audit, and accordingly, we do not express such an opinion. The results of our tests disclosed no instances of noncompliance or other matters that are required to be reported under Government Auditing Standards. Purpose of this Report The purpose of this report is solely to describe the scope of our testing of internal control and compliance and the results of that testing, and not to provide an opinion on the effectiveness of the entity’s internal control or on compliance. This report is an integral part of an audit performed in accordance with Government Auditing Standards in considering the entity’s internal control and compliance. Accordingly, this communication is not suitable for any other purpose.
CERTIFIED PUBLIC ACCOUNTANTS Charleston, West Virginia September 26, 2019