west pokot county smart survey preliminary findings may,2012
TRANSCRIPT
WEST POKOT COUNTY
SMART SURVEYPRELIMINARY FINDINGS
MAY,2012
OBJECTIVES OF WEST POKOT SMART SURVEY
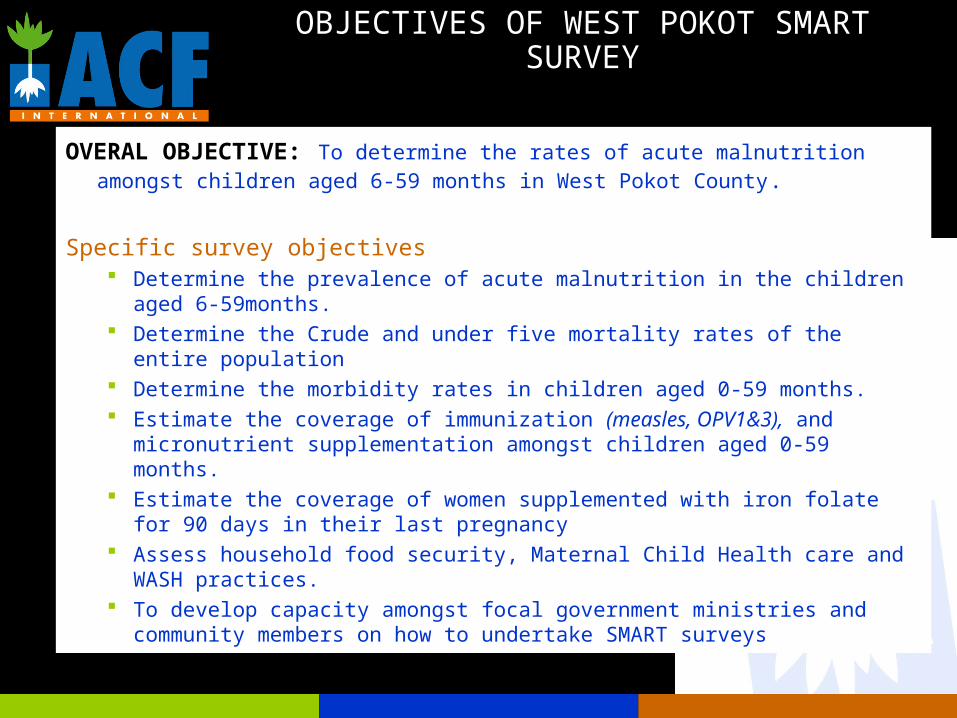
OVERAL OBJECTIVE: To determine the rates of acute malnutrition amongst children aged 6-59 months in West Pokot County.
Specific survey objectives Determine the prevalence of acute malnutrition in the children aged 6-59months. Determine the Crude and under five mortality rates of the entire population Determine the morbidity rates in children aged 0-59 months. Estimate the coverage of immunization (measles, OPV1&3), and micronutrient
supplementation amongst children aged 0-59 months. Estimate the coverage of women supplemented with iron folate for 90 days in their last
pregnancy Assess household food security, Maternal Child Health care and WASH practices. To develop capacity amongst focal government ministries and community members on
how to undertake SMART surveys
SURVEY AREA COVERED
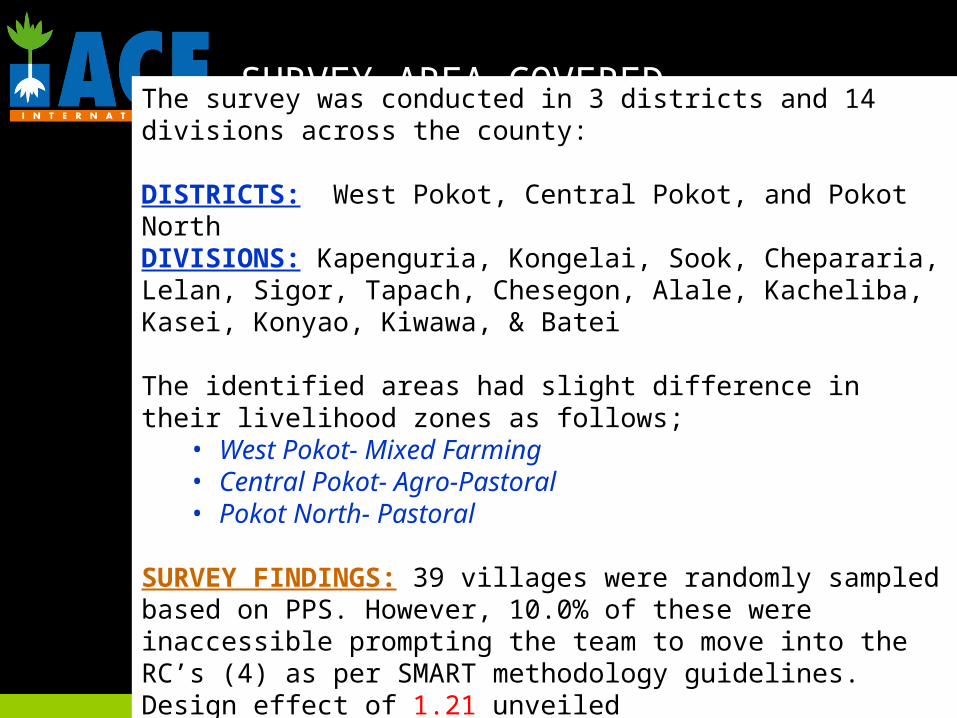
The survey was conducted in 3 districts and 14 divisions across the county:
DISTRICTS: West Pokot, Central Pokot, and Pokot North DIVISIONS: Kapenguria, Kongelai, Sook, Chepararia, Lelan, Sigor, Tapach, Chesegon, Alale, Kacheliba, Kasei, Konyao, Kiwawa, & Batei
The identified areas had slight difference in their livelihood zones as follows;• West Pokot- Mixed Farming• Central Pokot- Agro-Pastoral• Pokot North- Pastoral
SURVEY FINDINGS: 39 villages were randomly sampled based on PPS. However, 10.0% of these were inaccessible prompting the team to move into the RC’s (4) as per SMART methodology guidelines. Design effect of 1.21 unveiled
SAMPLING DESIGN
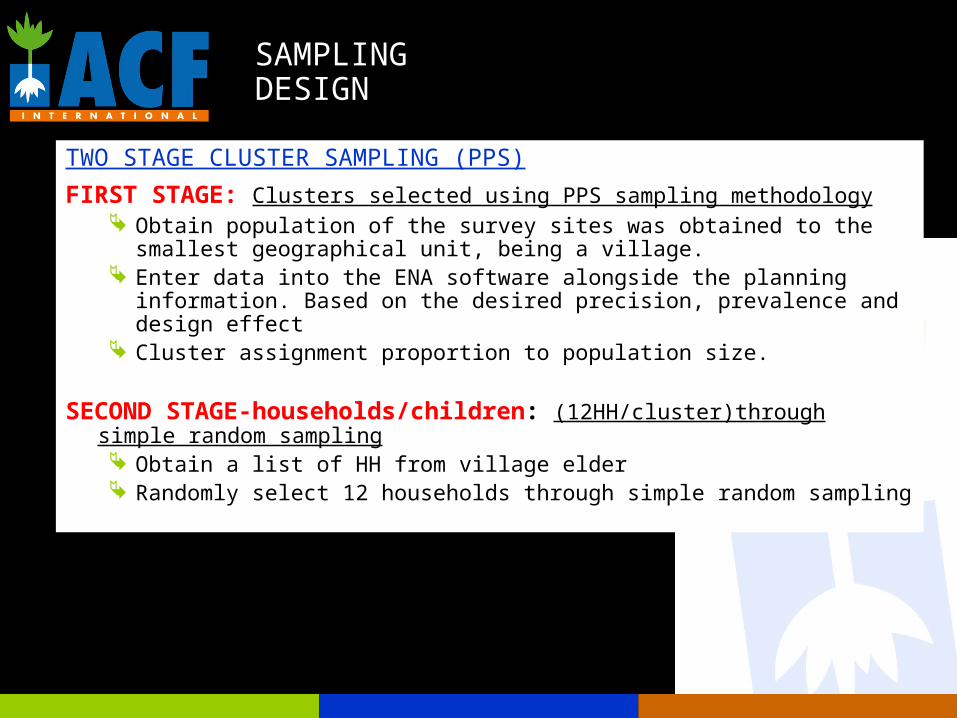
TWO STAGE CLUSTER SAMPLING (PPS)
FIRST STAGE: Clusters selected using PPS sampling methodology Obtain population of the survey sites was obtained to the smallest geographical unit,
being a village. Enter data into the ENA software alongside the planning information. Based on the
desired precision, prevalence and design effect Cluster assignment proportion to population size.
SECOND STAGE-households/children: (12HH/cluster)through simple random sampling Obtain a list of HH from village elder Randomly select 12 households through simple random sampling
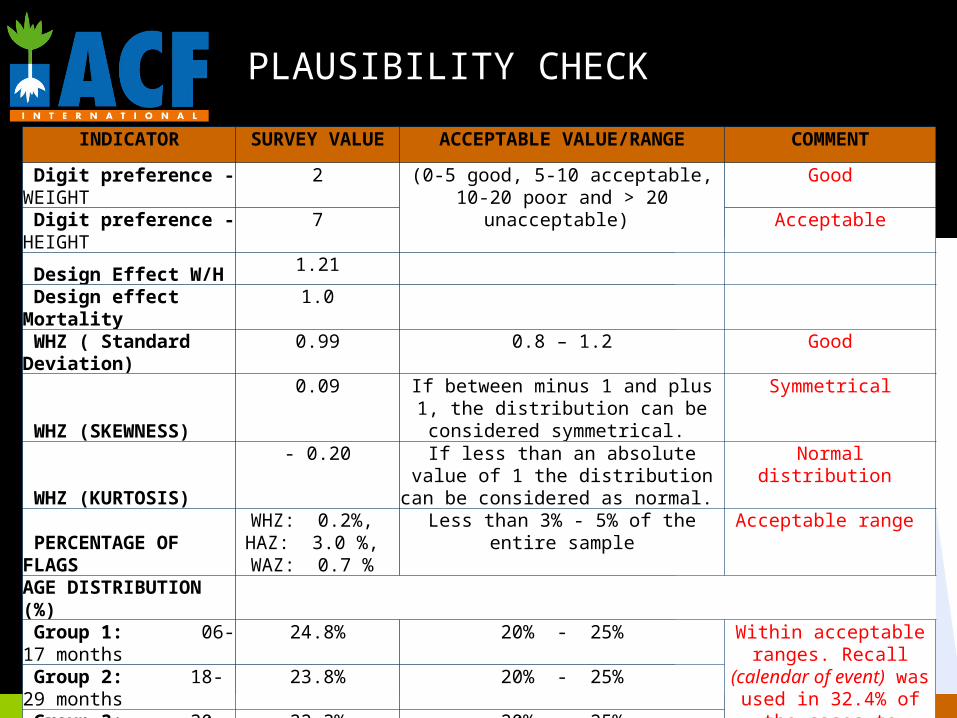
PLAUSIBILITY CHECK
INDICATOR SURVEY VALUE ACCEPTABLE VALUE/RANGE COMMENT
Digit preference - WEIGHT 2 (0-5 good, 5-10 acceptable, 10-20 poor and > 20 unacceptable)
Good
Digit preference - HEIGHT 7 Acceptable
Design Effect W/H 1.21
Design effect Mortality1.0
WHZ ( Standard Deviation) 0.99 0.8 – 1.2 Good
WHZ (SKEWNESS)
0.09 If between minus 1 and plus 1, the distribution can be considered
symmetrical.
Symmetrical
WHZ (KURTOSIS)
- 0.20 If less than an absolute value of 1 the distribution can be considered as normal.
Normal distribution
PERCENTAGE OF FLAGS
WHZ: 0.2%, HAZ: 3.0 %, WAZ: 0.7 %
Less than 3% - 5% of the entire sample Acceptable range
AGE DISTRIBUTION (%)
Group 1: 06-17 months 24.8% 20% - 25% Within acceptable ranges. Recall (calendar of event) was used in 32.4% of the cases to estimate ages of
children
Group 2: 18-29 months 23.8% 20% - 25% Group 3: 30-41 months 22.3% 20% - 25% Group 4: 42-53 months 20.3% 20% - 25%
Group 5: 54-59 months 8.8% 10.0%
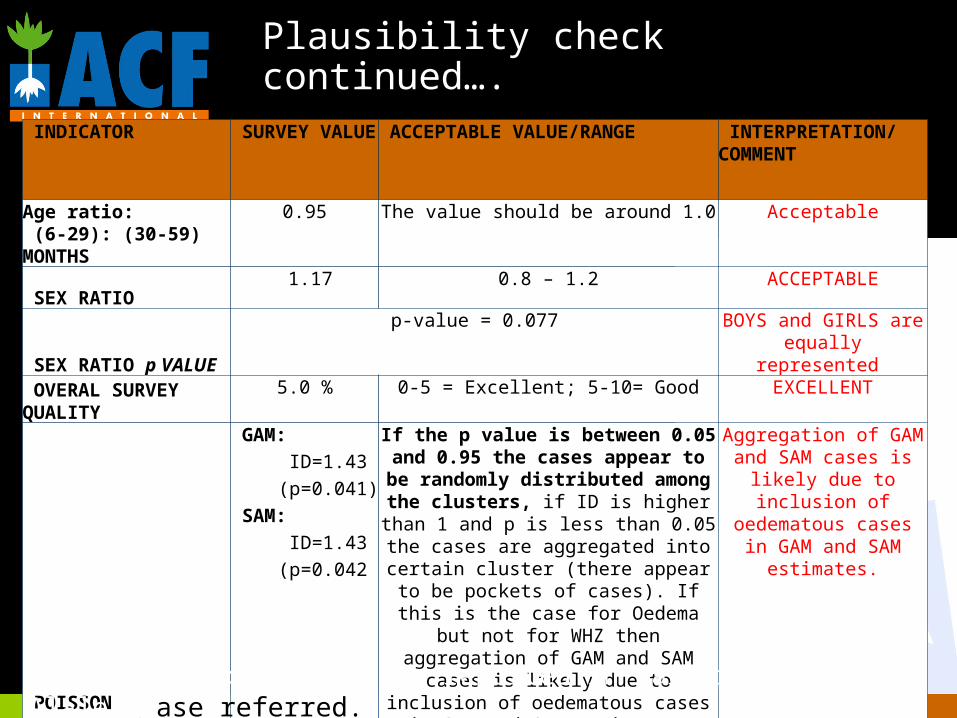
Plausibility check continued…. INDICATOR SURVEY VALUE ACCEPTABLE VALUE/RANGE INTERPRETATION/
COMMENT
Age ratio: (6-29): (30-59) MONTHS
0.95 The value should be around 1.0 Acceptable
SEX RATIO 1.17 0.8 – 1.2 ACCEPTABLE
SEX RATIO p VALUEp-value = 0.077 BOYS and GIRLS are equally
represented
OVERAL SURVEY QUALITY5.0 % 0-5 = Excellent; 5-10= Good EXCELLENT
POISSON DISTRIBUTION
GAM: ID=1.43
(p=0.041) SAM:
ID=1.43 (p=0.042
If the p value is between 0.05 and 0.95 the cases appear to be randomly distributed among the clusters, if ID is higher than 1
and p is less than 0.05 the cases are aggregated into certain cluster (there
appear to be pockets of cases). If this is the case for Oedema but not for WHZ then
aggregation of GAM and SAM cases is likely due to inclusion of oedematous cases in
GAM and SAM estimates.
Aggregation of GAM and SAM cases is likely due to inclusion of oedematous cases in GAM and SAM
estimates.
One confirmed oedema case reported in Naruoro, Alale. Case referred.
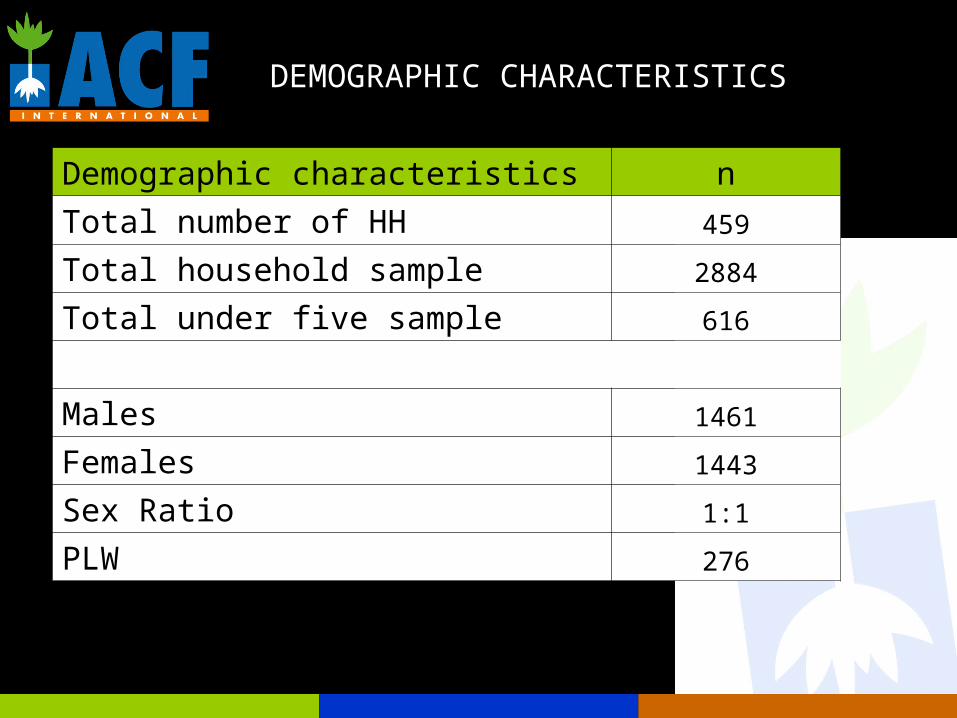
DEMOGRAPHIC CHARACTERISTICS
Demographic characteristics nTotal number of HH 459
Total household sample 2884
Total under five sample 616
Males 1461
Females 1443
Sex Ratio 1:1
PLW 276
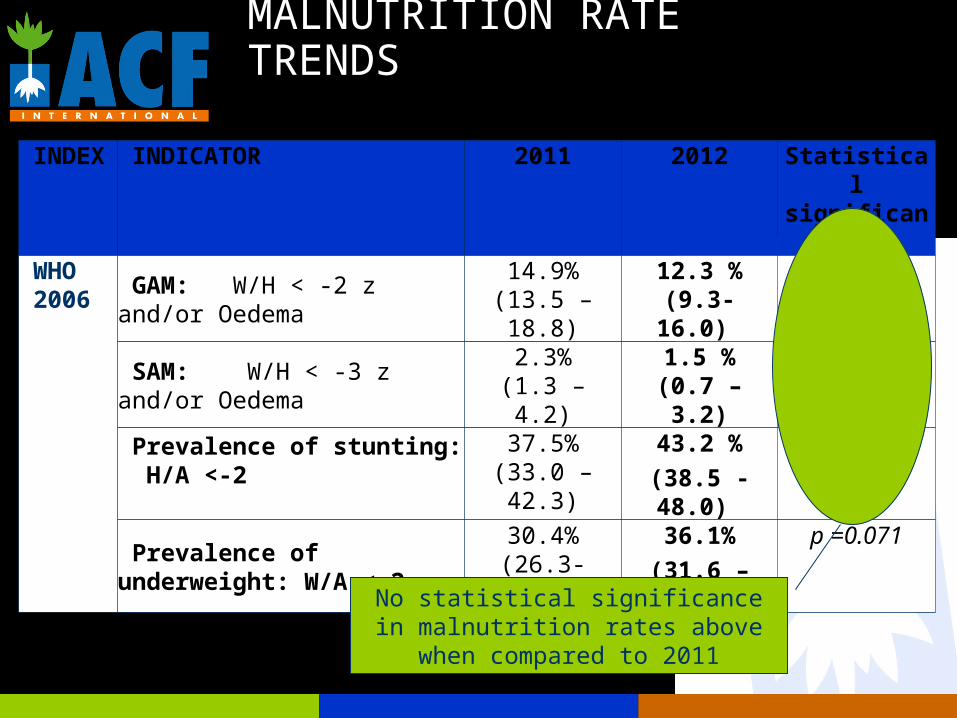
MALNUTRITION RATE TRENDS
INDEX INDICATOR 2011 2012 Statistical significance
WHO 2006
GAM: W/H < -2 z and/or Oedema14.9%
(13.5 – 18.8)12.3 %
(9.3- 16.0) p =0.144
SAM: W/H < -3 z and/or Oedema2.3%
(1.3 – 4.2)1.5 %
(0.7 – 3.2)p =0.325
Prevalence of stunting: H/A <-2 37.5%(33.0 – 42.3)
43.2 %
(38.5 - 48.0)
p =0.086
Prevalence of underweight: W/A <-230.4%
(26.3- 34.9)36.1%
(31.6 – 40.9)
p =0.071
No statistical significance in malnutrition rates above when compared to 2011
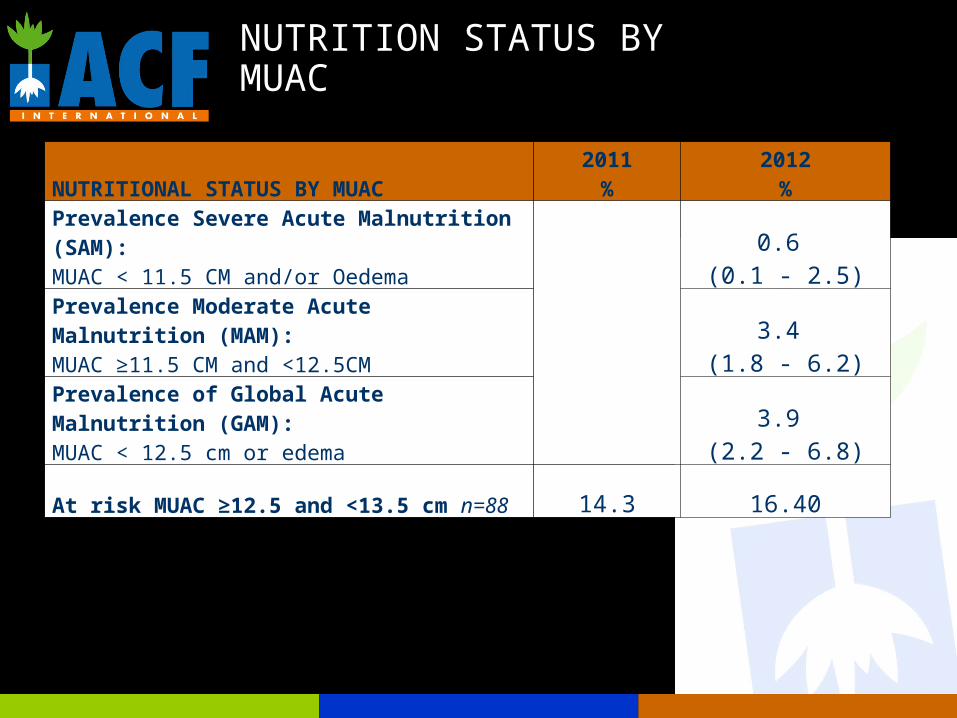
NUTRITION STATUS BY MUAC
NUTRITIONAL STATUS BY MUAC2011
%2012
%
Prevalence Severe Acute Malnutrition (SAM): MUAC < 11.5 CM and/or Oedema
0.6 (0.1 - 2.5)
Prevalence Moderate Acute Malnutrition (MAM): MUAC ≥11.5 CM and <12.5CM
3.4 (1.8 - 6.2)
Prevalence of Global Acute Malnutrition (GAM): MUAC < 12.5 cm or edema
3.9 (2.2 - 6.8)
At risk MUAC ≥12.5 and <13.5 cm n=88 14.3 16.40
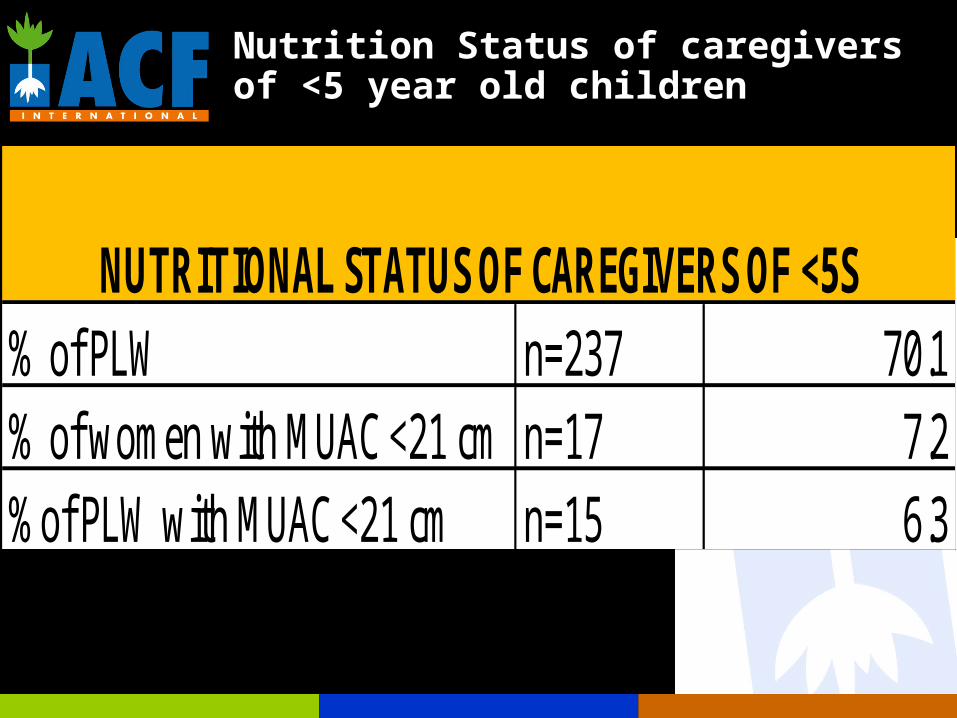
Nutrition Status of caregivers of <5 year old children
% of PLW n=237 70.1% of women with MUAC <21 cm n=17 7.2%of PLW with MUAC <21 cm n=15 6.3
NUTRITIONAL STATUS OF CAREGIVERS OF <5S
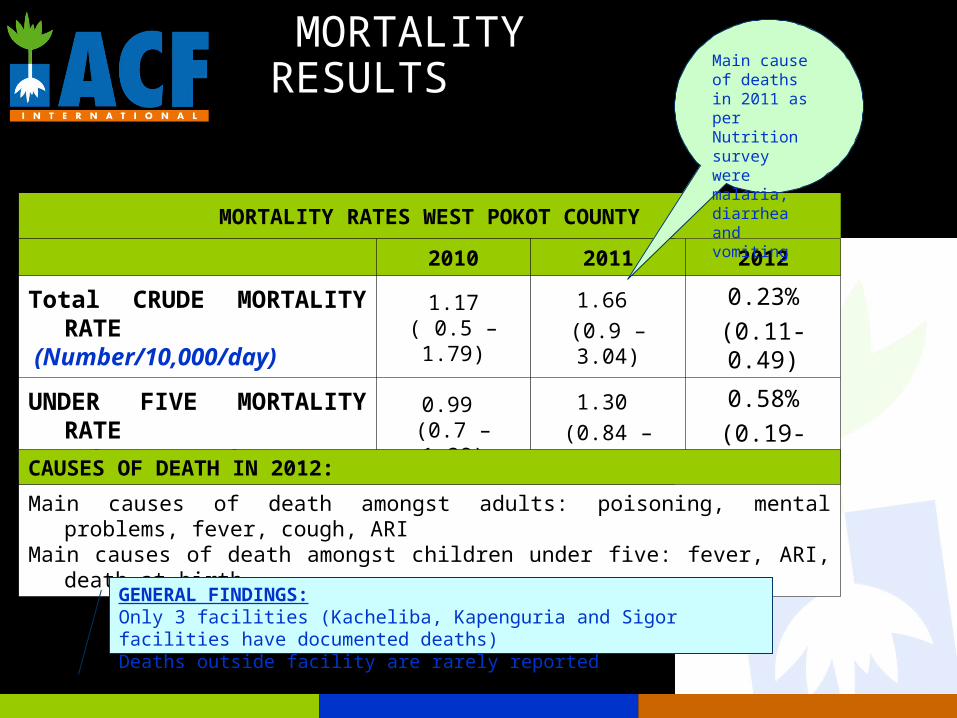
MORTALITY RESULTS
MORTALITY RATES WEST POKOT COUNTY
2010 2011 2012
Total CRUDE MORTALITY RATE (Number/10,000/day)
1.17( 0.5 – 1.79)
1.66 (0.9 – 3.04)
0.23%(0.11-0.49)
UNDER FIVE MORTALITY RATE (Number/10,000/day)
0.99 (0.7 – 1.28)
1.30 (0.84 – 1.98)
0.58%(0.19-1.78)
CAUSES OF DEATH IN 2012:
Main causes of death amongst adults: poisoning, mental problems, fever, cough, ARI
Main causes of death amongst children under five: fever, ARI, death at birth
GENERAL FINDINGS:Only 3 facilities (Kacheliba, Kapenguria and Sigor facilities have documented deaths)Deaths outside facility are rarely reported
Main cause of deaths in 2011 as per Nutrition survey were malaria, diarrhea and vomiting
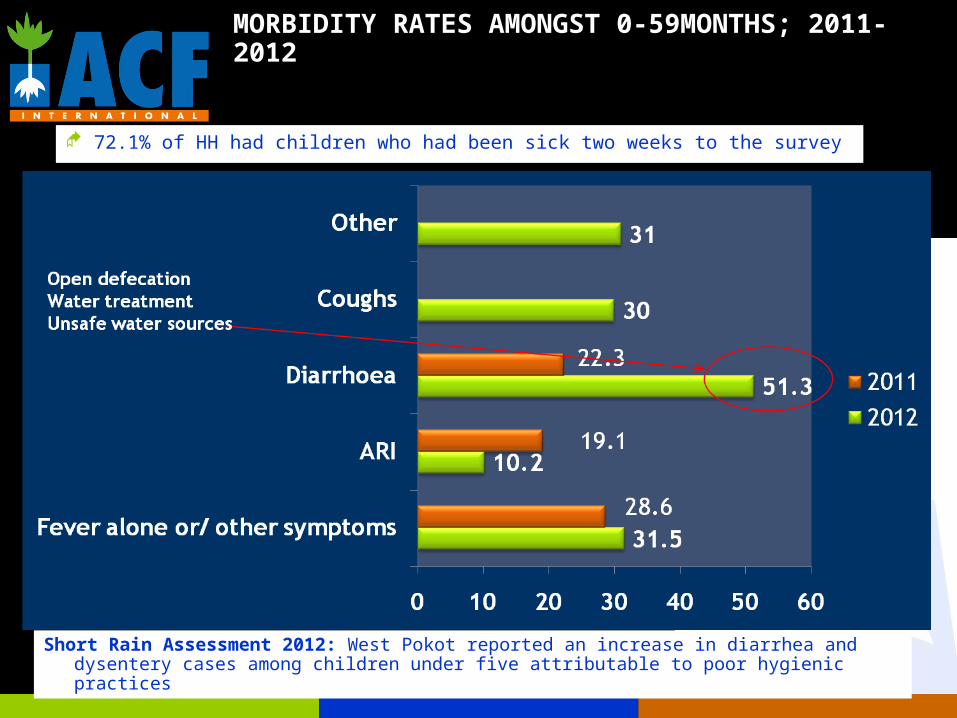
MORBIDITY RATES AMONGST 0-59MONTHS; 2011-2012
72.1% of HH had children who had been sick two weeks to the survey
Short Rain Assessment 2012: West Pokot reported an increase in diarrhea and dysentery cases among children under five attributable to poor hygienic practices
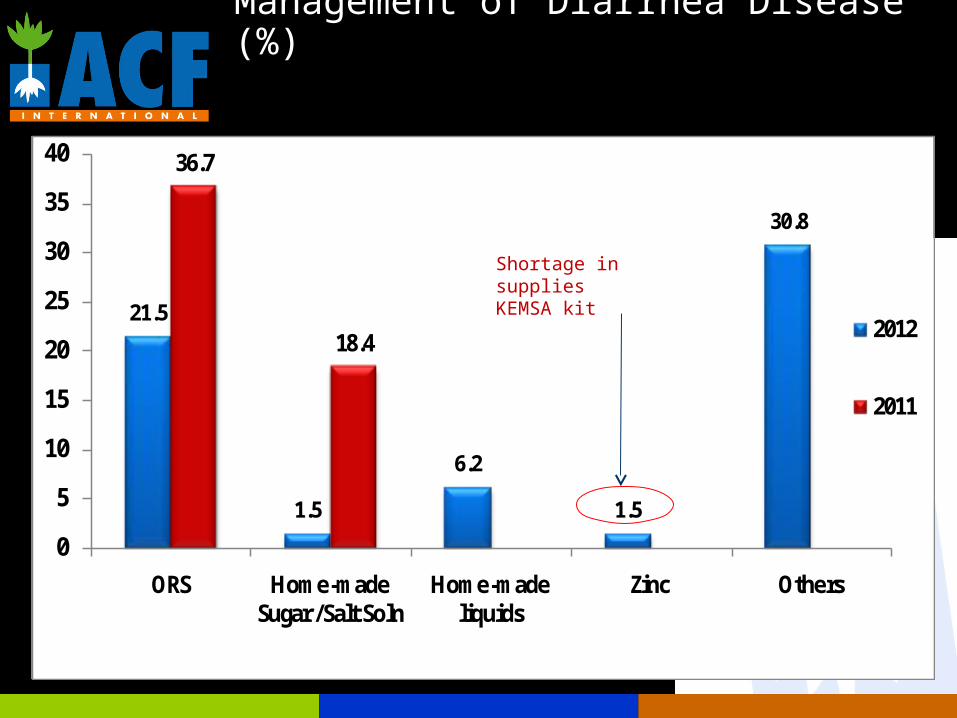
Management of Diarrhea Disease (%)
21.5
1.5
6.2
1.5
30.8
36.7
18.4
0
5
10
15
20
25
30
35
40
ORS Home-made Sugar /Salt Soln
Home-made liquids
Zinc Others
2012
2011
Shortage in suppliesKEMSA kit
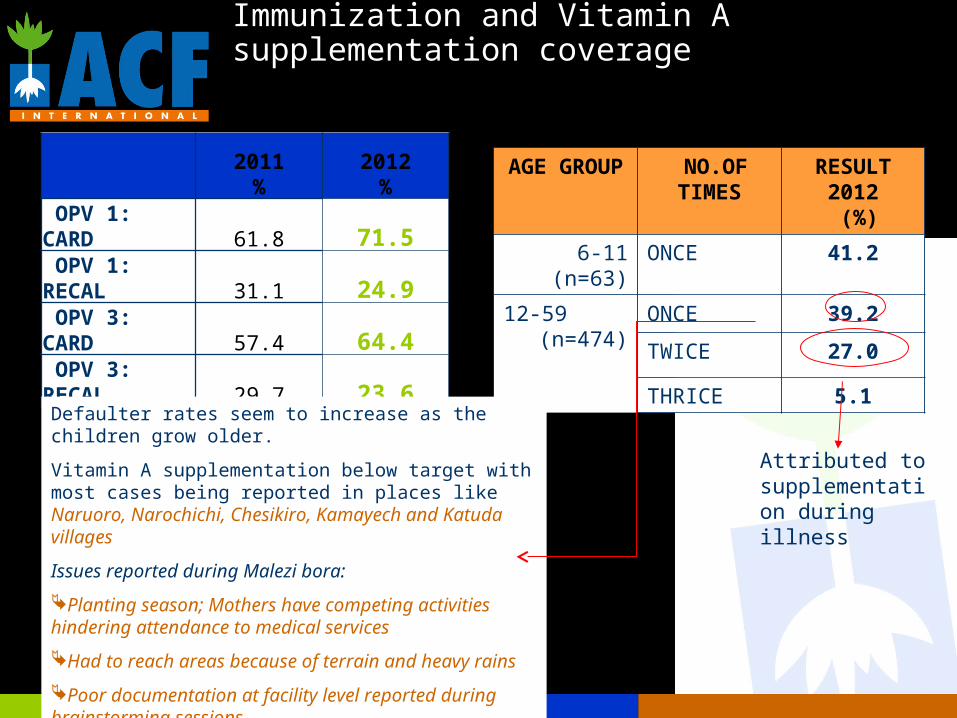
2011%
2012%
OPV 1: CARD 61.8 71.5
OPV 1: RECAL 31.1 24.9
OPV 3: CARD 57.4 64.4
OPV 3: RECAL 29.7 23.6
Immunization and Vitamin A supplementation coverage
AGE GROUP NO.OF TIMES RESULT 2012 (%)
6-11 (n=63) ONCE 41.2
12-59 (n=474)
ONCE 39.2
TWICE 27.0
THRICE 5.1
Defaulter rates seem to increase as the children grow older.
Vitamin A supplementation below target with most cases being reported in places like Naruoro, Narochichi, Chesikiro, Kamayech and Katuda villages
Issues reported during Malezi bora:
Planting season; Mothers have competing activities hindering attendance to medical services
Had to reach areas because of terrain and heavy rains
Poor documentation at facility level reported during brainstorming sessions
Attributed to supplementation during illness
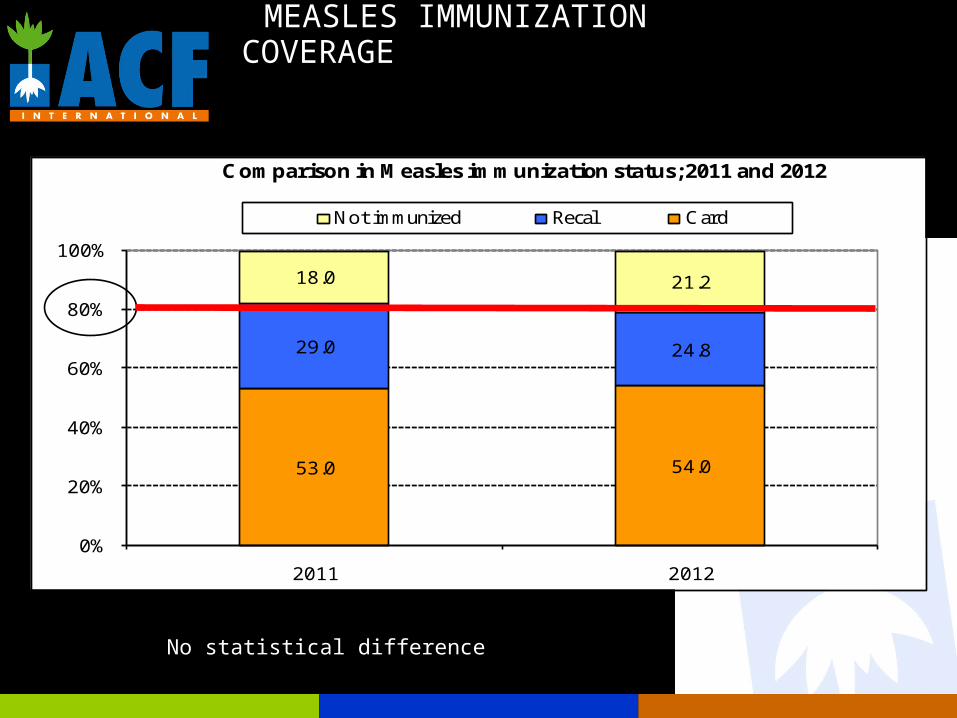
MEASLES IMMUNIZATION COVERAGE
53.0 54.0
29.0 24.8
18.0 21.2
0%
20%
40%
60%
80%
100%
2011 2012
Comparison in Measles immunization status; 2011 and 2012
Not immunized Recal Card
No statistical difference
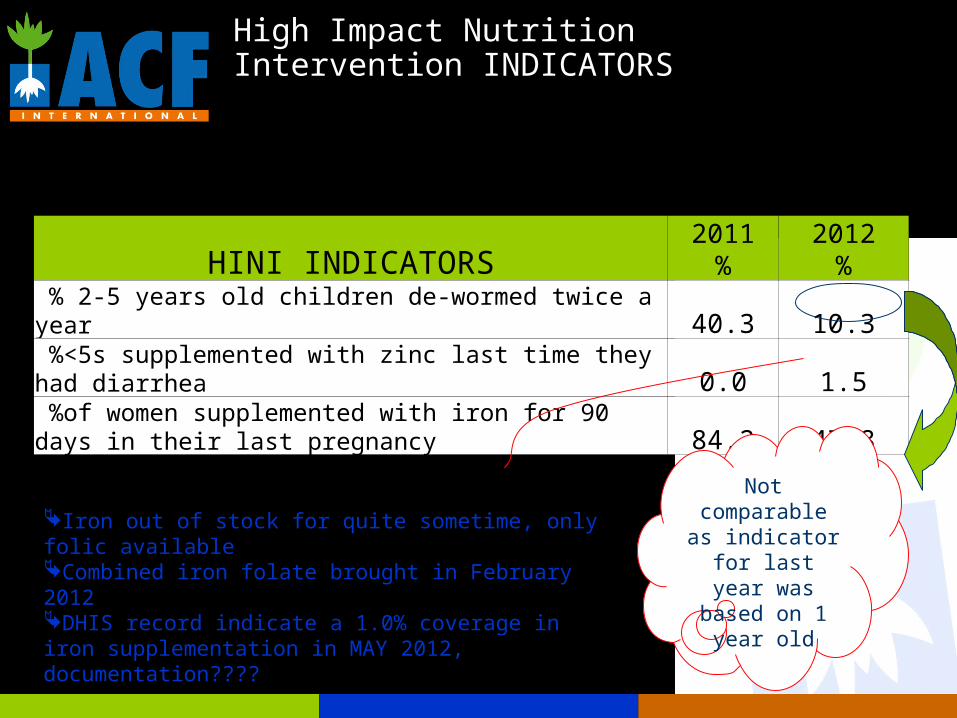
High Impact Nutrition Intervention INDICATORS
HINI INDICATORS2011
%2012
% % 2-5 years old children de-wormed twice a year 40.3 10.3 %<5s supplemented with zinc last time they had diarrhea 0.0 1.5 %of women supplemented with iron for 90 days in their last pregnancy 84.2 47.8
Iron out of stock for quite sometime, only folic availableCombined iron folate brought in February 2012DHIS record indicate a 1.0% coverage in iron supplementation in MAY 2012, documentation????
Not comparable as
indicator for last year was based on 1
year old
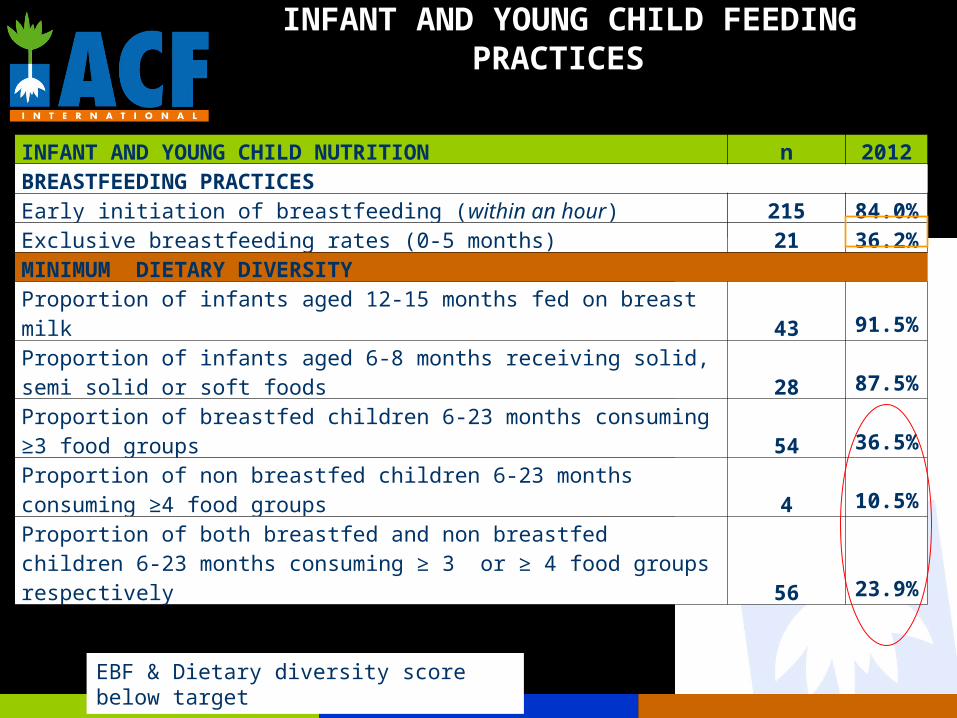
INFANT AND YOUNG CHILD FEEDING PRACTICES
INFANT AND YOUNG CHILD NUTRITION n 2012BREASTFEEDING PRACTICES
Early initiation of breastfeeding (within an hour) 21584.0
%
Exclusive breastfeeding rates (0-5 months) 2136.2
%MINIMUM DIETARY DIVERSITY
Proportion of infants aged 12-15 months fed on breast milk 4391.5
%
Proportion of infants aged 6-8 months receiving solid, semi solid or soft foods 28
87.5%
Proportion of breastfed children 6-23 months consuming ≥3 food groups 54
36.5%
Proportion of non breastfed children 6-23 months consuming ≥4 food groups 4
10.5%
Proportion of both breastfed and non breastfed children 6-23 months consuming ≥ 3 or ≥ 4 food groups respectively 56
23.9%
EBF & Dietary diversity score below target
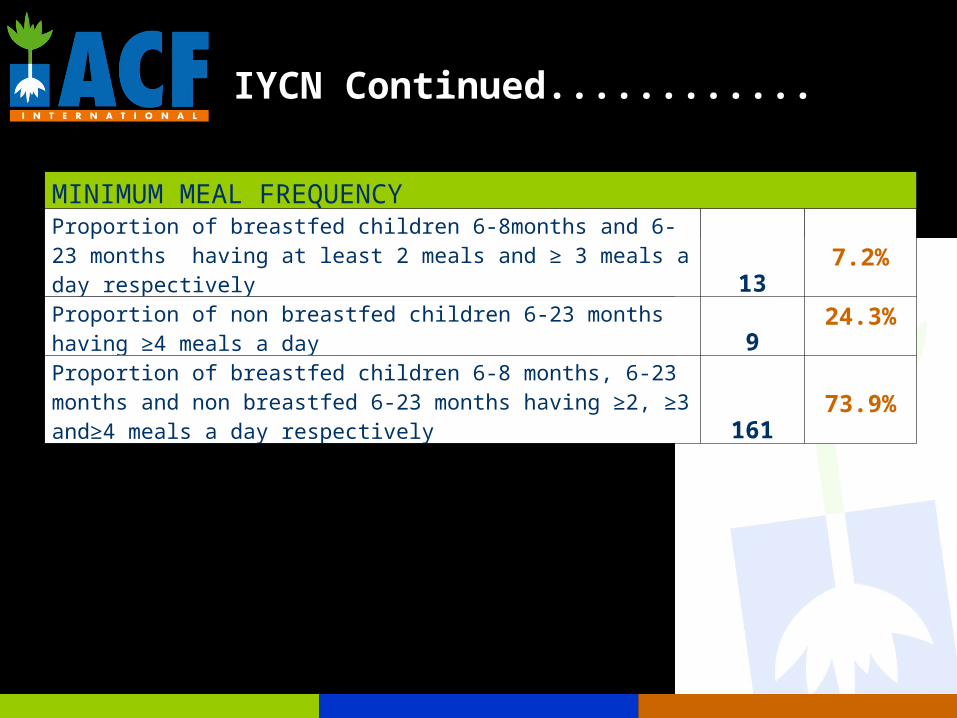
IYCN Continued............
MINIMUM MEAL FREQUENCY
Proportion of breastfed children 6-8months and 6- 23 months having at least 2 meals and ≥ 3 meals a day respectively 13 7.2%
Proportion of non breastfed children 6-23 months having ≥4 meals a day 9 24.3%
Proportion of breastfed children 6-8 months, 6-23 months and non breastfed 6-23 months having ≥2, ≥3 and≥4 meals a day respectively 161 73.9%
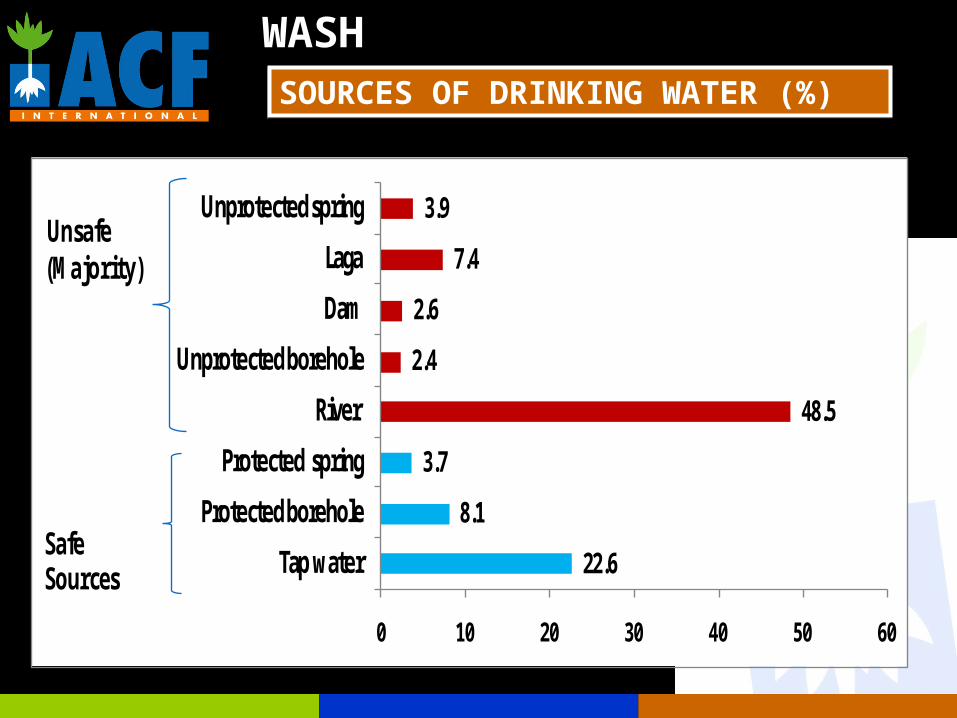
SOURCES OF DRINKING WATER (%)SOURCES OF DRINKING WATER (%)
WASH
22.6
8.1
3.7
48.5
2.4
2.6
7.4
3.9
0 10 20 30 40 50 60
Tap water
Protected borehole
Protected spring
River
Unprotected borehole
Dam
Laga
Unprotected spring
Safe Sources
Unsafe (Majority)
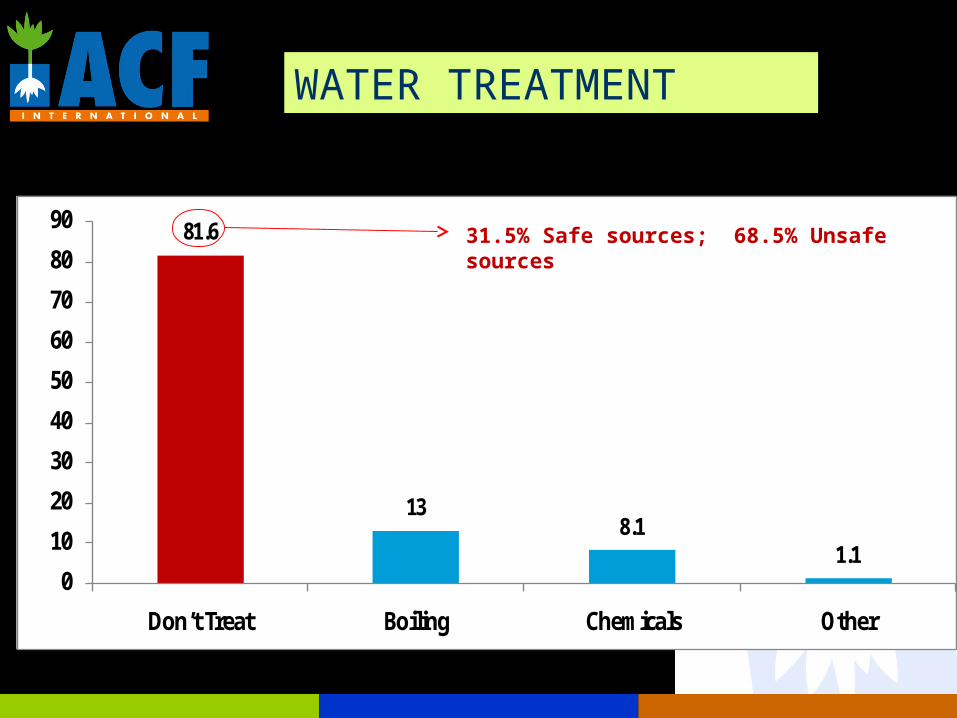
WATER TREATMENT
31.5% Safe sources; 68.5% Unsafe sources
81.6
138.1
1.10
10
20
30
40
50
60
70
80
90
Don’t Treat Boiling Chemicals Other
31.5% Safe sources; 68.5% Unsafe sources
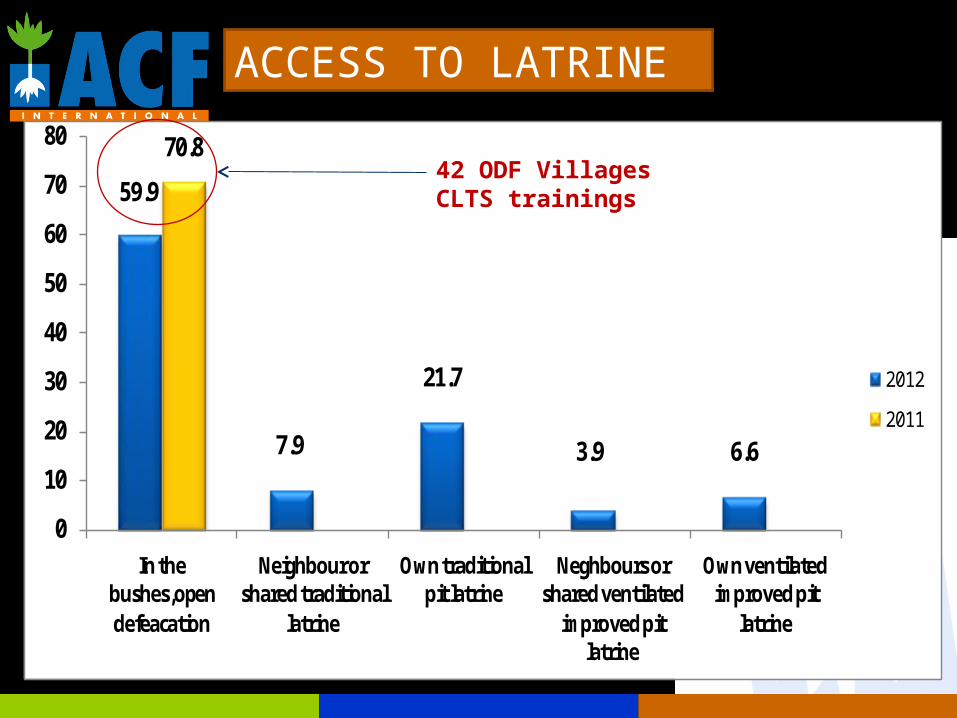
59.9
7.9
21.7
3.9 6.6
70.8
0
10
20
30
40
50
60
70
80
In the bushes,open defeacation
Neighbour or shared traditional
latrine
Own traditional pit latrine
Neghbours or shared ventilated
improved pit latrine
Own ventilated improved pit
latrine
2012
2011
ACCESS TO LATRINE
42 ODF VillagesCLTS trainings
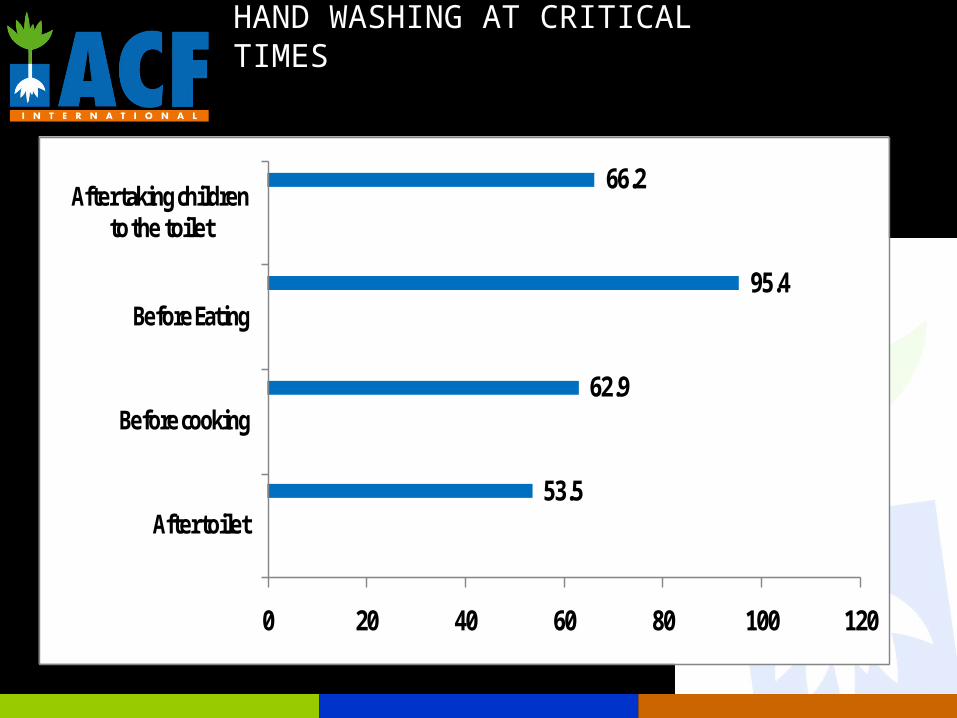
HAND WASHING AT CRITICAL TIMES
53.5
62.9
95.4
66.2
0 20 40 60 80 100 120
After toilet
Before cooking
Before Eating
After taking children to the toilet
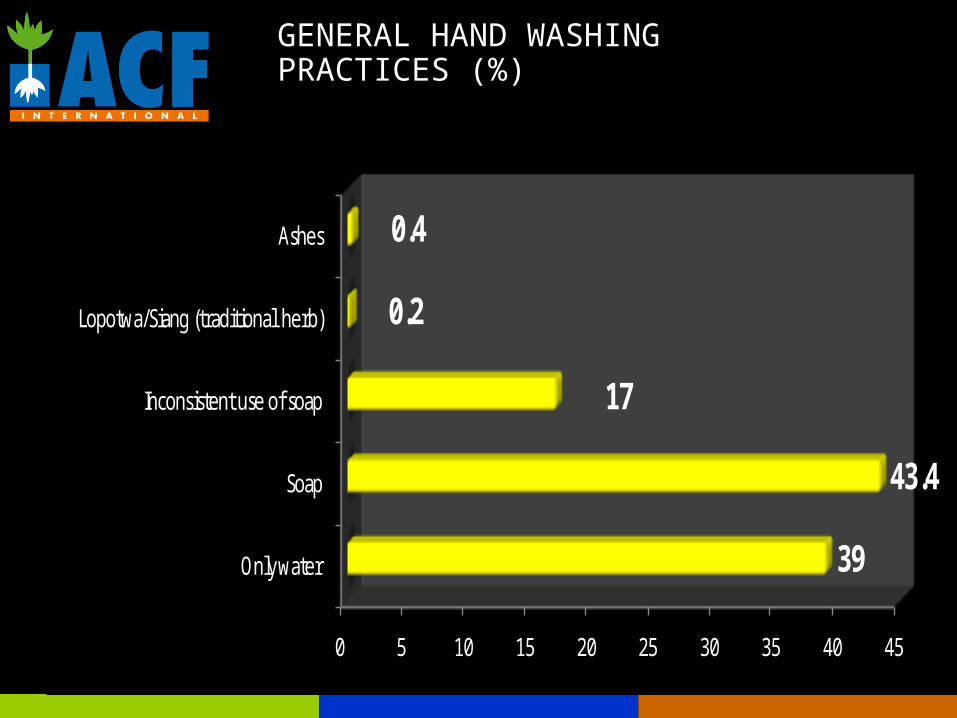
GENERAL HAND WASHING PRACTICES (%)
0 5 10 15 20 25 30 35 40 45
Only water
Soap
Inconsistent use of soap
Lopotwa/Siang (traditional herb)
Ashes
39
43.4
17
0.2
0.4
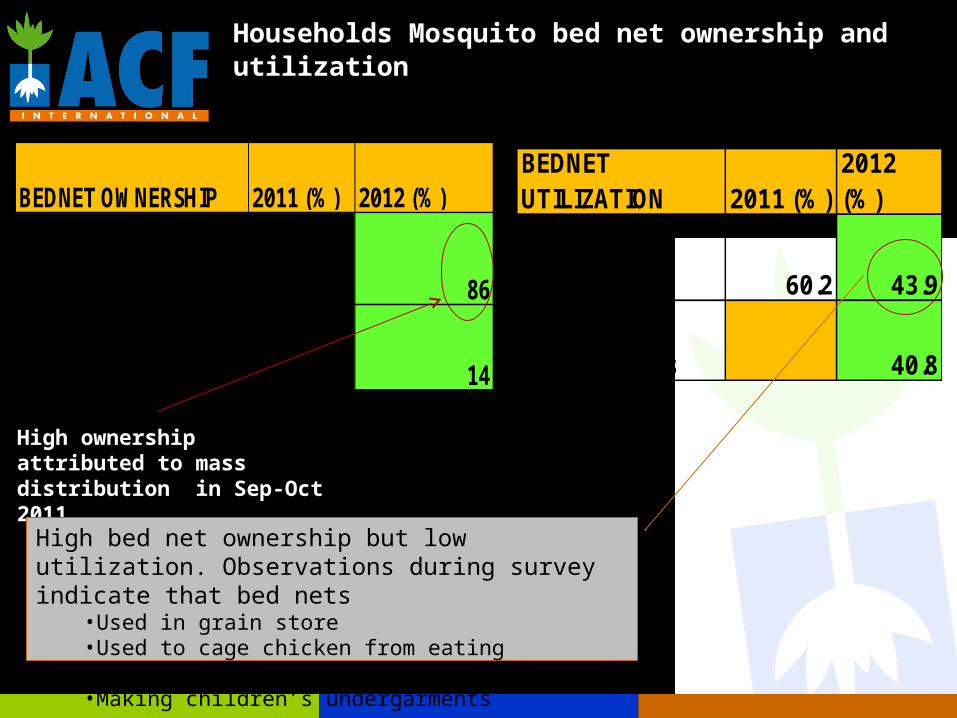
Households Mosquito bed net ownership and utilization
BEDNET OWNERSHIP 2011 (%) 2012 (%)
Households owning Mosquito nets 38.9 86
Households without Mosquito nets 61 14
BEDNET UTILIZATION 2011 (%)
2012 (%)
<5 Children 60.2 43.9
Adult Females 40.8
High ownership attributed to mass distribution in Sep-Oct 2011
High bed net ownership but low utilization. Observations during survey indicate that bed nets
•Used in grain store•Used to cage chicken from eating flowering beans/legumes•Making children’s undergarments
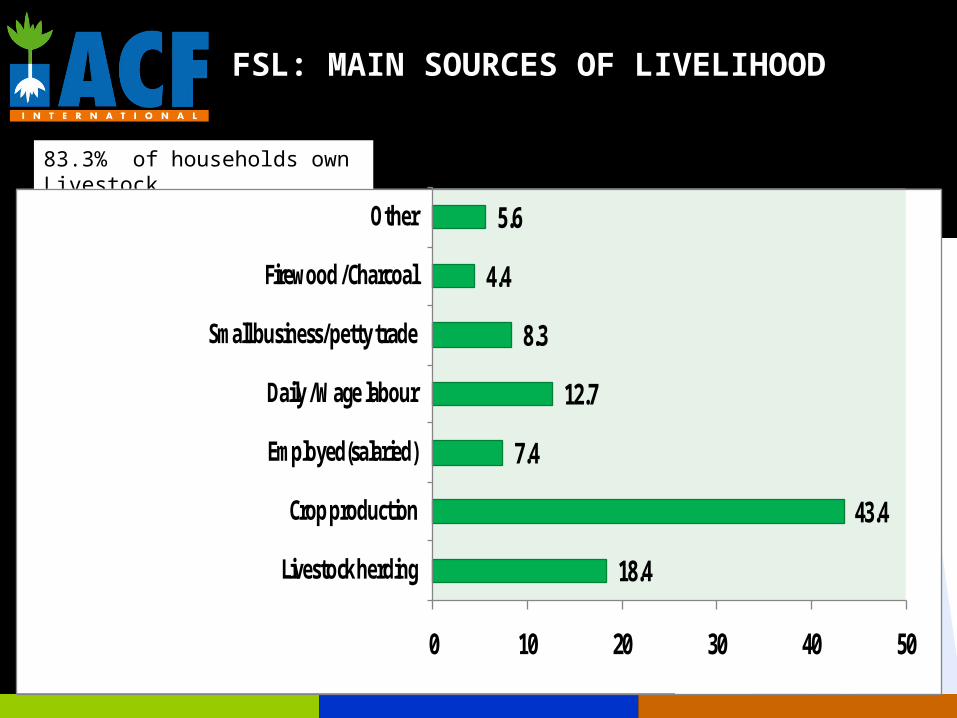
FSL: MAIN SOURCES OF LIVELIHOOD
83.3% of households own Livestock
18.4
43.4
7.4
12.7
8.3
4.4
5.6
0 10 20 30 40 50
Livestock herding
Crop production
Employed(salaried)
Daily /Wage labour
Small business/petty trade
Firewood /Charcoal
Other
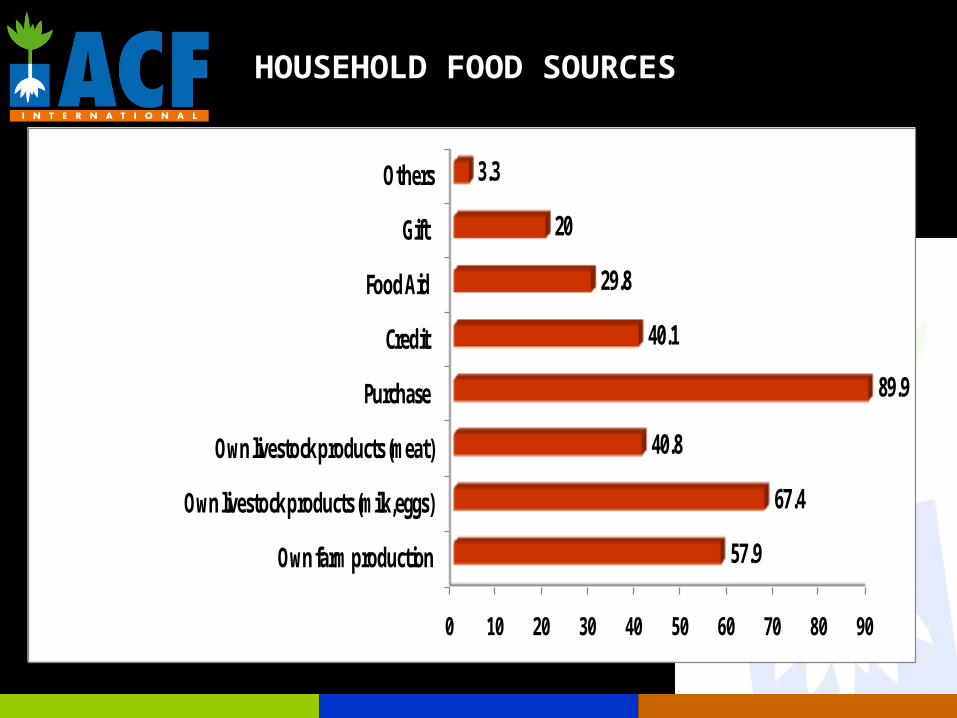
HOUSEHOLD FOOD SOURCES
0 10 20 30 40 50 60 70 80 90
Own farm production
Own livestock products (milk,eggs)
Own livestock products (meat)
Purchase
Credit
Food Aid
Gift
Others
57.9
67.4
40.8
89.9
40.1
29.8
20
3.3
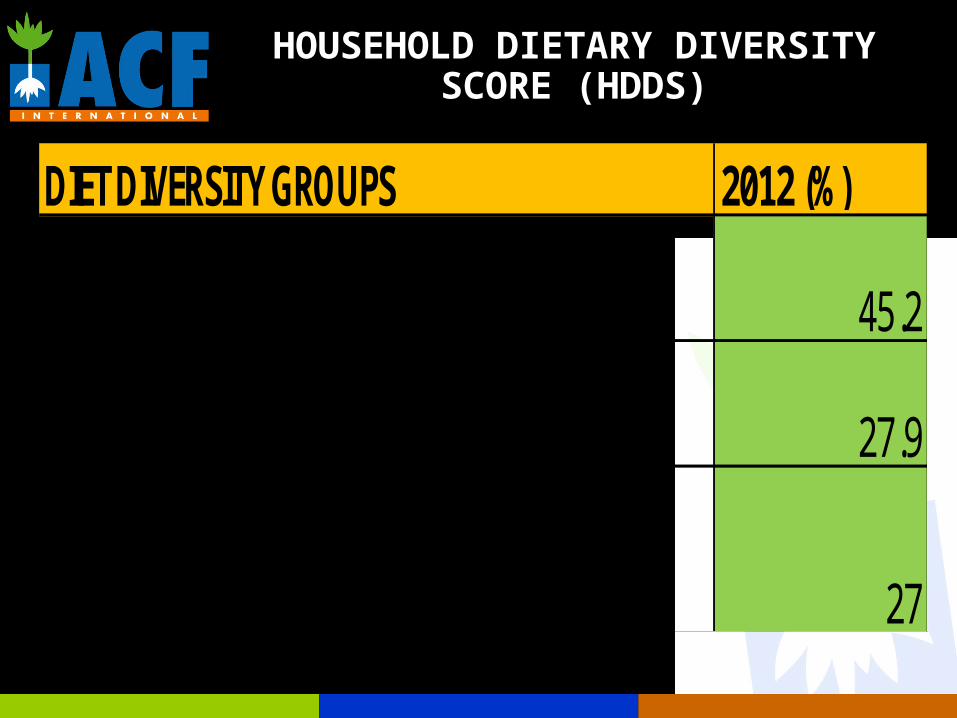
HOUSEHOLD DIETARY DIVERSITY SCORE (HDDS)
DIET DIVERSITY GROUPS 2012 (%)
Low Dietary Diversity (3 Food Groups) 45.2
Medium Dietary Diversity (4-5 Food Groups) 27.9
High Dietary Diversity (>6 Food groups) 27
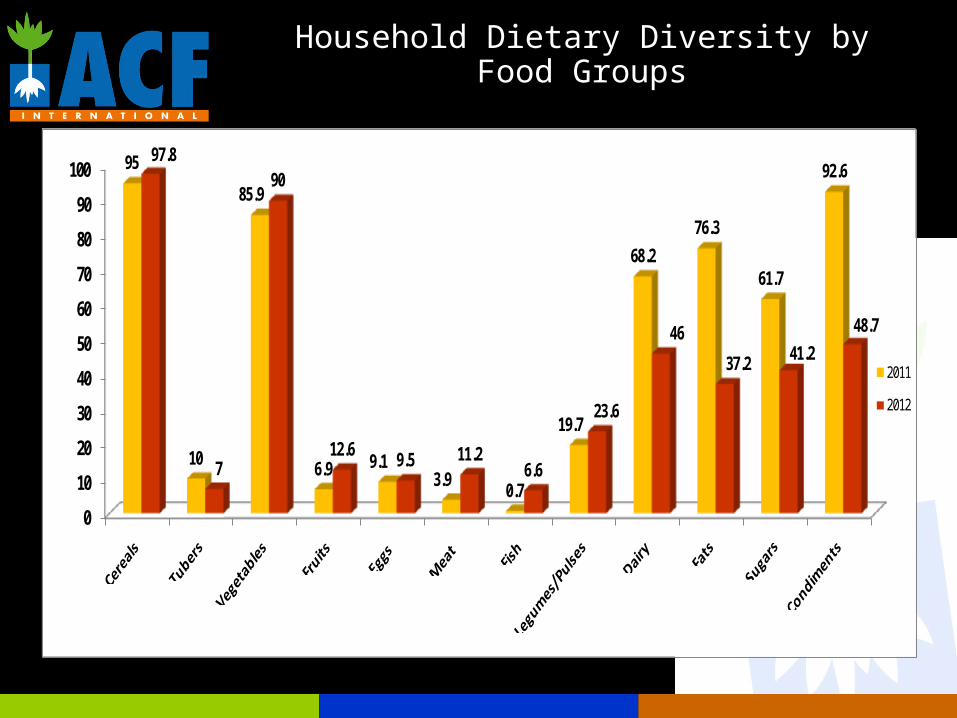
Household Dietary Diversity by Food Groups
0
10
20
30
40
50
60
70
80
90
100 95
10
85.9
6.9 9.13.9 0.7
19.7
68.276.3
61.7
92.697.8
7
90
12.6 9.5 11.26.6
23.6
46
37.2 41.248.7
2011
2012
SUMMARY OF GENERAL FINDINGS
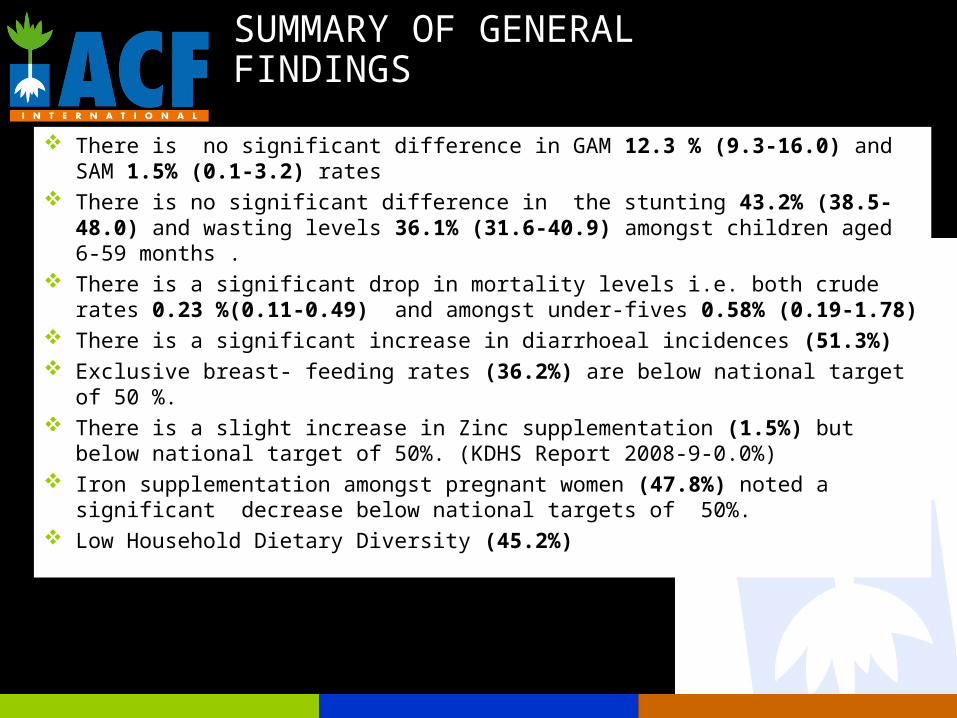
There is no significant difference in GAM 12.3 % (9.3-16.0) and SAM 1.5% (0.1-3.2) rates
There is no significant difference in the stunting 43.2% (38.5-48.0) and wasting levels 36.1% (31.6-40.9) amongst children aged 6-59 months .
There is a significant drop in mortality levels i.e. both crude rates 0.23 %(0.11-0.49) and amongst under-fives 0.58% (0.19-1.78)
There is a significant increase in diarrhoeal incidences (51.3%) Exclusive breast- feeding rates (36.2%) are below national target of 50
%. There is a slight increase in Zinc supplementation (1.5%) but below
national target of 50%. (KDHS Report 2008-9-0.0%) Iron supplementation amongst pregnant women (47.8%) noted a
significant decrease below national targets of 50%. Low Household Dietary Diversity (45.2%)
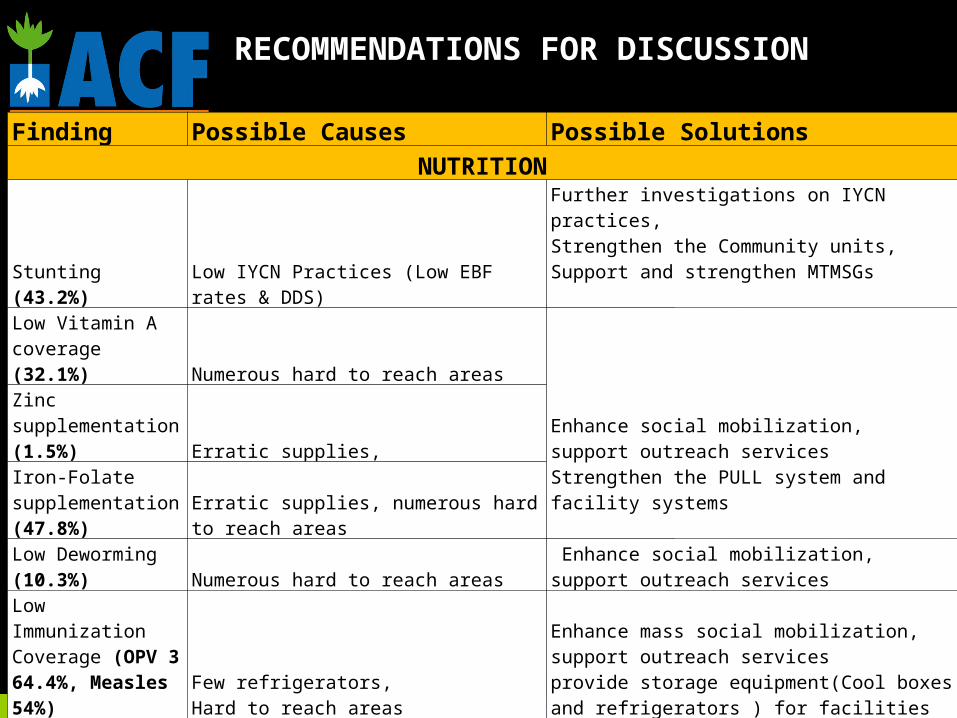
RECOMMENDATIONS FOR DISCUSSION
Finding Possible Causes Possible SolutionsNUTRITION
Stunting (43.2%) Low IYCN Practices (Low EBF rates & DDS)
Further investigations on IYCN practices,Strengthen the Community units, Support and strengthen MTMSGs
Low Vitamin A coverage (32.1%) Numerous hard to reach areas
Enhance social mobilization, support outreach servicesStrengthen the PULL system and facility systems
Zinc supplementation (1.5%) Erratic supplies,Iron-Folate supplementation (47.8%)
Erratic supplies, numerous hard to reach areas
Low Deworming (10.3%) Numerous hard to reach areas
Enhance social mobilization, support outreach services
Low Immunization Coverage (OPV 3 64.4%, Measles 54%)
Few refrigerators,Hard to reach areas
Enhance mass social mobilization, support outreach servicesprovide storage equipment(Cool boxes and refrigerators ) for facilities
Increase in Malaria incidences (31.5%)
Inappropriate use of mosquito nets, inadequate knowledge among community members
Increase awareness in order to change attitudes and practices
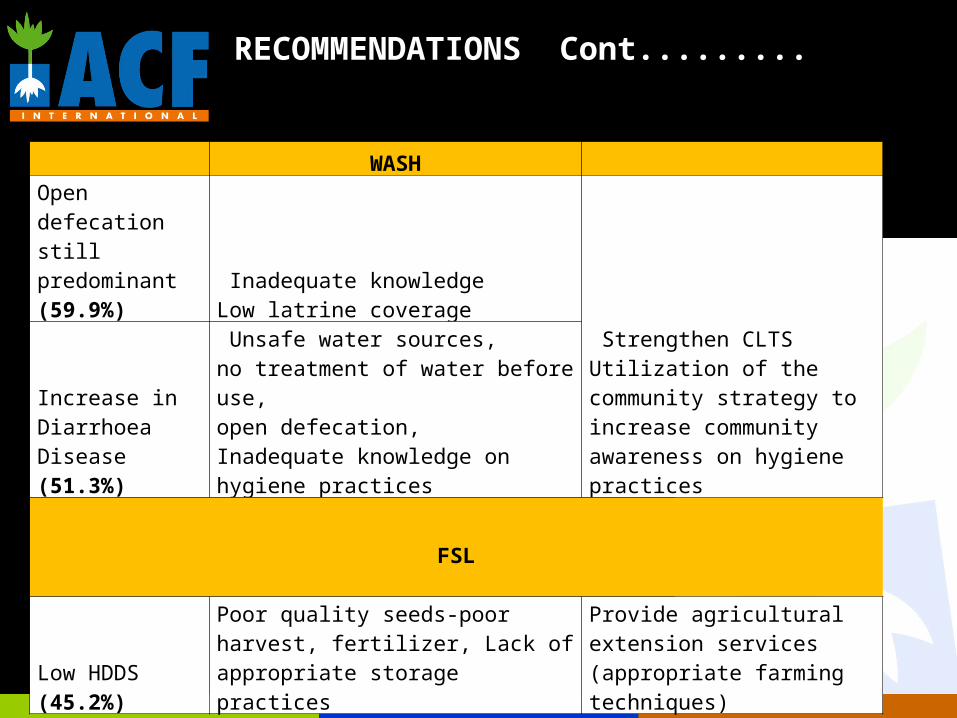
WASH Open defecation still predominant (59.9%)
Inadequate knowledgeLow latrine coverage
Strengthen CLTSUtilization of the community strategy to increase community awareness on hygiene practices
Increase in Diarrhoea Disease (51.3%)
Unsafe water sources, no treatment of water before use,open defecation,Inadequate knowledge on hygiene practices
FSL
Low HDDS (45.2%)
Poor quality seeds-poor harvest, fertilizer, Lack of appropriate storage practices
Provide agricultural extension services (appropriate farming techniques)
RECOMMENDATIONS Cont.........

LETS DISCUSS…………
.