west point middle school · total communication arts all students ... west point middle school ......
TRANSCRIPT

West Point Middle School
SY 2006-2013
Principal: Mr. David Rudy
705 Barry Road
West Point, New York 12553
Tel: 845 938-2923 Fax: 845 938-2568
Website Address:
http://www.am.dodea.edu/nyva/westpoint/middle

2
Table of Contents
School Improvement Team ....................................................................... 4
Mission and Vision Statements ................................................................. 6
Overview of the Community and School ................................................. 7
Unique Local Insights Data Collection Instruments ...............................................................................10
Chart 1: Military Rank ........................................................................11
Chart 2: Community Education ..........................................................12
Chart 3: Ethnicity of West Point Community ....................................13
Implications for Action ........................................................................................14
Existing School Data Goal 1 ....................................................................................................................15
Chart 4: TerraNova Language ....................................................................16
Chart 5: Local Writing Assessment .............................................................17
Goal 2 ...................................................................................................................18
Chart 6: TerraNova Math .............................................................................19
Chart 7: TerraNova Science .........................................................................20
Chart 8: Local Problem Solving Assessment ..............................................21
Instructional Data Data Collection Instruments .............................................................................22
Chart 9: Teaching Experience in Years .............................................23
Chart 10: Teacher Levels of Education .............................................24
Implications for Action .......................................................................................24
Follow-up of Former Students ...........................................................................25
Chart 11: Follow-up on Former Students .........................................26
Implications for Action ......................................................................................27
Unique Local Insights ................................................................................ 28 Chart 12: Customer Satisfaction Survey SY 10-11 ............................29
School Data 2006-2010 Student Performance Data and Disaggregation .................................................38 Decision Making Matrix ...................................................................................39
Terra Nova Multiple Assessments
Grade 5: Reading ...............................................................................40

3
Grade 5: Language Arts ....................................................................41
Grade 5: Math ....................................................................................42 Grade 6: Reading ...............................................................................43
Grade 6: Language Arts ....................................................................44
Grade 6: Math ....................................................................................45 Grade 7: Reading ...............................................................................46
Grade 7: Language Arts ....................................................................47
Grade 7: Math ....................................................................................48 Grade 8: Reading ...............................................................................49
Grade 8: Language Arts ....................................................................50
Grade 8: Math ....................................................................................51 c. Terra Nova Objective Performance Index
Grade 5 ................................................................................................52
Grade 6 ................................................................................................53
Grade 7 ................................................................................................54
Grade 8 ................................................................................................55
Terra Nova Performance Assessment, Communication Arts
All Students Reading Strands ............................................................56
All Students Writing Strands .............................................................57
Total Communication Arts All Students ..........................................58
Reading Strands No Accommodations .............................................59
Writing Strands No Accommodations ..............................................60
Total Communication Arts No Accommodations ............................61
Reading Strands with Accommodations ...........................................62
Writing Strands with Accommodations ...........................................63
Total Communication Arts No Accommodations ............................64
Scholastic Reading Inventory SY 2004-2005
Grade 5 ..................................................................................................65
Grade 6 ..................................................................................................66
Grade 7 ..................................................................................................67
Grade 8 ..................................................................................................68
Scholastic Reading Inventory SY 2005-2006
Grade 5 ..................................................................................................69
Grade 6 ..................................................................................................70
Grade 7 ..................................................................................................71
Grade 8 ..................................................................................................72
Scholastic Management Suite for Read 180 ............................................73
Implications for Action ..................................................................................................74
Environmental Scan Log
Analysis of Data and Implications for Action .................................................75
Triangulation of Data ..............................................................................................76
Capacity Assessment ................................................................................................77
4
School Improvement Team
Sallyann Silk School Improvement Chair
Jane Anne McCaw Standard 1 Purpose and Direction
Charles Davis
Melissa Prosperie
Megan Reifenberg
Carol Johnson Standard 2 Governance and Leadership
Karin Pustejovsky
Tricia Willis
David Rudy
Ronnie Coffey Standard 3 Teaching and Assessing for Learning
Gary Jacketti
Suzannah Coelho
Caimien Steiner
Tabitha Munderville Standard 4 Resources and Support Systems
Cheryl Dreher
Domenica Conte
Terry Marsteller
Alice Quilty
Carol Mills Standard 5 Using Results for Continuous Improvement
Pamela Granger
Donna Himmelberger
Jeffrey Dreher
Parent Team
Brandi Aemisegger
Margarite Colett
Carmen Keene
Laura Mayer
LTC John Nawoichyk
Vivian Shannon
Brenda Sparrow
Emma Svoboda
Student Team
Sydney Baker
Brenna Callahan
5
Griffin Clark
Sara Decker
Grace Glen
Anna Hanus
Gabriela Huggins
Destinee Jack
Jessica Larkin
Allyson Lyle
Morgan Markow
Kelsie Martin
Austin Moody
Alexandra Richardson
Justin Starke
6
DoDEA Mission and Vision Statements
Vision
To be among the world’s leaders in education, enriching the lives of military-connected
students and the communities in which they live.
Mission
Educate, Engage, and Empower Each student to succeed in a dynamic world.
New York/Virginia Department of Defense Elementary and
Secondary Schools District Mission Statement
In keeping with our mission to Educate, Engage, and Empower Each student to
succeed in a dynamic world, the DoDEA Curriculum Content Standards and the
Community Strategic Plan (CSP) provide the framework for academic excellence.
West Point Middle School Vision Statement
West Point Middle School ensures highest achievement for all learners.

7
Overview of the Community and School West Point Middle School (WPMS) is a Department of Defense Education Activity
(DoDEA) school located amidst the historic buildings on the grounds of the United States
Military Academy (USMA) at West Point, New York. The student body in grades five
through eight, approximately two hundred-fifty strong, is composed of children of
officers, enlisted personnel, and civilians who live on the military post and whose
primary responsibility is to work with the cadets attending the academy. Most of the
parents serve as professors and hold at least a Master's degree. The collegiate
environment fosters intrinsic academic motivation in students and creates a highly
focused, professional environment in which to learn. WPMS is a two-time National Blue
Ribbon School of Excellence, earning this prestigious award from the US Department of
Education last school year, 2011-2012, as well as during the 1997-1998 school year.
Students attend classes in a 1934 vintage building taught by a dedicated civilian staff.
The school's roots date back to 1821, the first record of a school on West Point
established for the children of service members, making it the oldest continually-run
school in DoDEA. A twenty-five million dollar construction and renovation project,
slated for completion in August 2014, will add thirty-one thousand square feet of new,
specialized space and bring the existing structure up to modern standards.
Strong partnerships with the community foster a team approach to ensuring that all
learners perform at high levels. The Parent-Teacher Organization (PTO) conducts three
major fundraisers per year, the Read-a-Thon in the fall and the Nook Fair in both the fall
and spring. The high rate of student and parent involvement in these activities result in
sufficient funds to be raised annually to significantly defray the family contribution
required for study trips, as well as support for all teacher requests for supplementary or
consumable classroom supplies. The PTO also has a Booster Club, which provides extra
equipment and pays invitational event fees for the school's cross country, soccer,
basketball, and track teams. Athletics are available to students at all grade levels, which
are run through a unique partnership with West Point's Morale, Welfare, and Recreation
(MWR) department. Through the partnership, MWR provides logistical support and the
school staffs the coaching positions for modified sports teams in grades seven and eight.
Students in grades five and six may participate in an intramurals program year-round.
The Partners in Education Program, currently in its second year at West Point, is led by
the installation's School Liaison Officer. It matches teacher requests for community
support with willing and able community members to enhance the educational
experiences of all students. The partnerships are too numerous to list in full, so a listing
of some of the major ones will need to suffice. Members of the USMA Band, one of the
finest military bands in the world, come to the school and work with students in
instrument groups to refine and enhance playing technique. The USMA Band pairs with
the Cadet Spirit Band every spring to hold a band retreat at Lake Frederick, where
students, cadets, and soldiers work together to compose and practice a piece of music that
is performed at the school's spring concert. Students in Applied Technology (Robotics) at
WPMS are working with cadets and professors in the Electrical Engineering and

8
Computer Science department of the academy to gain first-hand experience of the
progression and application of concepts being taught in the middle school class.
Professors from all science departments have worked with WPMS science teachers to
provide students with rigorous, relevant lessons that augment what the WPMS teacher is
presenting. Fifth and sixth grade students attended the annual Cadet Project Day for the
first time in the spring of 2012, giving them insight into college-level research, problem-
solving, and the resulting projects that provide solutions to real issues being faced by
today's military.
The needs of the military child and family have increased exponentially over the past ten
years of war in which our great Nation has been engaged. The majority of our students
have dealt with the stress and uncertainty of parental deployment, many three and four
times; tragically, some of the parents have paid the ultimate sacrifice and did not return.
Despite these significant, ongoing hardships in the lives of our students, the staff at
WPMS continues to provide a challenging, nurturing educational experience in all
classrooms that results in very high rates of student achievement. Teachers have fully
embraced technology as a tool for teaching and learning, and interactive white boards are
being used in every classroom. Current professional development activities are focused
on the use of classroom-level data to appropriately differentiate instruction for all
learners, so that every student is met at their present level for every unit of instruction.
Full actualization of the vision statement, "Ensuring highest achievement for all
learners," by focusing on the needs of individual students enables West Point Middle
School to provide every student with a rigorous, robust education every day in every
classroom.
The purpose of West Point Middle School (WPMS) is to provide world-class educational
experiences to the dependents of the men and women in uniform serving our Nation at
the United States Military Academy. WPMS has adopted the Department of Defense
Education Activity's (DoDEA) mission statement, "Providing an exemplary education
that inspires and prepares all students for success in a dynamic, global environment."
This mission statement, which is currently undergoing revision through input from
stakeholders at the DoDEA level, informed and inspired the students, parents, and
teachers at WPMS to create the school's vision statement: "West Point Middle School
ensures highest achievement for all learners." Stakeholders wanted a vision that was
clear, concise, and expressed the level of commitment that everyone has in the success of
every single learner in the school. It is updated annually through a process in which all
voices are heard.
Despite its small size, WPMS offers a wide array of rigorous course offerings to ensure
that all students are able to maximize their learning. Four high-school level courses are
offered to middle school students: Algebra 1, Spanish 1, Spanish 2, and a course unique
to WPMS, Living Environment. WPMS began offering Living Environment (Biology)
four years ago in order to streamline the transition of WPMS eighth graders to the local
education agency (LEA) high school in Highland Falls, James. I. O'Neill High School.
The only school in DoDEA to offer this course, WPMS administration worked with LEA
leadership and the DoDEA Partnership Branch to follow the New York State curriculum
standards and laboratory hours required for students to take the state Regents Exam in
9
June. Students also enroll in courses from DoDEA's Virtual School, providing them with
access to a number of high school courses that would otherwise not be available to them.
Currently, three WPMS students take high school Geometry and one student takes
Spanish 3 through the Virtual School. Instrumental music (band) is offered at every grade
level, and the band has earned a reputation as one of the best small school bands in the
area, with several musicians earning all-county honors each year. Technology courses
include Applied Technology, in which students design, build, and program Lego robots
to complete a series of tasks, and Video Production, a course whose members work on
providing weekly video announcements to the entire student body in the auditorium. Art,
Guitar, General Music, Research Project, and Humanities are other elective offerings that
provide students with a broad range of talents and interests to achieve at high levels.
Several support options are in place to make the vision of highest student achievement a
reality, including additional time before, during, and after school to provide students with
whatever it takes to achieve at the highest possible levels. Study Skills is offered at every
grade level, a course designed to provide struggling students with extra time and
personalized attention to complete current learning tasks. Capable yet underperforming
students are recruited for the AVID program (Advancement Via Individual
Determination), in which they are provided with organizational assistance, motivation,
and access to rigorous course offerings to align their aptitude with their output. Current
student progress is tracked on a weekly basis by the Principal and Guidance Counselor to
quickly identify and address performance concerns as soon as they arise. This has
resulted in a quarterly failure rate, defined at WPMS as earning a D or F, of less than one
percent. Additionally, the school's Student Support Team (SST) meets monthly to address
any teacher concerns with students and map out a way forward to match the need with
appropriate interventions that may include additional assessments, counseling or other
monitoring, and community resources.
All of the aforementioned efforts, inspired by the school's vision to ensure, to insist, to
require highest achievement for all learners, have cultivated a climate of high expectation
for student performance at WPMS. Students are expected to do their homework, give
projects the time and attention they require, and prepare for assessments each and every
day. Teachers are quick to remind students that none of the work assigned is optional,
and they work with students to make sure that every learning task is completed to the
standard set forth by the teacher. Students new to WPMS from other locations are at first
very surprised but soon quite relieved to know that their best effort is expected of them
by their teachers in every class. A new student recently told the guidance counselor that,
"this is a school for nerds!" which was taken as a compliment by all who heard her
sentiment. It is cool to give your best here, okay to be smart and even a little bit quirky,
and our transferring students in short order become very comfortable in the safe,
nurturing environment that WPMS provides.
10
Unique Local Insights
Data Collection Instruments
We collected our data from West Point Communities Human Resources
Department, parents, teachers, and from various community departments on post.
West Point is a unique military community that offers our students many
opportunities for support and recreation. One outstanding service is the Youth
Services Center (less than half a block from the school) which offers after school
care and activities for students K-12, which includes homework centers/tutors,
computer skills, reading centers, and physical education.
The “War on Terror” in the Middle East has increased the number of active duty
parents who are being deployed for long periods of time. Traditionally, West Point
parents have not been deployed for long periods of time. This fact makes it all the
more important to have organizations on post that support the students and the
school. Some of these include: Parent Teacher Organization, West Point Dental
Activity, West Point Women’s Club, Daughters of the American Revolution, Dept.
of Public Works and Housing, Morale Welfare, Recreation, Youth Services, and
American Army Forces Exchange Services.
West Point is an E.F.M.P. (Exceptional Family Member Program) participating
installation; therefore, funding is essential to provide all services needed by the
various exceptional family members attending the West Point Middle School.
11
Presentation of Data
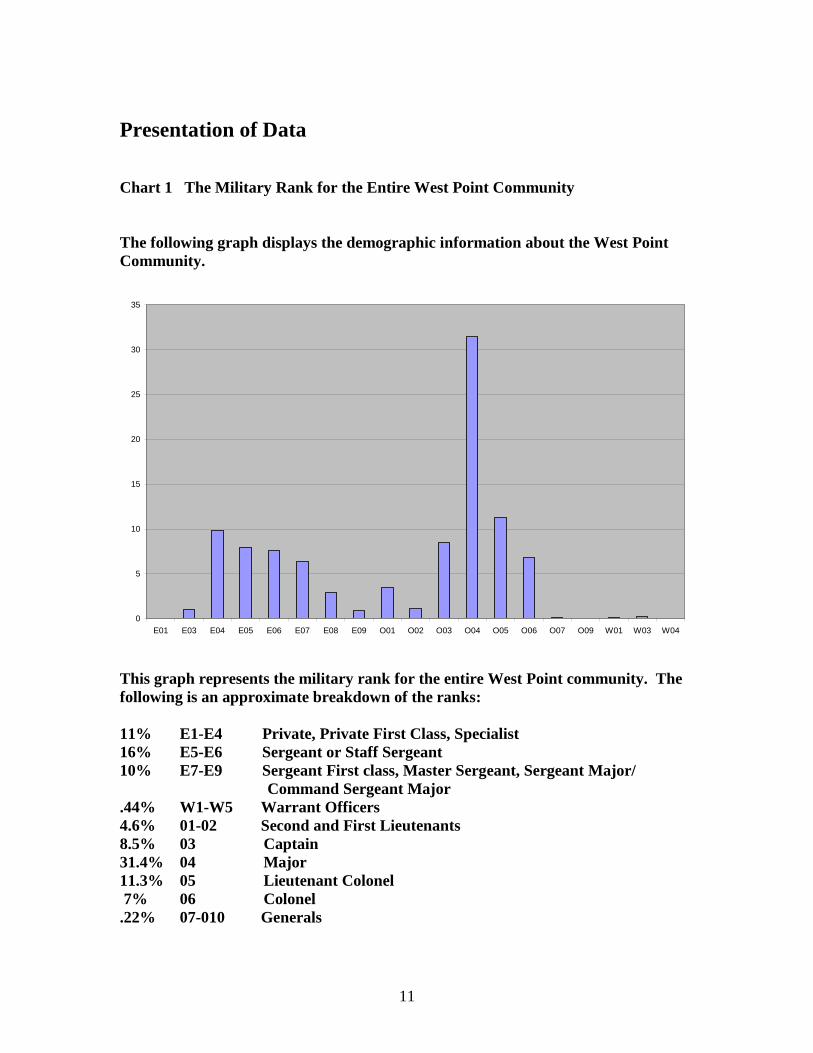
Chart 1 The Military Rank for the Entire West Point Community
The following graph displays the demographic information about the West Point
Community.
SY 2008-2009 Military Rank Breakdown for the Entire West Point Community
0
5
10
15
20
25
30
35
E01 E03 E04 E05 E06 E07 E08 E09 O01 O02 O03 O04 O05 O06 O07 O09 W01 W03 W04
This graph represents the military rank for the entire West Point community. The
following is an approximate breakdown of the ranks:
11% E1-E4 Private, Private First Class, Specialist
16% E5-E6 Sergeant or Staff Sergeant
10% E7-E9 Sergeant First class, Master Sergeant, Sergeant Major/
Command Sergeant Major
.44% W1-W5 Warrant Officers
4.6% 01-02 Second and First Lieutenants
8.5% 03 Captain
31.4% 04 Major
11.3% 05 Lieutenant Colonel
7% 06 Colonel
.22% 07-010 Generals
12
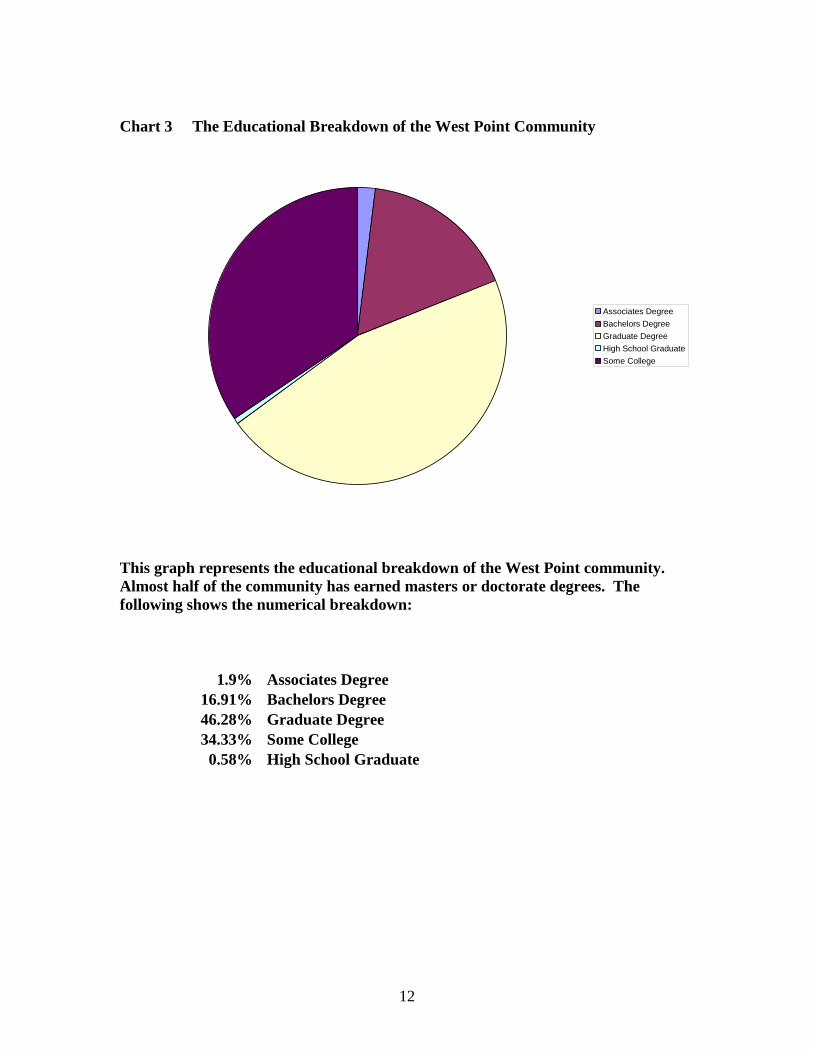
Chart 3 The Educational Breakdown of the West Point Community
SY 2008-2009 West Point Community Educational Breakdown
Associates Degree
Bachelors Degree
Graduate Degree
High School Graduate
Some College
This graph represents the educational breakdown of the West Point community.
Almost half of the community has earned masters or doctorate degrees. The
following shows the numerical breakdown:
1.9% Associates Degree
16.91% Bachelors Degree
46.28% Graduate Degree
34.33% Some College
0.58% High School Graduate
13
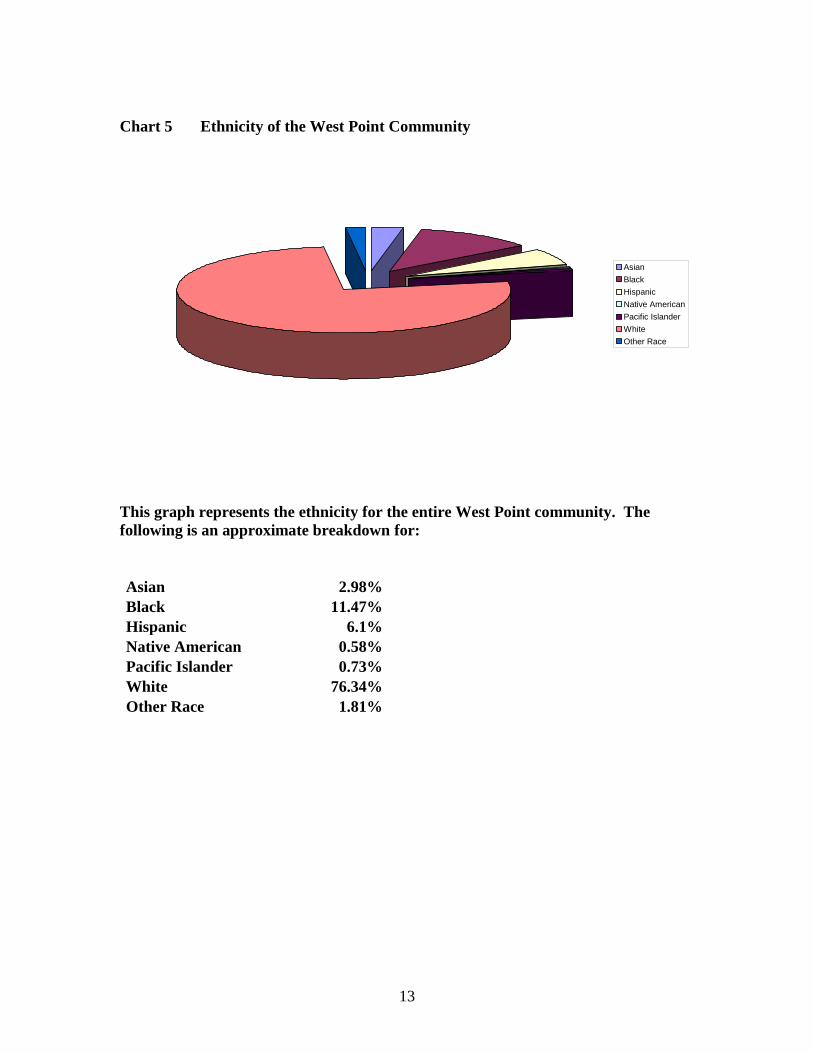
Chart 5 Ethnicity of the West Point Community
SY 2008-2009 Ethnicity of the West Point Community
Asian
Black
Hispanic
Native American
Pacific Islander
White
Other Race
This graph represents the ethnicity for the entire West Point community. The
following is an approximate breakdown for:
Asian 2.98%
Black 11.47%
Hispanic 6.1%
Native American 0.58%
Pacific Islander 0.73%
White 76.34%
Other Race 1.81%
14
Implications for Action: Unique Local Insights
The data indicates that West Point has a wealth of knowledgeable resources within
the members of our own community.
The majority of West Point community members are quite qualified to be mentors,
tutors, guest speakers, and role models for our student population.
The following are ways in which we have increased public awareness of our goals
and interventions:
Command TV Channel
Town Hall Meetings
School Board Meetings
Parent School Improvement Meetings
Pointer View Newspaper
Parent Newsletter
Post Message Board
West Point Women’s Club
We have utilized the talents of our local community. Members of the West Point
community and surrounding areas have shared their expertise on diverse topics.
We intend to continue using these valuable resources.
15
Existing School Data
Data for Goal 1
Goal 1- All students at West Point Middle School will improve their writing, ability to
express ideas clearly and effectively, across the curriculum as measured by the selected
system-wide and local assessments.
Intervention for Goal 1: Teachers and students will implement the 6+1 Traits of
Writing in all curricular areas and on all grade levels.
ASSESSMENTS AND MEASURES
We used the below listed assessments to measure progress toward meeting Goal 1.
Standardized Assessments 1. TerraNova Language
Local Assessments 1. Reading Street Writing Assessment 2. Locally developed writing assessment 3. In school year 2012-2013 HOLT Online Assessment will be used
DATA ANALYSIS
The analysis measures the changes in student achievement by comparing aggregated
grade-level scores from the baseline assessment data to the 2012 scores. The analysis is
displayed as yearly aggregate grade-level student performance in a set of bar graphs
where each set of bar graphs represents the percentage of students scoring “At Standard
or Above” for a particular school year.
INDICATOR OF SUCCESSS
Success is measured by a meaningful increase in the percent of students performing “At
or Above Standard”. DoDEA has set a goal of having at least 75% of students scoring at
or above standard.
16
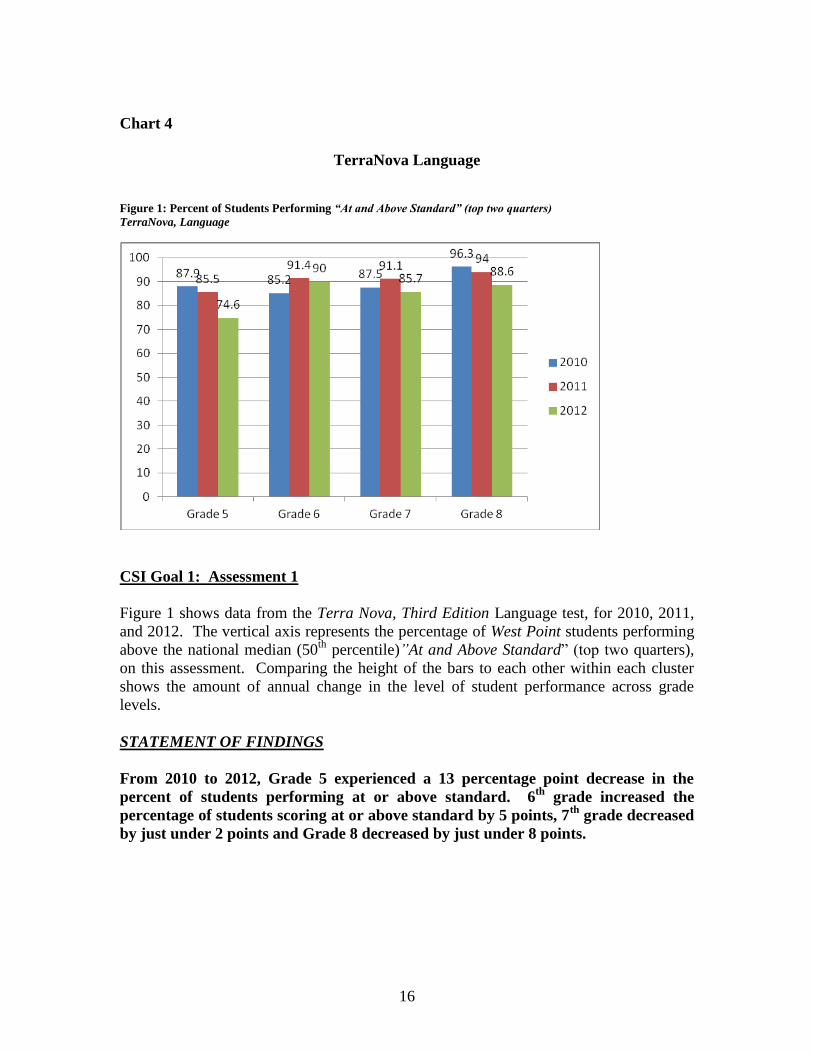
Chart 4
TerraNova Language
Figure 1: Percent of Students Performing “At and Above Standard” (top two quarters)
TerraNova, Language
CSI Goal 1: Assessment 1
Figure 1 shows data from the Terra Nova, Third Edition Language test, for 2010, 2011,
and 2012. The vertical axis represents the percentage of West Point students performing
above the national median (50th
percentile)”At and Above Standard” (top two quarters),
on this assessment. Comparing the height of the bars to each other within each cluster
shows the amount of annual change in the level of student performance across grade
levels.
STATEMENT OF FINDINGS
From 2010 to 2012, Grade 5 experienced a 13 percentage point decrease in the
percent of students performing at or above standard. 6th
grade increased the
percentage of students scoring at or above standard by 5 points, 7th
grade decreased
by just under 2 points and Grade 8 decreased by just under 8 points.
17
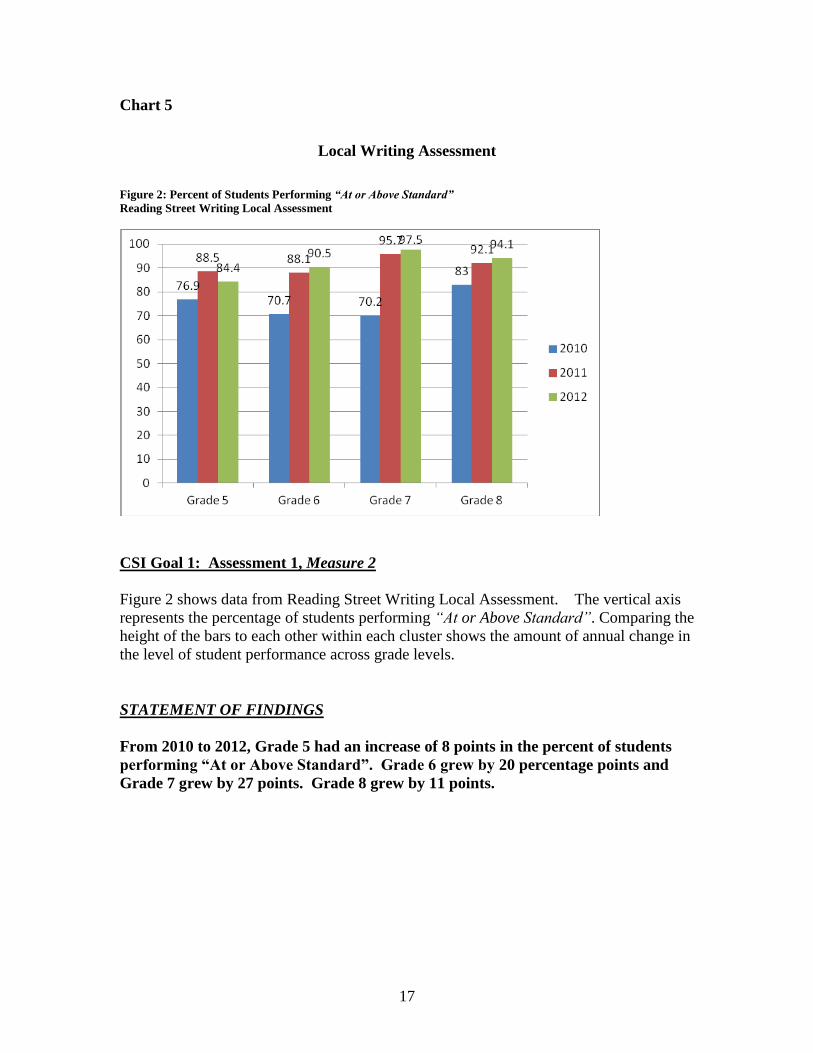
Chart 5
Local Writing Assessment
Figure 2: Percent of Students Performing “At or Above Standard”
Reading Street Writing Local Assessment
CSI Goal 1: Assessment 1, Measure 2
Figure 2 shows data from Reading Street Writing Local Assessment. The vertical axis
represents the percentage of students performing “At or Above Standard”. Comparing the
height of the bars to each other within each cluster shows the amount of annual change in
the level of student performance across grade levels.
STATEMENT OF FINDINGS
From 2010 to 2012, Grade 5 had an increase of 8 points in the percent of students
performing “At or Above Standard”. Grade 6 grew by 20 percentage points and
Grade 7 grew by 27 points. Grade 8 grew by 11 points.
18
Data for Goal 2
GOAL AND INTERVENTION(S)
Goal 2- All students will increase their problem solving, specifically, the ability to
retrieve, evaluate, use and interpret information in print and electronically as measured by
system-wide and local assessments.
Intervention for Goal 2: Teachers and students will implement the Big 6 Steps in
Problem Solving in all curricular areas and on all grade levels.
ASSESSMENTS AND MEASURES
We used the below listed assessments to measure progress toward meeting Goal 2.
Standardized Assessments
1. Terra Nova Math
2. Terra Nova Science
Local Assessments
1. Locally developed problem solving assessment
2. In SY 2013 we will be using problem solving assessments developed by our
district support staff in Science and Mathematics
DATA ANALYSIS
The analysis measures the changes in student achievement by comparing aggregated
grade-level scores from the baseline assessment data to the 2012 scores. The analysis is
displayed as yearly grade-level student performance in a set of bar graphs where each set
of bar graphs represents the percentage of students scoring “At and Above Standard” or
“At Standard” for a particular school year.
INDICATOR OF SUCCESSS
Success is measured by a meaningful increase in the percent of students performing “At
and Above Standard” and/or by above average achievement levels. Ideally, at least 75%
of students perform “At or Above Standard.”
19
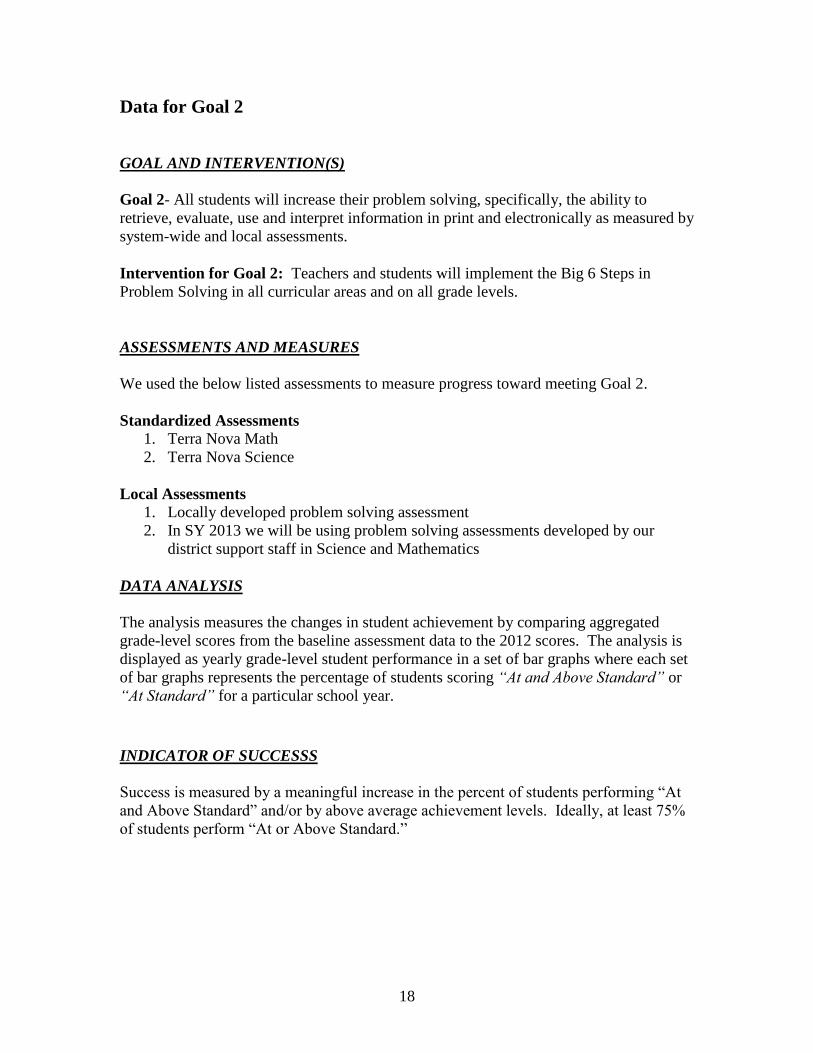
Chart 6
TerraNova Math
Figure 3: Percent of Students Performing “At or Above Standard”
TerraNova Math
CSI Goal 2: Assessment 1
Figure 3 shows data from TerraNova Math Assessment. The vertical axis represents the
percentage of students performing “At or Above Standard”. Comparing the height of the
bars to each other within each cluster shows the amount of annual change in the level of
student performance across grade levels.
STATEMENT OF FINDINGS
From 2010 to 2012, Grade 5 had a decrease of 6.8 points in the percent of students
performing “At or Above Standard”. Grade 6 grew by 1.5 percentage points and
Grade 7 grew by 7 points. Grade 8 grew by 1 point.

20
Chart 7
TerraNova Science
Figure 4: Percent of Students Performing “At or Above Standard”
TerraNova Science
CSI Goal 2: Assessment 1
Figure 4 shows data from TerraNova Science Assessment. The vertical axis represents
the percentage of students performing “At or Above Standard”. Comparing the height of
the bars to each other within each cluster shows the amount of annual change in the level
of student performance across grade levels.
STATEMENT OF FINDINGS
From 2010 to 2012, Grade 5 had a decrease of 12 points in the percent of students
performing “At or Above Standard”. Grade 6 grew by 5 percentage points and
Grade 7 grew by 12.5 points. Grade 8 grew by 3 points.
21
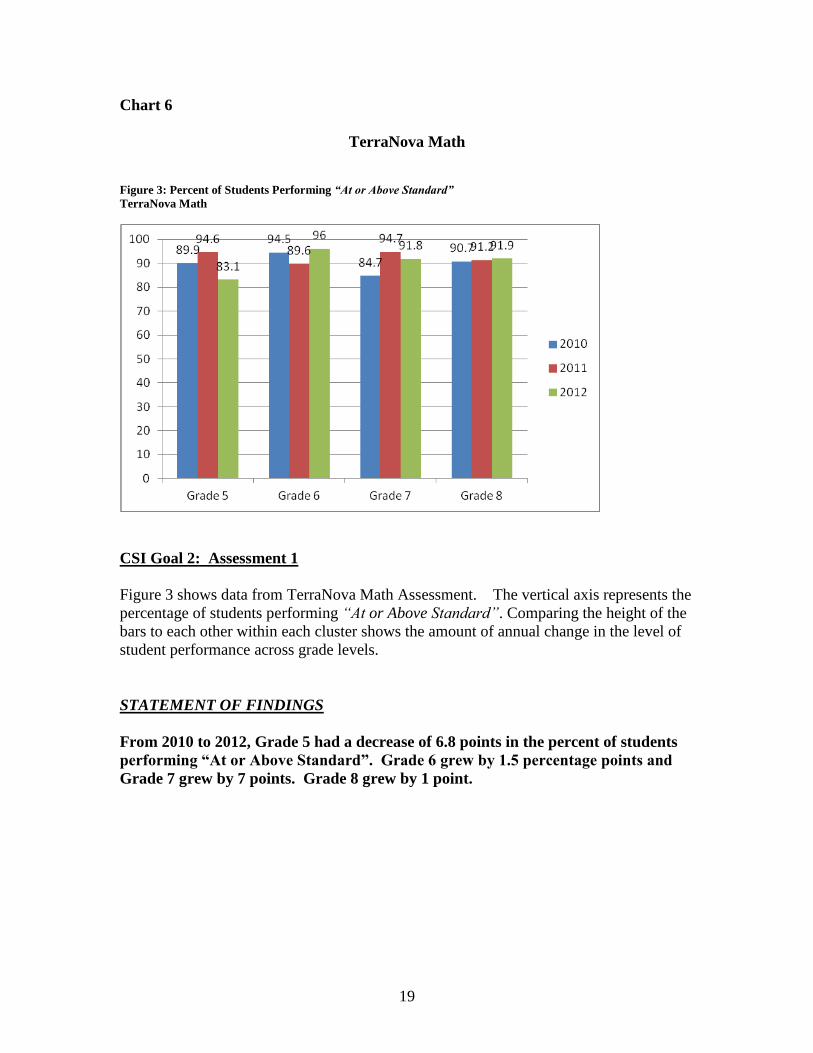
Chart 8
Local Problem Solving Assessment
Figure 5: Percent of Students Performing “At or Above Standard”
Locally Developed Problem Solving Assessment
CSI Goal 2: Assessment 1
Figure 5 shows data from the Locally Developed Problem Solving Assessment. The
vertical axis represents the percentage of students performing “At or Above Standard”.
Comparing the height of the bars to each other within each cluster shows the amount of
annual change in the level of student performance across grade levels.
STATEMENT OF FINDINGS
From 2010 to 2012, Grade 5 had a 1 point increase in the percent of students
performing “At or Above Standard”. Grade 6 decreased by 1 percentage point and
Grade 7 grew by 7 points. Grade 8 grew by just under 2 points.

22
Instructional Data
Data Collection Instruments
We have selected the following instruments to collect data regarding instructional
data: teacher questionnaires, curriculum alignment/mapping activities,
instructional objectives survey, methodology questionnaire, and contacts with the
Department of Human Resources.
We have included data that reflects our school culture, including teacher experience
and levels of education. The faculty provided the number of years they have been
teaching. The Department of Human Resources provided us with the educational
background of the teachers.
Analysis of Data
Our data indicates that we have a very highly educated and experienced staff with
diverse training and specialties. The staff employs many methodologies in their
teaching, and learning objectives are comprised of learning basic skills and subject
matter content; and developing problem solving/analytical reasoning skills.
For both educational challenged and gifted students, West Point is staffed
sufficiently and carries out all requirements regarding special education.
23
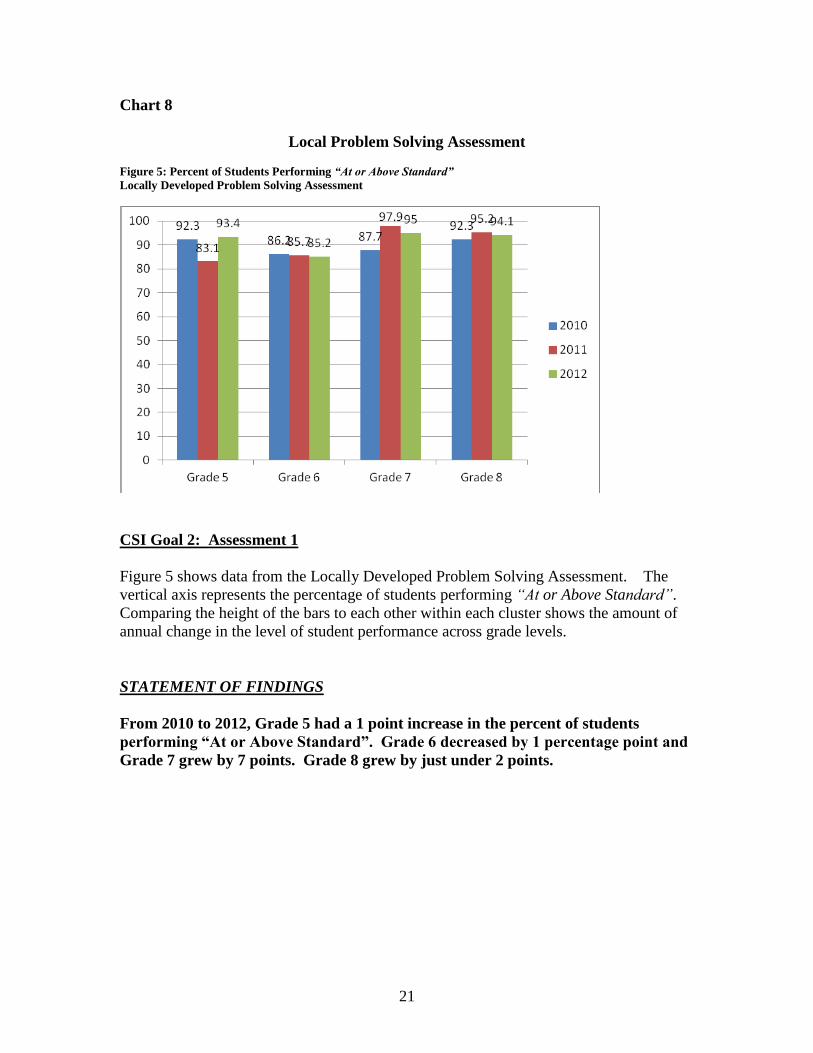
Teaching Experience in Years
Chart 9
This graph demonstrates that a sizeable majority of our teachers are experienced.
Fifty percent of the faculty has been teaching for more than twenty years. Eighty-
six percent of the faculty has been teaching more than ten years.
24
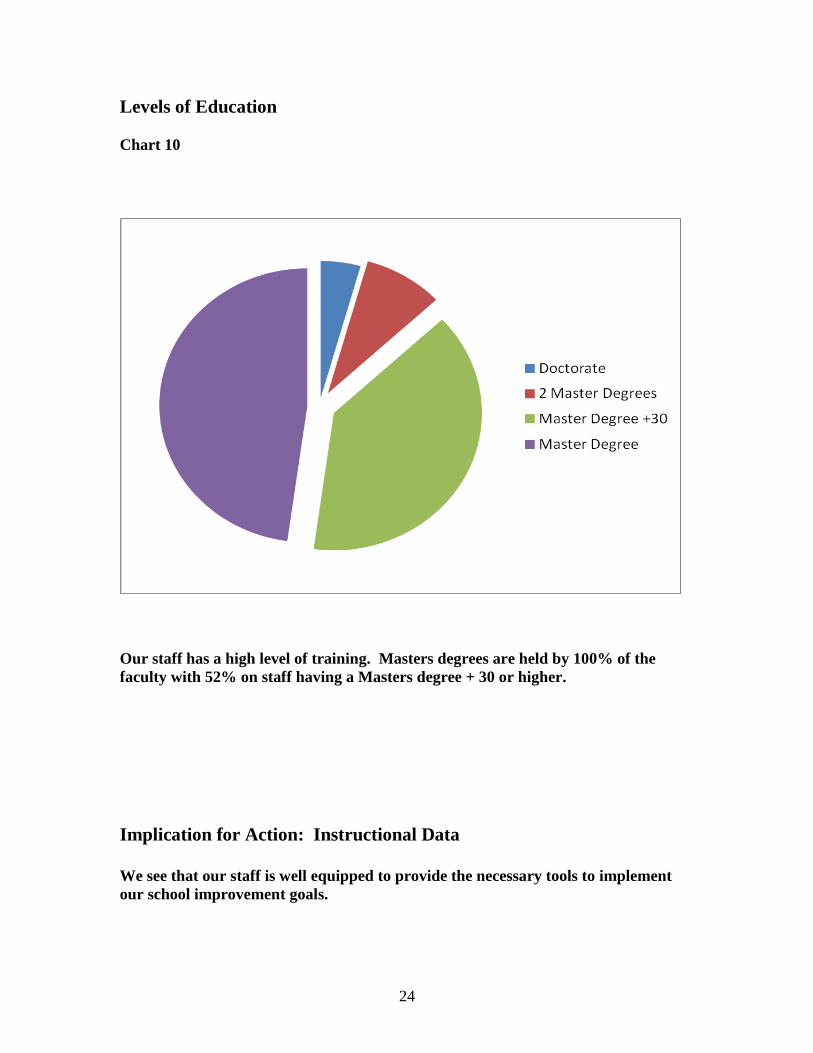
Levels of Education
Chart 10
Our staff has a high level of training. Masters degrees are held by 100% of the
faculty with 52% on staff having a Masters degree + 30 or higher.
Implication for Action: Instructional Data
We see that our staff is well equipped to provide the necessary tools to implement
our school improvement goals.
25
Follow-up on Former Students
Data Collection Instrument
Ninth grade students were interviewed and asked to respond to five questions about
their experiences as students in the West Point Middle School.
We collected the data using e-mails and discussions with former students.
Analysis of Data
Students felt prepared for all subjects; however, writing was not listed under the
category of Most Prepared. This is an indication that our goal of writing will be
beneficial to our students.
All ninth grade students, who were interviewed, were asked if they were satisfied
with the education that they received and all felt that they received a good education
at West Point Middle School and that they were prepared for high school.
They all recognized that teachers at the West Point Middle School were willing to
help their students outside of the regular classes whenever it was needed, and all
students felt safe in school.
26
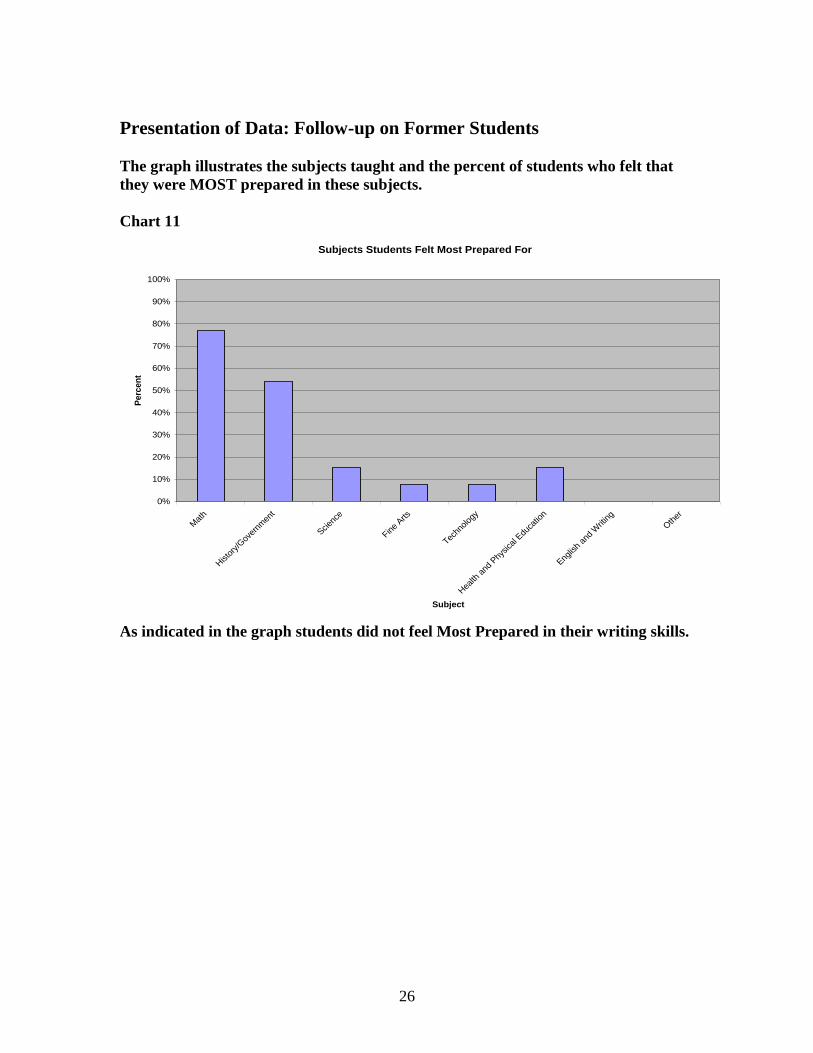
Presentation of Data: Follow-up on Former Students
The graph illustrates the subjects taught and the percent of students who felt that
they were MOST prepared in these subjects.
Chart 11
Subjects Students Felt Most Prepared For
0%
10%
20%
30%
40%
50%
60%
70%
80%
90%
100%
Mat
h
Histo
ry/G
over
nmen
t
Scien
ce
Fine
Arts
Techn
olog
y
Hea
lth a
nd P
hysica
l Edu
catio
n
Englis
h an
d W
ritin
g
Oth
er
Subject
Pe
rcen
t
As indicated in the graph students did not feel Most Prepared in their writing skills.
27
Implications for Action: Follow-up on Former Students
Although students felt prepared for all subjects, writing was not listed under the
category of Most Prepared. This is an indication that our goal of writing across the
curriculum will benefit all of our students.
Data Collection Instruments:
We selected the following instruments to collect data regarding Unique Local
Insights: a teacher questionnaire, interviews with parents and DoDEA Customer
Satisfaction Survey.
Analysis of Data
Our school being part of such a unique historic military community has many
opportunities for interaction between parents and professional staff. Our student
performance goal of written communication could be enhanced due to the proximity
of such abundant resources.
28
Unique Local Insights
Data Collection Instruments:
We selected the following instruments to collect data regarding Unique Local
Insights: a teacher questionnaire, interviews with parents and DoDEA Customer
Satisfaction Survey.
Analysis of Data
Our school being part of such a unique historic military community has many
opportunities for interaction between parents and professional staff. Our student
performance goal of written communication could be enhanced due to the proximity
of such abundant resources.
When asked about the partnership between parents and teachers, 45% of parents
are very satisfied with our school's communication.
The following communication tools were rated for effectiveness by parent
respondents: Newsletters (45%); web page (40%); email/letters from teachers
(35%); email/letters from principal (43%); parent-teacher conferences (29%).
The response rate of the DoDEA Customer Satisfaction Survey for parents was
33%.
74% of those parents gave the school an A or B grade
73% felt that West Point Middle School was meeting the DoDEA schools’ mail goal
for all students which are to meet or exceed challenging standards. Parents
responded with a grade of A or B
Three areas that parents felt needed improvement were:
25% Raising academic standards
18% Increasing academic support programs
12% Reducing class size
Implications for Action: Unique Local Insights
The resources of the community will allow the school to employ guest writers for
modeling skills in writing. The availability of the cadet community for tutoring and
mentoring will also be a useful resource in our goal for school improvement.
Format
29
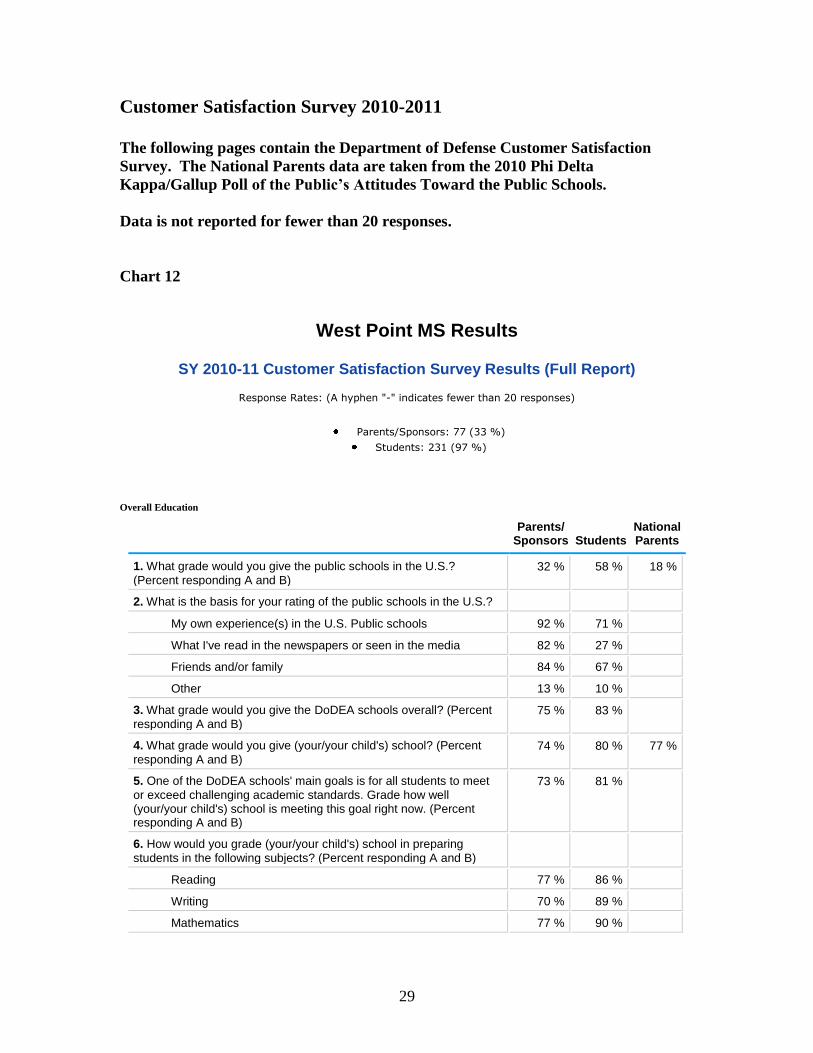
Customer Satisfaction Survey 2010-2011
The following pages contain the Department of Defense Customer Satisfaction
Survey. The National Parents data are taken from the 2010 Phi Delta
Kappa/Gallup Poll of the Public’s Attitudes Toward the Public Schools.
Data is not reported for fewer than 20 responses.
Chart 12
West Point MS Results
SY 2010-11 Customer Satisfaction Survey Results (Full Report)
Response Rates: (A hyphen "-" indicates fewer than 20 responses)
Parents/Sponsors: 77 (33 %)
Students: 231 (97 %)
Overall Education
Parents/ Sponsors Students
National Parents
1. What grade would you give the public schools in the U.S.?
(Percent responding A and B) 32 % 58 % 18 %
2. What is the basis for your rating of the public schools in the U.S.?
My own experience(s) in the U.S. Public schools 92 % 71 %
What I've read in the newspapers or seen in the media 82 % 27 %
Friends and/or family 84 % 67 %
Other 13 % 10 %
3. What grade would you give the DoDEA schools overall? (Percent
responding A and B) 75 % 83 %
4. What grade would you give (your/your child's) school? (Percent
responding A and B) 74 % 80 % 77 %
5. One of the DoDEA schools' main goals is for all students to meet
or exceed challenging academic standards. Grade how well (your/your child's) school is meeting this goal right now. (Percent responding A and B)
73 % 81 %
6. How would you grade (your/your child's) school in preparing
students in the following subjects? (Percent responding A and B)
Reading 77 % 86 %
Writing 70 % 89 %
Mathematics 77 % 90 %
30
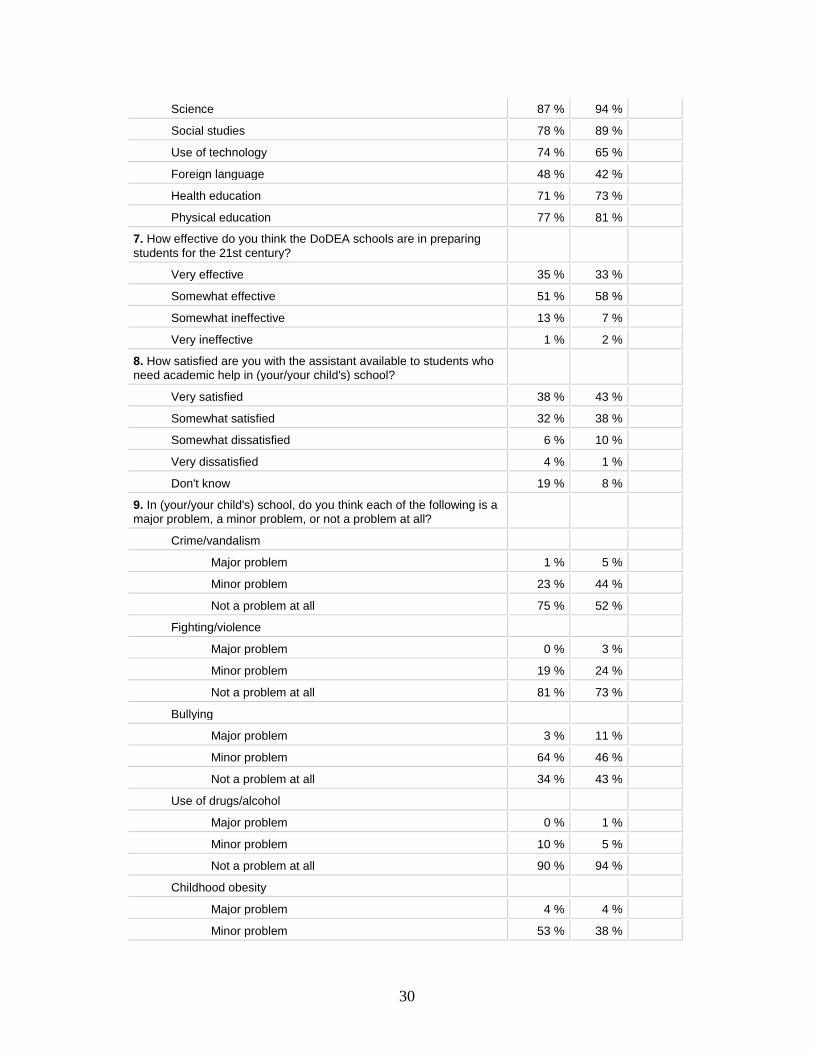
Science 87 % 94 %
Social studies 78 % 89 %
Use of technology 74 % 65 %
Foreign language 48 % 42 %
Health education 71 % 73 %
Physical education 77 % 81 %
7. How effective do you think the DoDEA schools are in preparing
students for the 21st century?
Very effective 35 % 33 %
Somewhat effective 51 % 58 %
Somewhat ineffective 13 % 7 %
Very ineffective 1 % 2 %
8. How satisfied are you with the assistant available to students who
need academic help in (your/your child's) school?
Very satisfied 38 % 43 %
Somewhat satisfied 32 % 38 %
Somewhat dissatisfied 6 % 10 %
Very dissatisfied 4 % 1 %
Don't know 19 % 8 %
9. In (your/your child's) school, do you think each of the following is a
major problem, a minor problem, or not a problem at all?
Crime/vandalism
Major problem 1 % 5 %
Minor problem 23 % 44 %
Not a problem at all 75 % 52 %
Fighting/violence
Major problem 0 % 3 %
Minor problem 19 % 24 %
Not a problem at all 81 % 73 %
Bullying
Major problem 3 % 11 %
Minor problem 64 % 46 %
Not a problem at all 34 % 43 %
Use of drugs/alcohol
Major problem 0 % 1 %
Minor problem 10 % 5 %
Not a problem at all 90 % 94 %
Childhood obesity
Major problem 4 % 4 %
Minor problem 53 % 38 %
31
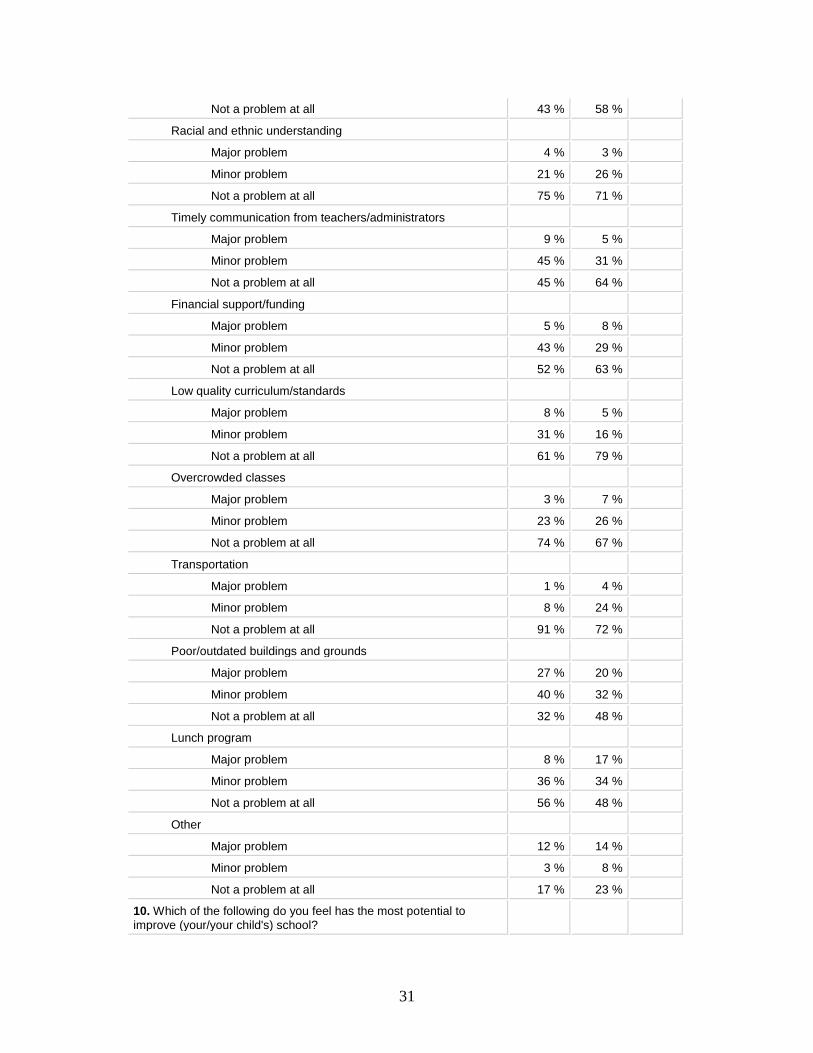
Not a problem at all 43 % 58 %
Racial and ethnic understanding
Major problem 4 % 3 %
Minor problem 21 % 26 %
Not a problem at all 75 % 71 %
Timely communication from teachers/administrators
Major problem 9 % 5 %
Minor problem 45 % 31 %
Not a problem at all 45 % 64 %
Financial support/funding
Major problem 5 % 8 %
Minor problem 43 % 29 %
Not a problem at all 52 % 63 %
Low quality curriculum/standards
Major problem 8 % 5 %
Minor problem 31 % 16 %
Not a problem at all 61 % 79 %
Overcrowded classes
Major problem 3 % 7 %
Minor problem 23 % 26 %
Not a problem at all 74 % 67 %
Transportation
Major problem 1 % 4 %
Minor problem 8 % 24 %
Not a problem at all 91 % 72 %
Poor/outdated buildings and grounds
Major problem 27 % 20 %
Minor problem 40 % 32 %
Not a problem at all 32 % 48 %
Lunch program
Major problem 8 % 17 %
Minor problem 36 % 34 %
Not a problem at all 56 % 48 %
Other
Major problem 12 % 14 %
Minor problem 3 % 8 %
Not a problem at all 17 % 23 %
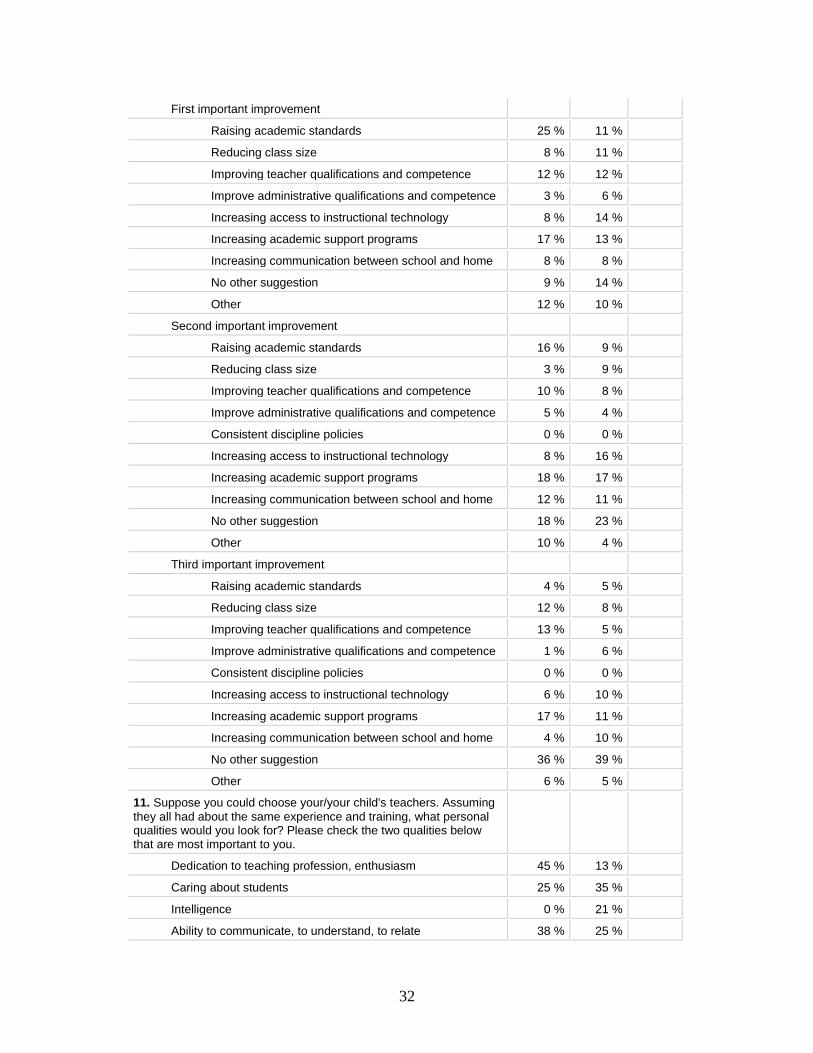
10. Which of the following do you feel has the most potential to
improve (your/your child's) school?
32
First important improvement
Raising academic standards 25 % 11 %
Reducing class size 8 % 11 %
Improving teacher qualifications and competence 12 % 12 %
Improve administrative qualifications and competence 3 % 6 %
Increasing access to instructional technology 8 % 14 %
Increasing academic support programs 17 % 13 %
Increasing communication between school and home 8 % 8 %
No other suggestion 9 % 14 %
Other 12 % 10 %
Second important improvement
Raising academic standards 16 % 9 %
Reducing class size 3 % 9 %
Improving teacher qualifications and competence 10 % 8 %
Improve administrative qualifications and competence 5 % 4 %
Consistent discipline policies 0 % 0 %
Increasing access to instructional technology 8 % 16 %
Increasing academic support programs 18 % 17 %
Increasing communication between school and home 12 % 11 %
No other suggestion 18 % 23 %
Other 10 % 4 %
Third important improvement
Raising academic standards 4 % 5 %
Reducing class size 12 % 8 %
Improving teacher qualifications and competence 13 % 5 %
Improve administrative qualifications and competence 1 % 6 %
Consistent discipline policies 0 % 0 %
Increasing access to instructional technology 6 % 10 %
Increasing academic support programs 17 % 11 %
Increasing communication between school and home 4 % 10 %
No other suggestion 36 % 39 %
Other 6 % 5 %
11. Suppose you could choose your/your child's teachers. Assuming
they all had about the same experience and training, what personal qualities would you look for? Please check the two qualities below that are most important to you.
Dedication to teaching profession, enthusiasm 45 % 13 %
Caring about students 25 % 35 %
Intelligence 0 % 21 %
Ability to communicate, to understand, to relate 38 % 25 %
33
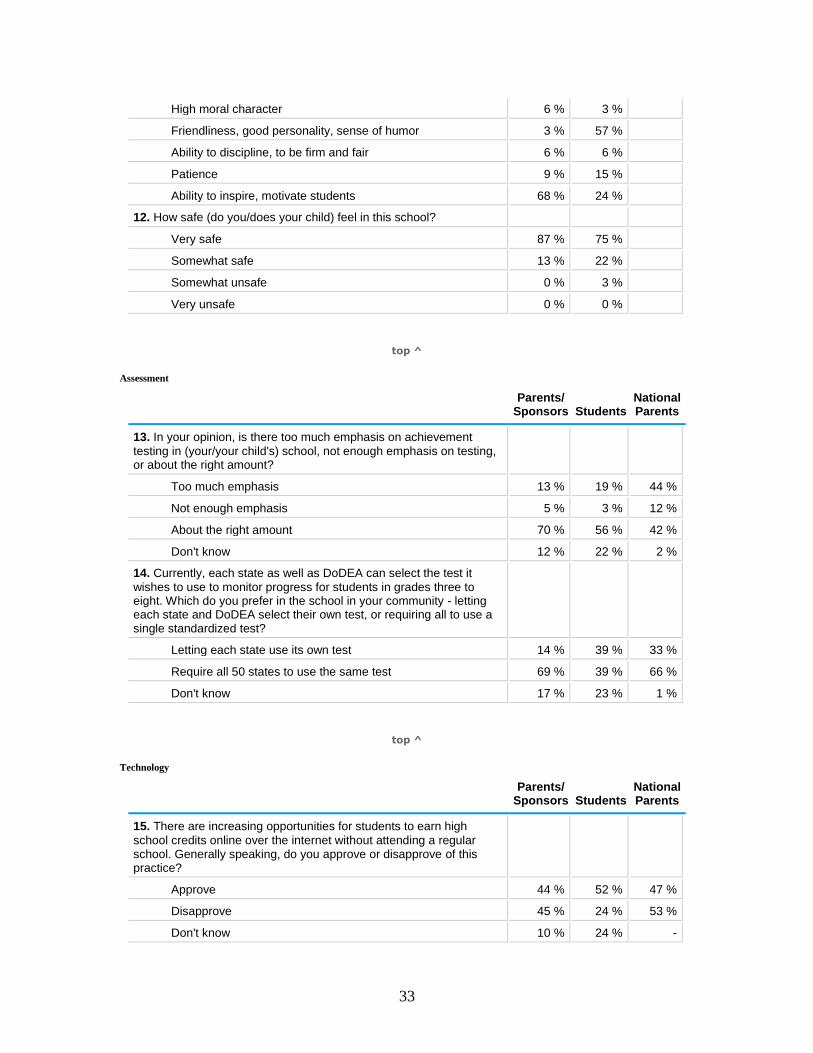
High moral character 6 % 3 %
Friendliness, good personality, sense of humor 3 % 57 %
Ability to discipline, to be firm and fair 6 % 6 %
Patience 9 % 15 %
Ability to inspire, motivate students 68 % 24 %
12. How safe (do you/does your child) feel in this school?
Very safe 87 % 75 %
Somewhat safe 13 % 22 %
Somewhat unsafe 0 % 3 %
Very unsafe 0 % 0 %
top ^
Assessment
Parents/ Sponsors Students
National Parents
13. In your opinion, is there too much emphasis on achievement
testing in (your/your child's) school, not enough emphasis on testing, or about the right amount?
Too much emphasis 13 % 19 % 44 %
Not enough emphasis 5 % 3 % 12 %
About the right amount 70 % 56 % 42 %
Don't know 12 % 22 % 2 %
14. Currently, each state as well as DoDEA can select the test it
wishes to use to monitor progress for students in grades three to eight. Which do you prefer in the school in your community - letting each state and DoDEA select their own test, or requiring all to use a single standardized test?
Letting each state use its own test 14 % 39 % 33 %
Require all 50 states to use the same test 69 % 39 % 66 %
Don't know 17 % 23 % 1 %
top ^
Technology
Parents/ Sponsors Students
National Parents
15. There are increasing opportunities for students to earn high
school credits online over the internet without attending a regular school. Generally speaking, do you approve or disapprove of this practice?
Approve 44 % 52 % 47 %
Disapprove 45 % 24 % 53 %
Don't know 10 % 24 % -
34
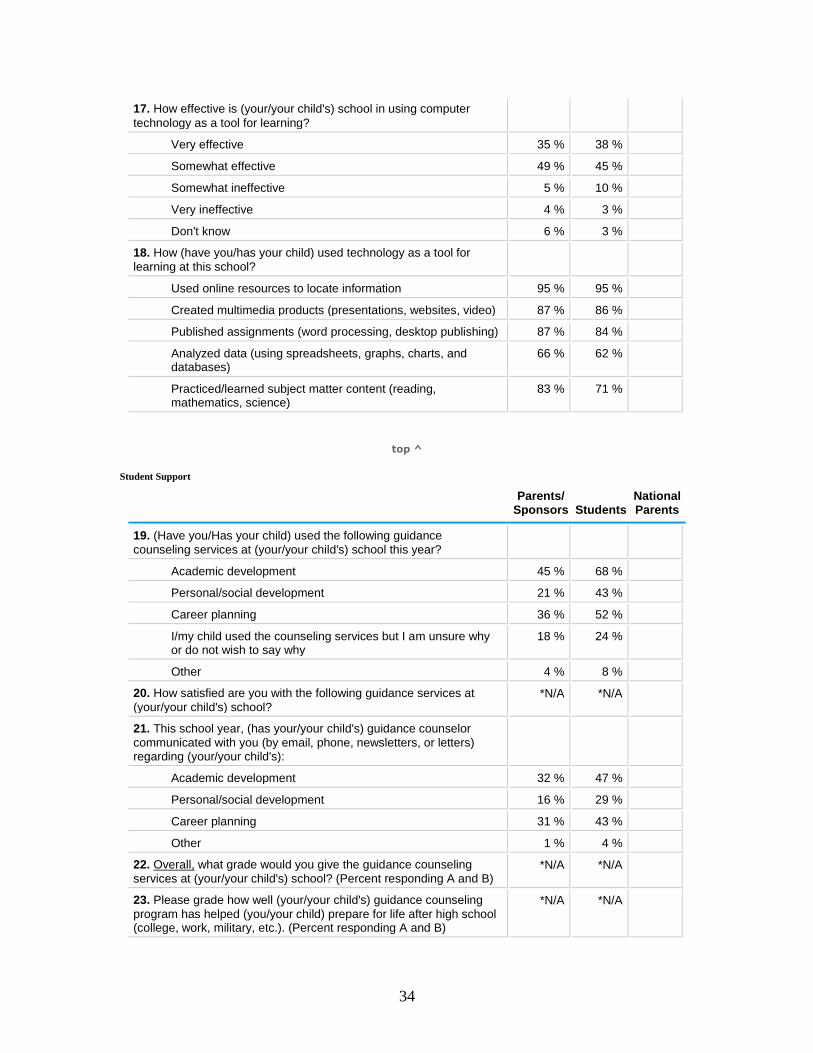
17. How effective is (your/your child's) school in using computer
technology as a tool for learning?
Very effective 35 % 38 %
Somewhat effective 49 % 45 %
Somewhat ineffective 5 % 10 %
Very ineffective 4 % 3 %
Don't know 6 % 3 %
18. How (have you/has your child) used technology as a tool for
learning at this school?
Used online resources to locate information 95 % 95 %
Created multimedia products (presentations, websites, video) 87 % 86 %
Published assignments (word processing, desktop publishing) 87 % 84 %
Analyzed data (using spreadsheets, graphs, charts, and databases)
66 % 62 %
Practiced/learned subject matter content (reading, mathematics, science)
83 % 71 %
top ^
Student Support
Parents/ Sponsors Students
National Parents
19. (Have you/Has your child) used the following guidance
counseling services at (your/your child's) school this year?
Academic development 45 % 68 %
Personal/social development 21 % 43 %
Career planning 36 % 52 %
I/my child used the counseling services but I am unsure why or do not wish to say why
18 % 24 %
Other 4 % 8 %
20. How satisfied are you with the following guidance services at
(your/your child's) school? *N/A *N/A
21. This school year, (has your/your child's) guidance counselor
communicated with you (by email, phone, newsletters, or letters) regarding (your/your child's):
Academic development 32 % 47 %
Personal/social development 16 % 29 %
Career planning 31 % 43 %
Other 1 % 4 %
22. Overall, what grade would you give the guidance counseling
services at (your/your child's) school? (Percent responding A and B) *N/A *N/A
23. Please grade how well (your/your child's) guidance counseling
program has helped (you/your child) prepare for life after high school (college, work, military, etc.). (Percent responding A and B)
*N/A *N/A
35
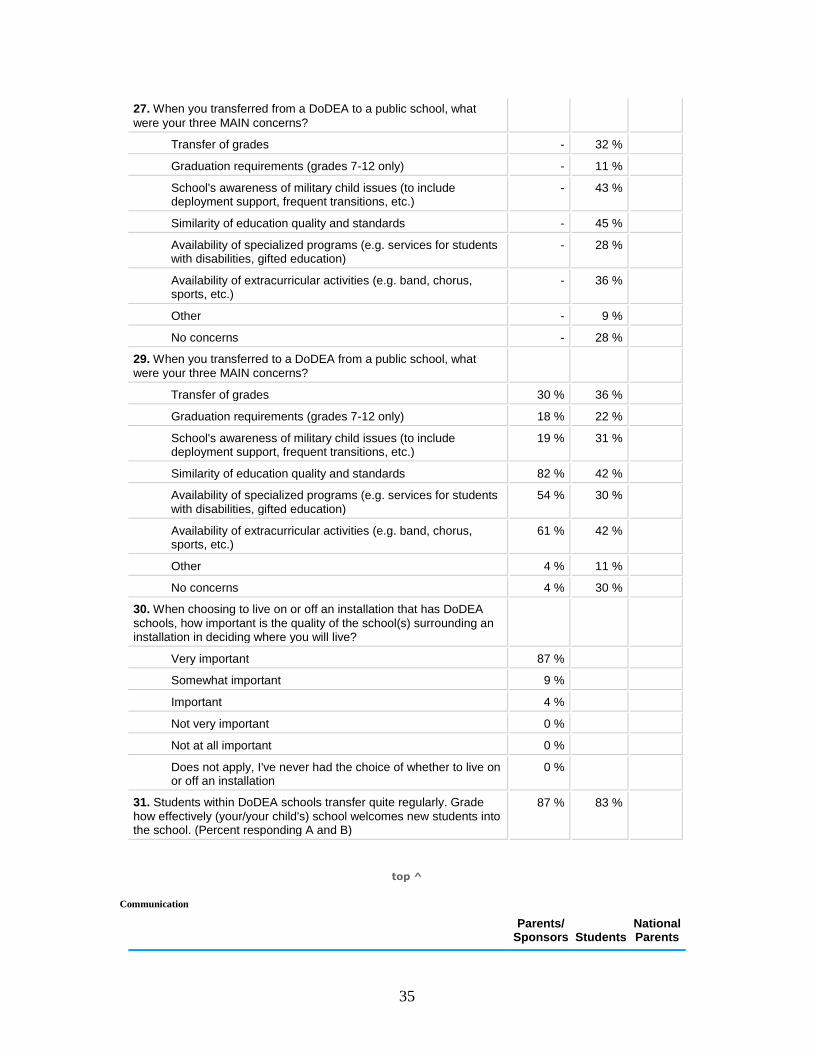
27. When you transferred from a DoDEA to a public school, what
were your three MAIN concerns?
Transfer of grades - 32 %
Graduation requirements (grades 7-12 only) - 11 %
School's awareness of military child issues (to include deployment support, frequent transitions, etc.)
- 43 %
Similarity of education quality and standards - 45 %
Availability of specialized programs (e.g. services for students with disabilities, gifted education)
- 28 %
Availability of extracurricular activities (e.g. band, chorus, sports, etc.)
- 36 %
Other - 9 %
No concerns - 28 %
29. When you transferred to a DoDEA from a public school, what
were your three MAIN concerns?
Transfer of grades 30 % 36 %
Graduation requirements (grades 7-12 only) 18 % 22 %
School's awareness of military child issues (to include deployment support, frequent transitions, etc.)
19 % 31 %
Similarity of education quality and standards 82 % 42 %
Availability of specialized programs (e.g. services for students with disabilities, gifted education)
54 % 30 %
Availability of extracurricular activities (e.g. band, chorus, sports, etc.)
61 % 42 %
Other 4 % 11 %
No concerns 4 % 30 %
30. When choosing to live on or off an installation that has DoDEA
schools, how important is the quality of the school(s) surrounding an installation in deciding where you will live?
Very important 87 %
Somewhat important 9 %
Important 4 %
Not very important 0 %
Not at all important 0 %
Does not apply, I've never had the choice of whether to live on or off an installation
0 %
31. Students within DoDEA schools transfer quite regularly. Grade
how effectively (your/your child's) school welcomes new students into the school. (Percent responding A and B)
87 % 83 %
top ^
Communication
Parents/ Sponsors Students
National Parents
36
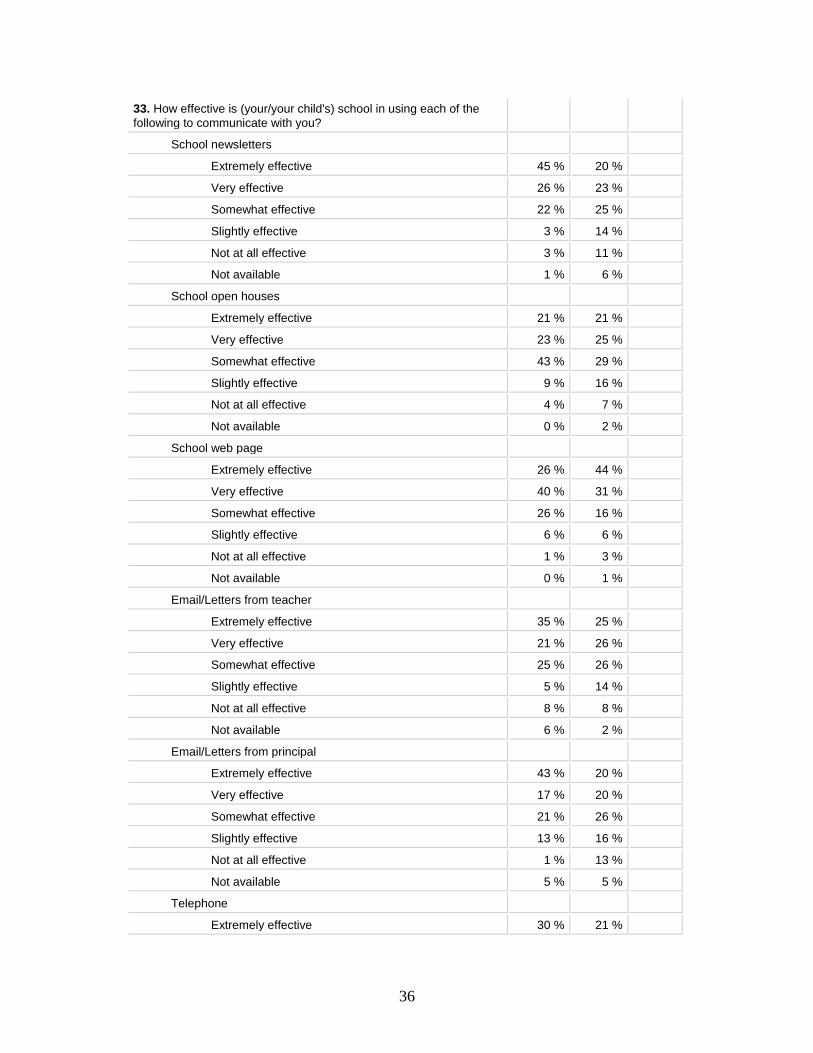
33. How effective is (your/your child's) school in using each of the
following to communicate with you?
School newsletters
Extremely effective 45 % 20 %
Very effective 26 % 23 %
Somewhat effective 22 % 25 %
Slightly effective 3 % 14 %
Not at all effective 3 % 11 %
Not available 1 % 6 %
School open houses
Extremely effective 21 % 21 %
Very effective 23 % 25 %
Somewhat effective 43 % 29 %
Slightly effective 9 % 16 %
Not at all effective 4 % 7 %
Not available 0 % 2 %
School web page
Extremely effective 26 % 44 %
Very effective 40 % 31 %
Somewhat effective 26 % 16 %
Slightly effective 6 % 6 %
Not at all effective 1 % 3 %
Not available 0 % 1 %
Email/Letters from teacher
Extremely effective 35 % 25 %
Very effective 21 % 26 %
Somewhat effective 25 % 26 %
Slightly effective 5 % 14 %
Not at all effective 8 % 8 %
Not available 6 % 2 %
Email/Letters from principal
Extremely effective 43 % 20 %
Very effective 17 % 20 %
Somewhat effective 21 % 26 %
Slightly effective 13 % 16 %
Not at all effective 1 % 13 %
Not available 5 % 5 %
Telephone
Extremely effective 30 % 21 %
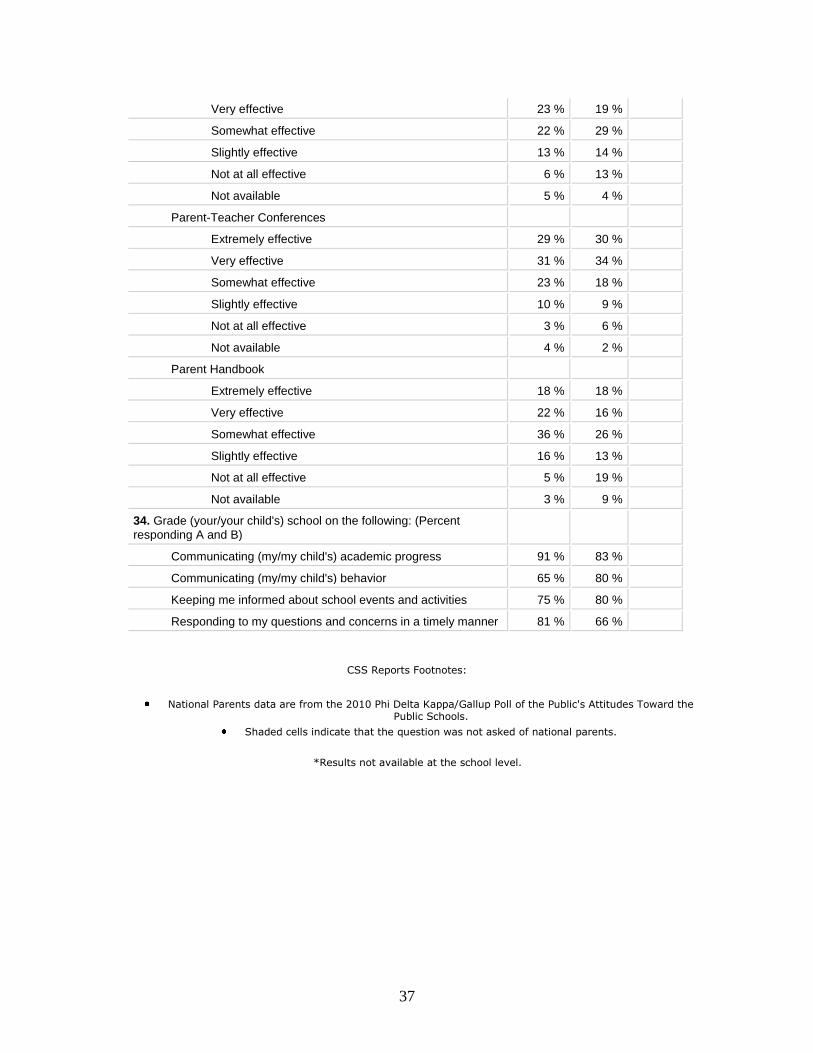
37
Very effective 23 % 19 %
Somewhat effective 22 % 29 %
Slightly effective 13 % 14 %
Not at all effective 6 % 13 %
Not available 5 % 4 %
Parent-Teacher Conferences
Extremely effective 29 % 30 %
Very effective 31 % 34 %
Somewhat effective 23 % 18 %
Slightly effective 10 % 9 %
Not at all effective 3 % 6 %
Not available 4 % 2 %
Parent Handbook
Extremely effective 18 % 18 %
Very effective 22 % 16 %
Somewhat effective 36 % 26 %
Slightly effective 16 % 13 %
Not at all effective 5 % 19 %
Not available 3 % 9 %
34. Grade (your/your child's) school on the following: (Percent
responding A and B)
Communicating (my/my child's) academic progress 91 % 83 %
Communicating (my/my child's) behavior 65 % 80 %
Keeping me informed about school events and activities 75 % 80 %
Responding to my questions and concerns in a timely manner 81 % 66 %
CSS Reports Footnotes:
National Parents data are from the 2010 Phi Delta Kappa/Gallup Poll of the Public's Attitudes Toward the Public Schools.
Shaded cells indicate that the question was not asked of national parents.
*Results not available at the school level.
38
Data 2006 - 2010
The following pages contain data that determined our goals and our progress
toward those goals.
The following instruments were used to collect data regarding student performance:
Terra Nova Multiple Assessments, Terra Nova Objective Performance Index, Terra
Nova Communication Arts Performance Arts Assessments, Scholastic Reading
Inventory Assessment, Terra Nova Objective Performance Index for Science and
Terra Nova Objective Performance Index for Math, Teacher evaluation assessment,
and Environmental scan.
Analysis of Data: Data Decision Making Matrix
The school leadership team reviewed the standardized testing instruments that are
administered to West Point Middle School students and decided to use the four
assessments listed in the first paragraph. At that point, the entire faculty reviewed
each assessment and the associated data. After reviewing the data, the faculty
determined our focus area from these findings.
The matrix below describes the results with these data instruments. The data for
each individual assessment and a brief description of the findings are on the
following pages.
In 2007 we returned to our assessments and added another dimension of teacher
evaluation assessment for Goal 2.

39
Test
(Report)
Finding 1 Finding 2 Finding 3 Finding 4 Finding 5
Terra Nova
MA
(Assessment
Summary)
(March 7,
2006)
Decline in
Language Arts in
all grades except 7
Improvement
in Reading
across the
grades.
Decline in
math across
the grades
in the lowest
quartiles.
Goal 2 2007
TNMA
OPI
(February
17, 2006)
Science
2007 Goal 2
Decline in Science
Inquiry scores
TNMA
OPI
(February
17, 2006)
Math
Decline in
Language Skills-
especially Editing
Skills
Decline in
Language
Skills-
Sentence
Structure and
Writing
Strategies
Decline in
Reading
Strategies-
(Evaluate
and Extend
Meaning
and Identify
Reading
Strategies)
Decline in Math
Communication
Goal 2 2007
TN
CAPA
(March 7,
2006)
Writing effectively
is a lower score
compared to other
writing and reading
strands.
Bottom quartile
has been
getting smaller.
Extended
meaning in
reading
strategies is
a weak area
but
generally
reading has
improved.
Scholastic
Reading
Inventory
(March 1,
2006)
This assessment
indicated that the
school-wide goal of
reading is not
justified. Cohort
group which
showed deficiencies
only represented
8% of the total
population.
Proficient or
Advanced in
Grade 5 for
2004-2005 was
78%
For 2005-
2006—87%
Proficient
or
Advanced in
Grade 6 for
2004-2005
was 85%
For 2005-
2006—84%
Proficient or
Advanced in
Grade 7 for
2004-2005 was
82%
For 2005-2006—
85%
Proficient or
Advanced in
Grade 8 for
2004-2005
was 90%
For 2005-
2006—97%
40
Data Decision Making Matrix
Presentation of Student Data
The following graphs illustrate the information in the Decision Making Matrix and
there is a brief description of our findings for each graph.
The Terra Nova Multiple Assessment test measures skills in reading, language,
math, science, and social studies. This assessment is administered in early spring.
The faculty determined that social studies and science results did not present any
significant findings. However, language arts showed a decline in all grades except
grade seven. Next, reading improved across the grades. Finally, a decline was
found in the lowest quartiles in math.
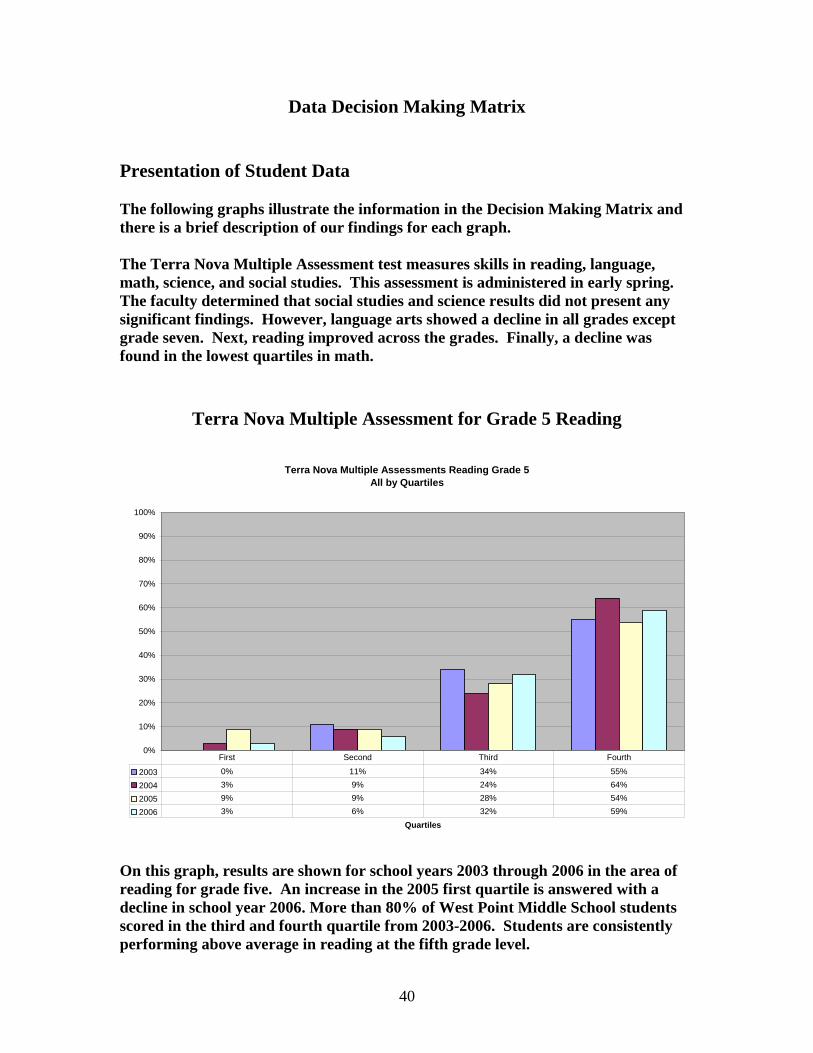
Terra Nova Multiple Assessment for Grade 5 Reading
Terra Nova Multiple Assessments Reading Grade 5
All by Quartiles
0%
10%
20%
30%
40%
50%
60%
70%
80%
90%
100%
Quartiles
2003 0% 11% 34% 55%
2004 3% 9% 24% 64%
2005 9% 9% 28% 54%
2006 3% 6% 32% 59%
First Second Third Fourth
On this graph, results are shown for school years 2003 through 2006 in the area of
reading for grade five. An increase in the 2005 first quartile is answered with a
decline in school year 2006. More than 80% of West Point Middle School students
scored in the third and fourth quartile from 2003-2006. Students are consistently
performing above average in reading at the fifth grade level.

41
Terra Nova Multiple Assessment for Grade 5 Language Arts
Terra Nova Multiple Assessments Language Grade 5
All by Quartiles
0%
10%
20%
30%
40%
50%
60%
70%
80%
90%
100%
Quartiles
2003 3% 13% 32% 52%
2004 2% 15% 31% 52%
2005 5% 15% 31% 49%
2006 1% 7% 24% 68%
First Second Third Fourth
A decrease can be seen in the first and second quartiles over the 2003 to 2006 time
period, while the third and fourth quartiles continually total 80% or higher.
Students are consistently performing above average in language arts at the fifth
grade level.
42
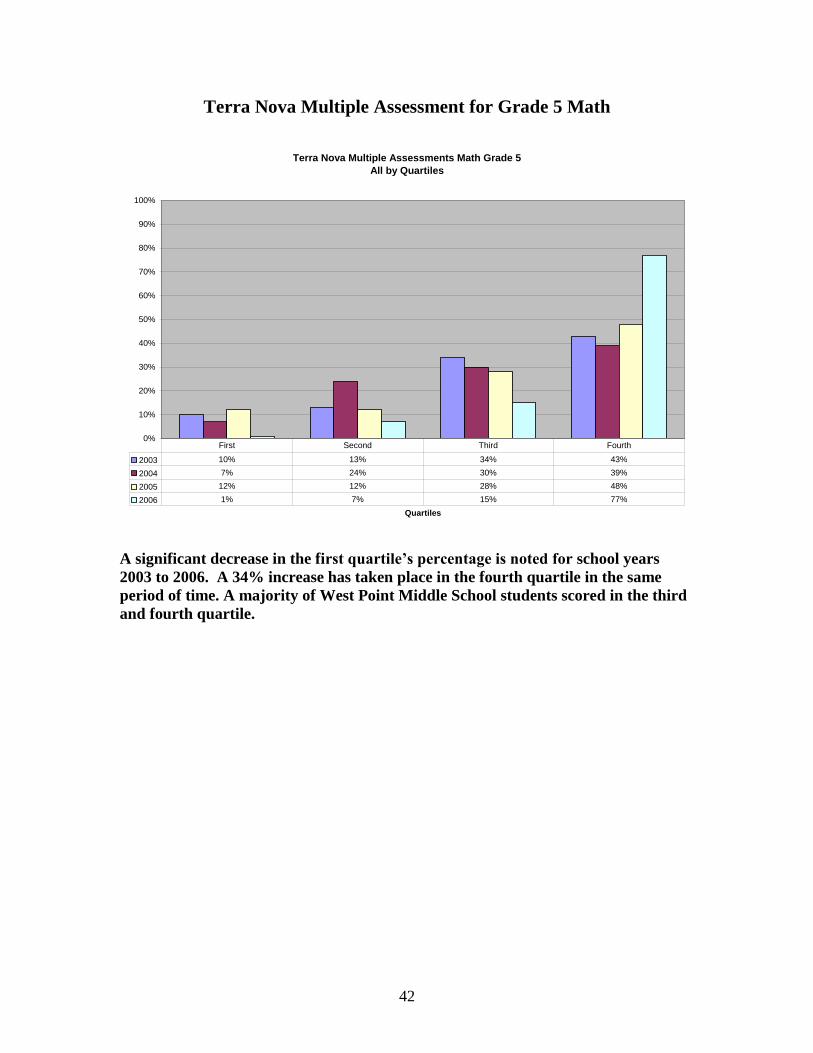
Terra Nova Multiple Assessment for Grade 5 Math
Terra Nova Multiple Assessments Math Grade 5
All by Quartiles
0%
10%
20%
30%
40%
50%
60%
70%
80%
90%
100%
Quartiles
2003 10% 13% 34% 43%
2004 7% 24% 30% 39%
2005 12% 12% 28% 48%
2006 1% 7% 15% 77%
First Second Third Fourth
A significant decrease in the first quartile’s percentage is noted for school years
2003 to 2006. A 34% increase has taken place in the fourth quartile in the same
period of time. A majority of West Point Middle School students scored in the third
and fourth quartile.

43
Terra Nova Multiple Assessment for Grade 6 Reading
Terra Nova Multiple Assessments Reading Grade 6
All by Quartiles
0%
10%
20%
30%
40%
50%
60%
70%
80%
90%
100%
Quartiles
2003 0% 8% 22% 70%
2004 5% 3% 37% 55%
2005 0% 10% 32% 58%
2006 0% 20% 28% 52%
First Second Third Fourth
On this graph the combined third and fourth quartiles show percentages of 92%,
92%, 90%, and 80% for SY 2003-06. Please note that the first quartile has reported
0% for three out of the four years.
44
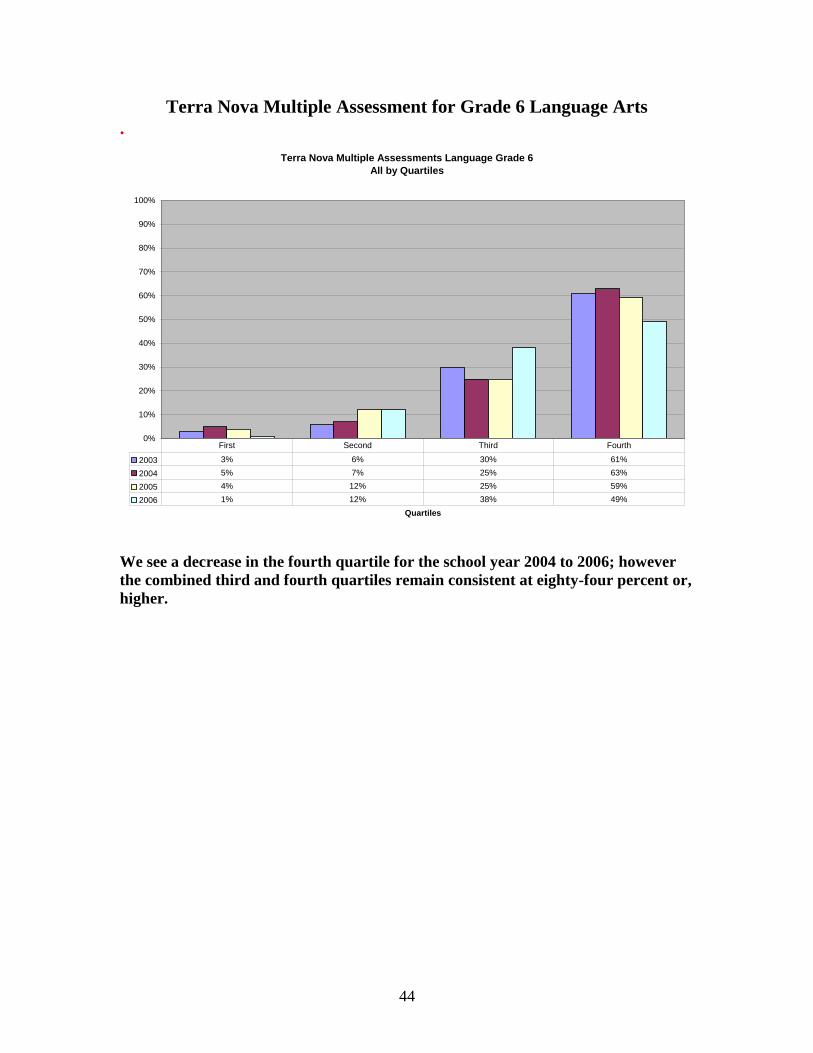
Terra Nova Multiple Assessment for Grade 6 Language Arts
.
Terra Nova Multiple Assessments Language Grade 6
All by Quartiles
0%
10%
20%
30%
40%
50%
60%
70%
80%
90%
100%
Quartiles
2003 3% 6% 30% 61%
2004 5% 7% 25% 63%
2005 4% 12% 25% 59%
2006 1% 12% 38% 49%
First Second Third Fourth
We see a decrease in the fourth quartile for the school year 2004 to 2006; however
the combined third and fourth quartiles remain consistent at eighty-four percent or,
higher.

45
Terra Nova Multiple Assessment for Grade 6 Math
Terra Nova Multiple Assessments Math Grade 6
All by Quartiles
0%
10%
20%
30%
40%
50%
60%
70%
80%
90%
100%
Quartiles
2003 6% 6% 23% 65%
2004 8% 7% 20% 65%
2005 1% 12% 21% 66%
2006 5% 15% 25% 55%
First Second Third Fourth
Slight increases in the first and second quartiles are noted for 2005-2006, with the
third quartile increasing over the same period of time. Total scores in third quartile
and fourth quartile remained fairly constant at 80% or better.
46
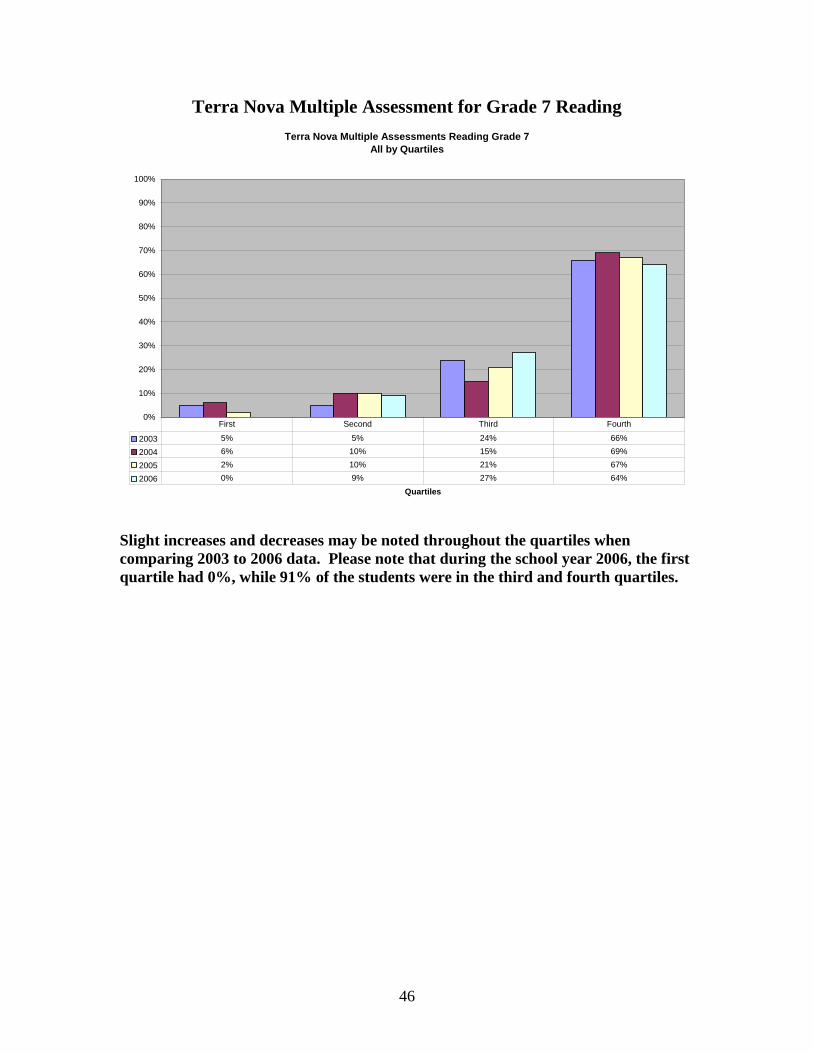
Terra Nova Multiple Assessment for Grade 7 Reading
Terra Nova Multiple Assessments Reading Grade 7
All by Quartiles
0%
10%
20%
30%
40%
50%
60%
70%
80%
90%
100%
Quartiles
2003 5% 5% 24% 66%
2004 6% 10% 15% 69%
2005 2% 10% 21% 67%
2006 0% 9% 27% 64%
First Second Third Fourth
Slight increases and decreases may be noted throughout the quartiles when
comparing 2003 to 2006 data. Please note that during the school year 2006, the first
quartile had 0%, while 91% of the students were in the third and fourth quartiles.
47
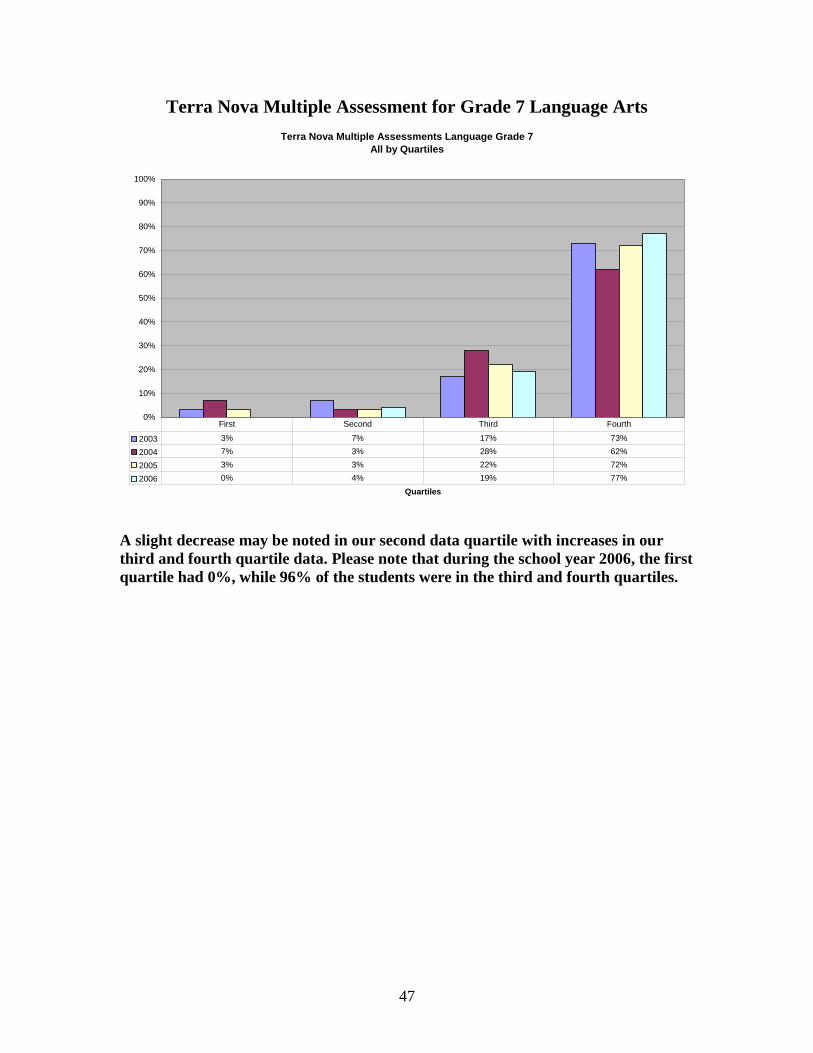
Terra Nova Multiple Assessment for Grade 7 Language Arts
Terra Nova Multiple Assessments Language Grade 7
All by Quartiles
0%
10%
20%
30%
40%
50%
60%
70%
80%
90%
100%
Quartiles
2003 3% 7% 17% 73%
2004 7% 3% 28% 62%
2005 3% 3% 22% 72%
2006 0% 4% 19% 77%
First Second Third Fourth
A slight decrease may be noted in our second data quartile with increases in our
third and fourth quartile data. Please note that during the school year 2006, the first
quartile had 0%, while 96% of the students were in the third and fourth quartiles.
48
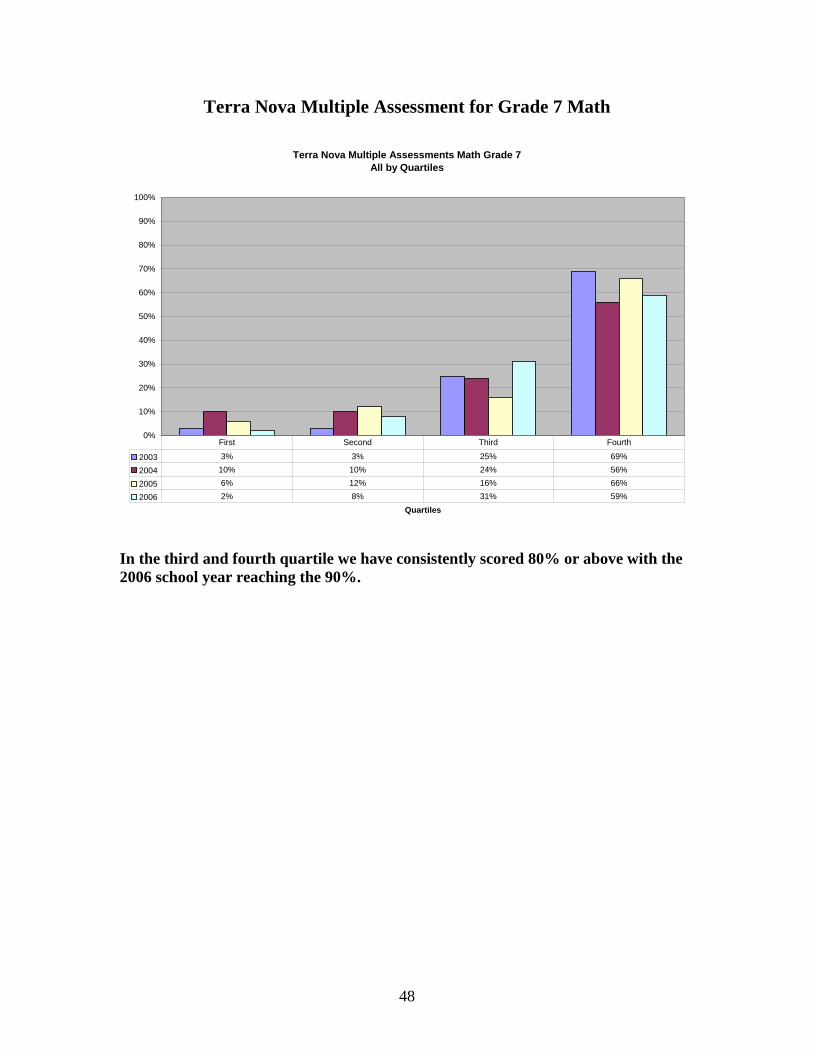
Terra Nova Multiple Assessment for Grade 7 Math
Terra Nova Multiple Assessments Math Grade 7
All by Quartiles
0%
10%
20%
30%
40%
50%
60%
70%
80%
90%
100%
Quartiles
2003 3% 3% 25% 69%
2004 10% 10% 24% 56%
2005 6% 12% 16% 66%
2006 2% 8% 31% 59%
First Second Third Fourth
In the third and fourth quartile we have consistently scored 80% or above with the
2006 school year reaching the 90%.
49
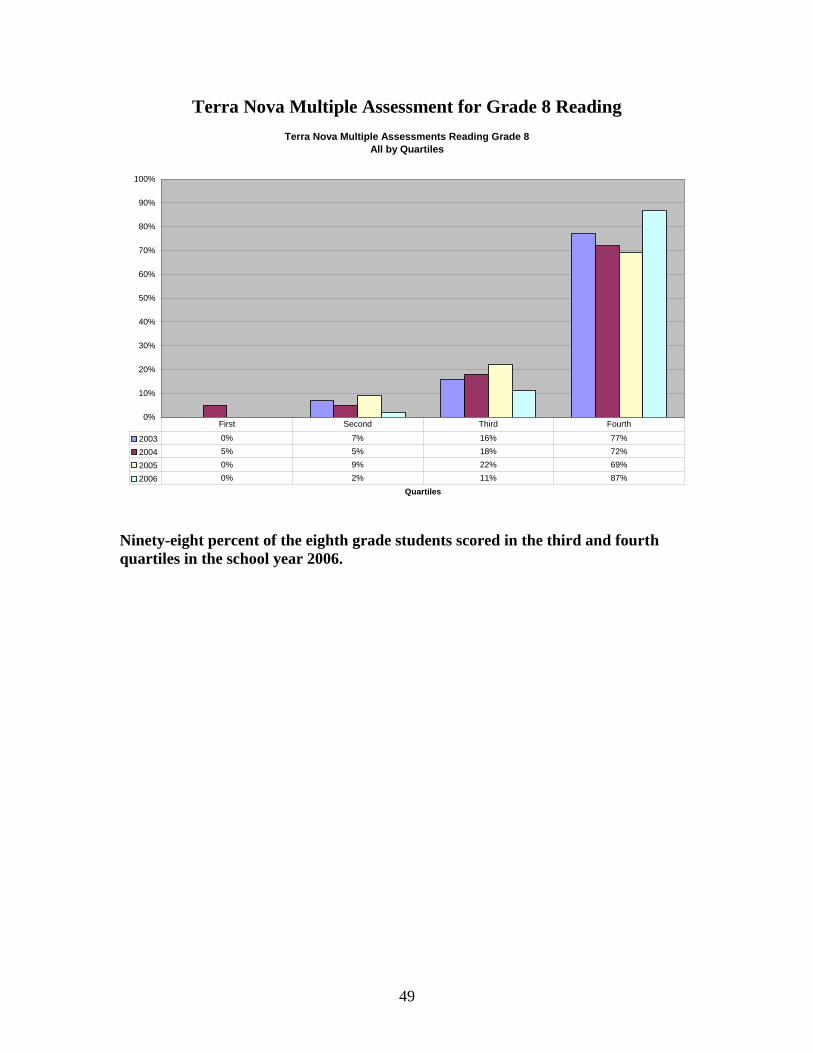
Terra Nova Multiple Assessment for Grade 8 Reading
Terra Nova Multiple Assessments Reading Grade 8
All by Quartiles
0%
10%
20%
30%
40%
50%
60%
70%
80%
90%
100%
Quartiles
2003 0% 7% 16% 77%
2004 5% 5% 18% 72%
2005 0% 9% 22% 69%
2006 0% 2% 11% 87%
First Second Third Fourth
Ninety-eight percent of the eighth grade students scored in the third and fourth
quartiles in the school year 2006.
50
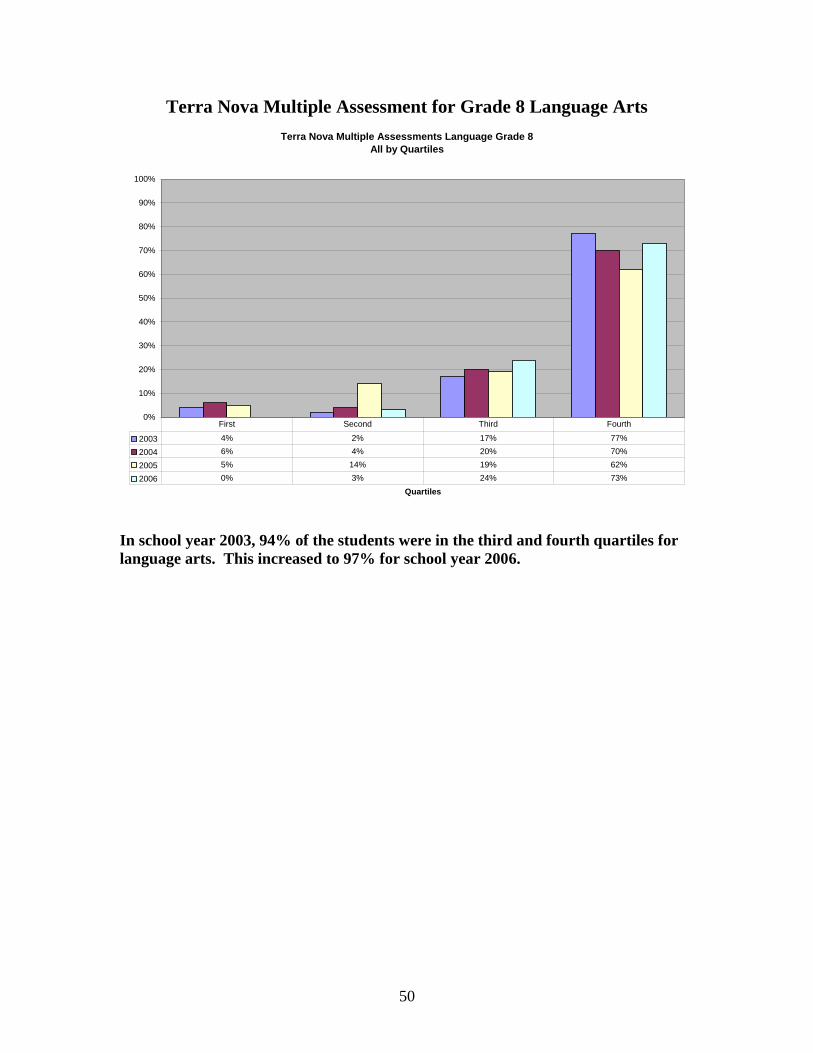
Terra Nova Multiple Assessment for Grade 8 Language Arts
Terra Nova Multiple Assessments Language Grade 8
All by Quartiles
0%
10%
20%
30%
40%
50%
60%
70%
80%
90%
100%
Quartiles
2003 4% 2% 17% 77%
2004 6% 4% 20% 70%
2005 5% 14% 19% 62%
2006 0% 3% 24% 73%
First Second Third Fourth
In school year 2003, 94% of the students were in the third and fourth quartiles for
language arts. This increased to 97% for school year 2006.

51
Terra Nova Multiple Assessment for Grade 8 Math
Terra Nova Multiple Assessments Math Grade 8
All by Quartiles
0%
10%
20%
30%
40%
50%
60%
70%
80%
90%
100%
Quartiles
2003 0% 3% 17% 80%
2004 9% 2% 9% 80%
2005 6% 14% 16% 64%
2006 2% 5% 13% 80%
First Second Third Fourth
Consistency may be noted in the fourth quartile as 80% of the students are within
this quartile for three out of four reporting years.
52
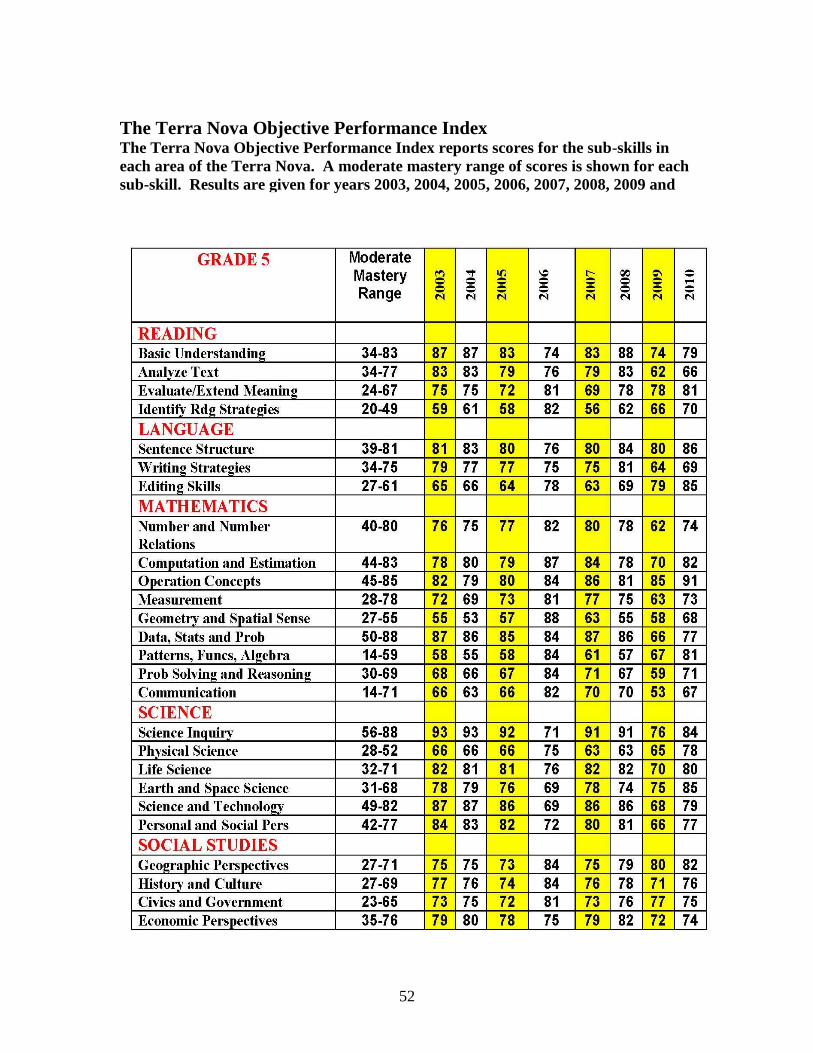
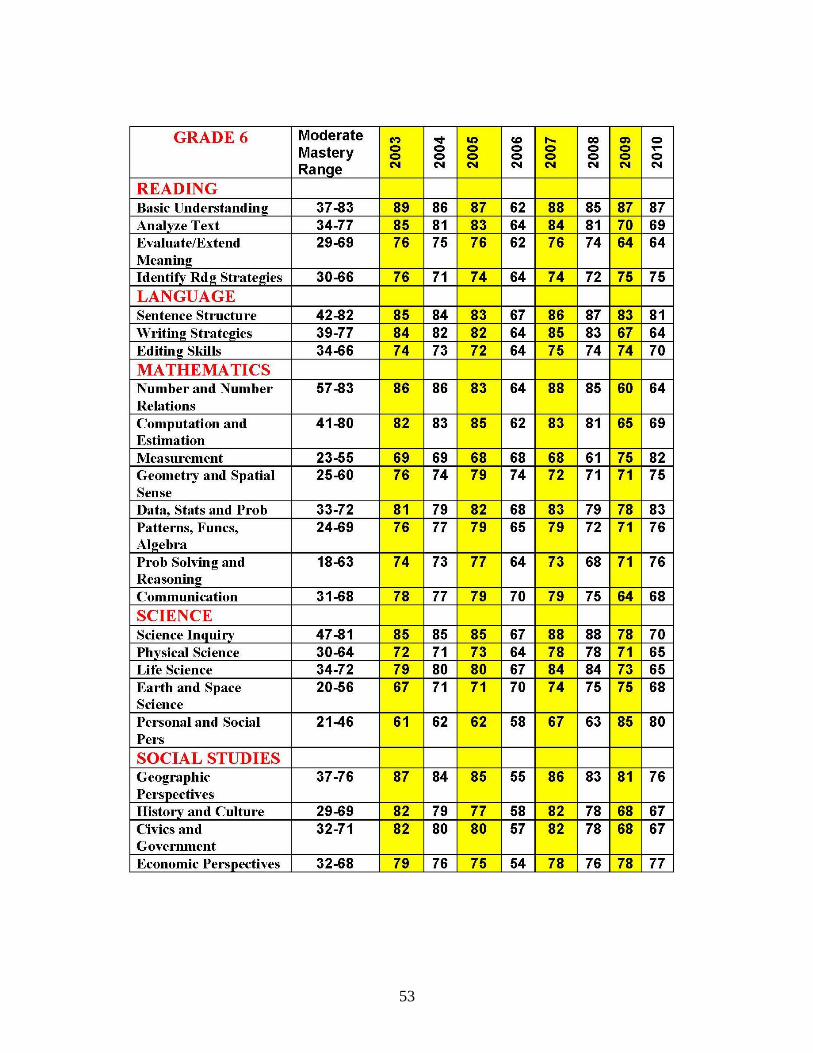
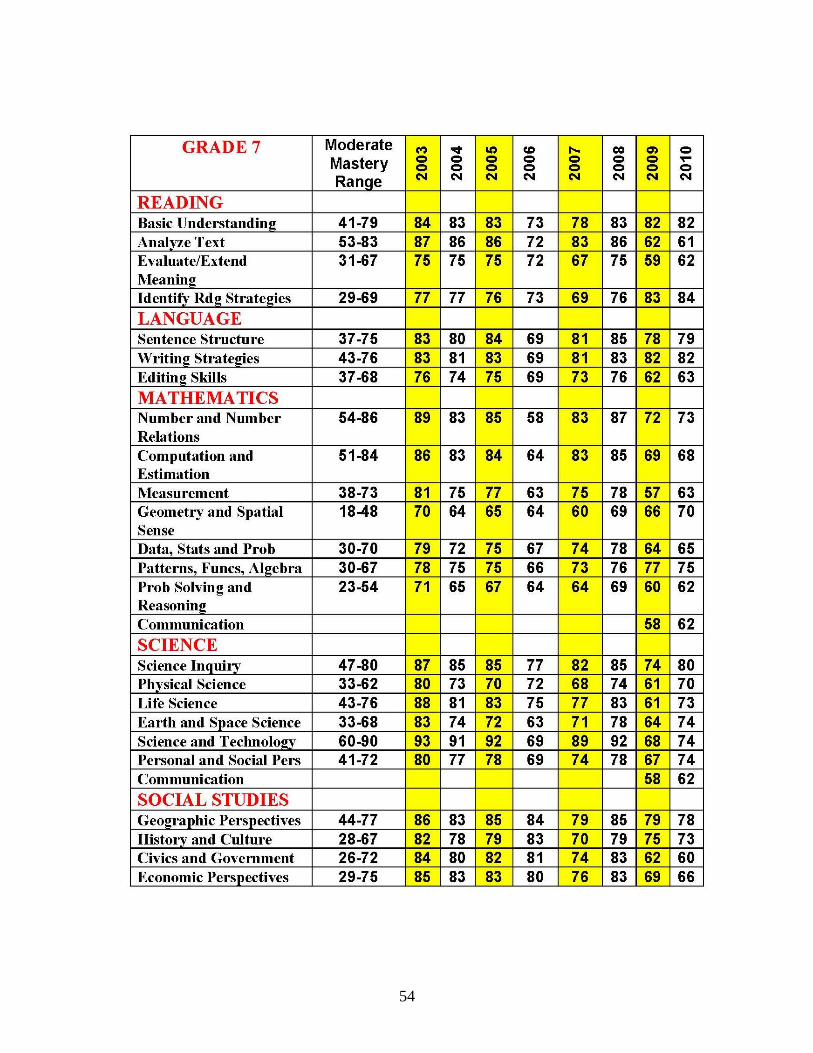
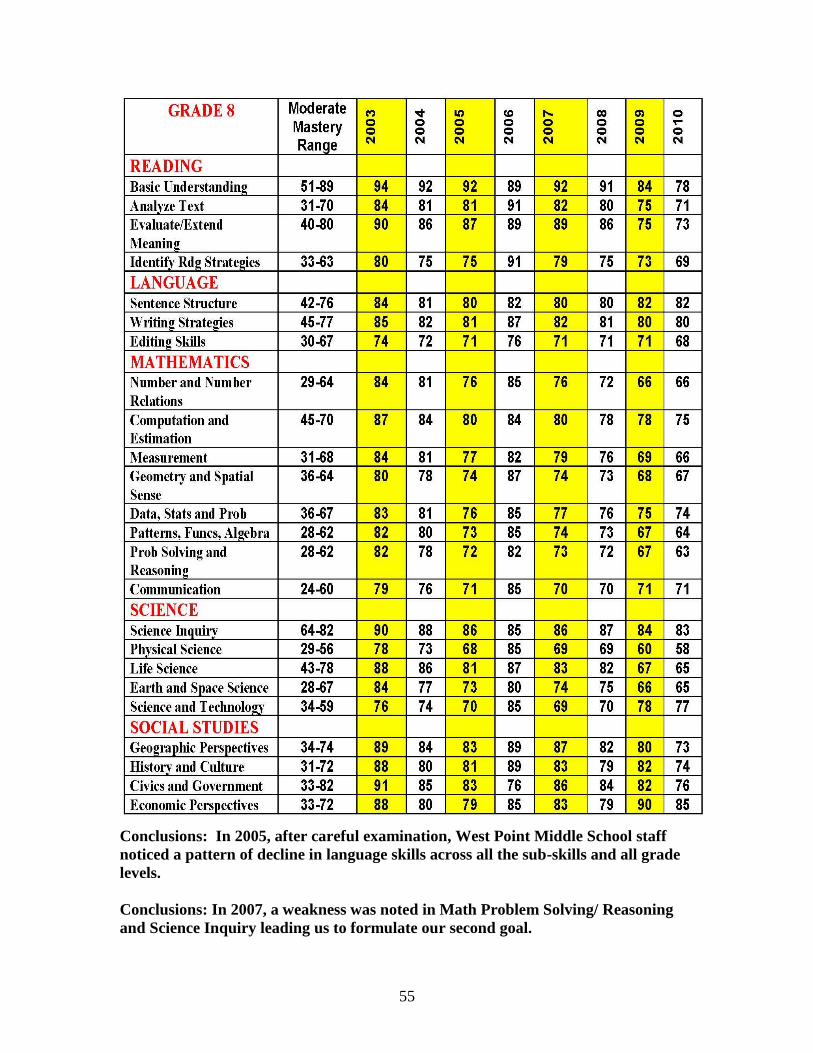
The Terra Nova Objective Performance Index The Terra Nova Objective Performance Index reports scores for the sub-skills in
each area of the Terra Nova. A moderate mastery range of scores is shown for each
sub-skill. Results are given for years 2003, 2004, 2005, 2006, 2007, 2008, 2009 and
2010.
53
54
55
Conclusions: In 2005, after careful examination, West Point Middle School staff
noticed a pattern of decline in language skills across all the sub-skills and all grade
levels.
Conclusions: In 2007, a weakness was noted in Math Problem Solving/ Reasoning
and Science Inquiry leading us to formulate our second goal.
56
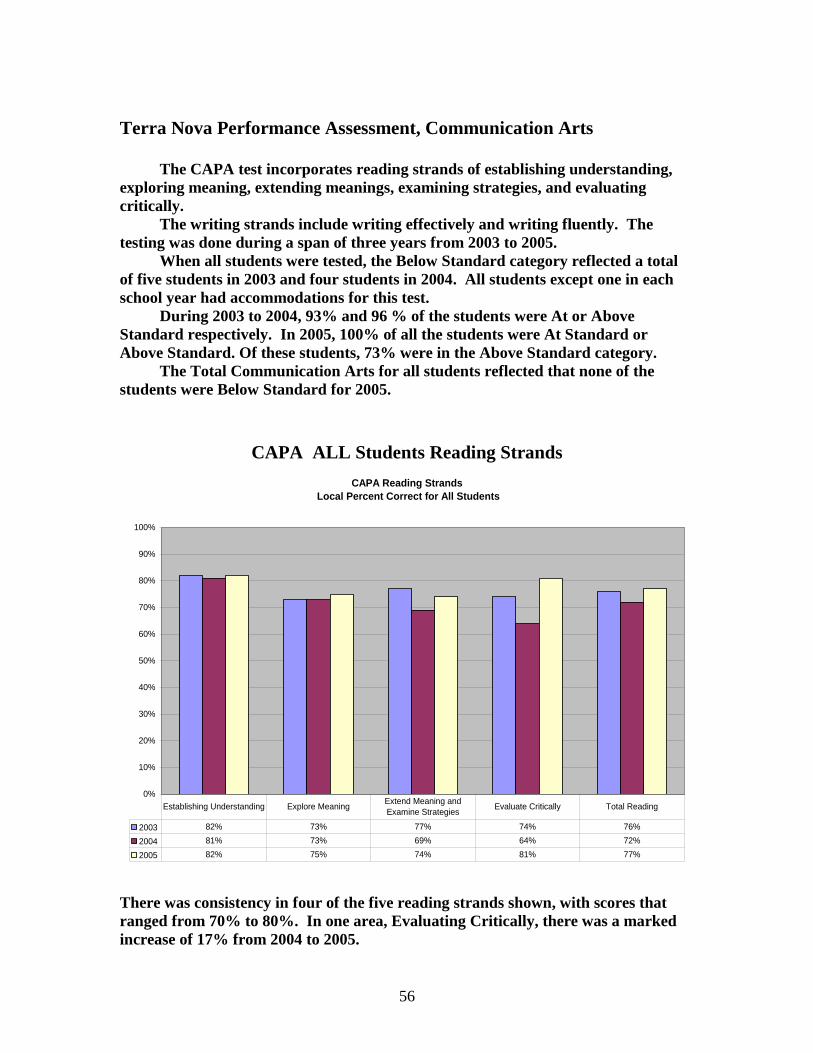
Terra Nova Performance Assessment, Communication Arts
The CAPA test incorporates reading strands of establishing understanding,
exploring meaning, extending meanings, examining strategies, and evaluating
critically.
The writing strands include writing effectively and writing fluently. The
testing was done during a span of three years from 2003 to 2005.
When all students were tested, the Below Standard category reflected a total
of five students in 2003 and four students in 2004. All students except one in each
school year had accommodations for this test.
During 2003 to 2004, 93% and 96 % of the students were At or Above
Standard respectively. In 2005, 100% of all the students were At Standard or
Above Standard. Of these students, 73% were in the Above Standard category.
The Total Communication Arts for all students reflected that none of the
students were Below Standard for 2005.
CAPA ALL Students Reading Strands
CAPA Reading Strands
Local Percent Correct for All Students
0%
10%
20%
30%
40%
50%
60%
70%
80%
90%
100%
2003 82% 73% 77% 74% 76%
2004 81% 73% 69% 64% 72%
2005 82% 75% 74% 81% 77%
Establishing Understanding Explore MeaningExtend Meaning and
Examine StrategiesEvaluate Critically Total Reading
There was consistency in four of the five reading strands shown, with scores that
ranged from 70% to 80%. In one area, Evaluating Critically, there was a marked
increase of 17% from 2004 to 2005.

57
CAPA All Students Writing Strands
CAPA Writing Strands
Local Percent Correct for All Students
0%
10%
20%
30%
40%
50%
60%
70%
80%
90%
100%
2003 71% 88% 77%
2004 69% 79% 72%
2005 76% 85% 79%
Write Effectively Write Fluently Total Writing
This graph shows an increase of 6% to 7% in all writing strands from 2004 to 2005.
Total Writing percentiles remain above 70%.
58
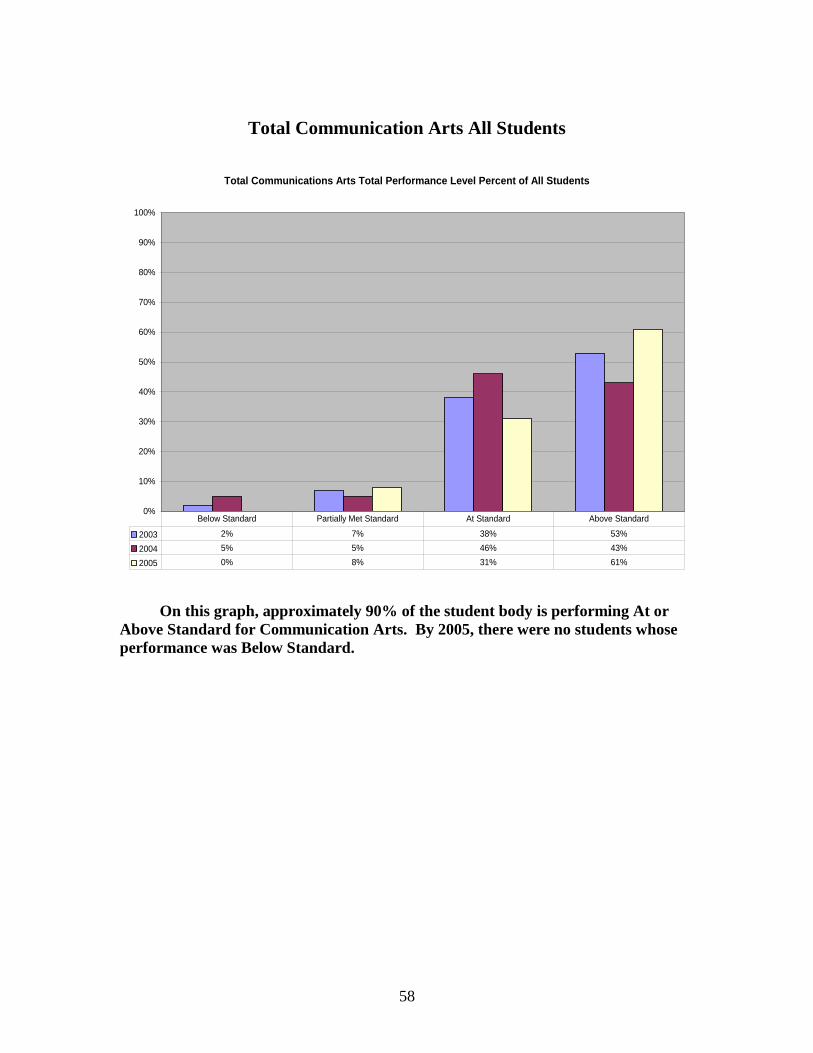
Total Communication Arts All Students
Total Communications Arts Total Performance Level Percent of All Students
0%
10%
20%
30%
40%
50%
60%
70%
80%
90%
100%
2003 2% 7% 38% 53%
2004 5% 5% 46% 43%
2005 0% 8% 31% 61%
Below Standard Partially Met Standard At Standard Above Standard
On this graph, approximately 90% of the student body is performing At or
Above Standard for Communication Arts. By 2005, there were no students whose
performance was Below Standard.
59
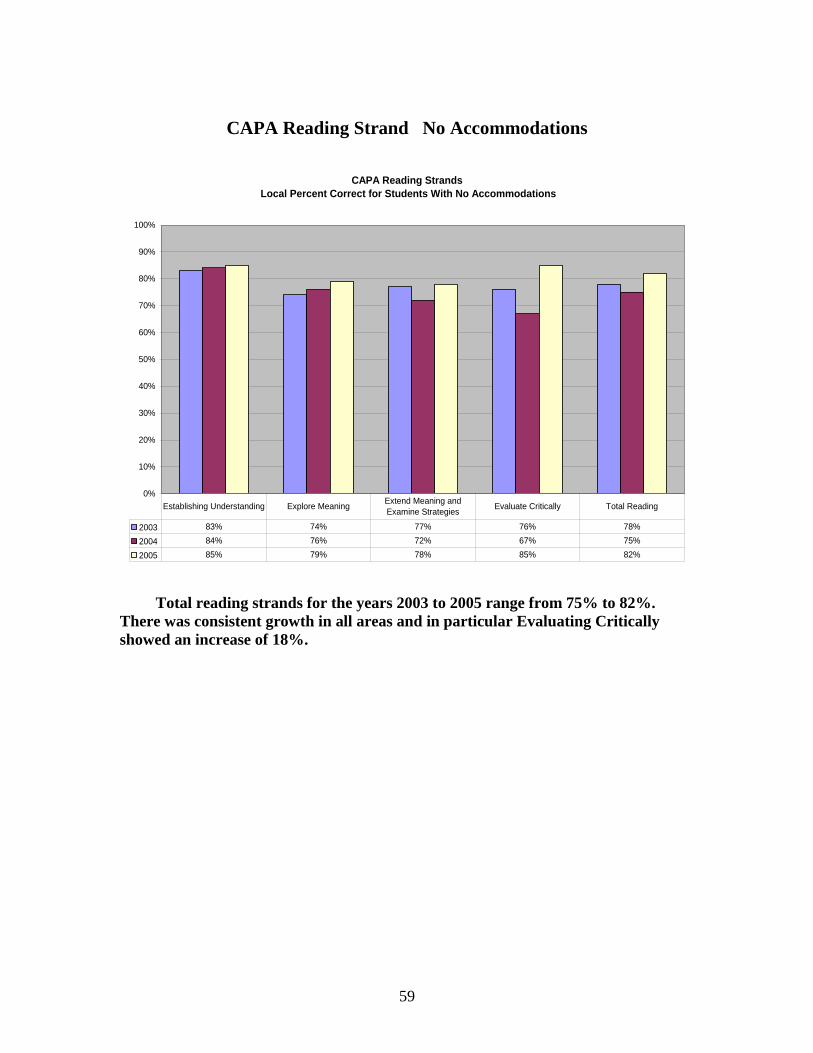
CAPA Reading Strand No Accommodations
CAPA Reading Strands
Local Percent Correct for Students With No Accommodations
0%
10%
20%
30%
40%
50%
60%
70%
80%
90%
100%
2003 83% 74% 77% 76% 78%
2004 84% 76% 72% 67% 75%
2005 85% 79% 78% 85% 82%
Establishing Understanding Explore MeaningExtend Meaning and
Examine StrategiesEvaluate Critically Total Reading
Total reading strands for the years 2003 to 2005 range from 75% to 82%.
There was consistent growth in all areas and in particular Evaluating Critically
showed an increase of 18%.
60
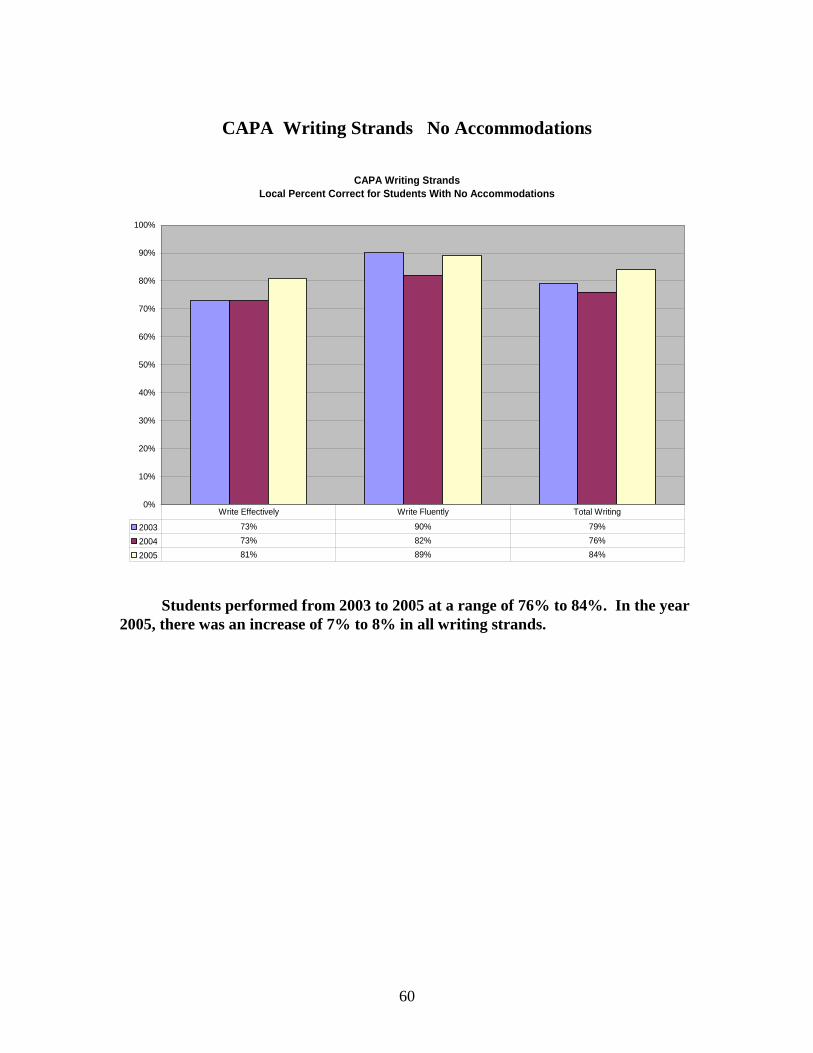
CAPA Writing Strands No Accommodations
CAPA Writing Strands
Local Percent Correct for Students With No Accommodations
0%
10%
20%
30%
40%
50%
60%
70%
80%
90%
100%
2003 73% 90% 79%
2004 73% 82% 76%
2005 81% 89% 84%
Write Effectively Write Fluently Total Writing
Students performed from 2003 to 2005 at a range of 76% to 84%. In the year
2005, there was an increase of 7% to 8% in all writing strands.
61
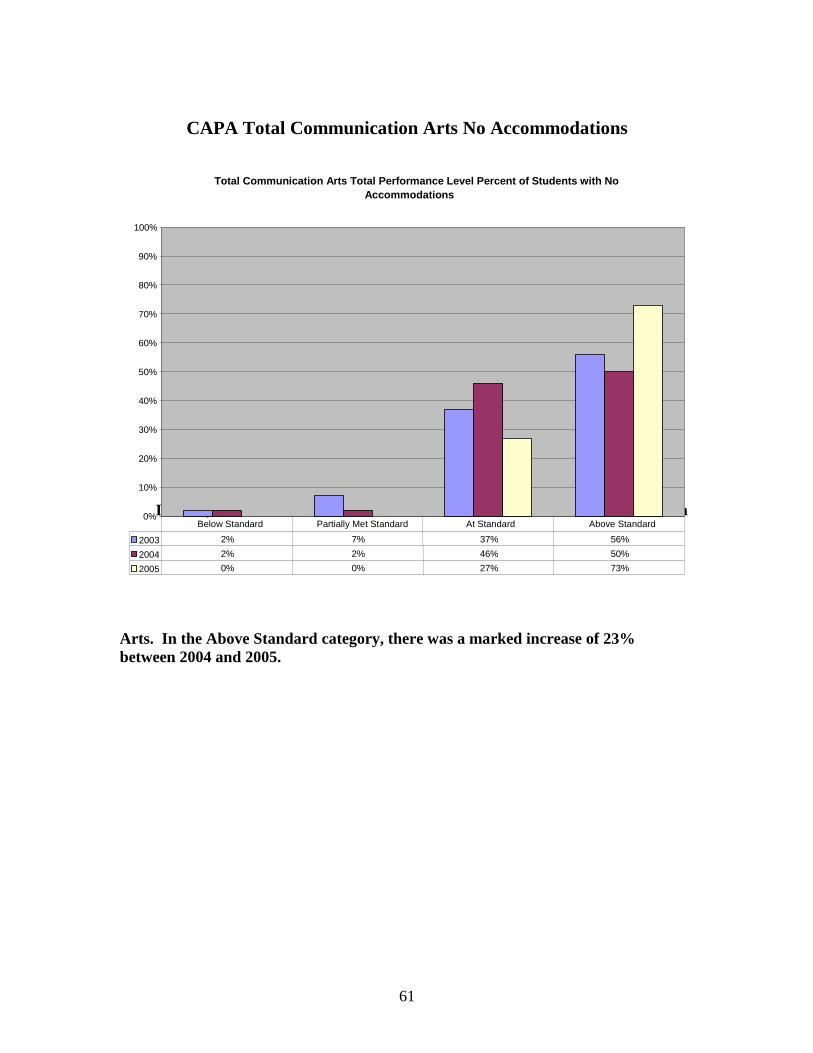
CAPA Total Communication Arts No Accommodations
In 2005, 100% of the students were At or Above Standard for Communication
Arts. In the Above Standard category, there was a marked increase of 23%
between 2004 and 2005.
Total Communication Arts Total Performance Level Percent of Students with No Accommodations
0%
10%
20%
30%
40%
50%
60%
70%
80%
90%
100%
2003 2% 7% 37% 56% 2004 2% 2% 46% 50% 2005 0% 0% 27% 73%
Below Standard Partially Met Standard At Standard Above Standard

62
CAPA Reading Strands with Accommodations
CAPA Reading Strands
Local Percent Correct for Students With Accommodations
2003 had 3 Students, 2005 had 14 Students
0%
10%
20%
30%
40%
50%
60%
70%
80%
90%
100%
2003 61% 56% 61% 44% 56%
2004 60% 56% 50% 42% 52%
2005 68% 59% 60% 64% 60%
Establishing Understanding Explore MeaningExtend Meaning and
Examine StrategiesEvaluate Critically Total Reading
All areas of the Reading Strands show increases between 3% and 22%. This
included our students with accommodations.
63
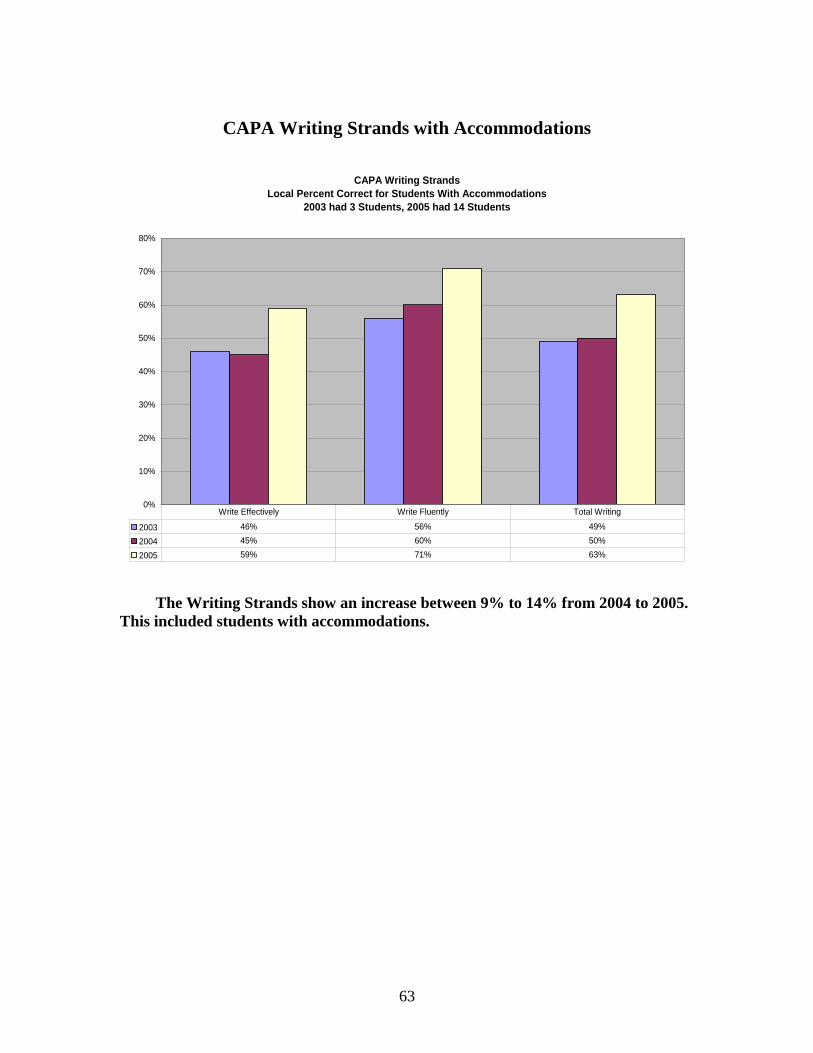
CAPA Writing Strands with Accommodations
CAPA Writing Strands
Local Percent Correct for Students With Accommodations
2003 had 3 Students, 2005 had 14 Students
0%
10%
20%
30%
40%
50%
60%
70%
80%
2003 46% 56% 49%
2004 45% 60% 50%
2005 59% 71% 63%
Write Effectively Write Fluently Total Writing
The Writing Strands show an increase between 9% to 14% from 2004 to 2005.
This included students with accommodations.

64
Total Communication Arts with Accommodations
Total Communications Arts
Total Performance Level Percent of Students with Accommodations
2003 had 3 Students, 2005 had 14 Students
0%
10%
20%
30%
40%
50%
60%
70%
80%
2003
2004
2005
2003 33% 0% 67% 0%
2004 25% 25% 50% 0%
2005 0% 38% 54% 8%
Below Standard Partially Met Standard At Standard Above Standard
There were no students Below Standard for Communication Arts by 2005.
Over half of the students with accommodations were At or Above Standard
throughout 2003 to 2005.
65
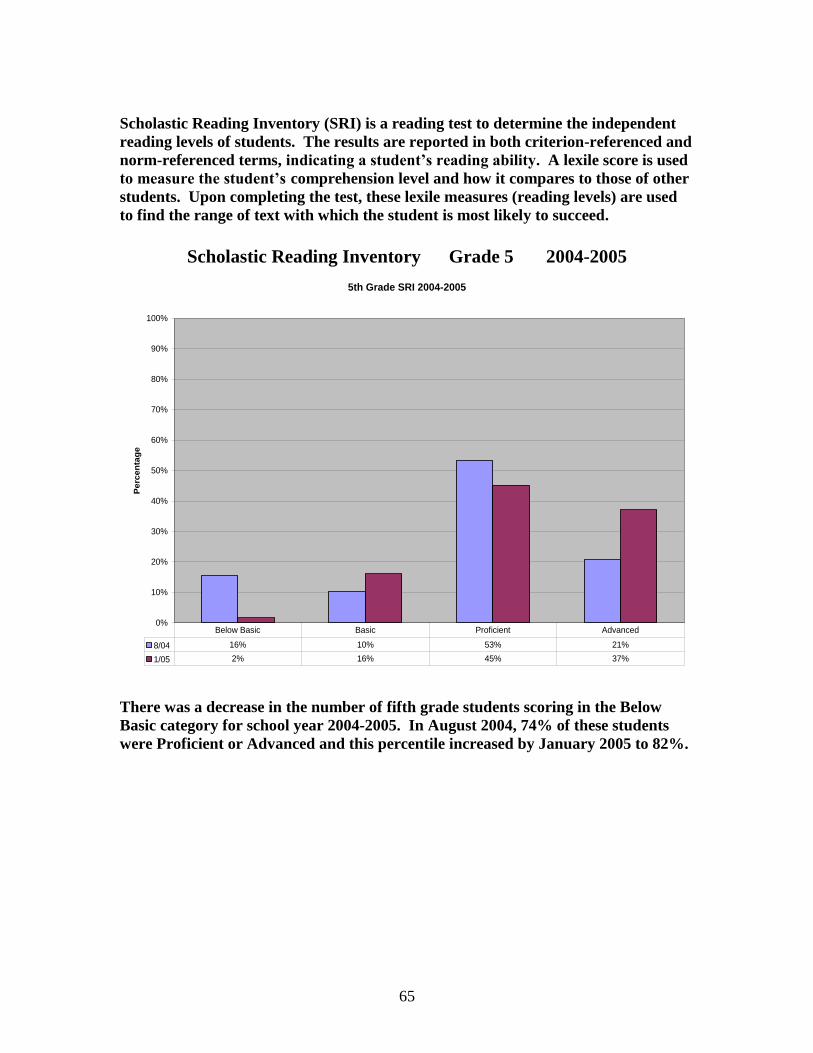
Scholastic Reading Inventory (SRI) is a reading test to determine the independent
reading levels of students. The results are reported in both criterion-referenced and
norm-referenced terms, indicating a student’s reading ability. A lexile score is used
to measure the student’s comprehension level and how it compares to those of other
students. Upon completing the test, these lexile measures (reading levels) are used
to find the range of text with which the student is most likely to succeed.
Scholastic Reading Inventory Grade 5 2004-2005
5th Grade SRI 2004-2005
0%
10%
20%
30%
40%
50%
60%
70%
80%
90%
100%
Perc
en
tag
e
8/04 16% 10% 53% 21%
1/05 2% 16% 45% 37%
Below Basic Basic Proficient Advanced
There was a decrease in the number of fifth grade students scoring in the Below
Basic category for school year 2004-2005. In August 2004, 74% of these students
were Proficient or Advanced and this percentile increased by January 2005 to 82%.

66
Scholastic Reading Inventory Grade 6 2004-2005
6th Grade SRI 2004-2005
0%
10%
20%
30%
40%
50%
60%
70%
80%
90%
100%
Perc
en
tag
e
8/04 0% 21% 31% 49%
1/05 0% 10% 32% 58%
Below Basic Basic Proficient Advanced
There were no sixth grade students in the Below Basic category for SY 2004-2005.
By January 2005, 90% of the sixth grade students were in the Proficient or
Advanced categories.

67
Scholastic Reading Inventory Grade 7 2004-2005
7th Grade SRI 2004-2005
0%
10%
20%
30%
40%
50%
60%
70%
80%
90%
100%
Pe
rcen
tag
e
8/04 2% 21% 26% 52%
1/05 0% 15% 24% 61%
Below Basic Basic Proficient Advanced
The percent of students increased from 78% to 85% in the Proficient and Advanced
categories by January 2005, no students were Below Basic.
68
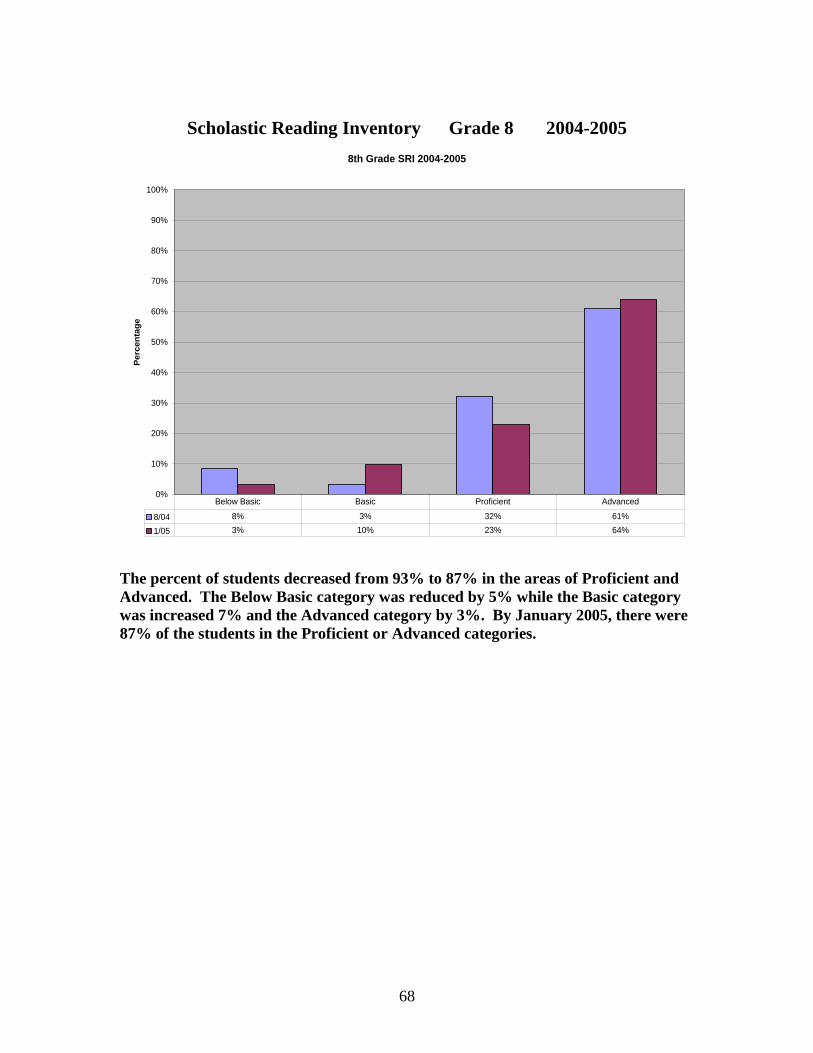
Scholastic Reading Inventory Grade 8 2004-2005
8th Grade SRI 2004-2005
0%
10%
20%
30%
40%
50%
60%
70%
80%
90%
100%
Perc
en
tag
e
8/04 8% 3% 32% 61%
1/05 3% 10% 23% 64%
Below Basic Basic Proficient Advanced
The percent of students decreased from 93% to 87% in the areas of Proficient and
Advanced. The Below Basic category was reduced by 5% while the Basic category
was increased 7% and the Advanced category by 3%. By January 2005, there were
87% of the students in the Proficient or Advanced categories.
69
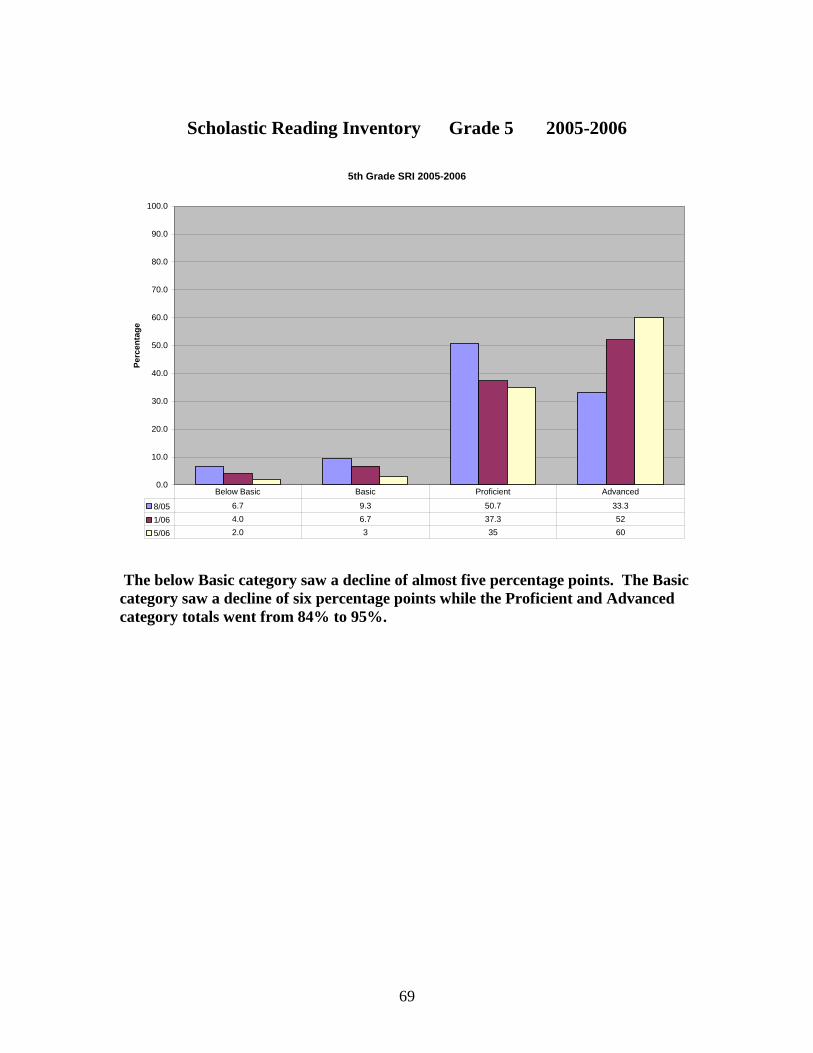
Scholastic Reading Inventory Grade 5 2005-2006
5th Grade SRI 2005-2006
0.0
10.0
20.0
30.0
40.0
50.0
60.0
70.0
80.0
90.0
100.0
Pe
rcen
tag
e
8/05 6.7 9.3 50.7 33.3
1/06 4.0 6.7 37.3 52
5/06 2.0 3 35 60
Below Basic Basic Proficient Advanced
The below Basic category saw a decline of almost five percentage points. The Basic
category saw a decline of six percentage points while the Proficient and Advanced
category totals went from 84% to 95%.
70
Scholastic Reading Inventory Grade 6 2005-2006
6th Grade SRI 2005-2006
0
10
20
30
40
50
60
70
80
90
100
Pe
rcen
tag
e
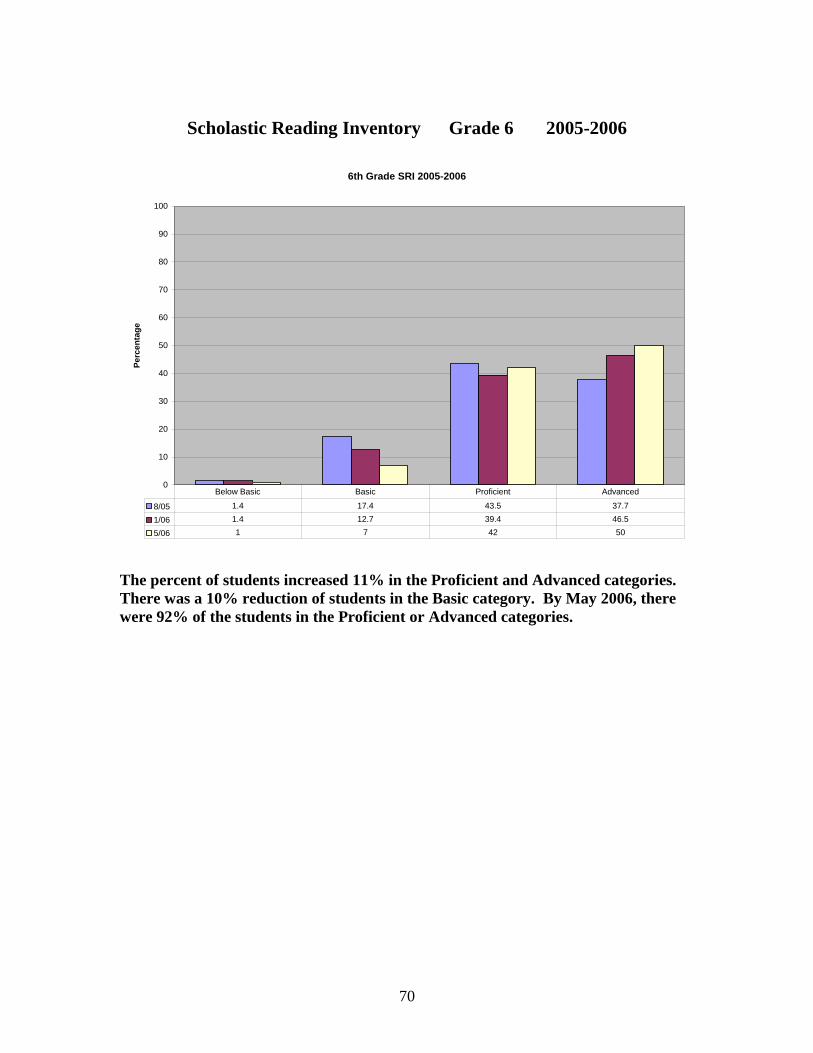
8/05 1.4 17.4 43.5 37.7
1/06 1.4 12.7 39.4 46.5
5/06 1 7 42 50
Below Basic Basic Proficient Advanced
The percent of students increased 11% in the Proficient and Advanced categories.
There was a 10% reduction of students in the Basic category. By May 2006, there
were 92% of the students in the Proficient or Advanced categories.
71
Scholastic Reading Inventory Grade 7 2005-2006
7th Grade SRI 2005-2006
0
10
20
30
40
50
60
70
80
90
100
Pe
rcen
tag
e
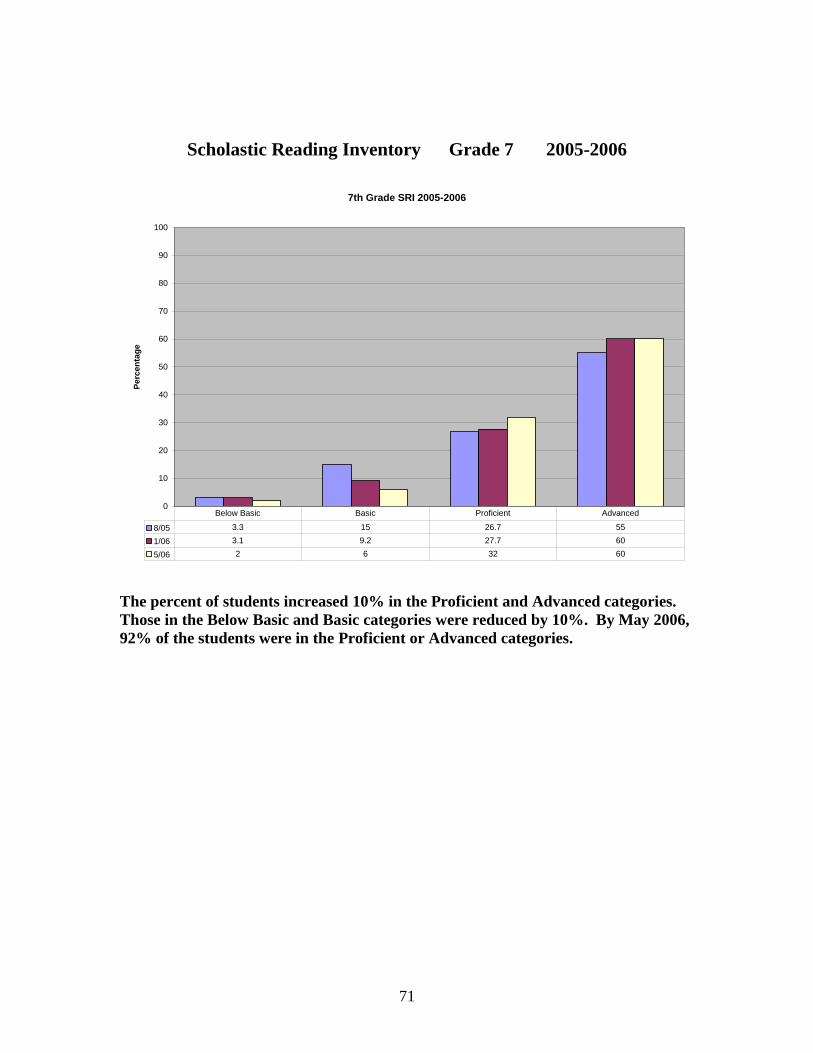
8/05 3.3 15 26.7 55
1/06 3.1 9.2 27.7 60
5/06 2 6 32 60
Below Basic Basic Proficient Advanced
The percent of students increased 10% in the Proficient and Advanced categories.
Those in the Below Basic and Basic categories were reduced by 10%. By May 2006,
92% of the students were in the Proficient or Advanced categories.
72
Scholastic Reading Inventory Grade 8 2005-2006
8th Grade SRI 2005-2006
0
10
20
30
40
50
60
70
80
90
100
Pe
rcen
tag
e
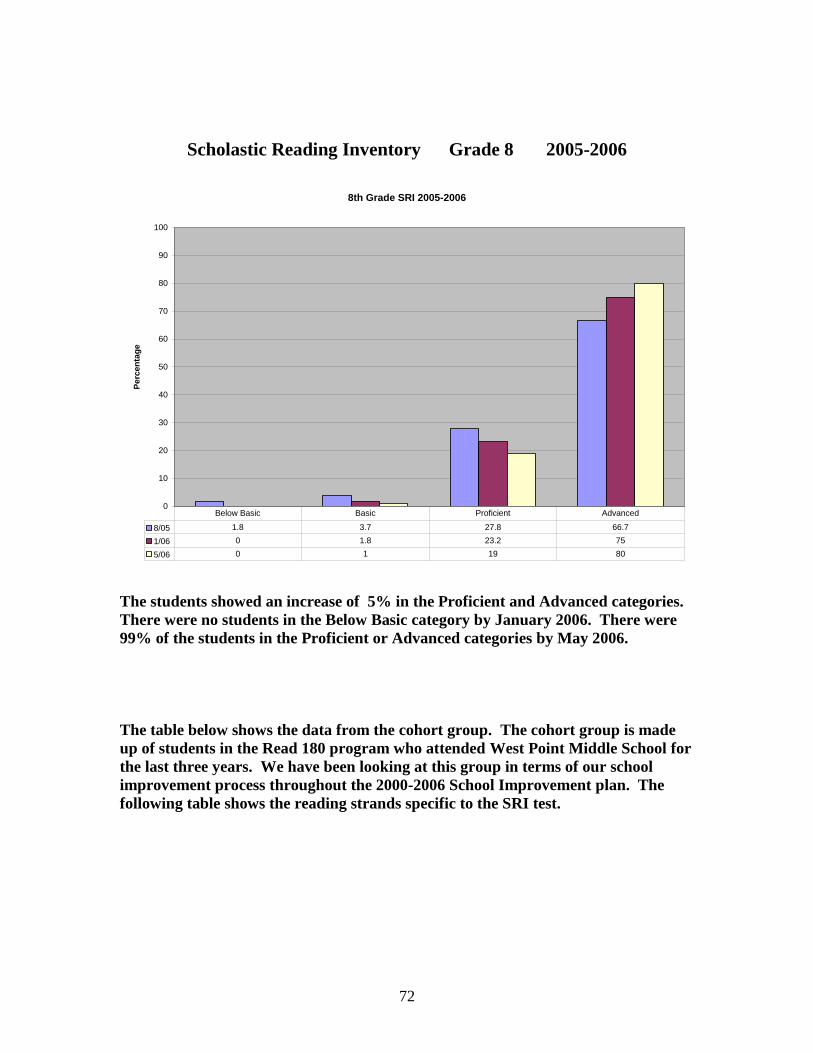
8/05 1.8 3.7 27.8 66.7
1/06 0 1.8 23.2 75
5/06 0 1 19 80
Below Basic Basic Proficient Advanced
The students showed an increase of 5% in the Proficient and Advanced categories.
There were no students in the Below Basic category by January 2006. There were
99% of the students in the Proficient or Advanced categories by May 2006.
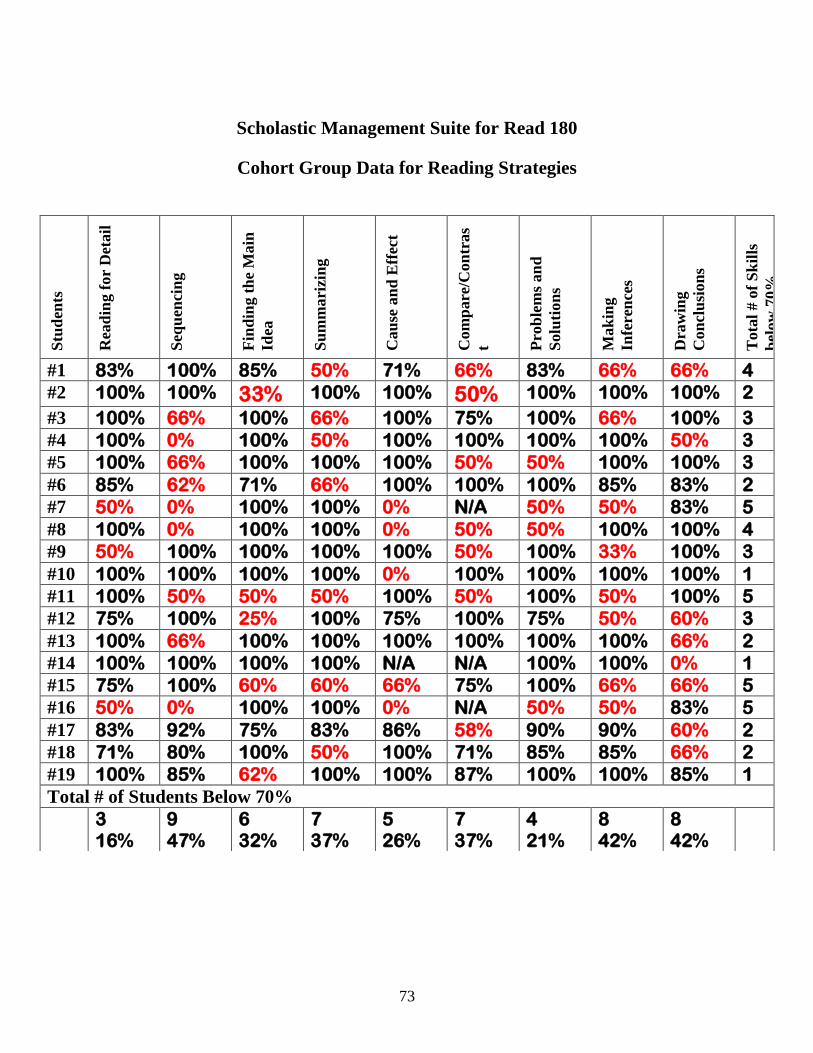
The table below shows the data from the cohort group. The cohort group is made
up of students in the Read 180 program who attended West Point Middle School for
the last three years. We have been looking at this group in terms of our school
improvement process throughout the 2000-2006 School Improvement plan. The
following table shows the reading strands specific to the SRI test.
73
Scholastic Management Suite for Read 180
Cohort Group Data for Reading Strategies
Stu
den
ts
Rea
din
g f
or
Det
ail
Seq
uen
cin
g
Fin
din
g t
he
Main
Idea
Su
mm
ari
zin
g
Cau
se a
nd
Eff
ect
Com
pare
/Con
tras
t Pro
ble
ms
an
d
Solu
tion
s
Mak
ing
Infe
ren
ces
Dra
win
g
Con
clu
sion
s
Tota
l # o
f S
kil
ls
bel
ow
70%
#1 83% 100% 85% 50% 71% 66% 83% 66% 66% 4 #2 100% 100% 33% 100% 100% 50% 100% 100% 100% 2
#3 100% 66% 100% 66% 100% 75% 100% 66% 100% 3 #4 100% 0% 100% 50% 100% 100% 100% 100% 50% 3 #5 100% 66% 100% 100% 100% 50% 50% 100% 100% 3
#6 85% 62% 71% 66% 100% 100% 100% 85% 83% 2 #7 50% 0% 100% 100% 0% N/A 50% 50% 83% 5
#8 100% 0% 100% 100% 0% 50% 50% 100% 100% 4 #9 50% 100% 100% 100% 100% 50% 100% 33% 100% 3
#10 100% 100% 100% 100% 0% 100% 100% 100% 100% 1 #11 100% 50% 50% 50% 100% 50% 100% 50% 100% 5 #12 75% 100% 25% 100% 75% 100% 75% 50% 60% 3
#13 100% 66% 100% 100% 100% 100% 100% 100% 66% 2 #14 100% 100% 100% 100% N/A N/A 100% 100% 0% 1 #15 75% 100% 60% 60% 66% 75% 100% 66% 66% 5
#16 50% 0% 100% 100% 0% N/A 50% 50% 83% 5
#17 83% 92% 75% 83% 86% 58% 90% 90% 60% 2 #18 71% 80% 100% 50% 100% 71% 85% 85% 66% 2 #19 100% 85% 62% 100% 100% 87% 100% 100% 85% 1
Total # of Students Below 70%
3 16%
9 47%
6 32%
7 37%
5 26%
7 37%
4 21%
8 42%
8 42%
74
Implications for Action: Student Data
Student Performance Goal 1
Based on our student data from the Terra Nova Multiple Assessments, the Terra
Nova Objective Performance Index, the Terra Nova Communication Arts
Performance Arts assessments, and the Scholastic Reading Inventory, a need exists
for improvement in areas directly related to written expression. Writing skills
should be part of instruction across the curriculum.
Our goals will be that all students will improve their writing skills across the
curriculum and that all students will improve their editing skills across the
curriculum.
One intervention that will be used is 6+1 Traits of Writing.
Implications for Action: Student Data
Student Performance Goal 2
Based on our student data from the Terra Nova Objective Performance Index for
Science Inquiry and Terra Nova Objective Performance Index for Math Problem
Solving/Reasoning and Teacher Evaluation Assessment, a need exists for
improvement in problem solving skills.
Our goals will be that all students will improve their problem solving skills across
the curriculum. One intervention that will be used is Big6.
75
Environmental Scan Log
All members of staff researched the projected needs of our society and how we are
preparing our students for the skills that will be needed.
We used the article “Ten Trends: Educating Children for Tomorrow’s World by
Gary Marz found on the NCA site, as well as information from the US. Department
of Labor, Bureau of Labor Statistic, US Department of Labor Employment and
Training Administration, and the University of California.
Staff members found that skills that may impact present/future academic areas as
well as job opportunities were communication skills, writing being especially
important to the future needs of our society.
We concluded that the school wide goal should be written communication since our
data suggested that a strengthening of writing skills would be beneficial and the
scan indicated that our students will need this skill for future employment.
In SY 2007 we revisited the environmental scan as we assessed our needs for a
second goal. We determined that problem solving skills were important to the
future needs of our students. We concluded that our second school wide goal should
be strengthening of problem solving skills.
In 2010 we revisited the needs of the student now and in the future. Teachers read
an article on 21st century schools “What is 21
st Century Education?’ and in both
large groups and in grade level teams the ideas in the article were discussed.
The conclusions that were significant to our students in the middle school were:
Teaming for both students and teachers,
Role of teacher from “sage on the stage” to facilitator
Teaching process not product
Multiple learning styles for students
Teach to the whole child
Project based and differentiated curriculum
76
Triangulation of Data and Goal Selection
Goal One: All students will improve their writing skills across the curriculum.
All students will improve their editing skills across the curriculum.
Data Point 1: Terra Nova Multiple Assessments
Data Point 2: Terra Nova Communication Arts Performance Arts assessments
Data Point 3: Scholastic Reading Inventory
Data Point 4: Data of Former Students
Data Point 5: Environmental Scan
Analysis and conclusion:
All the data collected indicates a need for students to understand and apply writing
as a tool for learning across the curriculum. Writing and editing skills will be
taught and applied in all subject areas and on every grade level.
In SY 2007 Goal One was changed:
All students will improve their writing skills across the curriculum.
Triangulation of Data and a second Goal Selection
In SY 2007 a second goal was added to our school improvement plans.
GOAL Two: Problem solving across the curriculum.
Data Point 1: Terra Nova OPI
Data Point 2: Teacher Questionnaire
Data Point 3: Former Student Questionnaire
Data Point 4: Parent Questionnaire
Data Point 5: Environmental Scan
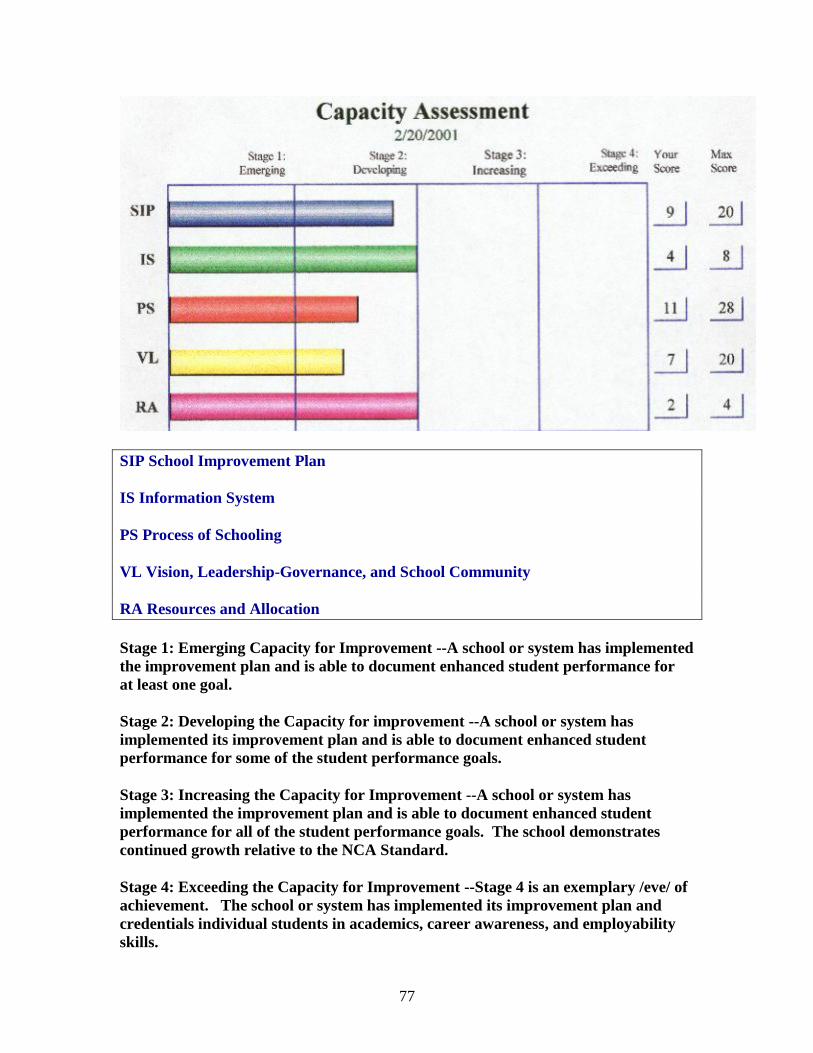
77
SIP School Improvement Plan
IS Information System
PS Process of Schooling
VL Vision, Leadership-Governance, and School Community
RA Resources and Allocation
Stage 1: Emerging Capacity for Improvement --A school or system has implemented
the improvement plan and is able to document enhanced student performance for
at least one goal.
Stage 2: Developing the Capacity for improvement --A school or system has
implemented its improvement plan and is able to document enhanced student
performance for some of the student performance goals.
Stage 3: Increasing the Capacity for Improvement --A school or system has
implemented the improvement plan and is able to document enhanced student
performance for all of the student performance goals. The school demonstrates
continued growth relative to the NCA Standard.
Stage 4: Exceeding the Capacity for Improvement --Stage 4 is an exemplary /eve/ of
achievement. The school or system has implemented its improvement plan and
credentials individual students in academics, career awareness, and employability
skills.