wendland, k., lewis, d.j., and j. alix-garcia. 2014. “the
TRANSCRIPT

Wendland, K., Lewis, D.J., and J. Alix-Garcia. 2014. “The Effect of Decentralized Governance on Timber Extraction in European Russia.” Environmental and Resource Economics, 57: 19-40.
The effect of decentralized governance on timber extraction in European Russia1
(RUNNING TITLE: Decentralized governance and logging)
Kelly J. Wendland
Address for correspondence:
Department of Conservation Social Sciences
19M Natural Resources, University of Idaho
Moscow, ID 83843
208-885-7044 (phone)
208-885-5534 (fax)
David J. Lewis
Department of Applied Economics, Oregon State University
Jennifer Alix-Garcia
Department of Agricultural and Applied Economics, University of Wisconsin-Madison
1 The authors thank Dimitri Aksenov, Matthias Baumann, Yulia Dubinina, David Helmers, Alexander Prishchepov, Yan Zhang and Alexey Yaroshenko for assistance with GIS, data collection, and translations. We extend a special thanks to Scott Gehlbach and Volker Radeloff, who have provided helpful comments on previous versions of this research. We thank participants at the 2011 Midwest International Economic Development Conference and the 2011 Association for Environmental and Natural Resource Economics Conference for comments and suggestions on this work. Additionally, comments by the editor and two anonymous reviewers greatly improved the final paper. Wendland and Lewis acknowledge funding by NASA’s Land-Cover and Land-Use Change Program (Project Number: NNX08AK776).
1

The effect of decentralized governance on timber extraction in European Russia
Abstract
“Good” governance is often promoted for economic growth, but its impact on natural resource
use in developing and transitional economies is not well understood. For example, many scholars
promote improved governance as a means to slow resource use, whereas others have found that
better governance increases extractive resource activities. In this paper we use within-country
variation in Russia to test the impact of governance on timber harvesting. Using a reduced form
fixed-effects model and satellite-based estimates of forest cover we find a statistically significant
and non-linear effect of governance on the area of timber harvested: for a marginal improvement
in governance timber harvesting increases, but this effect decreases at high levels of governance.
These results are robust to alternative specifications and when instrumenting for economic
growth. Governance could impact timber harvesting in Russia through ownership risk (i.e.,
tenure security), through the costs of doing business (i.e., bribes), or both. Nonparametric
regressions and qualitative evidence suggest that both factors are at play in Russia. This analysis
provides additional evidence that improving governance may increase natural resource
extraction. This has important implications for policy prescriptions that suggest “good”
governance will slow resource use in developing and transitional economies.
Keywords: corruption, decentralization, institutions, forests, governance, logging, property
rights, Russia
2

1. Introduction
The role of governance in the creation of economic wealth and development, as well as in
sustainable resource management, has received considerable attention in the last decade
(Banerjee 1997; Kaufman and Kraay 2002; Deacon and Mueller 2004; Acemoglu et al. 2005;
Robinson et al. 2006; Kaufmann et al. 2006; Baland et al. 2010). While it is difficult to pinpoint
an exact definition of “governance”, Baland et al. (2010) suggest governance be thought of as a
combination of a country’s political institutions, including its electoral system, democracy, and
number of political parties, and its capacity and effectiveness at implementing collective choices.
Despite increasing attention, the causal relationship between governance and growth has not yet
been well identified. This paper focuses on the relationship between natural resource use, a
potential driver of economic growth, and governance. In particular, we estimate the impact of
regional governance metrics on timber harvesting in European Russia between 1990 and 2005.
The main contribution of our paper is to use within-country variation in governance to
examine the relationship between governance and resource extraction. Conducting the analysis
within a single country across time allows for the use of panel methods that eliminate various
factors that might introduce bias in cross-country work, including exchange rates, trade barriers,
and forestry laws. To measure sub-national governance in European Russia we use an average of
eight indicators published by the Carnegie Center Moscow for the years 1991-2004 that measure
regional – equivalent to states in the United States – political institutions and state capacity and
effectiveness (Petrov 2005). The dependent variable in our model is aggregate forest disturbance
within Russian districts – equivalent to counties in the United States – measured using remote
sensing analysis of forest removal across two time periods: 1990-2000 and 2000-2005. The use
of remote sensing data to measure logging mitigates concerns about measurement error, whether
3

from human error or from “illegal” logging, which affects national forestry statistics in Russia
(World Bank 2004; Ottitsch et al. 2005).
In addition to controlling for the impact of governance, our model of forest disturbance
controls for other local biophysical and economic determinants of land cover change, including
regional and time-period fixed effects. Regional fixed effects control for time-invariant
unobservables at the regional level that might be correlated with governance and logging; time-
period fixed effects control for changes over time, such as global timber prices, that would affect
all regions. The panel structure comes primarily from the grouping of districts into regions, and
time variation across two adjacent land-use transition periods (1990-2000 and 2000-2005). As a
result, the primary concern for bias in our estimations is from time-varying independent variables
at the regional level that might be correlated with changes in regional governance and timber
harvesting, which we control for by including a measure of the change in per-capita economic
growth for each region.
The data confirm a statistically significant effect of governance on forest disturbance in
European Russia. Both a quadratic and a dummy variable specification of governance indicate a
non-monotonic effect on logging: a marginal increase in governance in regions with low levels
of governance increases forest disturbance but this effect decreases at high levels of governance.
These results are consistent with those of Ferreira and Vincent (2010), who also find a non-
monotonic effect of governance on logging in their cross-country analysis. Our results are robust
to instrumenting for economic growth with industrial output per worker, and we present a
number of additional robustness tests.
The rest of this paper proceeds as follows: Section 2 summarizes the linkages between
governance and natural resource use broadly and within Russia; Section 3 describes the
4

conceptual framework, data, and identification strategy; Section 4 presents results; Section 5
discusses our findings and explores the possible mechanisms through which governance works
using nonparametric regression; the last section concludes.
2. Governance and Natural Resource Use
2.1 Current literature
Our work builds upon the existing literature on governance and natural resource use, embodied
in work by Bohn and Deacon (2000), Deacon and Mueller (2004), Barrett et al. (2005), Ferreira
and Vincent (2010), and Laurent-Lucchetti and Santugini (2012). While recognizing that
governance is multifaceted, these works point to two primary mechanisms through which “poor”
governance impacts natural resource decisions: 1) ownership, or confiscation, risk and 2)
corruption. Ownership risk stems from tenure insecurity, and is influenced by many facets of
governance, including strength of the judicial system, court of law, and enforcement mechanisms
(Arnot et al. 2011). Tenure security is expected to increase economic investments in natural
resources through the assurance that the investor will be able to reap the benefits of the
investment and through increased access to funds that can be used for investing (Feder and
Onchan 1987; Besley 1995; Arnot et al. 2011). However, estimates of the empirical relationship
between ownership risk and forest cover are inconclusive: there is just as likely to be a negative
as a positive correlation between these factors (Arnot et al. 2011; Robinson et al. 2011).
Corruption influences the ability of the state to carry out collective action, and some
hypothesize that corruption is correlated with a country’s political institutions, with more
competition reducing corruption (Chowdury 2004). While corruption can directly impact the
security of property rights, it can also affect natural resource use by changing the costs of doing
business (Bardhan 1997; Aidt 2009). The relationship between corruption and resource use
5

depends on whether corruption is collusive (e.g., public officials conspire with firms to gain
preferential treatment) or non-collusive (e.g., individual officials demand bribes for access)
(Ferraro 2005; Barrett et al. 2005; Amacher et al. 2012). With collusive corruption, the cost of
doing business for the individual or firm decreases and resource use is expected to accelerate.
When corruption is non-collusive the costs of doing business increases and resource use is
expected to slow. The impacts of ownership risk and corruption on natural resource use are not
unique – similar observations have been made between governance and investments in other
sectors, such as agriculture (e.g., Gavian and Fafchamps 1996; Hayes et al. 1997; Jacoby et al.
2002; Kabubo-Mariara 2007).
The empirical work on governance and natural resource use has mostly exploited across
country variation. Using an index of ownership risk as a governance measure, Bohn and Deacon
(2000) find that ownership risk decreases petroleum extraction, while the correlation between the
index and deforestation across countries is positive. Ferreira and Vincent (2010) estimate the
impact of cross-country measures of governance on nationally reported timber harvests in
developing countries. They separate governance into two components: government stability –
which includes measures of ownership risk similar to what is used in Bohn and Deacon (2000) –
and government integrity – which includes measures of state capacity and effectiveness such as
regulatory quality and corruption. Unlike Bohn and Deacon (2000), Ferreira and Vincent (2010)
find a non-linear and non-monotonic impact of governance on resource extraction. They find that
a marginal improvement in governance leads to more harvesting in countries with weak
governance but decreases harvesting in countries with strong governance. Our paper moves this
literature forward through a within-country analysis that circumvents the potential omitted
variables issues common in cross-country analyses.
6

2.2 Russia
The collapse of the Soviet Union led to spatial and temporal variation in governance across
Russian regions (Stoner-Weiss 1997; Hanson and Bradshaw 2000; Gehlbach and Malesky 2010).
While decisions were centrally controlled during Soviet times, political and economic authority
was transferred toward administrative regions as early as 1985 in Russia. These transfers of
power were formalized in 1991 when regions began electing their own governors and ended in
2004 with the recentralization of gubernatorial elections. Between 1991 and 2004 there were
wide divergences in the strength of institutions and governance across Russian regions. The
reasons for these divergences are complex: ethnicity, geographic location and economic legacies
from the Soviet period are a few of the factors that have been related to differences in social,
economic and institutional outcomes (Stoner-Weiss 1997; Hanson and Bradshaw 2000; Ickes
and Offer 2006).
Several empirical studies find that divergences in regional governance impacted
privatization effectiveness, firm productivity and economic investments across Russia
(Berkowitz and DeJong 2003; Slinko et al. 2005; Yakovlev and Zhuravskaya 2008; Libman
2010; Granville and Leonard 2010). In particular, variation across regions in the ability to
implement reforms and the evolving characteristics of their political institutions, such as
openness, transparency, and free and fair elections, have been empirically linked to differences in
corruption and ownership risk, which in turn affected economic performance in post-Soviet
Russia (Libman 2010; Gehlbach and Malesky 2010). Both collusive and non-collusive forms of
corruption have been documented in Russia: many firms receive preferential treatment in Russia,
allowing them to purchase favors that lead to better economic performance (Slinko et al. 2005),
7

and incidents of informal fees and bribes are widely cited across Russian regions and sectors
(Dininio and Orttung 2005).
Russia’s forestry sector also experienced a number of changes in management and
governance after 1991. While forests remained state owned, Russia decentralized forest
management to the regional and district level, privatized the timber industry, and transitioned to
a system of short- and long-term timber leases to private firms. Russia released official forestry
legislation in 1993, 1997, 2004 and 2007 that specified the rights and responsibilities of the
public forestry sector and private timber firms, but did not make any changes to the content of
property rights until 2007, when it changed the duration of forest leases and responsibilities of
lessees. Forestry laws are created at the federal level. Management responsibilities and
governance of state-owned forests were shifted to the regional and district levels between 1993
and 2004. While the responsibilities of allocating and monitoring lease contracts moved to the
regional and district levels, however, revenues from leases went directly to the federal
government before reallocation to the regional and district levels. This period of decentralized
forest governance has been characterized as inefficient and corrupt (Eikeland et al. 2004) and the
impetus behind the subsequent re-centralization of forest management in 2004.
Qualitative assessments of the impact of changes to governance on the forestry sector
indicate that the profitability of timber harvesting was directly affected by weak legal capacity
and enforcement of property rights (Torniainen and Saastamoinen 2007; Torniainen 2009) and
illegal fees and bribes placed on timber contracts by the state forestry sector (Krott et al. 2000;
Eikeland et al. 2004). Assessments of forest outcomes in other post-Soviet countries have come
to similar conclusions. For example, an assessment of forest property rights across several
Central and Eastern European countries cite ownership risk in the form of timber theft and other
8
forms of illegal extraction on forest plots as leading to decreased economic profits (Bouriaud and
Schmithusen 2005). In Romania, the intersection of privatization and decentralization amidst
weak institutions is cited as a primary cause of corruption in community-based forest
management (Vasile, unpublished manuscript). To date, while strong correlations between
regions and timber harvesting in Russia have been identified (Wendland et al. 2011), the impacts
of ownership risk or corruption on forest outcomes have not been empirically estimated in post-
Soviet countries.
3. Methods
3.1 Framework
We start from the assumption that private timber firms operating in European Russia set out to
maximize profits. While many of the factors that might influence timber harvesting (e.g.,
exchange rates, trade barriers, forestry laws) will be similar within Russia, many biophysical and
economic determinants vary within the country. These include: net profits, timber stock, and the
firm’s discount rate. Net profits vary as a function of the value of timber and the capital costs of
timber harvesting (Binkley 1987). The value of timber varies by the type and quality of trees
harvested. Capital costs of harvesting are affected by local operating costs (e.g., wages, permit
prices), equipment costs, biophysical conditions (e.g., slope) and distance to roads and markets.
Timber stock indicates the total growing stock in an area. A firm’s discount rate captures the rate
of return necessary for a firm to invest in timber harvesting.
Governance could impact the timber harvesting decision through the discount rate or
capital costs. While standard economic theory suggests that increases in the discount rate, such
as those resulting from risk and uncertainty associated with tenure insecurity, should increase
extraction, Farzin (1984) shows that when there are high capital costs, this does not necessarily
9

hold. Instead, there are two distinct and countervailing effects. The first effect is the one
traditionally considered in the literature: the depletion effect, where an increase in the discount
rate increases the marginal net benefits of harvesting timber today. This leads to an immediate
increase in extraction. The second effect is that a higher discount rate increases the capital costs
of extraction, which decreases net profits and therefore discourages extraction. This is known as
the investment effect, since firms would want to invest their capital elsewhere. The overall
impact of these two effects on resource extraction is theoretically ambiguous. Additionally,
corruption could have direct effects on capital costs. With collusive corruption, the cost of doing
business for a firm decreases and harvesting is expected to increase; in the case of non-collusive
corruption, the costs of doing business increases for the firm and resource extraction is expected
to slow. The overall impact of governance on timber harvesting is thus an empirical question.
3.2 Study area and data
3.2.1 Study area
Our study area includes 31 regions and 877 districts (Figure 1)2 and is about three million km2,
or one-third the size of the continental United States. Russia is administratively separated into
regions (oblasts) – equivalent to states in the US – and then districts (rayons) – equivalent to
counties in the US. Regions were the level of decentralization of political power in Russia and
the level where governance was measured. We measure forest disturbance and most independent
variables at the district level to more precisely control for biophysical and economic drivers of
disturbance that are expected to vary within regions. The number of districts per region varies
from a minimum of 20 and a maximum of 112; this variation reflects differences in the size of
regions and the size of districts (Figure 1).
2 Figure 1 shows 32 regions; remote sensing data exist for all 32 regions but one region lacked data on governance due to redistricting that occurred in 2005. The missing region is Komi-Permyatskiy Autonomous Region, which was merged with Perm Region in 2005.
10

<Figure 1 near here>
3.2.2 Forest disturbance
We measure forest disturbance using remote sensing data from 1990 to 2000 and 2000 to 2005.
The forest disturbance measure for 1990-2000 comes from an unpublished analysis by
Greenpeace-Russia (Yaroshenko et al. unpublished) and covers 26 regions and 599 districts. The
2000-2005 measure comes from Potapov et al. (2011) and covers all 31 regions and 877
districts.3 The two assessments vary in their classification algorithm and in the sampling design
used for their training data. While an accuracy rating is not available for the unpublished
dataset4, reported overall accuracy for the 2000-2005 assessment is 89 percent (Potapov et al.
2011). Both analyses are based on Landsat images and provide 30-m resolution data on forest
disturbance; at this scale, forest degradation and selective logging are not detected.
While remote sensing analysis detects all sources of forest conversion, including natural
disturbances, assessments of remote sensing data in the region have concluded that timber
harvesting is the primary driver of forest loss (Potapov et al. 2011). State-owned forests cannot
be converted to alternative land uses in Russia (i.e., deforestation), only cleared, and during this
time period forest cover was expanding due to widespread agricultural abandonment
(Prishchepov et al. 2012).
The remote sensing data give us the total area (km2) converted from forest to non-forest
within each district for the two time periods: 1990-2000 and 2000-2005. We create a per-year
3 There is some variation and thus overlap in the satellite images from these two analyses. For example, the 2000-2005 analysis uses images from 1999 to 2002 to measure 2000 forest cover and images from 2003 to 2005 to measure 2005 forest cover (Potapov et al. 2011). As long as there is no systematic correlation between measurement errors or overlap of images and our independent variables, then including a time dummy variable in econometric estimation controls for these differences in methodologies and our parameter estimates will be unbiased. 4 While there is no accuracy assessment, conversations with the authors of this dataset and independent verifications by remote sensing experts convinced us that data quality was comparable to other freely-available remote sensing products.
11

metric by dividing the total area converted by the number of years in that time period (e.g., if
100km2 of forest was lost in a district in 1990-2000 we record 10km2/year for this time period).
This retains the two data periods in the panel model (see next section) but allows us to interpret
regression coefficients on a per-annum basis; this eases interpretation since we have a 10- and 5-
year time period. The average area harvested in a district was about six km2 per year, with a
minimum of zero and a maximum of 215 km2 per year (Table I).
<Table I near here>
3.2.3 Governance
Regional-level governance is measured using indicators published by the Carnegie Center
Moscow for 1991-2000 and 2000-2004 (Petrov 2005). Governance measures from 1991-2000
are used to represent the period of forest disturbance in 1990-2000 and measures from 2000-
2004 represent the period of forest disturbance in 2000-2005. Indicators include: civil society,
free and fair elections, political stability, competition in elections, independence of media,
government transparency, balance of powers, and quality of district governments (see Table II
for definitions). These measures of governance are not specific to the forestry sector and are
highly correlated with other indicators of “good” governance in Russia (Appendix I).
<Table II near here>
The Carnegie Center Moscow ranked each indicator on a five-point scale, where five is
the highest possible score. For example, a score of five for civil society represents a regional
government with more public participation than a region that scored one. We use the average
value of these eight indicators to reduce measurement error and to account for high correlation
across individual factors – close to 0.8 for most indicators. This average value varies across
space and time with a range between 1.5 and 4.3 and a mean of three (Table I). While we cannot
12

say at what value “poor” governance ends and “good” governance begins, the general
assumption is that as one moves from one to five, governance improves. Since the coding of the
governance variable is specific to this study, we can only qualitatively interpret whether
governance has an impact or not on forest disturbance.
3.2.4 Control variables
We were not able to obtain historical data on local timber prices in Russia. To proxy for
differences in timber value we use a measure of the percent of evergreen forest in a district
(Table I). In Russia, evergreens, such as fir, pine and spruce, are more valuable for the timber
industry since Soviet-era wood processing equipment was designed for these species
(Yaroshenko 2009, personal communication).
To capture differences in costs across districts we include measures of slope, road
density, and distance to major markets. For distance to major markets, we chose Moscow and St.
Petersburg because they are by far the biggest domestic consumers of timber in European Russia
and thus capture access to markets.5 European Russia’s timber exports go predominately to
Finland and former Soviet countries (FAO 2009). Given the high spatial correlation between St.
Petersburg and Helsinki and between Moscow and former Soviet countries, we only include the
distance to Moscow or St. Petersburg.
Ideally we would include a measure of growing stock in our analysis to control for the
amount of timber resource in a district. Data on total growing stock in Russia, however, are
fraught with measurement error (Kinnunen et al. 2007). Therefore, we use total forest area in a
district as a proxy measure for growing stock. Data on total forest area come from the 2000-2005
remote sensing assessment by Potapov et al. (2011). They provide an estimate of the total area of
5 Domestic demand for timber dropped precipitously during this transition period due to economic downturn; most timber was exported during this period (Carlsson and Olsson 1998).
13

forest in 2000 and we approximate the area that was in forest in 1990 by adding the amount of
forest lost between1990-2000 back to the 2000 measure of forest cover.
Finally, we include a measure of change in per-capita regional economic growth. This
variable serves as a proxy for factors that could vary across time and regions and that might be
correlated with governance and timber harvesting. This reasoning is described in more detail in
the next section. Changes in economic growth also capture differences in factors that would
impact a firm’s discount rate, such as the opportunity costs of investing in timber. Data on per-
capita gross domestic product (GDP) come from the national statistical database, Rosstat, and are
published on a per-annum basis; however, GDP data are not publically available before 1995.
Therefore, we calculate the percent change between the years 1995 and 2000 and 2000 and 2005
as our measure of economic growth.
3.3 Estimation strategy
We start with a reduced-form model to identify the impact of governance on logging, which can
be written as:
𝑌𝑌𝑖𝑖𝑖𝑖𝑖𝑖 = 𝛼𝛼 + 𝜏𝜏𝐺𝐺𝑖𝑖𝑖𝑖 + 𝛾𝛾𝛾𝛾𝑖𝑖𝑖𝑖𝑖𝑖 + 𝜔𝜔𝑇𝑇𝑖𝑖 + 𝜇𝜇𝑖𝑖 + 𝛿𝛿𝑖𝑖𝑖𝑖 + 𝜀𝜀𝑖𝑖𝑖𝑖𝑖𝑖 , (1)
where 𝑌𝑌𝑖𝑖𝑖𝑖𝑖𝑖 is the mean annual forest disturbance in district i, nested in region j, during transition
time t, where t reflects the two transition periods of 1990-2000 and 2000-2005. The dependent
variable 𝑌𝑌𝑖𝑖𝑖𝑖𝑖𝑖 is thus the per-year metric of forest disturbance calculated for 1990-2000 (t=0) and
2000-2005 (t=1). The constant term is 𝛼𝛼; 𝐺𝐺𝑖𝑖𝑖𝑖 is governance in region j in time t; 𝛾𝛾𝑖𝑖𝑖𝑖𝑖𝑖 is the matrix
of district-level covariates described above; 𝑇𝑇𝑖𝑖 is the time dummy variable; and 𝜇𝜇𝑖𝑖 are time-
invariant regional fixed effects. 𝛿𝛿𝑖𝑖𝑖𝑖 and 𝜀𝜀𝑖𝑖𝑖𝑖𝑖𝑖 measure time-varying unobservables that affect
timber harvest.
14

Regional fixed effects account for differences such as historical legacies that affect
present-day institutional strength, climate and soil conditions that affect timber growth rates, and
the number of wood processing facilities (Carlsson and Olsson 1998; Kortelainen and Kotilainen
2003). The time dummy variable takes on a value of “1” for the 2000-2005 transition period, and
zero otherwise. This variable controls for spatially invariant but time varying factors such as
national timber prices, trade barriers, export tariffs, and national political and economic trends.
The inclusion of these variables means that identification of the governance impact comes from
time-variation in the forest disturbance outcome within and across regions.
We decompose the time-varying unobservable variables into a term that is independent of
governance and the other independent variables (𝜀𝜀𝑖𝑖𝑖𝑖𝑖𝑖), and a term that may be correlated with
either governance or the other independent variables (𝛿𝛿𝑖𝑖𝑖𝑖). The unobservable 𝛿𝛿𝑖𝑖𝑖𝑖 captures
multiple time- and regionally-varying factors that influence timber harvesting. Examples include
production technology innovations, timber industry size, lending rates, local timber prices and
timber demand. Our primary concern with 𝛿𝛿𝑖𝑖𝑖𝑖 is the possibility that some of the factors in 𝛿𝛿𝑖𝑖𝑖𝑖
could be correlated with our regional governance variable 𝐺𝐺𝑖𝑖𝑖𝑖, a fact that would bias our
governance estimates from the within estimator.
We address this problem by including percent change in per-capita economic growth for
region j over time period t, which is likely to be highly correlated with key omitted variables, in
the model.6 For example, a technological innovation in timber for region j would likely occur
alongside broader innovations that are associated with higher economic growth in that region.
6 Wooldridge (2010, p.112-114) refers to this as the “plug-in solution” or “multiple indicator solution”. The idea is that a proxy variable that is strongly correlated with the omitted variable(s) be used in the equation, and that by “plugging-in” this proxy variable, bias induced by these same omitted variables will be reduced.
15

We specify the following equation, which formalizes the relationship between observed 𝑅𝑅𝑖𝑖𝑖𝑖 and
unobserved 𝛿𝛿𝑖𝑖𝑖𝑖:
𝑅𝑅𝑖𝑖𝑖𝑖 = 𝜑𝜑0 + 𝜑𝜑1𝛿𝛿𝑖𝑖𝑖𝑖 + 𝑒𝑒𝑖𝑖𝑖𝑖, (2)
where 𝑒𝑒𝑖𝑖𝑖𝑖 is a mean zero error that is assumed to be uncorrelated with 𝛿𝛿𝑖𝑖𝑖𝑖 and all the independent
variables in Equation 1. This assumption is akin to assuming that all non-timber drivers of
regional economic growth are uncorrelated with the observed timber harvesting covariates.
Solving (2) for 𝛿𝛿𝑖𝑖𝑖𝑖 and plugging into (1) gives:
𝑌𝑌𝑖𝑖𝑖𝑖𝑖𝑖 = [𝛼𝛼 − 𝜑𝜑0𝜑𝜑1
] + 𝜏𝜏𝐺𝐺𝑖𝑖𝑖𝑖 + 𝛾𝛾𝛾𝛾𝑖𝑖𝑖𝑖𝑖𝑖 + 𝜔𝜔𝑇𝑇𝑖𝑖 + 𝜇𝜇𝑖𝑖 + � 1𝜑𝜑1�𝑅𝑅𝑖𝑖𝑖𝑖 + [𝜀𝜀𝑖𝑖𝑖𝑖𝑖𝑖 − � 1
𝜑𝜑1� 𝑒𝑒𝑖𝑖𝑖𝑖], (3)
where the last term in square brackets is the time-varying error term.
However, since there is potential reverse causality between timber harvest and economic
growth, and Equation 2 shows that 𝑅𝑅𝑖𝑖𝑖𝑖 is necessarily correlated with 𝑒𝑒𝑖𝑖𝑖𝑖, we need to introduce
economic growth in an instrumental variables framework. We therefore seek a time-varying
plausible instrument for growth. Since timber harvest is strongly correlated with the usual
instruments in the growth literature – climate and geography – we instead use change in output
per worker to instrument for economic growth (Table I). Output per worker measures industrial
activity within a region and so excludes direct earnings from timber harvesting reducing the
likelihood that the instrument is correlated with the error term; however, it could still potentially
capture revenue from woodworking and pulp and paper mills.
Given the skewed distribution of forest disturbance we log-transform 𝑌𝑌𝑖𝑖𝑖𝑖𝑖𝑖 and district-
level covariates in 𝛾𝛾𝑖𝑖𝑖𝑖𝑖𝑖 in Equation 3. We checked whether slopes were the same across the two
time periods by interacting each covariate with the time dummy, 𝑇𝑇𝑖𝑖, and testing whether the
estimated parameters were statistically equivalent. Road density and distance to markets were
different across time periods, and so we present results with these time interactions. We test a
16

quadratic and dummy variable specification for governance in all regressions. For the dummy
variable specification we create three categories: a “poor” governance score of 1-2, a “neutral”
score of 2.1-4, and a “good” governance score of 4.1-5. We exclude the “poor” category and
interpret the impacts of governance relative to this baseline. Finally, robust standard errors
clustered at the regional level j are included to control for correlation in the residual error.
Cluster-robust standard errors allow spatial correlation across units, in our case, correlation
across districts within the same region. This specification also controls for most functional forms
of serial correlation and heteroskedasticity in panel data (Cameron and Trivedi 2005).
In sum, our identification strategy combines panel data and instrumental variables
techniques to minimize the endogeneity concerns that generally confound estimation of the
effects of governance on natural resource use. We first break the unobservable in our forest
disturbance model into three components: 1) a time-invariant regional unobservable 𝜇𝜇𝑖𝑖, 2) a
time-varying regional unobservable 𝛿𝛿𝑖𝑖𝑖𝑖, and 3) a time-varying district level unobservable 𝜀𝜀𝑖𝑖𝑖𝑖𝑖𝑖.
Since our governance variable (𝐺𝐺𝑖𝑖𝑖𝑖) is measured at the regional level, our primary endogeneity
concerns arise from correlation between 𝐺𝐺𝑖𝑖𝑖𝑖 and the regional unobservables 𝜇𝜇𝑖𝑖 and 𝛿𝛿𝑖𝑖𝑖𝑖. Regional
fixed effects can be introduced to control for 𝜇𝜇𝑖𝑖 since our governance variable is time-varying.
The within estimator transforms all variables as differences from their time-average, and so 𝜇𝜇𝑖𝑖 is
differenced out of the model. Since the time-varying regional unobservables 𝛿𝛿𝑖𝑖𝑖𝑖 will not be
differenced out of the model, we proxy for 𝛿𝛿𝑖𝑖𝑖𝑖 with regional economic growth and correct for
any remaining correlation between growth and unobserved timber determinants with output per
worker as an instrument. Identification of the effects of governance on forest disturbance is thus
facilitated by 1) the grouping of districts within multiple regions, and 2) time-variation in
regional-level governance.
17
4. Results
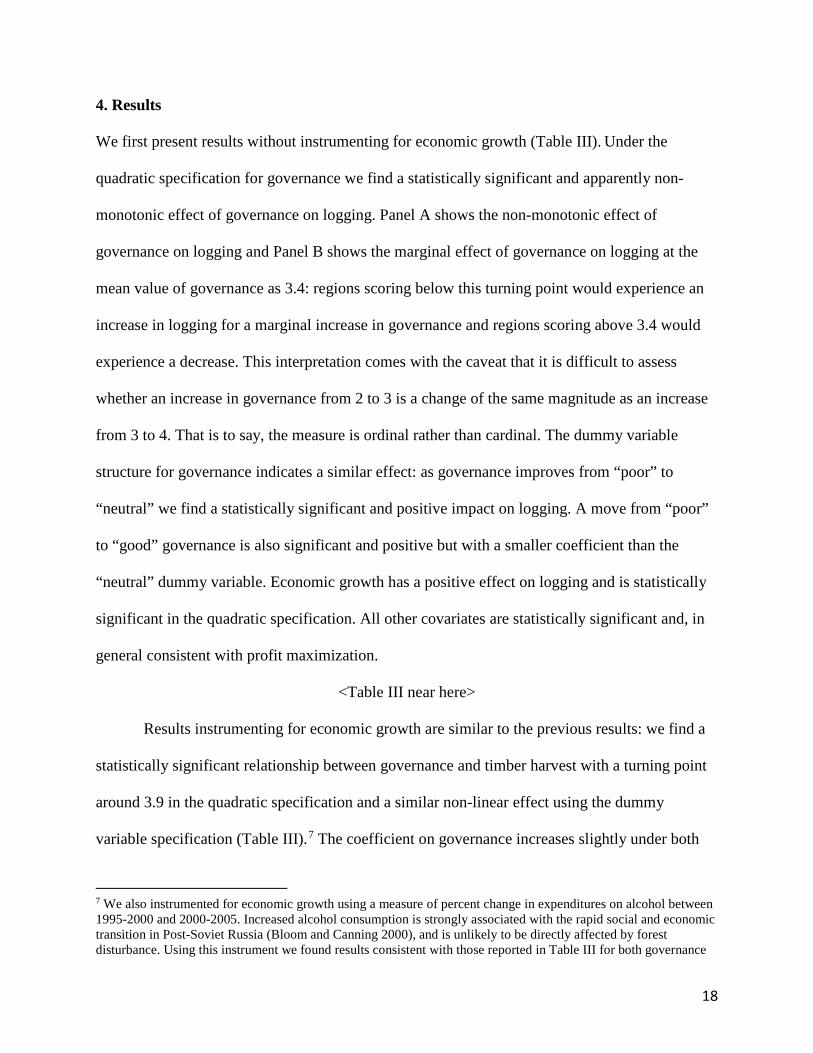
We first present results without instrumenting for economic growth (Table III). Under the
quadratic specification for governance we find a statistically significant and apparently non-
monotonic effect of governance on logging. Panel A shows the non-monotonic effect of
governance on logging and Panel B shows the marginal effect of governance on logging at the
mean value of governance as 3.4: regions scoring below this turning point would experience an
increase in logging for a marginal increase in governance and regions scoring above 3.4 would
experience a decrease. This interpretation comes with the caveat that it is difficult to assess
whether an increase in governance from 2 to 3 is a change of the same magnitude as an increase
from 3 to 4. That is to say, the measure is ordinal rather than cardinal. The dummy variable
structure for governance indicates a similar effect: as governance improves from “poor” to
“neutral” we find a statistically significant and positive impact on logging. A move from “poor”
to “good” governance is also significant and positive but with a smaller coefficient than the
“neutral” dummy variable. Economic growth has a positive effect on logging and is statistically
significant in the quadratic specification. All other covariates are statistically significant and, in
general consistent with profit maximization.
<Table III near here>
Results instrumenting for economic growth are similar to the previous results: we find a
statistically significant relationship between governance and timber harvest with a turning point
around 3.9 in the quadratic specification and a similar non-linear effect using the dummy
variable specification (Table III).7 The coefficient on governance increases slightly under both
7 We also instrumented for economic growth using a measure of percent change in expenditures on alcohol between 1995-2000 and 2000-2005. Increased alcohol consumption is strongly associated with the rapid social and economic transition in Post-Soviet Russia (Bloom and Canning 2000), and is unlikely to be directly affected by forest disturbance. Using this instrument we found results consistent with those reported in Table III for both governance
18

specifications, with the largest increase in the impact under the dummy variable specification and
the move from “poor” to “neutral” governance. Economic growth is weakly significant and the
size of the coefficient is statistically similar to when economic growth is not instrumented;
estimated parameters for all other covariates are similar to the previous results.
In Panel D, the statistical tests described below provide confidence in our choice of
instrument. Underidentification tests reject the null hypothesis of underidentification at the 95
percent level or higher. F-statistics are all larger than 10 in Panel D and using the Stock and
Yogo (2005) critical values (not presented) the null hypothesis of weak identification is
rejected8. The first stage regression results also validate the instrument with a partial R2 between
the excluded instrument and economic growth of 0.54 (Appendix II).
The results in Table III are robust to several changes in sample size and model
specification. First, we varied the sample size by excluding: 1) Moscow region, since Potapov et
al. (2011) find the largest incidence of forest disturbance not due to timber harvesting, but
instead due to urbanization, around Moscow city; 2) the six regions that had no data on forest
disturbance in 1990-2000; 3) the two regions that were outliers in our test of correlation across
governance measures (Appendix I, Figure A); and 4) regions where more than 5, 10 or 15
percent of gross domestic product was from the wood sector to mitigate concerns about our
instrument choice. Second, we estimated Equation 3 with a measure of national timber prices.
We used data on roundwood prices from the UNECE/FAO timber database and introduced this
variable as an interaction term between temporally-variant national prices and spatially-variant
specifications; these results can be obtained by request from the authors. However, since the Kleibergen-Paap Wald F-statistic was less than 10 in the dummy variable specification we chose not to present this regression output in the paper. 8 With cluster-robust standard errors, the Kleibergen-Paap Wald F-statistic is presented but critical values are not available. Baum et al. (2007) suggest that the critical values from the Stock and Yogo (2005) test that assumes i.i.d. standard errors can be used with caution, or that the general “rule of thumb” that the F-statistic should be at least 10, can be used.
19

distance to nearest market. The coefficient on governance did not change when the sample size
was changed or when price was added.
As a final check on our results we randomly assigned governance measures within the
range of the data, i.e., 1.5 to 4.5, to regions. We did this five times and re-estimated the
parameters in Equation 3 under the quadratic and dummy variable specifications. An
insignificant effect on these “false” governance scores helps eliminate concern of spurious
correlation between our main variable of interest and logging. Overall, the average value on
these randomly generated governance measures is slightly less than the average value found in
Table I with a mean of 2.85. We do not find a statistically significant relationship between
governance and logging in regressions using these generated values of governance, providing
additional support that our results in Table III are not spurious (Appendix III).
5. Discussion
Our results are similar to previous findings on governance and resource extraction (i.e., Bohn
and Deacon [2000] and Ferreira and Vincent [2010]): “good” governance increases natural
resource extraction, but this effect decreases at higher levels of governance. This comes with the
caveat, however, that measures of governance differ significantly across studies, and it is
therefore difficult to compare the quantitative results. Previous studies emphasize the channel of
ownership risk; however, corruption is also likely to have a direct impact on extraction decisions
by influencing the costs of doing business in countries where state-owned forests are leased to
private firms.
While we are not able to test which mechanism is at work using our within estimator –
something that will be challenging for any empirical analysis to test given the correlation across
the two mechanisms – nonparametric regressions between regional governance and national
20

forestry statistics can shed light on how these two factors are affecting firm decisions in Russia.
We use kernel-weighted (Epanechinikov kernel) local polynomial regressions with a bandwidth
of 0.39 to test the correlation between governance and percent of timberland leased, number of
lease contracts and percent of allowable timber stock harvested. These data come from the
Federal Agency of Forestry in Russia and were only obtained for the years 1994 to 2002.
Figure 2.A. shows the relationship between governance and forest leased as a percent of
total forest area in a region. The overall pattern suggests a positive relationship between better
governance and percent of forest leased. At the highest level of governance the graph slopes
down, but variance in this range of the graph is quite high. Figure 2.B. shows the relationship
between number of lease contracts and governance. Again, the relationship suggests that regions
with better governance have a higher number of lease contracts. The nonparametric relationship
between governance and leases is in line with qualitative reports of bribes placed on timber
contracts in Russia (Krott et al. 2000; Eikeland et al. 2004) and suggests that non-collusive
corruption was one factor affecting timber firms in our sample.
<Insert Figure 2 near here>
Figure 2.C. shows the percent of reported timber stock harvested out of the total
allowable harvest – a quantity set annually by the federal government based on biological
conditions of the resource stock. There is a noticeable difference in this graph between low levels
of governance and higher levels of governance. At low levels of governance the percent cut is
the lowest. At higher levels of governance (i.e., 2.5-3 range) changes in the percent harvested
levels off. At the highest end of the governance range (i.e., 4) the percent cut starts to decline
slightly. The difference at low levels of governance is consistent with reports that timber
9 This is the “rule-of-thumb” bandwidth default chosen by Stata, which is a reasonable choice if the true density is close to normal.
21

harvesting was directly affected by weak legal capacity and enforcement of property rights
(Torniainen and Saastamoinen 2007; Torniainen 2009). As ownership risk decreases, more
harvesting occurs, suggesting that the “investment” effect is greater than the “depletion” effect.
Ferreira and Vincent (2010) find a statistically significant and non-monotonic effect of
governance on logging in their cross-country analysis. Our fixed effects estimates and
nonparametric regressions strongly suggest a non-linear relationship between governance and
timber extraction: both the quadratic and dummy variable specifications indicate that as
governance improves, so does harvesting, but not linearly. A non-linear relationship between
governance and timber extraction could mean several things: that there are decreasing returns to
governance, that “good” governance leads to less myopic behavior (as concluded by Ferreira and
Vincent [2010]), or that “good” governance increases the costs of doing business relative to
slightly lower levels of governance (e.g., if environmental regulations are more strictly
enforced).
Since governance is made up of a “bundle” of institutions, it would be informative to
unbundle this cluster of institutions (as Baland et al. [2010] recommend for the relationship
between governance and economic growth). However, this is complicated by the high correlation
between different types of institutions and the fact that most data on governance is collected
through secondary sources and therefore not designed with hypothesis testing in mind. We
attempted to use the eight indicators from the Carnegie Center Moscow as individual covariates
or averaged across two or three “types” of institutions in our estimations, but high collinearity
precluded consistent estimation. However, one positive side to the high correlation across types
of institutions is that incremental changes in any one of these indicators are likely to impact other
indicators leading to non-uniform gains in governance.
22

Despite the difficulties of unbundling governance or structurally estimating the influence
of ownership risk or corruption on resource extraction, understanding the reduced form
relationship between governance and natural resource use provides important information for
policy. Many policy prescriptions in developing and transitional countries focus on the assumed
relationship that improving governance will slow resource use. These prescriptions come
primarily from results that suggest “good” governance can reduce deforestation and illegal
logging (Barbier et al. 2005; Bulte et al. 2007; Burgess et al. 2011). Our results, and results from
other papers on governance and natural resource extraction, suggest the opposite. As governance
improves, more capital-intensive resource uses, such as commercial logging, may become more
attractive in areas where weak institutions currently undermine property rights and increase the
costs of doing business.
There are two caveats to this conclusion. First, similar to previous research, we cannot
comment on the long-term economic or ecological impacts of increased or decreased harvest
rates that would come with better governance. Thus, commercial logging could increase or
decrease the sustainable use of forests, and our analysis cannot detect impacts of governance on
forest degradation or selective logging. Second, since ownership risk and corruption can increase
or decrease resource use depending on the particular conditions of the resource use, and since
these two factors can interact, the relationship between governance and natural resource
extraction could vary based on the type of corruption (i.e., collusive versus non-collusive), the
relative influence of the “investment” versus “depletion” effect, and the overall profitability of
the resource use.
6. Conclusion
23

This paper contributes to a growing body of literature on the political economy of natural
resource extraction (Bohn and Deacon 2000; Ferreira and Vincent 2010). Its main contribution
relative to previous analyses of governance and natural resource extraction is the use of within-
country variation in governance rather than cross-country analysis, which render causal
interpretation difficult. In addition, the use of remotely sensed data on timber extraction reduces
concerns about measurement error, while the combination of fixed-effects estimation that draws
on regional-level variation over time and instrumenting for regionally- and temporally-variant
unobservables with economic growth diminishes the possibility of omitted variables biasing the
results. We find a statistically significant and non-linear impact of governance on logging using
both a quadratic and dummy variable specification for governance. We identify two possible
mechanisms through which governance would impact natural resource use: ownership risk and
corruption. Nonparametric regressions and qualitative literature suggest that both are at work in
Russia, leading to the positive relationship between improving governance and increased timber
harvests.
24

References
Acemoglu, D., S. Johnson and J. A. Robinson. 2005. Institutions as fundamental determinants of
long run growth. In: Aghion, P. and S. Durlauf (eds.), The Handbook of Economic Growth
Volume 1A. Amsterdam: North-Holland.
Aidt, T. S. 2009. Corruption, institutions, and economic development. Oxford Review of
Economic Policy 25(2): 271-291.
Amacher, G.S., M. Ollikainern, and E. Koskela. 2012. Corruption and forest concessions.
Journal of Environmental Economics and Management 63(1): 92-104.
Arnot, C.D., M.K. Luckert, and P.C. Boxall. 2011. What is Tenure Security? Conceptual
Implications for Empirical Analysis. Land Economics 87(2): 297-311.
Baland, J.M., K.O. Moene and J.A. Robinson. 2010. Chapter 69 - Governance and Development.
In: Rodrik, D. and M. Rosenzweig (eds.), Handbook of Development Economics, Volume
5: 4597-4656, Elsevier.
Banerjee, A. V. 1997. A theory of misgovernance. Quarterly Journal of Economics 112: 1289–
1332.
Barbier, E.B., R. Damania and D. Leonard. 2005. Corruption, trade, and resource conversion.
Journal of Environmental Economic and Management 50: 276-299.
Bardhan, P. 1997. Corruption and development: A review of issues. Journal of Economic
Literature 35(3): 1320–1346.
Barrett, C.B., C.C. Gibson, B. Hoffman and M.D. McCubbins. 2005. The complex links between
governance and biodiversity. Conservation Biology 20(5): 1358-1366.
Baum, C.F., M.E. Schaffer and S. Stillman. 2007. Enhanced routines for instrumental
variables/GMM estimation and testing. Boston College Economics Working Paper No. 667.
25
Berkowitz, D. and D.N. DeJong. 2003. Accounting for growth in post-Soviet Russia. Regional
Science and Urban Economics 32: 221-239.
Besley, T. 1995. Property rights and investment incentives: theory and evidence from Ghana.
The Journal of Political Economy 103(5): 903-937.
Binkley, C.S., 1987. Economic models of timber supply. In: Kallio, M., Dykstra, D., Binkley,
C.S. (eds) The global forest sector: an analytical perspective. John Wiley & Sons,
Chichester, UK.
Bloom, E.D. and D. Canning. 2000. The Health and Wealth of Nations. Science 287(5456):
1207-1209.
Bohn, H. and R.T. Deacon. 2000. Ownership risk, investment, and the use of natural resources.
American Economic Review 90: 526-549.
Bouriaud, L., and F. Schmithusen. 2005. Allocation of property rights on forests through
ownership reform and forest policies in Central and Eastern European countries.
Schweizerische Zeitschrift fur Forstwesen 156(8): 297–305.
Bulte, E.H., R. Damania and R. Lopez. 2007. On the gains of committing to inefficiency:
Corruption, deforestation and low land productivity in Latin America. Journal of
Environmental Economics and Management 54(3): 277-295.
Burgess, R., M. Hansen, B. Olken, P. Potapov and S. Sieber. 2011. The Political Economy of
Deforestation in the Tropics. Viewed online:
https://www.ucl.ac.uk/economics/seminarpapers/february11/sticerd21feb11.pdf
Cameron, A.C., and P.K. Trivedi. 2005. Microeconometrics: Methods and applications.
Cambridge Press.
26

Carlsson, L. and M.O. Olsson (eds.). 1998. Initial Analyses of the Institutional Framework of the
Russian Forest Sector. IIASA Interim Report (IR-98-027). Laxenburg, Austria.
Chowdury, S.K. 2004. The effect of democracy and press freedom on corruption: an empirical
test. Economics Letters 85(1): 93-101.
Deacon, R. and B. Mueller. 2004. Political economy and natural resource use. Department of
Economics Working Paper, UCSB.
Dininio, P. and R. Orttung. 2005. Explaining patterns of corruption in the Russian regions. World
Politics 57(4): 500-529.
Eikeland, S., E. Eythorsson and L. Ivanova. 2004. From management to mediation: local forestry
management and the forestry crisis in post-socialist Russia. Environmental Management 33:
285-293.
FAO. 2009. State of the World’s Forests 2009. Rome. Italy.
Farzin, Y.H. 1984. The effect of the discount rate on depletion of exhaustible resources. The
Journal of Political Economy 92: 841-851.
Feder, G. and T. Onchan. 1987. Land ownership security and farm investment in Thailand.
American Journal of Agricultural Economics 69(2): 311-320.
Ferraro, P. 2005. Corruption and conservation: The need for empirical analyses. Oryx 39(3): 1-3.
Ferreira, S. and J.R. Vincent. 2010. Governance and Timber Harvests. Environmental and
Resource Economics 47(2): 241-260.
Gavian, S. and M. Fafchamps. 1996. Land tenure and allocative efficiency in Niger. American
Journal of Agricultural Economics 78(2): 460-471.
Gehlbach, S. and E.J. Malesky. 2010. The Grand Experiment That Wasn’t? New Institutional
Economics and the Postcommunist Experience. Working Paper.
27

Granville, B. and C.S. Leonard. 2010. Do informal institutions matter for technological change
in Russia? The impact of Communist norms and conventions, 1998-2004. World
Development 38(2): 155-169.
Hanson, P. and M. Bradshaw. 2000. Regional Economic Change in Russia. Edward Elgar
Publishing.
Hayes, J., M. Roth and L. Zepeda. 1997. Tenure security, investment and productivity in
Gambian agriculture: A generalized probit analysis. American Journal of Agricultural
Economics 79: 369-382.
Ickes, B.W. and G. Ofer. 2006. The political economy of structural change in Russia. Journal of
Political Economy 22: 409-434.
Jacoby, H.G., G. Li and S. Rozelle. 2002. Hazards of expropriation: tenure insecurity and
investment in Rural China. American Economic Review 92(5): 1420-1477.
Kabubo-Mariara, J. 2007. Land conservation and tenure security in Kenya: Boserup’s hypothesis
revisited. Ecological Economics 64: 25-35.
Kaufmann, D. and A. Kraay. 2002. Growth without governance. Economica 3: 169–229.
Kaufmann, D., A. Kraay and M. Mastruzzi. 2006. Governance Matters V: Governance Indicators
for 1996-2005. World Bank Policy Research Department Working Paper No. 4012.
Kaufmann, D., A. Kraay and M. Mastruzzi. 2007. The Worldwide governance Indicators Project:
Answering the Critics. World Bank Policy Research Department Working Paper No. 4149.
Kaufmann, D., A. Kraay and M. Mastruzzi. 2009. What do the Worldwide Governance
Indicators Measure? Viewed online:
http://info.worldbank.org/governance/wgi/resources.htm.
28

Kaufmann, D., A. Kraay and M. Mastruzzi. 2010. Response to: “The Worldwide Governance
Indicators: Six, One, or None”. Viewed online:
http://info.worldbank.org/governance/wgi/resources.htm.
Kinnunen, J., M. Maltamo and R. Paivinen. 2007. Standing volume estimates of forests in
Russia: how accurate is the published data? Forestry 80(1): 53-64.
Kortelainen, J. and J. Kotilainen. 2003. Ownership Changes and Transformation of the Russian
Pulp and Paper Industry. Eurasian Geography and Economics 44(5): 384-402.
Krott, M., I. Tikkanen, A. Petrov, Y. Tunystsya, B Zheliba, V. Sasse, I. Rykounina and T.
Tynytsya. 2000. Policies for Sustainable Forestry in Belarus, Russia and Ukraine. Leiden:
Koninklijke Brill NV.
Laurent-Lucchetti, J. and M. Santugini. 2012. Ownership risk and the use of common-pool
natural resources. Journal of Environmental Economics and Management 63(2): 242-259.
Libman, A. 2010. Democracy, size of bureaucracy, and economic growth: Evidence from
Russian regions. Working Paper.
Ottitsch, A., A. Moiseyev, N. Burdin and L. Kazusa. 2005. Impacts of Reduction in Illegal
Logging in European Russia on the EU and European Russia Forest Sector and Trade.
European Forest Institute Technical Report, Finland.
Petrov, N. 2005. Demokratichnost’ Regionov Rossii. Moscow. Moscow.
Potapov P., S. Turubanova S. and M.C. Hansen. 2011. Regional-scale boreal forest monitoring
using Landsat data composites: first results for European Russia. Remote Sensing of
Environment 115(2): 548-561.
Prishchepov, A., V.C. Radeloff, M. Baumann, T. Kuemmerle, and D. Muller. 2012. Effects of
institutional changes on land use: agricultural land abandonment during the transition from
29

state-command to market-driven economies in post-Soviet Europe. Environmental Research
Letters 7(2): 13pp.
Robinson, B.E., M.B. Holland, and L. Naughton-Treves. 2011. Does secure land tenure save
forests? A review of the relationship between land tenure and tropical deforestation. CGIAR
Working Paper No. 7.
Robinson, J. A., Torvik, R., and Verdier, T. 2006. The political foundations of the resource
curse. Journal of Development Economics 79: 447–468.
Slinko, I., E. Yakovlev and E. Zhuravskaya. 2005. Laws for Sale: Evidence from Russia.
American Law and Economics Review 7(1): 284-318.
Stock, J. H. and M. Yogo. 2005. Testing for Weak Instruments in Linear IV Regression. In:
Andrews, D.W. and J.H. Stock (eds.), Identification and Inference for Econometric Models:
Essays in Honor of Thomas Rothenberg, Cambridge University Press.
Stoner-Weiss, K. 1997. Local Heroes: The political economy of Russian regional governance.
Princeton University Press.
Torniainen, T.J. and O.J. Saastamoinen. 2007. Formal and informal institutions and their
hierarchy in the regulation of the forest lease in Russia. Forestry 80(5): 489-501.
Torniainen, T. 2009. Institutions and forest tenure in the Russian forest policy. Dissertationes
Forestales 95. Finnish Society of Forest Science, Vantaa, Finland.
Vasile, M. Unpublished. Decentralization as an aid to enhancing corruption in Romania forests.
University of Bucharest.
Wendland, K.J., Lewis, D.J., Alix-Garcia, J., Ozdogan, M., Baumann, M. and V.C. Radeloff.
2011. Regional- and district-level drivers of timber harvesting in European Russia after the
collapse of the Soviet Union. Global Environmental Change 21(4): 1290-1300.
30
Wooldridge, J.M. 2010. Econometric Analysis of Cross Section and Panel Data, 2nd Edition.
MIT Press.
World Bank. 2004. Key Challenges of the Russian Forest Policy Reform. Washington, D.C.
Washington, D.C.
Yakovlev, E. and E. Zhuravskaya. 2008. Reforms in Business Regulation: Evidence from Russia.
Working Paper, Centre for Advanced Studies, Moscow, Russia.
Yaroshenko, A. Unpublished results. TM-ETM forest classification 1990-2000. Moscow:
Greenpeace Russia. Moscow.
Yaroshenko, A. Personal communication. August 10, 2009.
31

Figure 1. Map of study area
32

A
B
C
Figure 2. Nonparametric regressiona of governance on: A) percent of forest leased out of total forest; B) number of timber leases; C) percent of reported timber cut out of annual
allowable cut
33

aResults from kernel-weighted (Epanechinikov kernel) local polynomial regression of governance on variable of interest (bandwidth = 0.3; This is the “rule-of-thumb” bandwidth default chosen by Stata, which is a reasonable choice if the true density is close to normal.). Dotted line is the 95% confidence interval. Regional data are used (N=62). Percent of total forest leased calculated as average area leased during time period (e.g., 1994-2000 or 2000-2002) divided by total forest area. Number of timber contracts calculated as average number of contracts during time period. Percent of reported timber cut calculated as average reported timber harvested during time period (e.g., 1994-2000 or 2000-2002) divided by the annual allowable cut each year – a quantity set by the government.
34
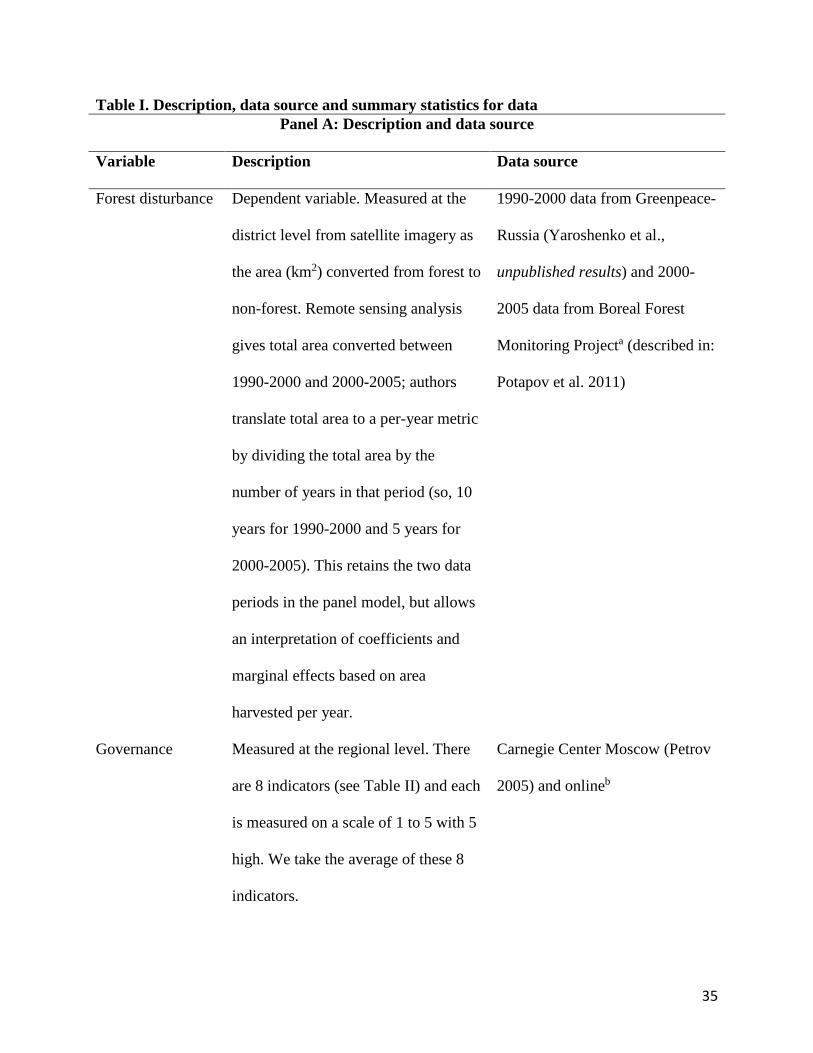
Table I. Description, data source and summary statistics for data Panel A: Description and data source
Variable Description Data source
Forest disturbance Dependent variable. Measured at the
district level from satellite imagery as
the area (km2) converted from forest to
non-forest. Remote sensing analysis
gives total area converted between
1990-2000 and 2000-2005; authors
translate total area to a per-year metric
by dividing the total area by the
number of years in that period (so, 10
years for 1990-2000 and 5 years for
2000-2005). This retains the two data
periods in the panel model, but allows
an interpretation of coefficients and
marginal effects based on area
harvested per year.
1990-2000 data from Greenpeace-
Russia (Yaroshenko et al.,
unpublished results) and 2000-
2005 data from Boreal Forest
Monitoring Projecta (described in:
Potapov et al. 2011)
Governance Measured at the regional level. There
are 8 indicators (see Table II) and each
is measured on a scale of 1 to 5 with 5
high. We take the average of these 8
indicators.
Carnegie Center Moscow (Petrov
2005) and onlineb
35

Evergreen Measured at the district level as
percent of evergreen forest in 2005;
time-invariant.
Moderate Resolution Imaging
Spectroradiometer imagery
Slope Measured at the district level as
average variation in slope (degrees);
time-invariant.
NOAA’s Global Land 1-km Base
Elevation Project
Road density Measured at the district level as total
length of roads (meters) in a district
divided by area of that district (m2);
time-invariant.
1:500,000 topographic maps
published around 1990
Distance Measured at the district level as the
distance (km) from centroid of a
district to closest market, defined as
either Moscow city or St. Petersburg;
time-invariant.
Calculated by authors
Forest area Measured at the district level as total
forest area (km2).
2000 measure from Boreal Forest
Monitoring Project and 1990
measure recreated by authors (see
text)
Economic growth Measured at the regional level as
percent change in per capita gross
regional product between 1995-2000
and 2000-2005.
National statistical database,
Rosstat
36
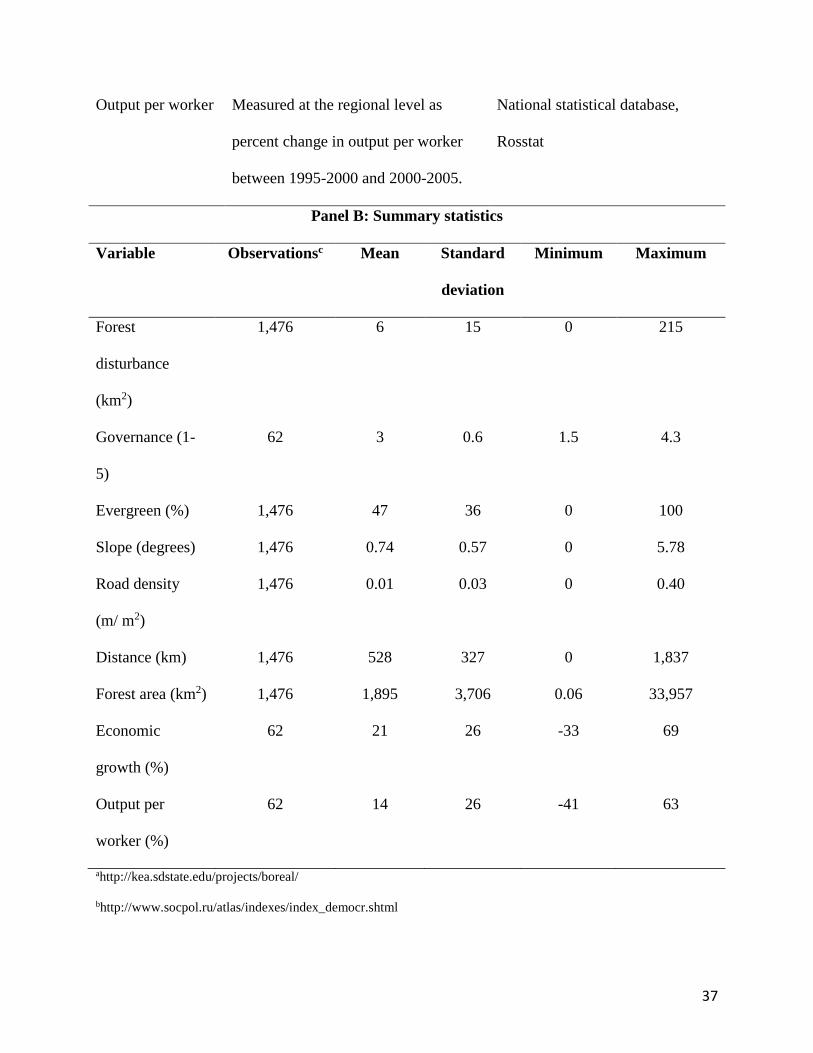
Output per worker Measured at the regional level as
percent change in output per worker
between 1995-2000 and 2000-2005.
National statistical database,
Rosstat
Panel B: Summary statistics
Variable Observationsc Mean Standard
deviation
Minimum Maximum
Forest
disturbance
(km2)
1,476 6 15 0 215
Governance (1-
5)
62 3 0.6 1.5 4.3
Evergreen (%) 1,476 47 36 0 100
Slope (degrees) 1,476 0.74 0.57 0 5.78
Road density
(m/ m2)
1,476 0.01 0.03 0 0.40
Distance (km) 1,476 528 327 0 1,837
Forest area (km2) 1,476 1,895 3,706 0.06 33,957
Economic
growth (%)
62 21 26 -33 69
Output per
worker (%)
62 14 26 -41 63
ahttp://kea.sdstate.edu/projects/boreal/
bhttp://www.socpol.ru/atlas/indexes/index_democr.shtml
37

cVariables with 1,476 observations are measured at the district level; variables with 62 observations are measured at the regional level (2 times periods * 31 regions = 62 observations).
38

Table II. Definitions of indicators used in governance measurea Indicator Description
Civil society Measures presence of NGOs, referenda, and freedom of public political
activity such as rallies and demonstrations.
Free and fair elections Measures whether elections are free and fair at national, regional and
local levels.
Political stability Measures the representation of political parties in regional legislature
and the stability of these parties.
Competition in
elections
Measures the existence of multiple political parties and the effectiveness
of leadership changes through elections.
Independence of
media
Measures the independence of the media from authorities.
Government
transparency
Measures the transparency of regional political life.
Balance of powers Measures the balance of power between the executive and the
legislative branches, the independence of the judiciary, and
effectiveness of law enforcement.
District government Measures the ability of district governments to carry out collective
actions.
aIndicator names and descriptions are based on http://www.socpol.ru/atlas/indexes/index_democr.shtml and Libman
(2010); however, some names have been changed to more fully represent their definitions.
39
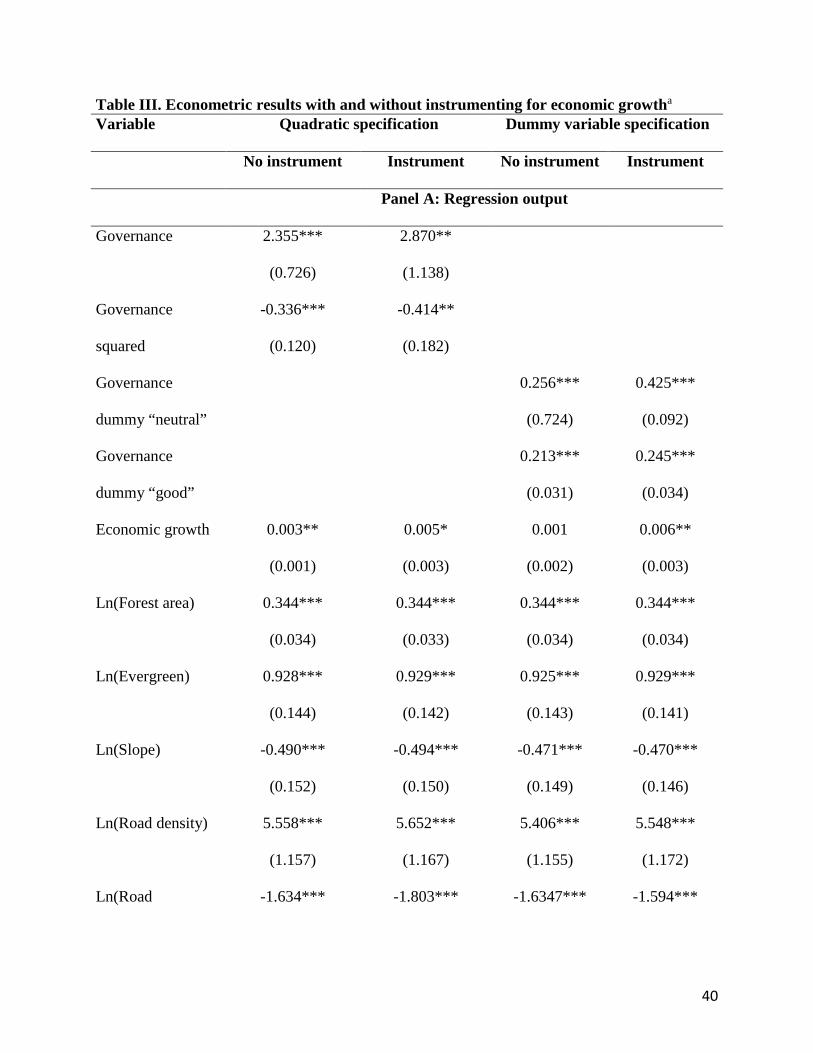
Table III. Econometric results with and without instrumenting for economic growtha Variable Quadratic specification Dummy variable specification
No instrument Instrument No instrument Instrument
Panel A: Regression output
Governance 2.355***
(0.726)
2.870**
(1.138)
Governance
squared
-0.336***
(0.120)
-0.414**
(0.182)
Governance
dummy “neutral”
0.256***
(0.724)
0.425***
(0.092)
Governance
dummy “good”
0.213***
(0.031)
0.245***
(0.034)
Economic growth 0.003**
(0.001)
0.005*
(0.003)
0.001
(0.002)
0.006**
(0.003)
Ln(Forest area) 0.344***
(0.034)
0.344***
(0.033)
0.344***
(0.034)
0.344***
(0.034)
Ln(Evergreen) 0.928***
(0.144)
0.929***
(0.142)
0.925***
(0.143)
0.929***
(0.141)
Ln(Slope) -0.490***
(0.152)
-0.494***
(0.150)
-0.471***
(0.149)
-0.470***
(0.146)
Ln(Road density) 5.558***
(1.157)
5.652***
(1.167)
5.406***
(1.155)
5.548***
(1.172)
Ln(Road -1.634*** -1.803*** -1.6347*** -1.594***
40

density)*time
dummy
(0.372) (0.426) (0.390) (0.475)
Ln(Distance) 0.401***
(0.076)
0.391***
(0.078)
0.414***
(0.075)
0.393***
(0.080)
Ln(Distance)*time
dummy
-0.302***
(0.049)
-0.282***
(0.048)
-0.325***
(0.045)
-0.285***
(0.052)
Time dummy 1.785***
(0.318)
1.573***
(0.346)
2.001***
(0.308)
1.562***
(0.392)
Constant -7.497***
(1.152)
-3.906***
(0.494)
Panel B: Marginal effect of governance at mean value (quadratic
specification)b
Governance +
Governance
squared
0.337***
(0.115)
0.387***
(0.125)
Panel C: Additional information
Observations 1,476 1,476 1,476 1,476
Number of regions 31 31 31 31
R2 (centered) 0.74 0.55 0.74 0.54
Panel D: Test of instruments
Underidentification
test, Chi-squared
p-value
0.007*** 0.014**
41

Weak
identification test,
Wald F-statistic
23.770 16.299
*** p<0.01, ** p<0.05, * p<0.1
aThe dependent variable is the log-transformed value of area of timber harvested. Standard errors are clustered at the
regional level. The unit of observation is districts. In dummy variable specification governance dummy “poor” is
omitted. Economic growth is instrumented for using change in output per worker. In Panel D, test statistics were
generated using Stata 11. The underidentification test is the Lagrange Multiplier test of whether the equation is
identified; the null is that the equation is underidentified. The weak identification test is the cluster-robust
Kleibergen-Paap Wald F-statistic; critical values are not reported for this test but a “rule of thumb” is that a F-
statistic greater than 10 rejects the null hypothesis of weak identification (Baum et al. 2007).
bMarginal effects are relative to the values on governance used in this study and cannot be generalized to other
studies.
42
Appendix I. Validity test of governance measure To establish validity of the average governance score for a region we compare it to an
assessment of the investment potential of Russian regions. Measurements of governance are by
nature subjective, and even widely used measures are open to criticism (for example, see:
Kaufmann et al. 2007; Kaufmann et al. 2009; Kaufmann et al. 2010). Expert RA Rating Agency
is part of an international group of publishing and research companies within Russia and has
published rankings of investment potential across Russian regions since 1995. These rankings
include aspects of investment potential that go beyond governance: they also rate potential based
on economic, social, and biophysical factors. Despite this broader definition, a strong correlation
between Expert RA rankings and the average value of the Carnegie Center Moscow indicators
provides additional confidence in our governance measure (Figure A). The scatter plot between
governance – where higher indicates better governance – and investment potential – where
higher indicates greater investment potential – is strong, with two regional outliers. Both outliers
rank poorly in governance because elections are not free and fair and there is little public
participation in government, but score high in investment potential due to heavy Soviet period
industrialization.
43
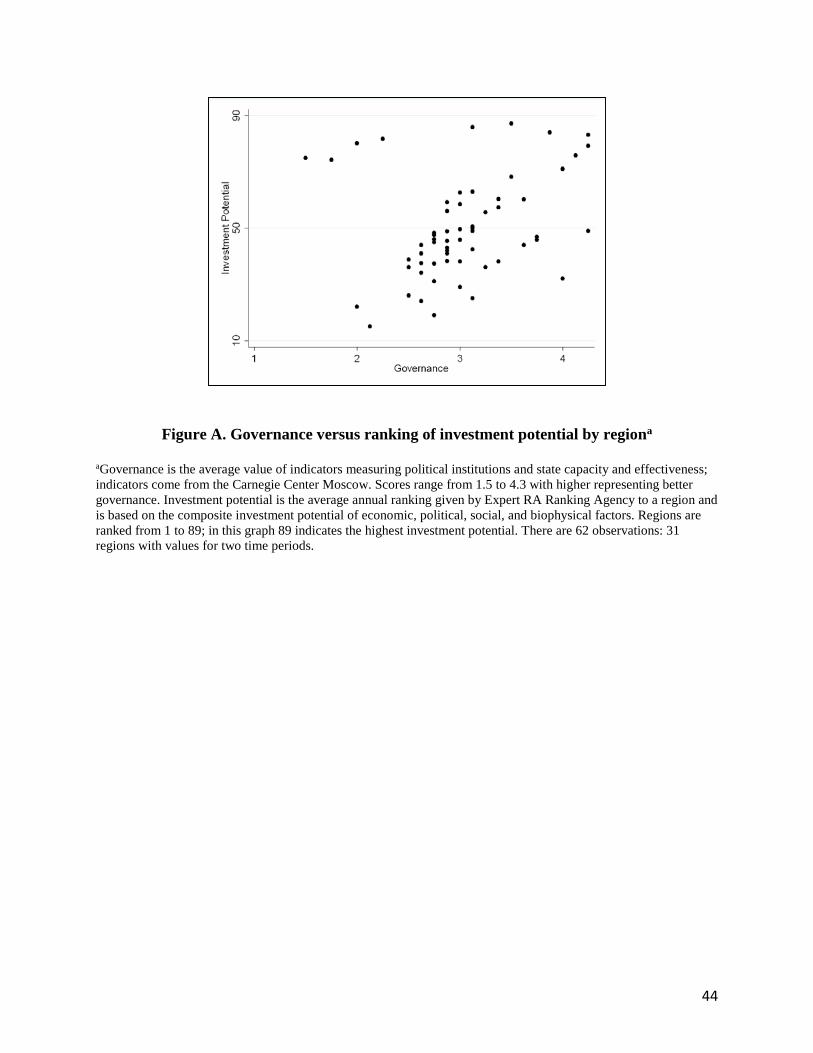
Figure A. Governance versus ranking of investment potential by regiona
aGovernance is the average value of indicators measuring political institutions and state capacity and effectiveness; indicators come from the Carnegie Center Moscow. Scores range from 1.5 to 4.3 with higher representing better governance. Investment potential is the average annual ranking given by Expert RA Ranking Agency to a region and is based on the composite investment potential of economic, political, social, and biophysical factors. Regions are ranked from 1 to 89; in this graph 89 indicates the highest investment potential. There are 62 observations: 31 regions with values for two time periods.
44
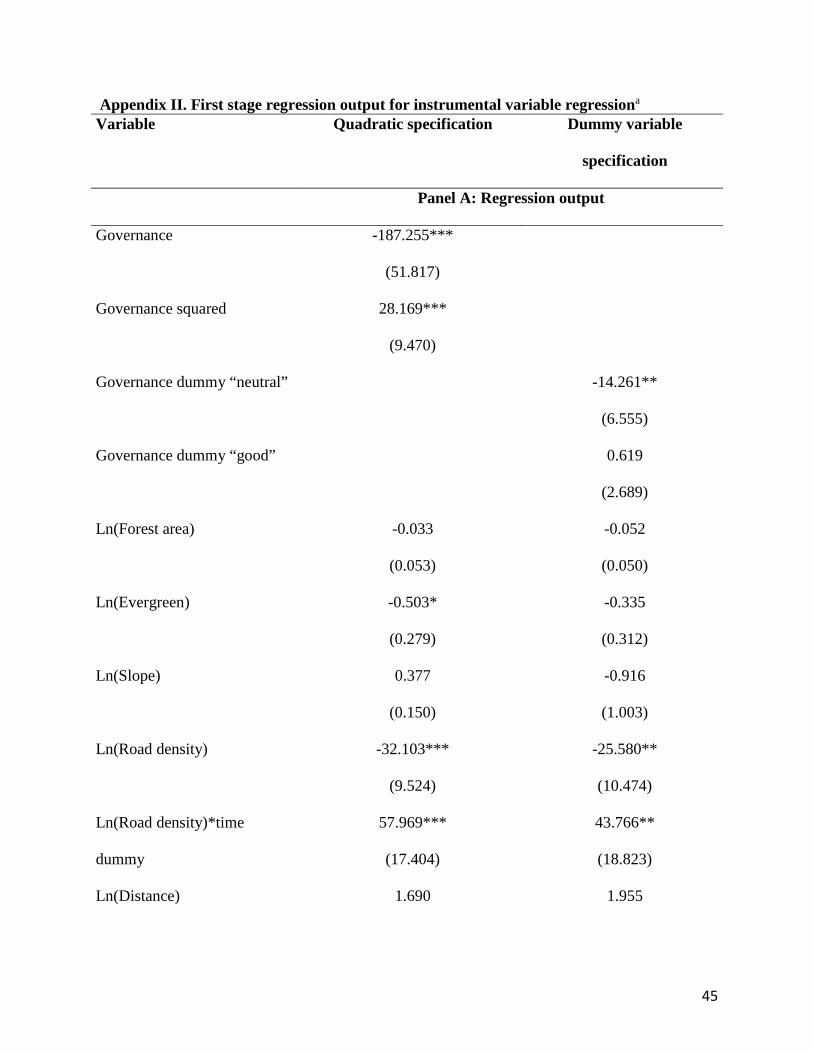
Appendix II. First stage regression output for instrumental variable regressiona Variable Quadratic specification Dummy variable
specification
Panel A: Regression output
Governance -187.255***
(51.817)
Governance squared 28.169***
(9.470)
Governance dummy “neutral” -14.261**
(6.555)
Governance dummy “good” 0.619
(2.689)
Ln(Forest area) -0.033
(0.053)
-0.052
(0.050)
Ln(Evergreen) -0.503*
(0.279)
-0.335
(0.312)
Ln(Slope) 0.377
(0.150)
-0.916
(1.003)
Ln(Road density) -32.103***
(9.524)
-25.580**
(10.474)
Ln(Road density)*time
dummy
57.969***
(17.404)
43.766**
(18.823)
Ln(Distance) 1.690 1.955
45

(1.718) (1.562)
Ln(Distance)*time dummy -2.841
(3.127)
-3.442
(2.925)
Time dummy 46.634***
(18.718)
49.307**
(18.513)
Output per worker 0.500***
(0.103)
0.486***
(0.120)
Panel B: Additional information
Observations 1,476 1,476
Number of regions 31 31
R2 (centered) 0.91 0.89
Shea Partial R2 of excluded
instruments
0.542 0.438
*** p<0.01, ** p<0.05, * p<0.1
aThe dependent variable is economic growth. Standard errors are clustered at the regional level. The unit of
observation is districts. In Panel B, test statistics were generated using Stata 11. The Shea partial R2 isolates the
explanatory power of output per worker (the excluded instrument) in explaining economic growth.
46

Appendix III. Econometric estimates from falsification test without instrumenting for economic growtha Variable
Draw 1 Draw 2 Draw 3 Draw 4 Draw 5
Governance (Mean
and Std Dev)
2.78
(1.16)
2.89
(1.08)
2.84
(1.06)
2.95
(1.05)
2.86
(1.01)
Panel A: Regression output
Quadratic specification
Governance -0.157
(0.129)
0.042
(0.268)
0.054
(0.164)
0.277
(0.165)
Governance
squared
0.024
(0.020)
-0.007
(0.044)
-0.011
(0.026)
-0.050*
(0.028)
Ln(Governance)
-0.054
(0.093)
Dummy variable specification
Governance
dummy “neutral”
-0.069
(0.069)
0.011
(0.092)
-0.019
(0.071)
0.095
(0.058)
-0.026
(0.066)
Governance
dummy “good”
-0.042
(0.090)
-0.013
(0.057)
-0.090
(0.069)
-0.027
(0.083)
-0.044
(0.081)
Panel B: Marginal effect of governance at mean value (quadratic specification)
Governance +
Governance
squared
-0.013
(0.026)
0.002
(0.012)
-0.012
(0.020)
-0.023
(0.030)
*** p<0.01, ** p<0.05, * p<0.1
aRandom integers between 1.5 and 4.5 were assigned to regions using the random number generator in Stata 11.
47

bThe dependent variable is the log-transformed value of area of timber harvested and all covariates were included as
specified in Equation 3. For the quadratic specification, in draw 5, the turning point for governance is not within the
range of the data so a log-transformation is used. Similar regression results are found when instrumenting for
economic growth and can be obtained from the authors by request.
48