wenbo yang ‘, thomas j. ahrens - california institute...
TRANSCRIPT

EPSL ELSEVIER Earth and Planetary Science Letters 156 ( 1998) 125- 140
Shock vaporization of anhydrite and global effects of the K/T bolide
Wenbo Yang ‘, Thomas J. Ahrens *
Received 9 May 1997: accepted 9 December 1997
Abstract
Shock vaporization experiments were carried out for 30% porous anhydrite up to 76 GPa. Shocked fully or partially vaporized samples interact with overlying LiF windows whose velocity histories are monitored using a velocity interferometer to obtain pressure bounds for incipient and complete vaporization for CaSO.+ Experimental data and
thermodynamic calculations indicate that these shock pressures are 81 f 7 and 155 f 13 GPa for crystal anhydrite. and 27 f I and 67 f 6 GPa for porous anhydrite, respectively. A one-dimensional finite-difference code was used to simulate
the measured velocity profiles. The vaporized products can be described by a simple Griineisen thermal equation of state
where the effective Grtineisen parameter varies from 1.5 to 0.73 upon release from 76 to 25 GPa. Using the above criteria, and recent lithic models of the impact site, the mass of degassed S has been estimated from the Chicxulub impact. For asteroids of IO and 20 km in diameter impacting the Earth at 20 km/s, the mass of degassed S in SO, or SO? is found to be 0.5 x IO” to 2 x 10” g. Simple extrapolation of Sigurdsson’s [H. Sigurdsson, Assessment of the atmospheric impact
of volcanic eruptions, in: V.L. Sharpton. P.D. Ward (Eds.), Global Catastrophes in Earth History: An Interdisciplinary Conference on Impact, Volcanism, and Mass Mortality, Geol. Sot. Am. Spec. Pap. 247 (1990) 99-l IO.] formula yields a global cooling prediction of ~IO’C. 0 1998 Elsevier Science B.V. All rights reserved,
Kewords: K/T boundary; degassing; anhydrite; shock metamorphism
1. Introduction
The Cretaceous/Tertiary (K/T) boundary, is now widely believed to have resulted from the impact of a large bolide, which marks a world-wide mass extinc-
tion of many marine and terrestrial biota [24]. The Chicxulub impact structure has recently been rec- ognized as the crater associated with the impact of
’ Present address: Schlumberger Perforating and Testing Center.
Rosharon. TX 77583. USA.
* Corresponding author. Tel.: +I (626) 395-6905; Fax: +I (626)
564-0715: E-mail: [email protected]
this bolide [5-91. The presence of 25-30s anhydrite (CaS04) and gypsum (CaS04.2H10) in the upper 3
km geological section at the Chicxulub site in NW Yucatan, Mexico [lo], has raised the possibility that enormous amounts of SO? and/or SO3 were released
into the Earth’s atmosphere during the formation of the Chicxulub impact crater [ 1 I, 121. These sugges- tions have led to studies of shock vaporization of calcium sulfate (CaSOG). Chen et al. [ 131 studied the effects of shock loading on samples of anhydrite,
gypsum, and mixtures of anhydrite and silica (SiOz). They found, using microscopy and X-ray diffraction methods upon shock recovered samples. that anhy-
0012-821X/98/$19.00 0 1998 Elsevier Science B.V. All rights reserved.
PI/ SO0 12-82 1 XI 98 )00006-S

126 W. Yung. ZJ. Ahrens/Earih und Planetup Science Letters 156 (1998) 125-140
drite did not decompose upon shock loading up to
42 GPa. This was the highest pressure of their re- covery experiments, and only the release of water
from gypsum was observed. Gerasimov et al. [14] vaporized solid gypsum and anhydrite in vacuum
using a pulsed Nd-glass laser and studied the com- position of the condensed vapor layer deposited onto
a metal foil. Gerasimov et al. suggested that a simple
decomposition mechanism
CaS04 -+ CaO + SO3
took place rather than the reaction
(1)
2CaS04 + 2CaO + 2SOz + 02 (2)
on the basis of the high temperatures achieved both in their experiments and also in the actual Chicxulub
event. Badjukov et al. [15] and later, Ivanov et al. [16]
also assumed that reaction (1) was more important in
the case of the Chicxulub impact.
In this study, vaporization experiments using 30% porous anhydrite up to 76 GPa are reported. Porous
samples were employed to allow generation of suffi- cient entropy such that complete vaporization could
be achieved at modest (5 km/s) metallic impactor velocities. The porous disc-shaped samples were mounted on metal driver plates (Table 1; Fig. 1).
An aluminum witness plate was placed in vacuum at
a stand-off distance of 2 mm behind the sample. The shocked sample material, upon adiabatic expansion,
impacted the aluminum witness plate. The velocity history of the witness plate was monitored using a
Table I
Shock equation of state parameters
lithium fluoride (LiF) window placed in contact with the aluminum via a velocity interferometer (VISAR) [17]. This technique is distinctly different than the
solid recovery method [ 131, as it is not limited by the pressure range from which recovery assemblies
can survive and provides a methodology for mon- itoring volatilization of samples after impact. Thus
VISAR measurements provide a velocity versus time signal, that upon comparison with numerical mod-
els, provides a quantitative description of dynamic
process of shock vaporization. A one-dimensional
Lagrangian finite-difference wave code, WONDY [ 181, was used to fit the experimental VISAR re-
sults. Combined with thermodynamic calculations, that employ incipient and complete vaporization cri- teria and a vapor equation of state, the degree that
chemical decomposition reactions occur within the sample in space and time may be inferred. A similar
type of experimental assembly has been used by Tru-
cane and Asay [ 191 to study cadmium vaporization under high-velocity impact. This study is the first
attempt to use this technique to study the vaporiza-
tion of a polyatomic material for which incongruent vaporization reactions take place.
2. Experiments
2.1. Samples
The samples used in this study were natural an-
hydrite (Farady mine, Farady Township, Hastings
Material p0 (Mg/m3) Co (km/s) S r,, % Y,, (GPa) Refs.
W 19.2 4.04 f 0.01 I .23 + 0.004 I.54 0.28 2.4 a
cu 8.924 3.91 f 0.01 1.51 fO.O1 I .96 0.34 0.2 a
304 S.S. 7.87 It 0.02 4.58 f 0.01 I .49 f 0.01 2.2 0.29 0.2 a.b Al606 I 2.683 & 0.003 5.35 f 0.06 I .34 f 0.02 2.1 0.34 0.2 a
LiF 2.64 f 0.02 5.15 f0.03 I .35 f 0.01 1.6 0.22 0.2 a
Lexan 1.19*0.01 2.42 * 0.03 I .32 zt 0. I 1 1.64 - _ a
Anhydrite (low-pressure phase) 2.97 3.60 i 0.06 I .75 * 0.05 2.50 - _ c Anhydrite (high-pressure phase) 3.68 3.25 & 0. I1 1.72 + 0.03 2.44 - _
Anhydrite (porous) 2.09 f 0.04 2.41 f0.08 2.16~0.04 2.50 - _
p0 is density, C, and S are shock wave equation-of-state constants: f, is Griineisen parameter; v, is Poisson’s ratio. and Y,, is yield
strength. References: a = Marsh [41]: b = Duffy [42]; c = Simakov et al. [20]; d = this study; densities for crystal anhydrite (high- and low-pressure phases) are from Simakov et al. [20] and r, is obtained using Eqs. I and 19. Nominal compositions of the metal alloys are
given in Ref. [41].

W Yung TJ. Ahrms/Eurth uncl Plotwtary Scirncr Letters 156 (1998) 125-140
Lexan Projectile Flyer Plate Driver Plate Electrical Shorting Pins(2)
127
To VISAR(Interferometer)
’ ’ Anhydrite Vacuum Gap Lexan (support \;;Bu f ferhw indow
Fig. I, Experimental configuration. shock vaporization experiments, anhydrite. Upon impact of flyer plate with driver plate a shock is
driven into experimental assembly. The electrical shorting pins tri gger digital oscilloscopes. A shock is driven into driver plate and then
the sample. Upon reflection of shock at free-surface of the sample. gas liberated will travel across the gap and induce particle velocity
motion within aluminum buffer. This is detected by VISAR. Slower moving unvaporized portions of sample then impact the aluminum
buffer and further vaporization may occur. This gives rise to additional material velocity.
County, Ontario, Canada) and gypsum (New York) crystals. Both of them were first ground in a mor-
tar to powders with diameters less than 100 Km,
then mixed with each other (80% anhydrite, 20% gypsum). Gypsum powder was used to stick the an-
hydrite particles together, as the latter are too ‘dry’ to
bond together. The powder mixture was compressed into disks 1.5-2.6 mm thick and 31 mm in diameter
using a stainless steel mold under a pressure of 4.9 MPa for 10 min at room temperature. The absorbed water content was released upon heating the com- pacted sample disks at 170°C in a vacuum oven for
12 h. The density of the final samples was 2.09f0.04
g/cm”, which corresponds to 30% porous anhydrite. After exposure to air for 2 weeks in the laboratory,
the sample disks absorbed -0.6% by weight of wa-
ter. This water content is approximately equal to the water released from anhydrite powder ground from the natural anhydrite crystal in air and heated to
200°C in vacua.
2.2. Dymrnic loading and diagnostic system
The porous anhydrite samples were shock loaded using gun-launched impactors. To achieve shock pressures of up to 40 GPa, a 40-mm-bore propellant gun was employed. A 25-mm, two-stage light-gas gun was employed at higher pressures in one experi- ment. For the 40-mm-gun experiments, the projectile mass is -100 g. These projectiles were constructed using a Lexan sabot with a variable mass and thick-
ness. The 32-mm-diameter flyer plates were mounted
on their face. The target assembly (Fig. 1) employed
flyer plate and driver materials of aluminum 6061 (A16061). 304 stainless steel (304 S.S.), copper (Cu) or tungsten (W). Table 1 lists the pertinent equa-
tion-of-state (Fig. 1) parameters of these materials. The velocity interferometer system for any reflec-
tor (VISAR) [17] was used to monitor the velocity
profile at the Al witness plate-LiF window interface.
3. Thermodynamic calculations
3.1. Shock states in porous anhydrite
The equation of state of porous anhydrite has
not yet been measured. In order to calculate the shock pressure in the porous anhydrite, its Hugoniot
equation of state was constructed theoretically using Hugoniot data for solid polycrystalline anhydrite
[20] and the Griineisen equation of state (EOS). The porous Hugoniot in the P-Vplane is given by 1211:
p = p (VW - V)/(2 - v/r1 d h (v,,d - v)/(2 - v/r)
(3)
where Ph is the shock pressure for crystal-density solid, V,,, is the initial specific volume of crys-
tal anhydrite, VCJd is the initial specific volume of porous anhydrite. r is the Grtineisen parameter.
r V,, = r,, V is assumed [22], where r,,, and V,,, are the zero-pressure Griineisen parameter and zero- pressure, crystal specific volume, respectively.
128 H? Yang, 7X Ahrens/Earth arzd Planetary Science Letters 156 (1998) 125-140
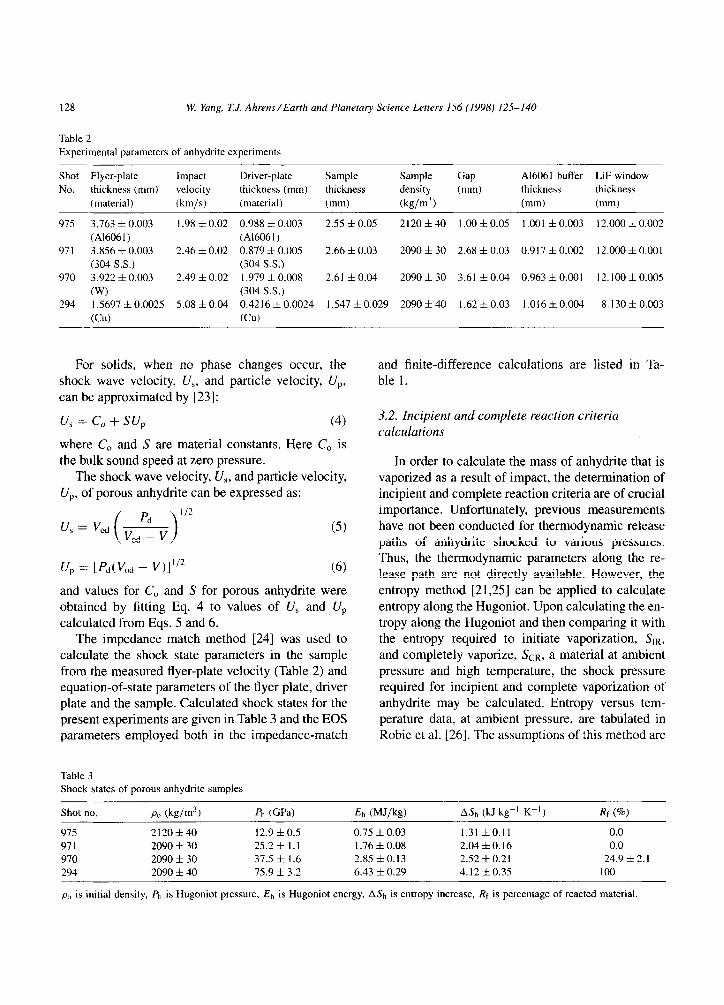
Table 2
Experimental parameters of anhydrite experiments
Shot Flyer-plate Impact Driver-plate Sample Sample Gap A16061 buffer LiF window
No. thickness (mm) velocity thickness (mm) thickness density (mm) thickness thickness
(material) (km/s) (material) (mm) (kg/m7) (mm) (mm)
975 3.763 % 0.003
(Al606 I ) 971 3.856 f 0.003
(304 S.S.)
970 3.922 zt 0.003
(W) 294 1.5697 f 0.0025
(W
1.98 I!Z 0.02 0.988 + 0.003 2.55 * 0.05 2120 * 40 I .oo f 0.05 I.001 zk 0.003 12.000 It 0.002
(Al606 I ) 2.46 +I 0.02 0.879 f 0.005 2.66 f 0.03 2090 f 30 2.68 * 0.03 0.917 * 0.002 12.000 l 0.001
(304 S.S.)
2.49 % 0.02 1.979 f 0.008 2.61 & 0.04 2090 * 30 3.61 + 0.04 0.963 & 0.001 12.100 f 0.005
(304 S.S.)
5.08f.O.04 0.4216*0.0024 1.547 ho.029 209Oz!z40 1.62ztO.03 1.016f0.004 8.130 * 0.003
(CU)
For solids, when no phase changes occur, the shock wave velocity, U,, and particle velocity, U,,,
can be approximated by [23]:
us = c,, + su, (4)
where C, and S are material constants. Here C, is the bulk sound speed at zero pressure.
The shock wave velocity, Us, and particle velocity, UP, of porous anhydrite can be expressed as:
pd
( >
I/?
u, = Vod ~ Vod - v
(5)
up = [Pd(Vod - v)]“’ (6)
and values for C, and S for porous anhydrite were obtained by fitting Eq. 4 to values of Us and UP calculated from Eqs. 5 and 6.
The impedance match method [24] was used to
calculate the shock state parameters in the sample from the measured flyer-plate velocity (Table 2) and equation-of-state parameters of the flyer plate, driver plate and the sample. Calculated shock states for the
present experiments are given in Table 3 and the EOS parameters employed both in the impedance-match
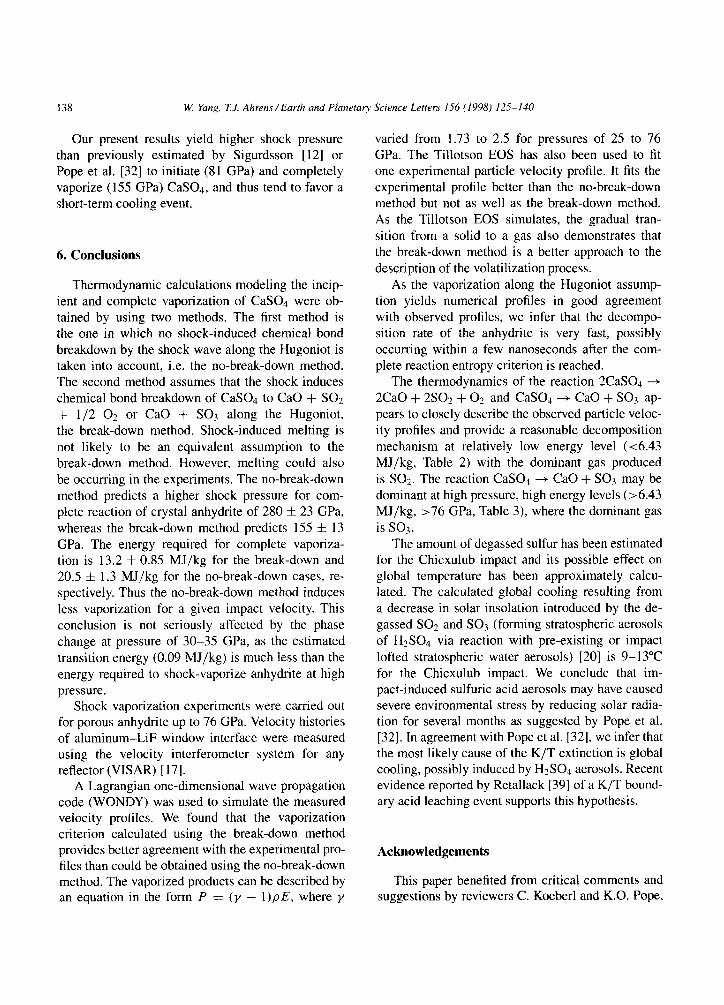
Table 3
Shock states of porous anhydrite samples
and finite-difference calculations are listed in Ta-
ble 1.
3.2. Incipient and complete reaction criteria calculations
In order to calculate the mass of anhydrite that is
vaporized as a result of impact, the determination of incipient and complete reaction criteria are of crucial importance. Unfortunately, previous measurements have not been conducted for thermodynamic release
paths of anhydrite shocked to various pressures. Thus, the thermodynamic parameters along the re-
lease path are not directly available. However, the entropy method [21,25] can be applied to calculate
entropy along the Hugoniot. Upon calculating the en-
tropy along the Hugoniot and then comparing it with the entropy required to initiate vaporization, SIR,
and completely vaporize, Scn, a material at ambient pressure and high temperature, the shock pressure required for incipient and complete vaporization of
anhydrite may be calculated. Entropy versus tem- perature data, at ambient pressure, are tabulated in
Robie et al. 1261. The assumptions of this method are
Shot no. p. (kg/m’)
975 2120f40
971 2090 f 30
970 2090 f 30
294 2090 Jo 40
ph (GPa)
12.9 & 0.5
25.2 + 1.1
37.5 zt 1.6
75.9 f 3.2
Eh (MJ/W
0.75 f 0.03
I .76 f 0.08
2.85 f0.13
6.43 * 0.29
A&, (kJ kg-’ K-‘)
1.31 f0.11
2.04f0.16
2.52 f 0.21
4. I2 f 0.35
Rf (%)
0.0
0.0
24.9 ?C 2. I 100
p,, is initial density, Ph is Hugoniot pressure, Eh is Hugoniot energy, h& is entropy increase, RF is percentage of reacted material

W Yang, ZJ. Ahrens/Earth and Planetan Science Letters 156 (199X) 125-140 12’)
that upon shock compression all the entropy produc-
tion takes place, and during the isentropic rarefaction process the specific entropy of the sample remains
constant. The reaction we considered is Eq. 1 since the gas
produced in that reaction, SO3, is more stable at high
temperature, than those of Eq. 2. The entropy increase required for incipient reac-
tion is: TIH c
SIR = s I 7;, -i;p
dT (7) p=latm
where T,, is ambient temperature, TIR is the incipient reaction temperature at standard pressure at which the sums of Gibbs free energies for the reactants and
products are equal. Here, C,, which is a function
of temperature, is the heat capacity at atmospheric
pressure [26]. The excess entropy required for complete reaction
is:
ScR = SIR + AS (8)
where AS is the entropy difference between products
and reactants at TAR. The entropy calculation along the Hugoniot is
illustrated in Fig. 2; entropy gain in the shocked state (and in the post-shock state assuming isentropic
release) is:
A& = AS,, + s
*I, c,
T, YdT (9)
where AS,, is the entropy change from low-pressure phase (LPP) to high-pressure phase (HPP) at zero
pressure (path I) and is given by:
AS,, = SHPP - SLPP (10)
The entropy gain along path II is zero; however, the temperature rise is:
T, = T,, exp[f ( I - V/ V,)] (11)
where T\ is the temperature of isentropic compres-
sion from initial specific volume Vat, (HPP) at tem- perature T,, to Hugoniot specific volume Vh at isen- tropic pressure I’, (path II), r is the Griineisen
parameter, and f / V =constant is assumed. The Hugoniot temperature is determined by (path
III):
s
7iX C, dT = E,, - E, - AE,, (12)
T,
“h “oh
Specific Volume
Fig. 2. Thermodynamic calculational paths in pressure-specific
volume (P-V) plane. Thermodynamic path (internal, energy)
for shock loading from zero-pressure at initial volume. V,, E,,
and TO (temperature) of low-pressure phase (LPP) regime to
Hugoniot state in high-pressure phase (HPP) regime at Ph, vh,
&, and Th is given by path IV. The energy and entropy change
along equivalent paths I, II, and III may be calculated. Here V,,h
is the specific volume of the high-pressure phase, and E, and
T, are the internal energy achieved along the HPP isentrope at
compressed volume. Vj,.
where A E,, is the phase transition energy at ambient
pressure and temperature. The Hugoniot energy is given by (path IV):
Et, = ;pt,(vo - vh) (13)
The isentropic energy is given by (path II):
Es = - s
Vh ?\dV (14)
V oh
We assume, as the form of the isentrope, the
Murnaghan equation [23] to describe 9, along path II:
(15)
The Hugoniot pressure, assuming the form of
Eq. 4, is given by:
p = Gl/V~, h (1 - Sq)’
(16)
where 9 = 1 - V/V,, K,, is the crystal-density bulk modulus and K,, = (aK/aP),, p=o. Their values were determined by using the data of Simakov et al.

130 W! Ykg. TJ. Ahrtm/Eurth and Plurzetarx Science Lettm IS6 (IYU8) 125-140
[20] up to 38.5 GPa and 6.0 Mg/m-? for the low-
pressure-phase (LPP), 161.8 GPa and 4.4 Mg/m” for the high-pressure-phase (HPP). We also employ the
theoretical relations [23]:
KU, = P& (17)
K’ = 4S - 1 (18)
f=2S-1
The reaction fraction is given by:
(19)
cm J’CR - S’IR
In the above formulation, it should be pointed out
that no chemical reaction is taken into account, i.e.
the Hugoniot energy is used to compress and heat the sample only, no energy is used to break the chem-
ical bonds from the initial state to the compressed state on the Hugoniot. This may not be reasonable,
as once the shock temperature reaches the incipient
reaction temperature, Tta, chemical bonds will start to break, and the Hugoniot energy, in part, may be
consumed by breaking bonds rather than just heating the sample. We note the harmonic thermal vibra-
tional specific heat per mole of atoms (at constant volume) used in our calculation was always 3R (R is the gas constant). This is the maximum value
of C, for an ideal harmonic lattice (the so-called
Dulong-Petit value [24]. Thus, partial breakdown to molecular species will decrease C,. A simple
first-order approach is to assume that once the Hugo-
niot temperature reaches Tta, it will remain constant, with increasing Hugoniot pressure, and all the un-
used Hugoniot energy, A ET,~, will be consumed only by chemical dissociation until the dissociation
is completed. The entropy increase, AS,,, during
this stage, is calculated from:
(21) 1 IR
It is clear that from this equation, for the same point on Hugoniot (or the same amount of Hugo- niot energy), more entropy will be generated in this sample than the case in which the Hugoniot energy is only consumed by heating the sample and the temperature rises continuously.
In N2 shock compression experiments, Radousky et al. [27] observed that the Hugoniot temperature
increase did not increase much with pressure as
N2 molecules started to dissociate as shock pressure increased. Their result supports use of the present ap-
proach in which a constant breakdown temperature is assumed. Since, in reality, the Hugoniot temperature
rises slowly instead of remaining constant in their
experiments for pressures above the point where Nz
starts to dissociate, our constant temperature assump- tion provides an upper bound to the entropy increase.
In this study, two computational approaches are em- ployed and compared. The first method does not take the chemical dissociation into account and the
second method does. We define these two methods
as no-break-down and break-down method, respec- tively.
However, we recognize that instead of chemical
dissociation or breakdown occurring, melting (prob- ably incongruent) may be taking place instead. The
entropy increase upon melting of simple substances is on the order of the gas constant R (8.314 J K-’
mol-’ [28,29]. If we apply this simple rule to an- hydrite, the entropy of melting of anhydrite at high
pressure is about 0.37 kJ kg-’ K-‘. This value is -10% of the total entropy of vaporization and thus is relatively small compared to the entropy gain due
to modest shock compression (Table 2). Thus shock melting may also be occurring and could be called
upon to partially explain our experimental results.
A possible approximate regime for the solid-fluid phase boundary in the CaS04 is shown in Fig. 3.
This approximate phase boundary is determined by connecting the incipient reaction points of porous and crystal-density anhydrite Hugoniots and then ex-
trapolating into the low- and high-pressure regions. The incipient and complete reaction criteria for
both crystal and porous anhydrite were calculated. For the porous case, we neglect possible phase
changes for lack of data and assume AS,, = 0.
For crystal-density anhydrite, shock experiments [20] showed that there is a phase change starting at 30 GPa that is completed at 35 GPa along the Hugoniot. AS,, of this phase change is estimated as 0.24 kJ kg-’ K-‘. The estimation method is illus- trated in Fig. 4 using the isentropes of LPP and HPP. The thermodynamic path is chosen as V,,l-A-B-C- Voc~-Vocl. Vocl -A is the isentropic compression path along the LPP isentrope to 30 GPa, A-B is the com- pression at a constant pressure of 30 GPa, B-C-V,2

W Yung. ;$.I. Ahrms/Eurth uncl Planrtu~ Sciencr Lrttencs 156 (IWX) 125-140 131
2938 K
Solid region
2938 K \
Phase boundary
Solid region
Mixed Phase (HPP, LPP phase) ’ Mixed Phase (HPP. LPP phase)
I a b
I 0 I I I
0 50 100 150 0 50 100 150
Pressure (GPa) Pressure (GPa)
Fig. 3. Shock temperature versus shock pressure for crystal anhydrite and porous anhydrite Hugoniot for no-break-down case (al
break-down case (b) are shown relative to inferred solid and fluid regions.
and
Specific Volume
Fig. 4. Estimation of entropy change from low-pressure phase
(LPP) to high-pressure phase (HPP) anhydrite. Area, ABC is
used to estimate energy difference between LPP and HPP.
is isentropic release along the isentrope of HPP, and
V,,,?-V,,,I is the path from HPP to LPP at ambient pressure. The energy required for the phase change is
the area surrounded by ABC since release from B-C is isentropic. This energy is 0.085 MJ/kg (A&,) and the entropy change is estimated as A&/T_ where T, is the average temperature at A and B calculated using Eq. 11. Compared with the break-down energy, 13.2 MJ/kg (Table 4), the phase transition energy, A&,, is very small.
Since there is no specific heat, C,, data available at high pressure, the Dulong-Petit value, 3R, was
used. The uncertainties introduced by this treatment were estimated by comparing the Dulong-Petit value
with the tabulated values of C, [26] at ambient pres-
sure. The Dulong-Petit value ( 1.099 kJ kg-’ K-’ ) is larger than experimental values at low temperatures
(0.732 kJ kg-’ K-’ at 298.15 K) but less than ex-
perimental values at high temperature ( 1.53 1 kJ kg-’ K-’ at 1400 K).
The calculated incipient and complete reaction entropy, shock pressure are listed in Table 4. The
incipient vaporization pressure of crystal anhydrite is 81 f 7 GPa. This result is consistent with results
of Chen et al.‘s [ 131 recovery experiments as no vaporization up to 42 GPa was observed.
Fig. 5 shows the calculated results of entropy
gain versus Hugoniot pressure for both porous and crystal-density anhydrite. The break-down method
yields a steeper increase of entropy gain than the no-
break-down method after the entropy gain reaches the incipient reaction value. The dots and triangles represent states calculated via the impedance match
method for the present experiments. Fig. 6 shows the reaction percentage, Rf, versus shock pressure. It is clear that the break-down assumption predicts lower
shock pressures for complete reaction for porous and crystal anhydrite than the no-break-down assump-

132 IV Yang, TJ. Ahrens/Earth and Planetar) Science Letters 156 (1998) 125-140
Table 4
Incipient and complete reaction parameters
Material A) PhlR PhCR (Eh - &)IR (Eh - &)CR SIR SCR
(Wm3) (GM (GPa) (MJ/kg) (MJ/kg) (kJ kg-’ K-‘) (kJ kg-’ K-‘)
Anhydrite (crystal) 2970 81.Ozt6.5 155 + 13 3.43 *0.15 16.6 f 0.7 2.12f0.08 3.73 * 0.14
Anhydrite (porous) 2090 f 40 26.9 & I, I 67 +e 6 1.91 f 0.09 5.25 zt 0.24 2.12f0.08 3.73 ?L 0.14
pC) is initial density, Phia is incipient reaction Hugoniot pressure, Phca is complete reaction Hugoniot pressure, & is Hugoniot energy.
E, is isentropic energy, $a is incipient reaction entropy, SCa is complete reaction entropy.
No-break-down
0 I I I I
0 20 40 60 60 100
Pressure ( GPa )
Fig. 5. Porous and crystal-density anhydrite entropy gain versus
shock pressure. Break-down refers to calculation method where.
after entropy reaches incipient reaction entropy value (Table 4),
shock temperature will not increase until the complete reaction
entropy criterion is reached (Fig. 3b). No-break-down refers to
method where shock temperature will continue to increase after
entropy reaches incipient reaction value (Fig. 3a). Dots indicate
break-down method, triangles indicate no-break-down method.
tion. Dots and triangles represent the experiments,
and values obtained using the break-down method are given in Table 2.
The uncertainties of shock pressure, shock energy (Tables 3 and 4) arise from the uncertainties of the initial density, equation of constants (Table 1) and the use of Dulong-Petit value for C,. The uncer- tainties of the incipient and complete vaporization entropy (Table 4; Fig. 5) are relatively small since they are obtained from only the formal uncertainties in the ambient pressure C, data [26]. However, the uncertainties with regard to shock pressure required
No-break-down
0 50 100 150 200 250 300
Pressure ( GPa )
Fig. 6. Reaction percent versus shock pressure for porous and
crystal anhydrite. Break-down and no-break-down cases are
shown.
for incipient and complete vaporization, could be
larger than given in the tables, because the validity of
assumptions in our thermodynamic calculations have not been tested with regard to entropy increase cal-
culations (e.g. via shock temperature measurements).
4. Experimental results and discussions
4.1. Velocity history profiles
Four shots were conducted on porous anhydrite samples. The shock pressures ranged from 13 to 76 GPa, and the calculated reaction percentages from 0 to 100% (Table 3). Due to the complex wave inter- action and chemical dissociation of the sample, the velocity profiles recorded have complex structures.

W. Yang, i?J. Ahrtws/Eurth und Planetap Scirncr Letters 156 (1998) 125-110 133
0.8 1.2 1.6 2 2.4 2.8
Time ( KS )
Fig. 7. Experimental and numerical simulation for anhydrite.
Times of experimental profiles are shifted to best present the
results. The time of the simulation is uncertain by about HO ns.
Fig. 7 shows all the profiles. The experimental condi-
tions. shock states, and equation-of-state parameters are given in Tables l-3.
4.2. Numerical simulations
In order to better understand the dynamic behav-
ior of anhydrite and to test whether the calculated thermodynamic criteria provide good descriptions of the impact process, numerical simulations were
carried out using the one-dimensional Lagrangian
finite-difference wave code WONDY [ 181. This pro- gram solves finite-difference approximations to the
equations of conservation of mass, momentum, and
energy together with an appropriate constitutive law. For simulating plate impact experiments, a one-
dimensional planar geometry with free boundary conditions is assumed. Descriptions of each material
layer are entered into the code. These include the thickness, velocity, and the mesh dimensions, as well
as material parameters (Table 1) such as the density, Hugoniot relations, Griineisen parameter, Poisson’s
ratio and yield strength required by elastic-plastic mechanical constitutive law. The latter are assumed for the metals and LiF. Detailed description of the code can be found in Kipp and Lawrence [ 181.
In our simulation, an elastic-perfect plastic model is used for the flyer plate, driver plate, aluminum buffer and LiF window. The yield strength, Y, is held
constant. The von Mises yield condition [ 181
(a,‘)’ 5 (2/3)Y,; (22)
is used. As these materials were subject to pressure values far in excess of their yield strengths. the
strength effects are very small and this simple model
can give a good description of their behaviors. For the anhydrite experiments, the calculated cri-
teria of Table 4 are applied during the simulation.
As WONDY does not calculate entropy values for
each cell, equivalent energy criteria (Table 4) were
applied. This practice may effectively lower the en- tropy values (SIR and S&, or overestimate the en-
tropy gain, because a portion of the energy gain of
a cell may be achieved via wave reflection upon
isentropic compression. To avoid the complication
of describing a cell with a fraction of its mass
devolatilized, a cell was considered solid until its
entropy gain exceeded, SCR. Once this entropy is reached in a cell, the cell is immediately treated as vaporized products and the resultant internal energy
is reduced by the amount required to completely va-
porize the mass in this cell. The vaporized products
are then described by a new equation of state. The
energy change in this cell will reduce the pressure
and thus introduce a disturbance in the flow field that
is superimposed upon reverberation wave motion be- tween different material layers of the experiments.
This causes the complex wavy profile observed in some experiments at the Al-LiF interface. The cell
size used was -0.1 mm. The size is determined by the stability requirement of the simulation [ 181.
The approximation that only after the cell en-
ergy exceeds the complete vaporization criterion devolatilized, may underestimate the amount of de- volatilization of the whole sample. In some cases
(Table 3) this is not a problem as in Shot 294 the
sample entropy generated upon being exposed to the initial shock was sufficient for complete vaporiza-
tion. In the present experiments, for Shot 970, the sample is -25% vaporized upon initial shock pas-
sage, and then becomes completely vaporized after it collides with the Al buffer. The above approxima-
tions are also less of a problem in the case of Shot 970 where 90% of the sample is vaporized before it impacts the Al buffer. However, it is difficult to quan- tify the errors arising from simplifying assumptions in the calculations.

134 B! Yang, T.J. Ahrens/Earth and Planeta~ Science Letters 1.56 (1998) 125-140
Whereas equation-of-state parameters for the un-
vaporized anhydrite are given in Table 1 for the
vaporized sample, the Grtineisen gas equation of
state used is [30]:
P = (y - 1)pE (23)
where y is a constant and was adjusted in the simula- tion to fit the experimental particle velocity profiles.
Fig. 7 shows the simulated profiles together with the experimental ones and Fig. 8 demonstrates the effect
of varying a number of parameters including y. For
Shot 97 1, the entropy gain of the sample from the
first shock was less than the incipient reaction value:
after the sample impacted the buffer, -30% of the
sample adjacent to the buffer was vaporized. For Shot 975, no vaporization occurred, the sim-
ulation initially yields a longer pressure plateau than observed. This experimental result suggests
that, once the shock wave reached the sample’s
free surface, a layer of sample is ejected from the free-surface as separated solid particles. These par-
titles impact the buffer incoherently. As a result,
the buffer-LiF window, that is monitored with the VISAR, does not respond to these particles as it
does to the impact of a layer of material. The slow
ramp increase of the velocity at the beginning of the
experimental profile (Fig. 7) may be the indication
of this kind of bombardment. This effect will reduce
the effective thickness of the sample. Upon reducing
the sample thickness by 10% in the simulation, an
improved fit is obtained (shown in Fig. 7). The simulations of Fig. 7 assumed the break-
z 3 1.6
g - 12
x. .z
2 0.8
8
0.4
2.4
Simulation; No-breakdown .L A’ I . . :, \‘, , ‘i Simulation; Break-down
, ,’ !I
; . .
1 ‘A. “I:: ~_ ‘. . .
.‘ Expenment
Shot 970; 37.5 GPa
t
‘1 , S,,,=3.18KJ/KgIK c
I 89=2.42 KJ/Kg/K
C~>Ul Mnlplr Blck.“r\r=l.&lmm 0.11 ,i, ( , _, , , d_ j, , , , , , rh,
1.8 2 2.2 2.4 2.6 2.8 3 2 2.2 2.4 2.6 2.8
Time (ps) Time (ps)
2 2.2 2.4 2.6 2.8 3
Time (ps)
Fig. 8. Experimental result and numerical simulations for anhydrite. Shot 970. (a) Break-down and no-break-down cases are shown.
(b) Incipient reaction criterion, Stn (Table 4). was perturbed by 50% in numerical simulations. (c) The difference of complete reaction
criterion, &-R. and incipient reaction criterion, StR (Table 4). was perturbed by 50% in numerical simulations. (d) Value of Y was perturbed by 5% to demonstrate its effect in numerical simulations. (e) Crystal-density anhydrite sample thickness is perturbed. Time in
simulation is also shifted. (f~ Effect of using Tillotson equation of state (Table 5) for simulation is shown.

W Yang. i7J. Ahrens/Earth and Planetay Science Letters 1% (1998) 125-140 Ii5
down criterion. The break-down criterion appears to
provide a good description of shock devolatilization. In order to further test the model’s validity and its sensitivity to input parameters, a series of simula- tions has been conducted. Shot 970 was used as a
base-line case, parameters were perturbed in the test simulations (Fig. 8) to study sensitivity of the fits to variation in material properties. Only one parameter
was changed in each simulation.
Fig. 8a shows the experimental profile with simu-
lation results for break-down and no-break-down cri-
terion. The break-down criterion yields better agree- ment with the experimental profile.
Fig. 8b shows the experimental profile with sim-
ulation results for different incipient reaction cri- teria. The incipient reaction threshold is perturbed
by &SO% relative to the break-down threshold
SIR = 2.12 k.l kg-’ K-‘. It is clear that increase or decrease of the incipient reaction criterion gives
no better fits to the experiment. This shows that the thermodynamically calculated incipient reaction value represents the data fairly well.
In Fig. Xc, the entropy difference of products and
reactant. AS, or S,-, - SIR is perturbed by f50%. It also shows that the break-down criterion yields
a better fit, since increasing AS is equivalent to the no-break-down case. We thus conclude that the
break-down criterion is a better assumption than no breakdown.
It is understandable that different 1/ values are
needed for different shots (or pressure), as the gas generated from CaS04 vaporization, and CaO dust
behave differently at different pressure ranges and deviate greatly from ideal gas behavior. Studies of detonation products, that also are a mixture of gas
and solid particles (CO:, CO. C, H20, N?, etc.), produced from high explosives at high pressures can be described well by relation of the form of Eq. 23
with y changing as release pressure changes. For example, upon detonation of RDX (C3HhNbOh), y equals 2.48 and 2.98 at 1 1 and 35 GPa, respectively [3 l]. Fig. 8d shows some simulation results of Shot 970 with different y to demonstrate this effect.
In the laser vaporization experiments of Gerasi- mov et al. 1141 they suggest that more SO7 is pro- duced than SO?. High-pressure oxygen produced by the laser blowoff favors SOi over (SO? + l/2 0:) formation. This may also explain why a different
value of y is needed to fit the results for total vapor-
ization (e.g. Shot 294, Table 3). The sample density, thickness (Fig. 8e), impact
velocity, and the LiF window density were each altered by fS%. and no dramatic change of the
simulated particle velocity profiles from those calcu- lated using the nominal values of the parameters are observed. As the uncertainties of these parameters
are less than 5%, we conclude that the simulation is
stable.
The incipient reaction pressure we predict from
the present work for crystal-density anhydrite is 81 f 6.5 GPa (Table 4). This is consistent with the
shock recovery experiments of Chen et al. 1131, who
found no signs of dissociation up to a peak shock pressure of 42 GPa. A direct measurement of the
shock temperature of anhydrite crystal versus shock pressure may provide more insights into the vapor-
ization process. Fig. 3 shows the calculated shock
temperature versus shock pressure of porous and crystal-density anhydrite for both break-down and no-break-down cases. A solid-liquid phase bound-
ary is also suggested based on our experiments and the simple estimation of entropy of melting at high
pressure [28,29]. This may be useful in planning
future shock temperature experiments. Fig. 8e shows a simulation of Shot 970 in which
the sample is of crystal-density anhydrite with the same mass per unit area as the sample in the ex-
periment, while all other parameters are the same. It
appears that the (-7 MHz) wave reverberations may be a characteristic of the shock consolidated sample,
since the crystal-density anhydrite is not expected to vaporize in this simulation. However. recent studies
of S. Gupta (CIT) suggest that this oscillatory pro-
file may also arise from sharp spatial gradients in the zone thickness in the finite difference calcula-
tions. Further research on this question is currently underway.
As Eq. 23 is in the form of an ideal gas equation
of state, it appeared to us that the Tillotson EOS pa- rameters [30] could also be applied in these studies. In the compressed region (p/p > 1) and for the cold expanded states where the energy density is less than the incipient vaporization, E < Ei,. the Tillotson EOS takes the form as:
b p=cc+
E/E,,q’ + 1 pE + A/L + B/L’

136 W. Yang, 7X Ahrens/Earth and Planetay Science Letters 156 (1998) 125-140
where 17 = p/p”, p = r~ - 1, and a, b, A, B, and
E, are the Tillotson parameters. It can be shown 1301 that (a + b) is the Grtineisen parameter at zero
pressure,
(a + b) = r, (25)
and a was chosen to be equal to 0.5 to give a better
simulation result rather than that of the high-pres-
sure limit value 0.6 [21]. The C, and S parameters of the linear shock-particle velocity model can be
expressed in terms of the Tillotson parameters by:
(26)
(27)
In the expanded state, p/p0 5 1, when the internal
energy exceeds the energy of complete vaporization
E > E,,, the pressure is given by:
p=apE
+ bpE E/&q2 + 1
+ Ape-b(P<>/P- I) e-or(dP-‘)’
I (28)
where a! and 6 are constants that control the rate of
convergence of this equation to the ideal gas law. In the partial vaporization regime when p/p0 < 1 and Ei, < E,,, the pressure is computed from a hybrid
formula to make a smooth transition from Eq. 24 to Eq. 28. The hybrid formula is:
(E - Ei,)pE + (EC, - E)IX P=
Ecv - Eiv (29)
where PE is computed from Eq. 28 and pc is com-
puted from Eq. 24. The parameters a, b, A, B are determined from
Eqs. 25-27. E, is determined by fitting Eq. 24 to
experimental Hugoniot data. Following the previous literature [30], u and /I were chosen as 5. Parame- ters used for the Shot 970 simulation are listed in Table 5. The simulated velocity profile is shown in Fig. 8f and compared with the experimental profile,
and the simulation result using Eq. 23. The Tillot- son equation gives a more oscillatory profile than indicated by the data, and hence does not match the experimental profile as well as the use of Eq. 23.
Other values of cx and /I (e.g. cx = /3 = 1.0) were also tested, but the result changed little.
5. SO3 release from Chicxulub impact
5.1. Estimation of degassed sulfur mass
In order to estimate the mass of degassed sulfur,
we need to calculate the amount of anhydrite that
was subjected to pressures greater than the incipient pressure, 81 GPa. We assume that the devolatiliza-
tion pressures of theoretically solid anhydrite are closest to being applicable to the Chicxulub va-
porization of anhydrite rather than the 30% porous
material actually studied here. As Pope et al. [32] pointed out, the size of the
Chicxulub crater is not well constrained. The esti-
mates based primarily upon circular gravity anoma- lies indicate a diameter of - 180 km [5] or 260-
300 km [33]. Moreover, oblique impact may affect the devolatilization process to an unknown degree. Therefore, Pope et al. chose to model craters with diameters of 180 km and 300 km. These two crater
sizes correspond to silicate bolide diameters of about 10 km and 20 km impacting perpendicular to the
surface of the Earth at 20 km/s. The 20 km/s veloc-
ity chosen for the impactor (which is very uncertain)
has been rationalized previously by Roddy et al. [34]. The geologic model for the target rock at Chicxulub used by Pope et al. is a two-layer model. The upper
layer was modeled as tuff, which corresponds to the 3-km-thick sedimentary layer (the average anhydrite
composition assumed in Pope et al.‘s [32] paper is 30% by weight) at Chicxulub, and the lower layer is assumed to be granite. This composition approx- imates the properties of the basement rocks in this
Table 5
Parameters of Tillotson equation of states of anhydrite
Material PO a h A B E0 E,” E (Y P
(kg/m”) (GPa) (GPaJ (MJ/kg) N/kg) (GJ/kg)
Anhydrite (porous) 2090 f 40 0.5 2.0 12.1 25.0 3.21 2.12 13.7 5.0 5.0

W Yung. T.J. Ahrens/Earth und Planetap Science Letter.7 156 (1998) 125-140 137
Table 6
Degassed sulfur a mass from the Chicxulub impact event
(20 km/s) Complete Partial Total
bolide diameter vapor region vapor region (IO’h .g)
( l0lh g) (IO’h g)
10 km 4.0 0.9 5 ( 4-2l)h
20 km I5 3.4 18 (l3-70)h
” Sulfur is in either SO: or SOi.
h Values were estimated by Pope et al. [31].
region. A more recent estimate in Pope et al. [35] also gives 30% anhydrite. However, we note that a
comparable amount of oxidized sulfur may be pro-
duced by the oxidation of vaporized sulfides from
the bolide as compared to the target.
The volume of sediments shocked between 81 and 155 GPa, above 155 GPa were estimated using the method outlined in Chen et al. [ 131. The amount
of degassed sulfur from partial and complete vapor- ization is listed in Table 6. For comparison. Pope et
al.‘s estimations are also listed. As they used lower
incipient pressure estimates, their estimated range is
somewhat higher than ours, but their values overlap
our best estimates.
5.2. Global eflects
The expected effect of lofting large amounts of
impact-induced CO?, SO? or SO3 into the strato- sphere results in a temperature increase arising from the greenhouse effect; alternatively, a temperature
decrease may result, due to production of SO;! and SO3, which react with Hz0 aerosols in the strato-
sphere to produce long lasting HzS04, which reduces
the solar insolation of Earth. The extrapolation of the present paper is based on volcanic eruption data.
Due to the complexity of global climate modeling, in
general, this extrapolation should be considered with great caution.
For sulfur, Sigurdsson [ 11 used an empirical rela- tion to correlate the volcanic sulfur mass yield, X, in grams, to observed global temperature decreases after the eruptions:
AT = 5.9 x 1O~‘X”-” (30)
This formula gives a global cooling of 9” and 13°C for the IO- and 20-km bolide, respectively.
These average temperature decreases would have
severely stressed the biotic environment. However, the largest historically documented volcanic eruption
(Tambora, 18 15, caused cooling of 0.7”C in the following 2 years [ 36,371) degassed only l-2 x IO’” g of SO?, which corresponds to a value of X = 0.5
to 1.0 x 1OiJ g. This is _ IO-’ times less S than
expected for the observed temperature change. We
conclude that Eq. 30 is only an approximate relation.
Pope et al. [32], using a one-dimensional radia- tive transfer model [38], studied the global cooling
effects of the sulfuric acid aerosols produced by impact released SO? or SOJ, and suggested that pho-
tosynthesis was halted by a drastic decrease in solar
insolation delivered to plants for the 6-9 months
after the Chicxulub impact. Sigurdsson’s model pre- dicts at least decades of global freezing followed the
impact event. Sigurdsson et al. [ 12.1 also favors a severe global cooling scenario. We believe the mass
of degassed sulfur in previous studies may have been over-estimated due to the use of lower incipient and
complete reaction pressure values (30 and 100 GPa
[32]; 40 GPa [12]). There is actually little physical evidence support-
ing a severe global cooling event after the K/T im-
pact. For example, 6”O studies, which were briefly
summarized by Sigurdsson et al. [12], across the
K/T boundary indicate no clear-cut signature of a
temperature anomaly. Taking into account the self- limiting effects of sulfuric aerosol 1371, the im-
pact-induced severe cooling event may have been too short to be well recorded in the sedimentary
record, as Sigurdsson et al. [12] suggested. How-
ever, recently Retallack [39] has found evidence for
an acidic leaching event at the K/T boundary in
Montana.
Based upon our experiments, calculation and dis-
cussions above, we conclude that the impact-in- duced sulfur formed H~SOJ stratospheric aerosols. The H~SOJ aerosols are produced from largely shock-induced stratospheric water aerosols, like the
dust cloud originally proposed by Alvarez et al. [2], that is lofted to the stratosphere by the impact. Both
H~SOJ aerosols, and dust to a degree not firmly estab- lished, reduce the solar insolation and cools the Earth. However, both mechanisms appear to play a shorter and less important role in cooling the Earth for a pe- riod of 103-10” years than Hut et al. [40] suggested.
138 W. Yang. TJ. Ahrens/Eurth and Planetay Science Letters 156 (1998) 125-140
Our present results yield higher shock pressure
than previously estimated by Sigurdsson [ 121 or Pope et al. [32] to initiate (81 GPa) and completely
vaporize (155 GPa) CaS04, and thus tend to favor a short-term cooling event.
6. Conclusions
Thermodynamic calculations modeling the incip-
ient and complete vaporization of CaS04 were ob-
tained by using two methods. The first method is the one in which no shock-induced chemical bond
breakdown by the shock wave along the Hugoniot is taken into account, i.e. the no-break-down method.
The second method assumes that the shock induces
chemical bond breakdown of CaS04 to CaO + SO?
+ l/2 02 or CaO + SO? along the Hugoniot, the break-down method. Shock-induced melting is
not likely to be an equivalent assumption to the break-down method. However, melting could also
be occurring in the experiments. The no-break-down
method predicts a higher shock pressure for com-
plete reaction of crystal anhydrite of 280 f 23 GPa,
whereas the break-down method predicts 155 f 13
GPa. The energy required for complete vaporiza- tion is 13.2 f 0.85 MJ/kg for the break-down and 20.5 f 1.3 MJ/kg for the no-break-down cases, re-
spectively. Thus the no-break-down method induces
less vaporization for a given impact velocity. This
conclusion is not seriously affected by the phase
change at pressure of 30-35 GPa, as the estimated
transition energy (0.09 MJ/kg) is much less than the
energy required to shock-vaporize anhydrite at high
pressure. Shock vaporization experiments were carried out
for porous anhydrite up to 76 GPa. Velocity histories
of aluminum-LiF window interface were measured using the velocity interferometer system for any
reflector (VISAR) [ 171. A Lagrangian one-dimensional wave propagation
code (WONDY) was used to simulate the measured velocity profiles. We found that the vaporization criterion calculated using the break-down method provides better agreement with the experimental pro- files than could be obtained using the no-break-down method. The vaporized products can be described by an equation in the form P = (y - l)pE, where )/
varied from 1.73 to 2.5 for pressures of 25 to 76 GPa. The Tillotson EOS has also been used to fit one experimental particle velocity profile. It fits the
experimental profile better than the no-break-down
method but not as well as the break-down method.
As the Tillotson EOS simulates, the gradual tran-
sition from a solid to a gas also demonstrates that the break-down method is a better approach to the
description of the volatilization process.
As the vaporization along the Hugoniot assump- tion yields numerical profiles in good agreement
with observed profiles, we infer that the decompo-
sition rate of the anhydrite is very fast, possibly
occurring within a few nanoseconds after the com- plete reaction entropy criterion is reached.
The thermodynamics of the reaction 2CaS04 --+
2CaO + 2SO2 + 02 and CaSOj + CaO + SO1 ap-
pears to closely describe the observed particle veloc- ity profiles and provide a reasonable decomposition
mechanism at relatively low energy level (~6.43 MJ/kg, Table 2) with the dominant gas produced
is SOI. The reaction CaS04 + CaO + SO3 may be
dominant at high pressure, high energy levels (>6.43
MJ/kg, >76 GPa, Table 3), where the dominant gas
is SOj. The amount of degassed sulfur has been estimated
for the Chicxulub impact and its possible effect on
global temperature has been approximately calcu-
lated. The calculated global cooling resulting from a decrease in solar insolation introduced by the de-
gassed SO? and SO3 (forming stratospheric aerosols
of H2S04 via reaction with pre-existing or impact
lofted stratospheric water aerosols) [20] is 9-13°C
for the Chicxulub impact. We conclude that im- pact-induced sulfuric acid aerosols may have caused severe environmental stress by reducing solar radia- tion for several months as suggested by Pope et al. [32]. In agreement with Pope et al. [32], we infer that
the most likely cause of the K/T extinction is global cooling, possibly induced by H~SOJ aerosols. Recent evidence reported by Retallack [39] of a K/T bound- ary acid leaching event supports this hypothesis.
Acknowledgements
This paper benefited from critical comments and suggestions by reviewers C. Koeberl and K.O. Pope,

W Yung. T.J. Ahrcws/Earth and Planrtu~ Scirncr Latturs 156 (1998) 125-140 I39
as well as G. Ravichandran, R. Clayton, and P. Wyl-
lie. We thank E. Gelle and M. Long for their help in performing the experiments. Research supported
by NASA. Contribution Number 5794, Division of Geological and Planetary Sciences (Caltech). [MJ] W’l
References
H. Sigurdsson, Assessment of the atmospheric impact of
volcanic eruptions. in: VL. Sharpton, PD. Ward. (Eds.).
Global Catastrophes in Earth History: An Interdisciplinary
Conference on Impact, Volcanism. and Mass Mortality.
Geol. Sec. Am. Spec. Pap. 247 (1990) 99-110.
L.E. Alvarez. W. Alvarez, F. Asaro. H.V. Michel. Ex-
traterrestrial cause for the Cretaceous-Tertiary extinction.
Science 208 (1980) lO95- I 108.
B.F. Bohor. E.E. Foord, PJ. Modreski. D.M. Triple-
horn, Mineralogical evidence for an impact event at the
Cretaceous-Tertiary boundary. Science 224 (1984) 867-
X69.
J.F. McHone. R.A. Nieman, C.F. Lewis. A.M. Yates.
Stishovite at the Cretaceous-Tertiary boundary. Raton. New
Mexico, Science 243 C 1989) I I82- I 184.
A.R. Hildebrand, G.T. Penheld. D.A. Kring. M. Pilking
ton. A.Z. Camargo, S.B. Jacobsen. W.V. Boynton. Chicx-
ulub crater: A possible Cretaceous-Tertiary boundary im-
pact crater on the Yucatan Peninsula, Mexico, Geology I9
(1991) 867-871.
H. Sigurdsson. S. D’Hondt. M.A. Arthur, T.J. Bralower.
J.C. Zachos, M. Fossen. J.E.T. Channel]. Glass from the
Cretaceous-Tertiary Boundary in Haiti. Nature 349 (I 99 I ) 482-487.
H. Sigurdsson. P. Bonte. L. Turpin. M. Chat&don. N.
Metrich. M. Steinberg. P. Prade. S. D’Hondt, Geochemical
constraints on source region of Cretaceous/Tertiary impact
glasses, Nature 353 ( I99 1) 839-842.
J.D. Blum. C.P. Chamberlain. Oxygen isotope constraints
on the origin of impact glasses from the Cretaceous-
Tertiary boundary. Science I 104-l 107 (1992).
C.C. Swisher III. J.M. Grajales-Nishimura. A. Montanari.
S.V. Margolis. P. Claeys, W. Alvarez. P. Renne, E. Cedillo-
Pardo. FJ-M.R. Maurrasse, G.H. Curtis, J. Smit. M.O.
McWilliams. Coeval ‘“Ar/“Ar ages of 65.0 million years
ago from Chicxulub crater melt rock and Cretaceous-
Tertiary boundary tektites, Science 257 ( 1992) 954-958.
V.L. Sharpton. P.D. Ward. (Eds.), Global Catastrophes in
Earth History: An Interdisciplinary Conference on Impacts.
Volcanism. and Mass Mortality. Spec. Pap. 247. The Geo-
logical Society of America, Inc.. Boulder, CO. 1990.
R. Brett. The Cretaceous-Tertiary extinction: a lethal mech-
anism involving anhydrite target rocks, Geochim. Cos-
mochim. Acta 56 (I 992) 3603-3606.
H. Sigurdsson. S. D’Hondt, S. Carey, The impact of the
Cretaceous/Tertiary bolidc on evaporite terrane and genera-
1141
1151
1161
1171
tion of major sulfuric acid aerosol. Earth Planet. Sci. Lett.
109 (1992) 543-559.
G. Chen. J.A. Tyburczy. T.J. Ahrens. Shock-induced de-
volatilization of calcium sulfate and implications for K-T
extinctions. Earth Planet. Sci. Lett. I28 (1994) 615-62X.
M.V. Gerasimov. Y.P. Dikov. 0.1. Yakovlev. E Wlotzka.
High-temperature vaporization of gypsum and anhydritc:
Experimental results (Abstr.). Lunar Planet. Sci. Conf.
XXV, 413-414, Lunar Planet. Inst.. Houston, TX. 1994.
D.D. Badjukov. Y.P. Dikov, T.L. Petrova, S.V. Pershin.
Shock behavior of calcite, anhydrite. and gypsum (Abstr.).
Lunar Planet. Sci. Conf. XXVI. 63-64. Lunar Planet. Inst..
Houston. TX. 1995.
B.A. Ivanov, D.D. Badukov. 0.1. Yakovlev. M.V. Gerasi-
mov. Y.P. Dikov. K.O. Pope, A.C. Ocampo. Degassing of
sedimentary rocks due to Chicxulub impact: Hydrocode and
physical simulations. Geol. Sot. Am. Spec. Pap. 307 (19961
125-139.
L.M. Barker, R.E. Hollenbach, Laser interferometer for
measuring high velocities of any rehecting surface, J. Appl.
Phys. 43 ( 1972) 4669-4675.
[IX] M.E. Kipp, R.J. Lawrence, WONDY V - A onc-dimen-
sional tinite-difference wave propagation code. SAND 81-
0930. Sandia Nat]. Lab.. Albuquerque. NM. 1982.
1191
1301
1211
1221
1231
[741
11-51
1261
I271
1281
1291
T’.G. Trucano, J.R. Asay, Effects of vaporization on debris
cloud dynamics. Int. J. Impact Eng. 5 (1987) 655-653.
G.V. Simakov. M.N. Pavlovskiy. N.G. Kalashnikov. R.F.
Trunin. Shock compt-cssibility of twelve minerals, Izv.
Earth Phys. IO ( 1974) 388-492.
Y.B. Zel’dovich. Y.P. Raizer. Physics of Shock Waves
and High-Temperature Hydrodynamic Phenomena. 4.52 pp..
Academic Press. New York, 1967.
M.H. Rice. R.G. McQueen. J.M. Walsh, Compression of
solids by strong shock waves. in: Solid State Physics. Vol.
6, F. Seitr. D. Turnbull. eds.. pp. l-63, Academic Press.
New York. 1958.
A.L. Ruoff, Linear shock-velocity-particle-velocity rela-
tionship. J. Appl. Phys. 38 ( 1967) 3976-4980.
T.J. Ahrens. Shoch wave techniques for geophysics and
planetary physics. in: C.G. Sammis. T.L. Henyey (Eds.).
Methods of Experimental Physics. Vol. 33, part A. pp.
185-235. Academic Press. New, York. 1987.
T.J. Ahrens. Shock melting and vaporization of metals. J.
Appl. Phys. 43 (1972) 2433-2445.
R.A. Robie. B.S. Hemingway. J.R. Fisher. Thermodynamic
properties of minerals and related substances at 298.15 K
and I bar ( 105 pascals) pressure and at higher temperatures.
U.G.S.G. Bull. 1452 (1978) 4.56.
H.B. Radousky. W.J. Nellis. M. Ross. D.C. Hamilton. A.C.
Mitchell. Molecular dissociation and shock-induced cooling
in fluid nitrogen at high densities and temperatures. Phys.
Rev. Lett. 57 (1986) 2419-2322.
S.M. Stishov, The thermodynamics of melting of simple
substances. Sov. Phys. Uspekhi I7 ( 197-l) 625-643.
S.M. Stishov, Entropy. disorder. melting. So\. Phy\. Us-
pekhi 3 I ( 198X) 52-67.

140 w Yang, ZJ. AhrenslEarth and Planetary Science Letters 156 (1998) 125-140
[30] H.J. Melosh, Impact Cratering, A Geologic Process, Oxford
University Press, New York, 1989, 245 pp.
1311 B. Zhang, H. Zhao, H. Jiang, J. Li, S. Yun, S. Zhang,
S. Yang, T. Wang, Explosion and its Application, Defense
Press, 1979, 348 pp.
[32] K.O. Pope, K.H. Baines. A.C. Ocampo, B.A. Ivanov, Bio-
spheric effects of sulphuric acid aerosols produced by the
Chicxulub Cretaceous/Tertiary impact. Earth Planet. Sci.
Lett. 128 (1994) 719-725.
[33] V.L. Sharpton, K. Burke, A. Camargo-Zanoguera, S.A.
Hail, D.S. Lee, L.E. Marin, G. Su&rez-Reynoso, J.M.
Quezada-Mufieton, P.D. Spudis, J. Urrutia-Fucugauchi,
Chicxulub multi-ring impact basin - size and other charac-
teristics derived from gravity analysis. Science 261 (1993)
1564-1567.
[34] D.J. Roddy, S.H. Schuster, M. Rosenblatt. L.B. Grant, P.J.
Hassig, K.N. Kreyenhagen, Computer simulations of large
asteroid impacts into oceanic and continental sites - Pre-
liminary results on atmospheric, cratering and ejecta dy-
namics, Int. J. Impact Eng. 5 (1987) 525-541.
[35] K.O. Pope, K.H. Baines, A.C. Ocampo, B.A. Ivanov, En-
ergy, volatile production, and climatic effects of the Chicx-
ulub Cretaceous/Tertiary impact, J. Geophys. Res. (1997)
in press.
[36] H. Sigurdsson, Evidence of volcanic loading of the atmo-
sphere and climate response, Palaeogeogr.. Palaeoclimatol.,
Palaeoecol. 89 (1990) 277-289.
[37] J.P. Pinto, R.P. Turco, O.B. Toon, Self-limiting physical and
chemical effects in volcanic eruption clouds, J. Geophys.
Res.94(1989) 11165-11174.
[38] K.H. Baines, W.H. Smith, The atmospheric structure and
dynamical properties of Neptune derived from ground-
based and IUE spectrophotometry, Icarus 85 (1990) 65-
108.
[39] G. Retallack, Acid trauma at the Cretaceous-Tertiary bound-
ary in eastern Montana, GSA Today 6 (5) (1996) 1-7.
[40] P. Hut, W. Alvarez, W.P Elder, T. Hansen, E.G. Kauffman,
G. Keller, E.M. Shoemaker, P.R. Weissman. Comet showers
as a cause of mass extinctions, Nature 329 ( 1987) 118-i 26.
[41] S.P. Marsh, ed.. LASL Shock Hugoniot Data, University of
California Press, Berkeley, 1980, pp. i-658.
[42] T.S. Duffy, Elastic properties of metals and minerals under
shock compression, Ph.D. thesis, California Institute of
Technology. Pasadena, CA, 1992, 298 pp.