wells creek final monitoring report year 5 of 5 2009 …
TRANSCRIPT

WELLS CREEK FINAL MONITORING REPORT
YEAR 5 OF 5 2009
EEP Project # 414 Alamance County, North Carolina
Submitted to:
NCDENR-EEP
1652 Mail Service Center Raleigh, NC 27699

Monitoring Firm:
1025 Wade Avenue Raleigh, NC 27605
Phone: (919) 789-9977 Project Manager:
Phillip Todd [email protected]

TABLE OF CONTENTS Monitoring Summary ....................................................................................................................... 1 Methodology .................................................................................................................................... 3
Vegetation Methodology.................................................................................................... 3 Stream Methodology.......................................................................................................... 3
Longitudinal Profile and Plan View..................................................................... 3 Permanent Cross Sections.................................................................................... 3 Pebble Counts ...................................................................................................... 4
Photo Documentation......................................................................................................... 4 References… ................ …………………………………………………………………………….5 APPENDICES Appendix A: General Figures and Plan Views
Figure 1 – Site Vicinity Map Figure 2 – Reach Layout Map Current Condition Plan Views (Stream Problem Areas) .....................................Sheets 1-6 Current Condition Plan Views (Vegetation Problem Areas) ...............................Sheets 1-6
Appendix B: General Project Tables
Table 1. Project Restoration Components . .................................................................... B-1 Table 2. Project Activity and Reporting History .. ......................................................... B-1 Table 3. Project Contact Table ....................................................................................... B-2 Table 4. Project Background Table .. ............................................................................ B-2
Appendix C: Vegetation Assessment Data
Table 5: Vegetation Plot Mitigation Success Summary Table Plotolog: Vegetation Plot Photolog Table A1: Vegetation Plot Stem Counts
Appendix D: Stream Assessment Data
Cross Sections & Photo Point Photolog – Monitoring Reach 1 Cross Sections & Photo Point Photolog – Monitoring Reach 2 Cross Sections & Photo Point Photolog – Monitoring Reach UT Table B2a. Visual Morphological Stability Assessment – Monitoring Reach 1 Table B2b. Visual Morphological Stability Assessment – Monitoring Reach 2 Table B2c. Visual Morphological Stability Assessment – Monitoring Reach UT Table V. Verification of Bankfull Events Cross Section Annual Overlay Plots Longitudinal Profile Annual Overlay Plots Pebble Count Annual Overlay Plots
Wells Creek SEPI Engineering Group EEP Number 414 Final Monitoring Report January 2010 Monitoring Year 5 of 5
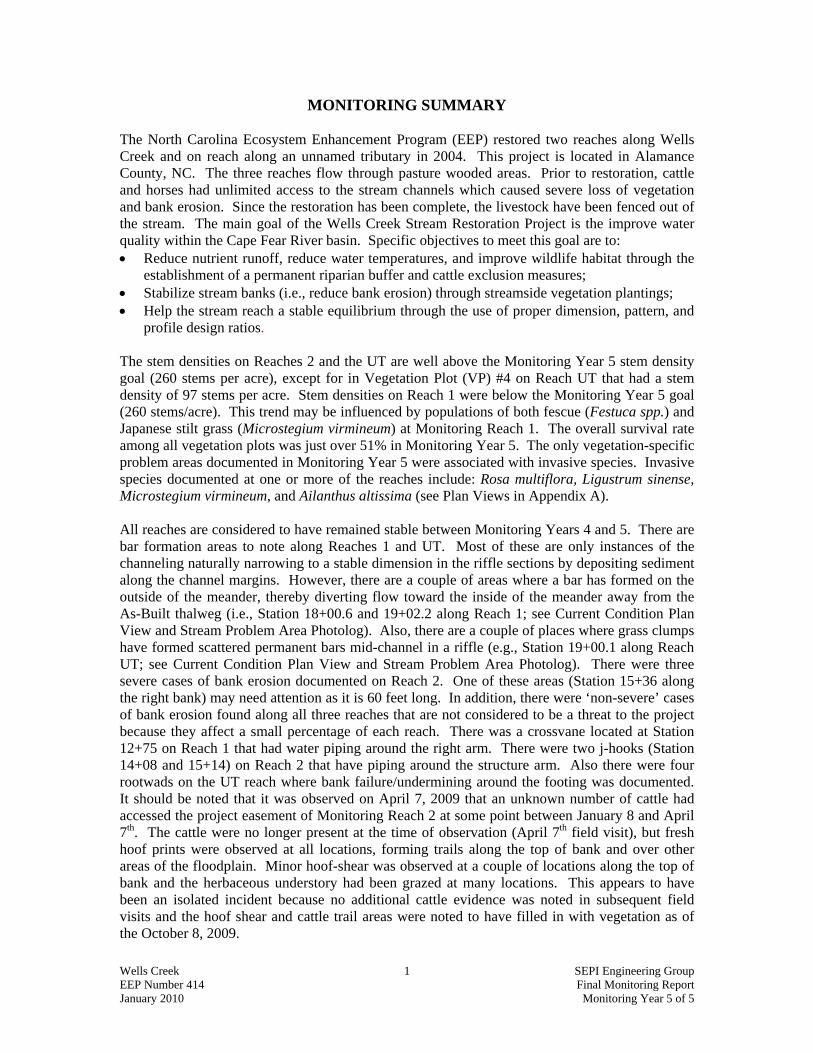
MONITORING SUMMARY The North Carolina Ecosystem Enhancement Program (EEP) restored two reaches along Wells Creek and on reach along an unnamed tributary in 2004. This project is located in Alamance County, NC. The three reaches flow through pasture wooded areas. Prior to restoration, cattle and horses had unlimited access to the stream channels which caused severe loss of vegetation and bank erosion. Since the restoration has been complete, the livestock have been fenced out of the stream. The main goal of the Wells Creek Stream Restoration Project is the improve water quality within the Cape Fear River basin. Specific objectives to meet this goal are to: • Reduce nutrient runoff, reduce water temperatures, and improve wildlife habitat through the
establishment of a permanent riparian buffer and cattle exclusion measures; • Stabilize stream banks (i.e., reduce bank erosion) through streamside vegetation plantings; • Help the stream reach a stable equilibrium through the use of proper dimension, pattern, and
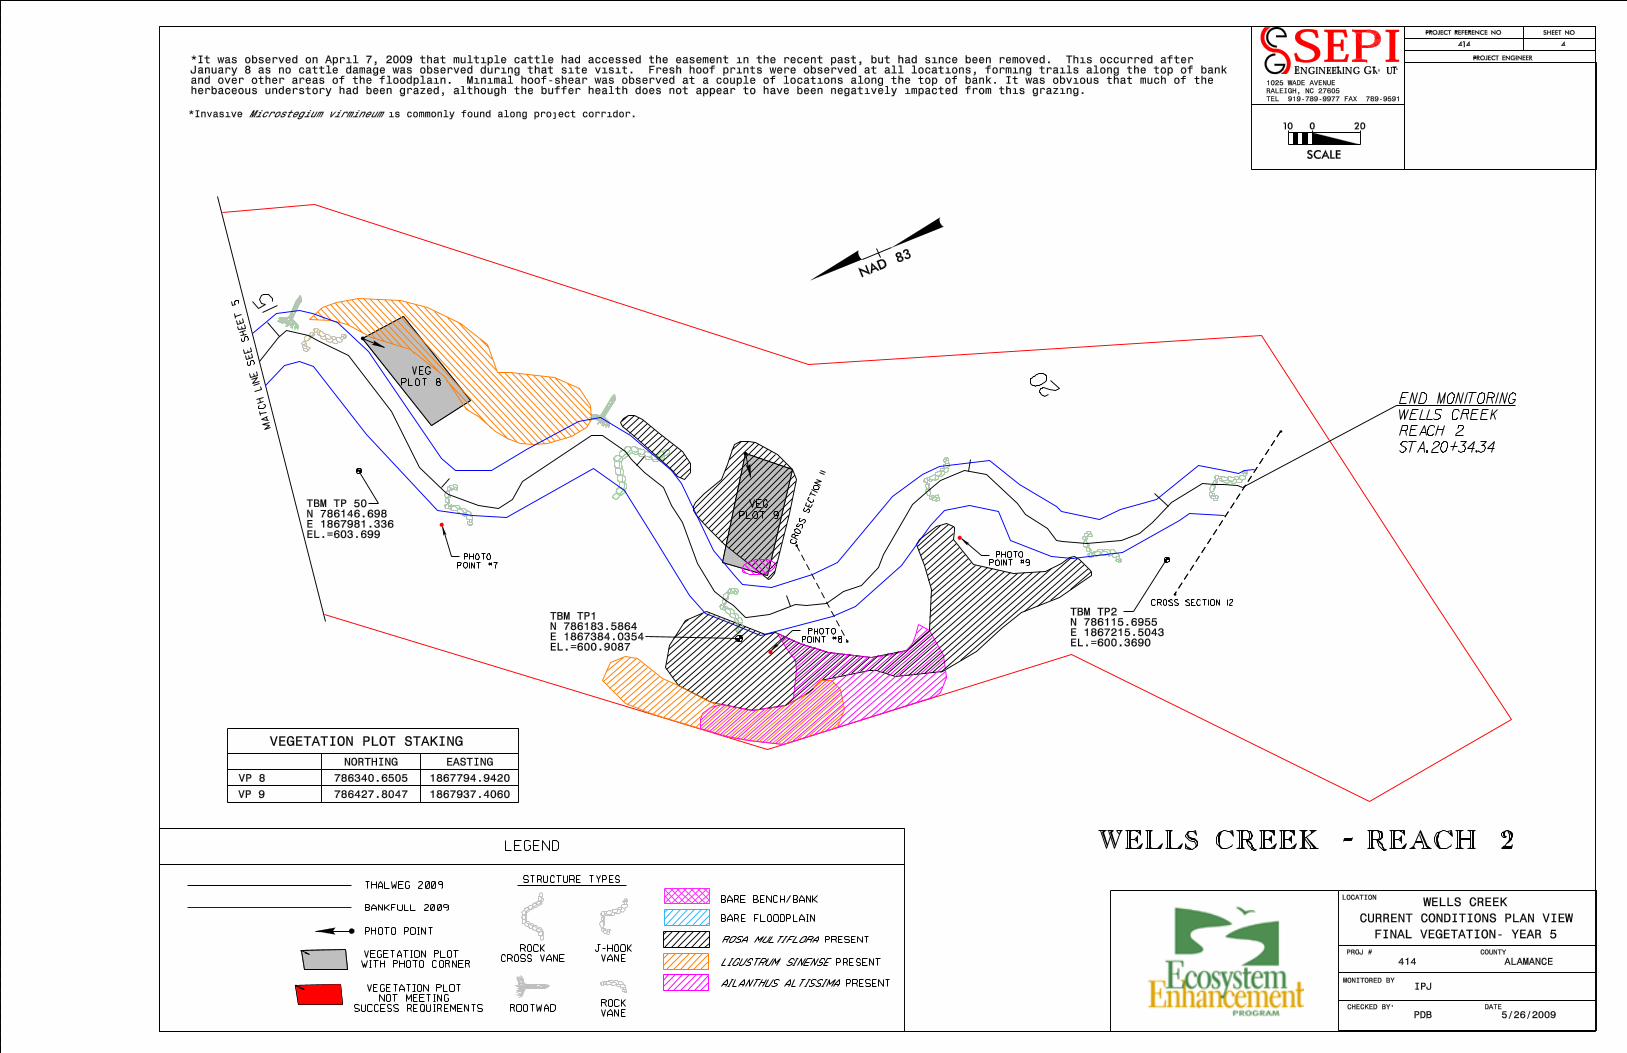
profile design ratios. The stem densities on Reaches 2 and the UT are well above the Monitoring Year 5 stem density goal (260 stems per acre), except for in Vegetation Plot (VP) #4 on Reach UT that had a stem density of 97 stems per acre. Stem densities on Reach 1 were below the Monitoring Year 5 goal (260 stems/acre). This trend may be influenced by populations of both fescue (Festuca spp.) and Japanese stilt grass (Microstegium virmineum) at Monitoring Reach 1. The overall survival rate among all vegetation plots was just over 51% in Monitoring Year 5. The only vegetation-specific problem areas documented in Monitoring Year 5 were associated with invasive species. Invasive species documented at one or more of the reaches include: Rosa multiflora, Ligustrum sinense, Microstegium virmineum, and Ailanthus altissima (see Plan Views in Appendix A). All reaches are considered to have remained stable between Monitoring Years 4 and 5. There are bar formation areas to note along Reaches 1 and UT. Most of these are only instances of the channeling naturally narrowing to a stable dimension in the riffle sections by depositing sediment along the channel margins. However, there are a couple of areas where a bar has formed on the outside of the meander, thereby diverting flow toward the inside of the meander away from the As-Built thalweg (i.e., Station 18+00.6 and 19+02.2 along Reach 1; see Current Condition Plan View and Stream Problem Area Photolog). Also, there are a couple of places where grass clumps have formed scattered permanent bars mid-channel in a riffle (e.g., Station 19+00.1 along Reach UT; see Current Condition Plan View and Stream Problem Area Photolog). There were three severe cases of bank erosion documented on Reach 2. One of these areas (Station 15+36 along the right bank) may need attention as it is 60 feet long. In addition, there were ‘non-severe’ cases of bank erosion found along all three reaches that are not considered to be a threat to the project because they affect a small percentage of each reach. There was a crossvane located at Station 12+75 on Reach 1 that had water piping around the right arm. There were two j-hooks (Station 14+08 and 15+14) on Reach 2 that have piping around the structure arm. Also there were four rootwads on the UT reach where bank failure/undermining around the footing was documented. It should be noted that it was observed on April 7, 2009 that an unknown number of cattle had accessed the project easement of Monitoring Reach 2 at some point between January 8 and April 7th. The cattle were no longer present at the time of observation (April 7th field visit), but fresh hoof prints were observed at all locations, forming trails along the top of bank and over other areas of the floodplain. Minor hoof-shear was observed at a couple of locations along the top of bank and the herbaceous understory had been grazed at many locations. This appears to have been an isolated incident because no additional cattle evidence was noted in subsequent field visits and the hoof shear and cattle trail areas were noted to have filled in with vegetation as of the October 8, 2009.
Wells Creek 1 SEPI Engineering Group EEP Number 414 Final Monitoring Report January 2010 Monitoring Year 5 of 5

Summary information/data related to the occurrence of items such as beaver or encroachment and statistics related to performance of various project and monitoring elements can be found in the tables and figures in the report appendices. Narrative background and supporting information formerly found in these reports can be found in the mitigation and restoration plan documents available on EEPs website. All raw data supporting the tables and figures in the appendices is available from EEP upon request.
Wells Creek 2 SEPI Engineering Group EEP Number 414 Final Monitoring Report January 2010 Monitoring Year 5 of 5

METHODOLOGY
Vegetation Methodology
For this monitoring project, a total of nine (9) plots were studied. Plot sizes measure 10 meters by 10 meters (or equivalent to 100 square meters) depending on buffer width. The vegetation monitoring was not the Carolina Vegetation Survey (CVS) protocol, but consisted of a count of the total number of planted stems having survived since Monitoring Year 4. The planted material in the plot (previously marked with flagging) was identified by species and a tally of each species was kept and recorded in a field book. Any stems for a given species in a given plot that were not flagged and were counted over and above the baseline total were considered volunteers.
Stream Methodology
The project monitoring for the stream channel included a longitudinal survey, cross-sectional surveys, pebble counts and photo documentation. These measurements were taken at each reach. The methodology for each portion of the stream monitoring is described in detail below.
Longitudinal Profile and Plan View
A longitudinal profile was surveyed for each reach with a Nikon DTM-520 Total Station, prism, and a TDS Recon Pocket PC. The heads of features (i.e. riffles, runs, pools, and glides) were surveyed, as well as the point of maximum depth of each pool, boundaries of problem areas, and any other significant slope-breaks or points of interest. At the head of each feature and at the maximum pool depth, thalweg, water surface, edge of water, left and right bankfull, and left and right top of bank were surveyed. All profile measurements were extracted from this survey, including channel and valley length and length of each feature, water surface slope for each reach and feature, bankfull slope for the reach, and pool-to-pool spacing. This survey also was used to draw plan view figures with Microstation v8 (Bentley Systems, Inc., Exton, PA) for each reach, and all pattern measurements (i.e. meander length, radius of curvature, belt width, meander width ratio, and sinuosity) were extracted from the plan view. Stationing was calculated along the thalweg.
Permanent Cross Sections
Four permanent cross sections (two riffles and two pools) were surveyed at each reach. The beginning and end of each permanent cross section were originally marked with a wooden stake. Cross sections were established perpendicular to the stream flow with station 0+00 feet located on the left bank. The survey noted all changes in slopes, tops of both banks, left and right bankfull, edges of water, thalweg and water surface. The cross sections were plotted, and Monitoring Year 5 data was overlain on all previous monitoring years for comparison. All dimension measurements (i.e., bankfull width, floodprone width, bankfull mean depth, cross sectional area, width-to-depth ratio, entrenchment ratio, bank height ratio, wetted perimeter, and hydraulic radius) were extracted from these plots for comparision with data from previous monitoring years.
Pebble Counts
A modified Wolman pebble count (Rosgen 1994), consisting of 50 samples, was taken at each permanent cross section. The cumulative percentages were plotted, and the D50 and D84 particle sizes were calculated and compared data from previous monitoring years.
Wells Creek 3 SEPI Engineering Group EEP Number 414 Final Monitoring Report January 2010 Monitoring Year 5 of 5

Photo Documentation
Permanent photo points were established during Monitoring Year 1. A set of three photographs (facing upstream, downstream, and facing the channel) were taken at each photo point with a digital camera. Two photographs were taken at each cross-section (facing upstream and downstream). A representative photograph of each vegetation plot was taken at the designated corner of the vegetation plot and in the same direction as the Monitoring Year 1 photograph. An arrow was placed on the designated corner of each vegetation plot on the plan view sheets to document the corner and direction of each photograph. Photos were also taken of all significant stream and vegetation problem areas.
Wells Creek 4 SEPI Engineering Group EEP Number 414 Final Monitoring Report January 2010 Monitoring Year 5 of 5

Wells Creek 5 SEPI Engineering Group EEP Number 414 Final Monitoring Report January 2010 Monitoring Year 5 of 5
REFERENCES ARCADIS G&M of North Carolina, Inc (ARCADIS). September 2004. Mitigation Plan, Wells Creek at
Syndor Property. ARCADIS G&M of North Carolina, Inc (ARCADIS). December 2005. Year One Monitoring Report,
Wells Creek at Syndor Property. DeLorme. 1997. The North Carolina Atlas and Gazateer. Harman, W.H., et al. 1999. Bankfull Hydraulic Geometry Relationships for North Carolina Streams.
AWRA Wildland Hydrology Symposium Proceedings. Edited by D.S. Olson and J.P. Potyondy. AWRA Summer Synposium. Bozeman, MT.
North Carolina Ecosystem Enhancement Program. November 2006. Content, Format and Data
Requirements for EEP Monitoring Reports, Version 1.2. Rosgen, D.L. 1994. A Classification of Natural Rivers. Catena 22: 166-169. SEPI Engineering Group. 2006. Wells Creek Final Monitoring Report, Year 2 of 5. SEPI Engineering Group. 2007. Wells Creek Final Monitoring Report, Year 3 of 5. SEPI Engineering Group. 2008. Wells Creek Final Monitoring Report, Year 4 of 5. U.S. Department of Agriculture, Soil Conversation Service. April 1960. Soil Survey Alamance County,
North Carolina. U.S. Department of Army, Corps of Engineers. 2003. Stream Mitigation Guidelines.
http://www.saw.usace.army.mil/wetlands/Mitigation/stream_mitigation.html

APPENDIX A
GENERAL FIGURES AND PLAN VIEWS


APPENDIX B
GENERAL PROJECT TABLES

B-1
Table I. Project Restoration Components
Wells Creek/EEP Project Number 414
Proj
ect
Segm
ent
or R
each
ID
Typ
e
App
roac
h
As-
Bui
lt Fo
otag
e*
As-
Bui
lt St
atio
ning
R 17+10 – 26+00
Reach 1 EI PI, PII, and PIII** 3,006 26+00 – 47+16
Reach 2 R PI, PII, and PIII** 1,244 11+06 – 23+50
Unnamed Tributary R PI, PII, and PIII** 1,493 11+52 - 26+45 *Reach lengths are longer than previously because earlier reports listed only lengths surveyed during
monitoring data collection rather than the entire constructed lengths.
Table II. Project Activity and Reporting History Wells Creek/EEP Project Number 414
Activity or Report
Scheduled Completio
n
Data Collectio
n Complet
e Actual Completion or
Delivery
Restoration Plan August 1, 2002
Final Design - 90% unknown
Construction August 2003-April 2004
Temporary S&E mix applies to entire project area August 2003-April 2004
Permanent seed mix applies to reach/segments 1&2 August 2003-April 2005
Containerized and B&B plantings for reach/segments 1&2
August 2003-April 2006
Mitigation Plan/ As-built (Year 0 Monitoring - baseline) Dec-04
December 2004/July 2004
Year 1 monitoring Sep-05
Year 2 monitoring Apr-06 Nov-06
Year 3 monitoring Oct-07 Dec-07
Year 4 monitoring Apr-08 Nov-08 December 15, 2008
Year 5 monitoring Apr-09 Oct-09 November 15, 2009

Table III. Project Contact Table Wells Creek/EEP Project Number 414
Designer ARCADIS G&M of North Carolina 801 Corporate Center Drive, Suite 300 Raleigh, NC 27607
Construction Contractor A&D Environmental and Industrial Services, Inc. Gerald Walker 2718 Uwharrie Road Archdale, NC 27263 336-434-7750
Planting Contractor Seal Brothers Contracting Eddie Tobler PO BOX 86 Dobson, NC 27017 336-786-8863
Seeding Contractor A&D Environmental and Industrial Services, Inc. Gerald Walker 2718 Uwharrie Road Archdale, NC 27263 336-434-7750
2005 Monitoring Performers ARCADIS G&M of North Carolina 801 Corporate Center Drive, Suite 300 Raleigh, NC 27607
2006 - 2009 Monitoring Performers
SEPI Engineering Group 1025 Wade Avenue Raleigh, NC 27605 Phillip Todd (919) 789-9977
Stream Monitoring POC Ira Poplar-Jeffers (919) 573-9914 Vegetation Monitoring POC Phil Beach (919) 573-9936 Wetland Monitoring POC N/A
Table IV. Project Background Table Wells Creek/EEP Project Number 414
Project County Alamance
Drainage Area
Reach 1: 1.63 sq mi Reach 2: 2.23 sq mi and UT: 0.71 sq. mi
Drainage impervious cover estimate (%) For example Wells Creek Reach 1 & 2 ~3%; Unnamed Tributary <1% Stream Order Wells Creek Reach 1: 2nd Order Wells Creek Reach 2: 3rd Order Unnamed Tributary: 1st Order Physiographic Region Piedmont Ecoregion Southern Outer Piedmont Carolina Slate Belt Rosgen Classification of As-built C 4/1 Cowardin Classification Disturbed Cattle Pasture
Dominant soil types Colfax, Lignum, Georgeville, Tarrus, Herndon, Local Alluvial Land, and Vance
Reference site ID UT to Wells Creek, Cane Creek Mountains, Alamance County and UT to Varnals Creek
USGS HUC for Project and Reference 03030002 Haw River NCDWQ Sub-basin for Project and Reference 03-06-04 NCDWQ classification for Project and Reference Project and reference are Class C, NSW Any portion of any project segment 303d listed? No Any portion of any project segment upstream of a 303d listed segment? No Reasons for 303d listing or stressor N/A % of project easement fenced 100% % of project easement demarcated with bollards (if fencing absent) NA
B-2

APPENDIX C
VEGETATION ASSESSMENT DATA
TractVegetation
Plot IDVegetation Survival Threshold
Met?Tract Mean (Stems
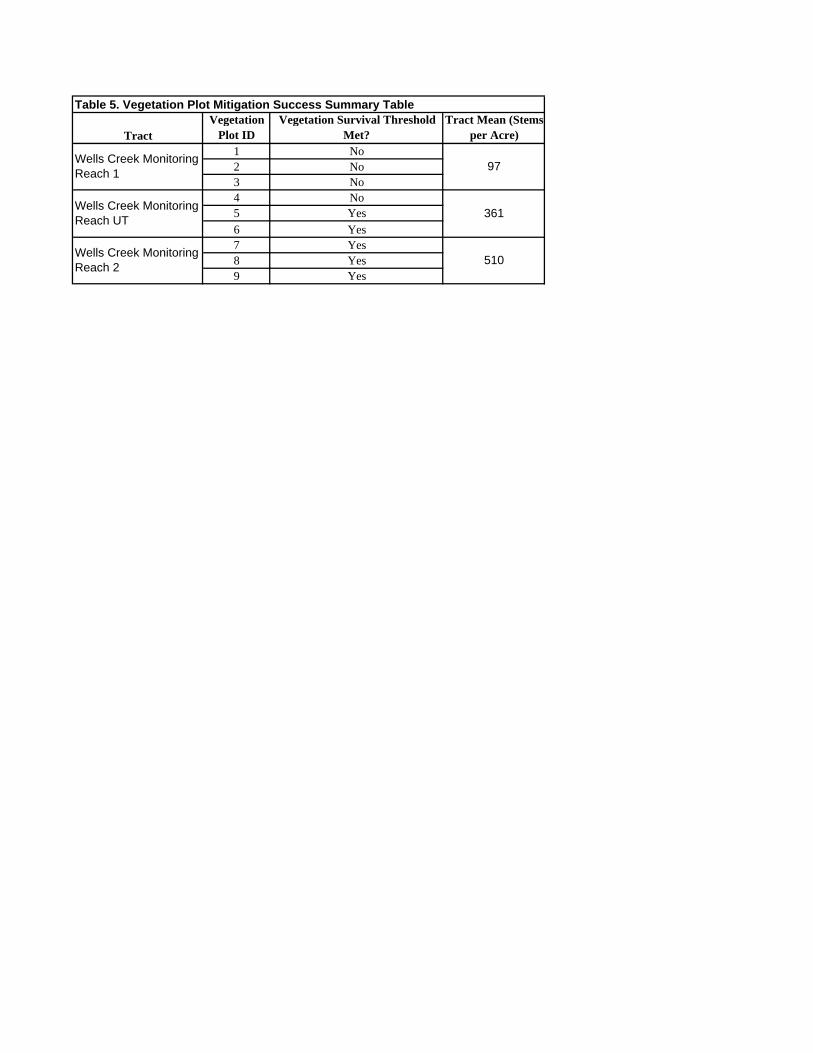
per Acre)1 No2 No3 No4 No5 Yes6 Yes7 Yes8 Yes9 Yes
Table 5. Vegetation Plot Mitigation Success Summary Table
510
Wells Creek Monitoring Reach 1
Wells Creek Monitoring Reach UT
Wells Creek Monitoring Reach 2
97
361
Monitoring Year 4 Appendix C Vegetation Plots – Wells Creek
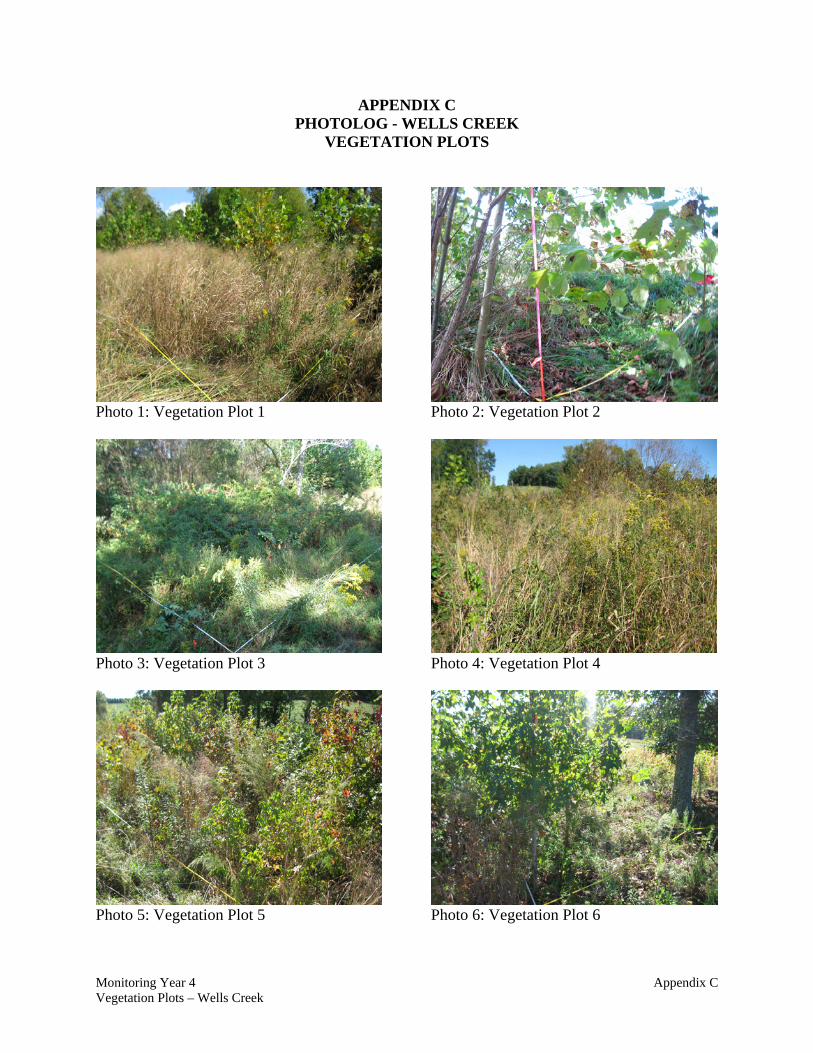
APPENDIX C PHOTOLOG - WELLS CREEK
VEGETATION PLOTS
Photo 1: Vegetation Plot 1
Photo 3: Vegetation Plot 3
Photo 5: Vegetation Plot 5
Photo 2: Vegetation Plot 2
Photo 4: Vegetation Plot 4
Photo 6: Vegetation Plot 6

Monitoring Year 4 Appendix C Vegetation Plots – Wells Creek
Photo 7: Vegetation Plot 7
Photo 9: Vegetation Plot 9
Photo 8: Vegetation Plot 8

1 2 3 4 5 6 7 8 9ShrubsCornus ammomum 2 1 (7 LS) (1 LS) 11 (12 LS) 4 (13 LS) 3 (11 LS) 3 (8 LS) 3 (7 LS) 47.8%TreesBetula nigra 2 2 1 10 9 9 5 5 50.0%Carpinus caroliniana 3 2 2 11 10 8 8 7 63.6%Diospyros virginiana 0 2 0 0 0 0.0%Fraxinus pennsylvanica 2 3 2 6 3 5 5 83.0%Juglans nigra 1 2 12 13 10 4 3 25.0%Nyssa sylvatica 1 0 0 0 0 0.0%Platanus occidentalis 1 1 1 3 1 3 22 16 16 10 10 45.5%Salix nigra 13 13 17 17 16 13 100.0%Sambucus canandensis
1 0 0 0 0 0.0%Quercus michauxii 1 3 1 16 9 6 5 5 31.3%Quercus rubra 2 2 0 0 0 0.0%Quercus alba
1 1 5 4 4 2 2 40.0%Quercus marilandica 1 1 0 0 0 0.0%
Total including live stake 1 2 3 2 13 8 19 7 6 119 102 87 61 61 51.3%Stems per acre 48 97 145 90 665 366 895 347 283Total exluding live stake 1 2 3 2 6 8 19 7 5 107 89 76 53 53 49.5%Stems per acre 48 97 145 90 307 366 895 346 236Note: Survival was calculated between Monitoring Year 1 and Monitoring Year 5 totals.
* Liquidambar styraciflua were too numerous to count where new volunteers were noted.
*Volunteers of the following species, not initially recorded as planted, were counted: Ailanthus altissima (VP 2,9), Acer rubrum (VP 1,5,6,8), Betula nigra (VP 4,5,6,7,8,9), Carpinus caroliniana (VP 5), Cephalanthus occidentalis (VP 1,6), Cercis canadensis (VP 5), Cornus amomum (VP 3,4,8), Diospyros virginiana (VP 5,9), Fraxinus americana (VP 3,6,7,9), Juglans nigra (VP 7,8,9), Liquidambar styraciflua (VP 1,3,4,5,6,7,8,9), Liriodendron tulipifera (VP 5,6), Platanus occidentalis (VP 1,2,5,6,9), Quercus alba (VP 1,2,5), Quercus michauxii (VP 4 5 7 8 9) and Quercus rubra (VP 5)
Table VII. Stem counts for each species arranged by plot (Wells Creek)Survival
%Plots Year 3
TotalsSpecies Year 1
TotalsYear 2 Totals
Year 4 Totals
Year 5 Totals

APPENDIX D
STREAM ASSESSMENT DATA

Monitoring Year 5 Appendix D Photolog – Cross-Sections & Photo Points – Reach 2
APPENDIX D PHOTOLOG WELLS CREEK (REACH 2)
CROSS-SECTIONS & PHOTOPOINTS
Cross-Section 9: View Downstream (5-12-2009).
Cross-Section 10: View Downstream (5-12-2009).
Cross-Section 11: View Downstream (5-12-2009).
Cross-Section 9: View Upstream (5-12-2009).
Cross-Section 10: View Upstream (5-12-2009).
Cross-Section 11: View Upstream (5-12-2009).

Monitoring Year 5 Appendix D Photolog – Cross-Sections & Photo Points – Reach 2
Cross-Section 12: View Downstream (5-12-2009).
Cross-Section 12: View Upstream (5-12-2009).
Photo point 5: View Downstream (5-12-2009).
Photo point 5: View Upstream (5-12-2009).
Photo point 5: Facing Channel (5-12-2009).

Monitoring Year 5 Appendix D Photolog – Cross-Sections & Photo Points – Reach 2
Photo point 6: View Downstream (5-12-2009).
Photo point 6: View Upstream (5-12-2009).
Photo point 6: Facing Channel (5-12-2009).
Photo point 7: View Downstream (5-12-2009).
Photo point 7: View Upstream (5-12-2009).
Photo point 7: Facing Channel (5-12-2009).

Monitoring Year 5 Appendix D Photolog – Cross-Sections & Photo Points – Reach 2
Photo point 8: View Downstream (5-12-2009).
Photo point 8: View Upstream (5-12-2009).
Photo point 8: Facing Channel (5-12-2009).
Photo point 9: View Downstream (10-8-2009).
Photo point 9: View Upstream (10-8-2009).
Photo point 9: Facing Channel (10-8-2009).

APPENDIX D PHOTOLOG – WELLS CREEK (REACH 1)
CROSS-SECTIONS & PHOTOPOINTS
Cross-Section 1: View Downstream (3-12-2009).
Cross-Section 2: View Downstream (3-12-2009).
Cross-Section 3: View Downstream (3-18-2009).
Cross-Section 1: View Upstream (3-12-2009).
Cross-Section 2: View Upstream (3-12-2009).
Cross-Section 3: View Upstream (3-18-2009).
Monitoring Year 5 Appendix D Photolog – Cross-Sections & Photopoints (Reach 1)

Cross-Section 4: View Downstream (3-18-2009).
Cross-Section 4: View Upstream (11-6-2008).
Monitoring Year 5 Appendix D Photolog – Cross-Sections & Photopoints (Reach 1)

Photo point 1: View Upstream (3-12-2009).
Photo point 1: View Downstream (3-12-2009).
Photo point 1: Facing Channel (3-12-2009).
Photo point 2: View Upstream (3-12-2009).
Photo point 2: View Downstream (3-12-2009).
Photo point 2: Facing Channel (3-12-2009).
Monitoring Year 5 Appendix D Photolog – Cross-Sections & Photopoints (Reach 1)

Photo point 3: View Upstream (3-18-2009).
Photo point 3: View Downstream (3-18-2009).
Photo point 3: Facing Channel (3-18-2009).
Photo point 4: View Upstream (3-18-2009).
Photo point 4: View Downstream (3-18-2009).
Photo point 4: Facing Channel (3-18-2009).
Monitoring Year 5 Appendix DPhotolog – Cross-Sections & Photopoints (Reach 1)

Monitoring Year 5 Appendix D Photolog – Cross-Sections & Photo Points – UT Wells
APPENDIX D PHOTOLOG WELLS CREEK (UT)
CROSS SECTIONS AND PHOTO POINTS
Cross-Section 5: View Downstream (3-24-2009).
Cross-Section 6: View Downstream (3-24-2009).
Cross-Section 7: View Downstream (3-25-2009).
Cross-Section 5: View Upstream (3-24-2009).
Cross-Section 6: View Upstream (3-24-2009).
Cross-Section 7: View Upstream (3-25-2009).

Monitoring Year 5 Appendix D Photolog – Cross-Sections & Photo Points – UT Wells
Cross-Section 8: View Downstream (3-25-2009).
Cross-Section 8: View Upstream (3-25-2009).
Monitoring Year 5 Appendix D Photolog – Cross-Sections & Photo Points – UT Wells
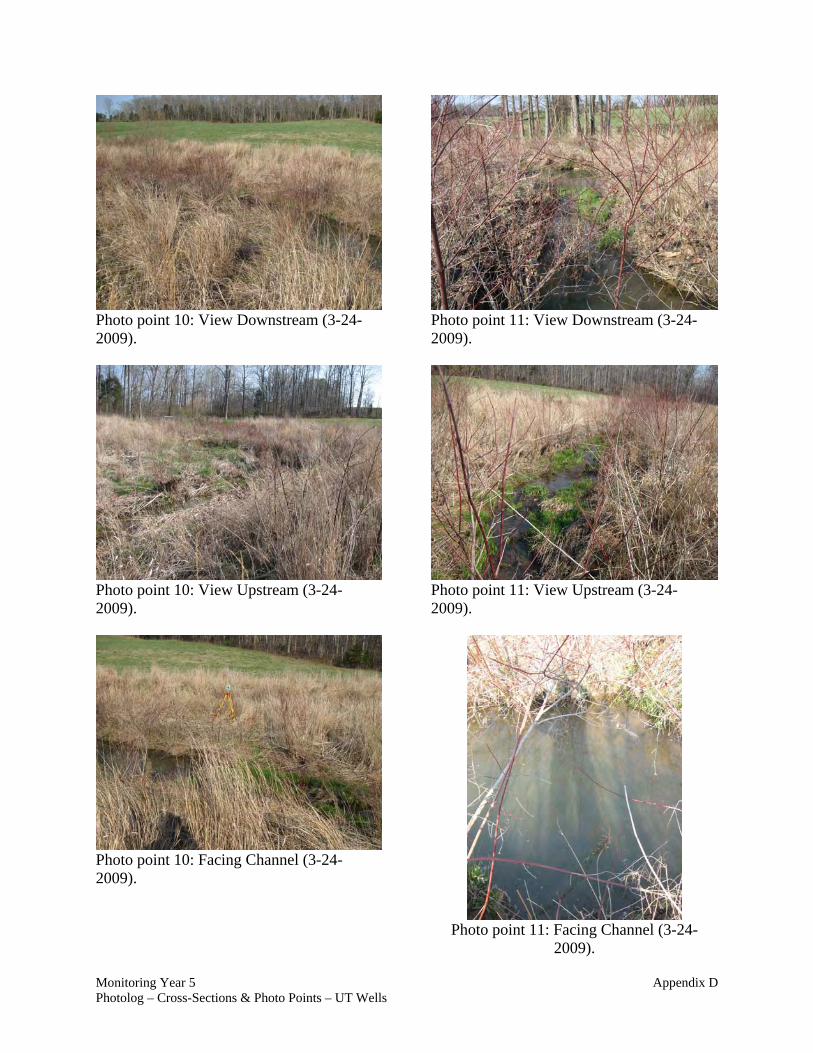
Photo point 10: View Downstream (3-24-2009).
Photo point 10: View Upstream (3-24-2009).
Photo point 10: Facing Channel (3-24-2009).
Photo point 11: View Downstream (3-24-2009).
Photo point 11: View Upstream (3-24-2009).
Photo point 11: Facing Channel (3-24-
2009).

Monitoring Year 5 Appendix D Photolog – Cross-Sections & Photo Points – UT Wells
Photo point 12: View Downstream (3-24-2009).
Photo point 12: View Upstream (3-24-2009).
Photo point 12: Facing Channel (3-24-
2009).
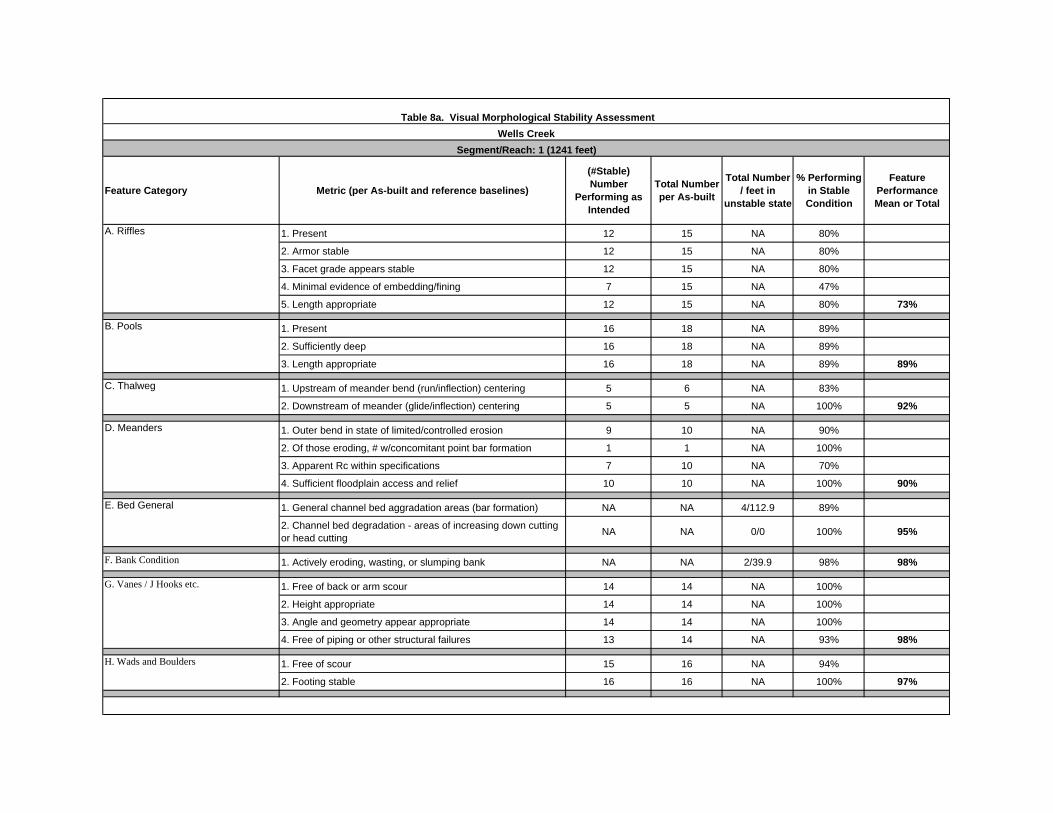
Feature Category Metric (per As-built and reference baselines)
(#Stable) Number
Performing as Intended
Total Number per As-built
Total Number / feet in
unstable state
% Performing in Stable Condition
Feature Performance Mean or Total
1. Present 12 15 NA 80%
2. Armor stable 12 15 NA 80%
3. Facet grade appears stable 12 15 NA 80%
4. Minimal evidence of embedding/fining 7 15 NA 47%
5. Length appropriate 12 15 NA 80% 73%
1. Present 16 18 NA 89%
2. Sufficiently deep 16 18 NA 89%
3. Length appropriate 16 18 NA 89% 89%
1. Upstream of meander bend (run/inflection) centering 5 6 NA 83%
2. Downstream of meander (glide/inflection) centering 5 5 NA 100% 92%
1. Outer bend in state of limited/controlled erosion 9 10 NA 90%
2. Of those eroding, # w/concomitant point bar formation 1 1 NA 100%
3. Apparent Rc within specifications 7 10 NA 70%
4. Sufficient floodplain access and relief 10 10 NA 100% 90%
1. General channel bed aggradation areas (bar formation) NA NA 4/112.9 89%
2. Channel bed degradation - areas of increasing down cutting or head cutting NA NA 0/0 100% 95%
F. Bank Condition 1. Actively eroding, wasting, or slumping bank NA NA 2/39.9 98% 98%
1. Free of back or arm scour 14 14 NA 100%
2. Height appropriate 14 14 NA 100%
3. Angle and geometry appear appropriate 14 14 NA 100%
4. Free of piping or other structural failures 13 14 NA 93% 98%
1. Free of scour 15 16 NA 94%
2. Footing stable 16 16 NA 100% 97%
D. Meanders
Table 8a. Visual Morphological Stability AssessmentWells Creek
Segment/Reach: 1 (1241 feet)
A. Riffles
B. Pools
C. Thalweg
E. Bed General
G. Vanes / J Hooks etc.
H. Wads and Boulders

Feature Category Metric (per As-built and reference baselines)
(#Stable) Number
Performing as Intended
Total Number per As-built
Total Number / feet in
unstable state
% Performing in Stable Condition
Feature Performance Mean or Total
1. Present 10 10 NA 100%
2. Armor stable 10 10 NA 100%
3. Facet grade appears stable 9 10 NA 90%
4. Minimal evidence of embedding/fining 10 10 NA 100%
5. Length appropriate 6 10 NA 60% 90%
1. Present 12 13 NA 92%
2. Sufficiently deep 12 13 NA 92%
3. Length appropriate 11 13 NA 85% 90%
1. Upstream of meander bend (run/inflection) centering 6 6 NA 100%
2. Downstream of meander (glide/inflection) centering 5 5 NA 100% 100%
1. Outer bend in state of limited/controlled erosion 6 10 NA 60%
2. Of those eroding, # w/concomitant point bar formation 2 4 NA 50%
3. Apparent Rc within specifications 9 10 NA 90%
4. Sufficient floodplain access and relief 10 10 NA 100% 75%
1. General channel bed aggradation areas (bar formation) NA NA 0/0 100%
2. Channel bed degradation - areas of increasing down cutting or head cutting NA NA 0/0 100% 100%
F. Bank Condition 1. Actively eroding, wasting, or slumping bank NA NA 11/162.7 92% 92%
1. Free of back or arm scour 11 13 NA 85%
2. Height appropriate 13 13 NA 100%
3. Angle and geometry appear appropriate 11 13 NA 85%
4. Free of piping or other structural failures 11 13 NA 85% 88%
1. Free of scour 4 6 NA 67%
2. Footing stable 6 6 NA 100% 83%
Table 8b. Visual Morphological Stability AssessmentWells Creek
Segment/Reach: 2 (1153 feet)
A. Riffles
B. Pools
C. Thalweg
E. Bed General
G. Vanes / J Hooks etc.
H. Wads and Boulders
D. Meanders

Feature Category Metric (per As-built and reference baselines)
(#Stable) Number
Performing as Intended
Total Number per As-built
Total Number / feet in
unstable state
% Performing in Stable Condition
Feature Performance Mean or Total
1. Present 15 15 NA 100%
2. Armor stable 15 15 NA 100%
3. Facet grade appears stable 12 15 NA 80%
4. Minimal evidence of embedding/fining 12 15 NA 80%
5. Length appropriate 12 15 NA 80% 88%
1. Present 17 17 NA 100%
2. Sufficiently deep 17 17 NA 100%
3. Length appropriate 16 17 NA 94% 98%
1. Upstream of meander bend (run/inflection) centering 6 6 NA 100%
2. Downstream of meander (glide/inflection) centering 6 6 NA 100% 100%
1. Outer bend in state of limited/controlled erosion 12 13 NA 92%
2. Of those eroding, # w/concomitant point bar formation 1 1 NA 100%
3. Apparent Rc within specifications 10 11 NA 91%
4. Sufficient floodplain access and relief 13 13 NA 100% 96%
1. General channel bed aggradation areas (bar formation) NA NA 5/93.1 91%
2. Channel bed degradation - areas of increasing down cutting or head cutting NA NA 0/0 100% 96%
F. Bank Condition 1. Actively eroding, wasting, or slumping bank NA NA 3/24.5 99% 99%
1. Free of back or arm scour 13 13 NA 100%
2. Height appropriate 13 13 NA 100%
3. Angle and geometry appear appropriate 12 13 NA 92%
4. Free of piping or other structural failures 13 13 NA 100% 98%
1. Free of scour 13 16 NA 81%
2. Footing stable 13 16 NA 81% 81%
D. Meanders
Table 8c. Visual Morphological Stability AssessmentWells Creek
Segment/Reach: UT (1013 feet)
A. Riffles
B. Pools
C. Thalweg
E. Bed General
G. Vanes / J Hooks etc.
H. Wads and Boulders

Date of Data Collection
Date of Occurrence
Method Photo # (if available)
7/19/2006 Unknown Bankfull event recorded: evident by crest stage gauge (0.6” wet on the measuring stick). no photo
1/19/2007 Unknown Bankfull event recorded: evident by crest stage gauge (7.0” wet on the measuring stick). no photo
4/5/2007 Unknown Crest gauge reading of 4.75 inches over bankfull (located at 0.00 inches on gauge). no photo
6/4/2007 6/3/2007 Bankfull event observed as a result of ~1.5 inch rainfall event. Wrack lines noted. no photo
2/1/2008 Unknown Crest gauge reading of 5.0 inches over bankfull (located at 0.00 inches on gauge). Wrack lines noted. no photo
9/1/20088/27/2008 - 8/28/2008
According to NCDC Station Coop ID 313555 - Graham ENE, NC , 6.58 inches of precipitation fell on this day. It was assumed, but not verified, that this rainfall produced a bankfull event. no photo
9/8/2008 Unknown
Bankfull evidence found on 9/8/2008. Actual date of storm event unknown. Note wrack lines located above the top of bank elevation in photo.
Photo 6 in Monitoring Year 4 SR-1 SPA Photolog
3/12/2009 Unknown
Bankfull evidence found on 3/12/2009. Actual date of storm event unknown. Note wrack lines located at left of center in photo.
Photo 5 in Monitoring Year 5 SR-1 SPA Photolog
Table 9. Verification of Bankfull Events

Cross Section Overlay (Years 0 - 5)Wells Creek - Reach 1
Cross Section #1 (Pool)
630
631
632
633
634
635
636
637
638
639
640
641
642
643
644
645
646
647
648
649
650
651
652
653
654
655
656
657
658
659
660
661
662
663
664
0 10 20 30 40 50 60 70 80 90 100 110Distance (feet)
Elev
atio
n (fe
et)
Year 1 (7-28-2005)Year 2 (5-18-2006)Year 3 (4-11-2007)Year 4 (3-20-2008)Year 5 (3-18-2009)As-Built (6-14-2004)
Bankfull

Cross Section Overlay (Years 0 - 5)Wells Creek - Reach 1
Cross Section #2 (Riffle)
630631632633634635636637638639640641642643644645646647648649650651652653654655656657658659660
0 10 20 30 40 50 60 70 80 90Distance (feet)
Elev
atio
n (fe
et)
Year 1 (7-28-2005)Year 2 (5-18-2006)Year 3 (4-11-2007)Year 4 (3-20-2008)Year 5 (3-18-2009)As-Built (6-14-2004)
Bankfull

Cross Section Overlay (Years 0 - 5)Wells Creek - Reach 1
Cross Section #3 (Riffle)
625626627628629630631632633634635636637638639640641642643644645646647648649650651652653654655656657658659660
0 10 20 30 40 50 60 70 80 90 100 110Distance (feet)
Elev
atio
n (fe
et)
Year 1 (7-28-2005)Year 2 (5-18-2006)Year 3 (4-11-2007)Year 4 (3-20-2008)Year 5 (3-18-2009)As-Built (6-14-2004)
Bankfull

Cross Section Overlay (Years 0 - 5)Well Creek - Reach 1
Cross Section #4 (Pool)
628629630631632633634635636637638639640641642643644645646647648649650651652653654655656657658659660
0 10 20 30 40 50 60 70 80 90 100Distance (feet)
Elev
atio
n (fe
et)
Year 1 (7-28-2005)Year 2 (5-18-2006)Year 3 (4-11-2007)Year 4 (3-20-2008)Year 5 (3-18-2009)As-Built (6-14-2004)
Bankfull

Cross Section Overlay (Years 0 - 5)Well Creek - Reach UT
Cross Section #5 (Pool)
592593594595596597598599600601602603604605606607608609610611612613614615616617618619620
0 5 10 15 20 25 30 35 40 45 50 55 60 65 70 75 80 85 90Distance (feet)
Elev
atio
n (fe
et)
Year 1 (7-19-2005)Year 2 (5-04-2006)Year 3 (5-02-2007)Year 4 (6-12-2008)Year 5 (3-25-2009)As-Built (6-14-2004)
Bankfull

Cross Section Overlay (Years 0 - 5)Well Creek - Reach UT
Cross Section #6 (Riffle)
590591592593594595596597598599600601602603604605606607608609610611612613614615616617618619620
0 5 10 15 20 25 30 35 40 45 50 55 60 65 70 75 80 85 90Distance (feet)
Elev
atio
n (fe
et)
Year 1 (7-19-2005)Year 2 (5-04-2006)Year 3 (5-02-2007)Year 4 (6-12-2008)Year 5 (3-25-2009)As-Built (6-14-2004)
Bankfull

Cross Section Overlay (Years 0, 2 - 5)Well Creek - Reach UT
Cross Section #7 (Riffle)
590
591
592
593
594
595
596
597
598
599
600
601
602
603
604
605
606
607
608
609
610
611
612
613
614
615
616
617
0 5 10 15 20 25 30 35 40 45 50 55 60 65 70 75 80Distance (feet)
Elev
atio
n (fe
et)
Year 2 (5-04-2006)Year 3 (5-02-2007)Year 4 (6-12-2008)Year 5 (3-25-2009)As-Built (6-14-2004)
Bankfull

Cross Section Overlay (Years 0, 2 - 5)Well Creek - Reach UT
Cross Section #8 (Pool)
590
591
592
593
594
595
596
597
598
599
600
601
602
603
604
605
606
607
608
609
610
0 5 10 15 20 25 30 35 40 45 50 55 60Distance (feet)
Elev
atio
n (fe
et)
Year 2 (5-04-2006)Year 3 (5-02-2007)Year 4 (6-12-2008)Year 5 (3-25-2009)As-Built (6-14-2004)
Bankfull

Cross Section Overlay (Years 0 - 5)Well Creek - Reach 2
Cross Section #9 (Riffle)
596
597
598
599
600
601
602
603
604
605
606
607
608
609
610
611
0 5 10 15 20 25 30 35 40 45Distance (feet)
Elev
atio
n (fe
et)
Year 1 (7-28-2005)Year 2 (5-22-2006)Year 3 (5-10-2007)Year 4 (6-19-2008)Year 5 (5-12-2009)As-Built (6-14-2004)
Bankfull

Cross Section Overlay (Years 0 - 5)Well Creek - Reach 2
Cross Section #10 (Pool)
594
595
596
597
598
599
600
601
602
603
604
605
606
607
608
609
0 5 10 15 20 25 30 35 40 45
Distance (feet)
Elev
atio
n (fe
et)
Year 1 (7-28-2005)Year 2 (5-22-2006)Year 3 (5-10-2007)Year 4 (6-19-2008)Year 5 (5-12-2009)As-Built (6-14-2004)
Bankfull

Cross Section Overlay (Years 0 - 5)Well Creek - Reach 2
Cross Section #11 (Riffle)
593
594
595
596
597
598
599
600
601
602
603
604
605
606
607
608
0 5 10 15 20 25 30 35 40 45 50Distance (feet)
Elev
atio
n (fe
et)
Year 1 (7-28-2005)Year 2 (5-22-2006)Year 3 (5-10-2007)Year 4 (6-19-2008)Year 5 (5-12-2009)As-Built (6-14-2004)
Bankfull

Cross Section Overlay (Years 0 - 5)Well Creek - Reach 2
Cross Section #12 (Pool)
585
586
587
588
589
590
591
592
593
594
595
596
597
598
599
600
601
602
603
604
605
606
607
608
609
610
611
0 10 20 30 40 50 60 70 80
Distance (feet)
Elev
atio
n (fe
et)
Year 1 (7-28-2005)Year 2 (5-22-2006)Year 3 (5-10-2007)Year 4 (6-19-2008)Year 5 (5-12-2009)As-Built (6-14-2004)
Bankfull

Longitudinal Profile Overlay (Years 0-5)Wells Creek - Reach 1
637
638
639
640
641
642
643
644
645
646
647
648
0 50 100
150
200
250
300
350
400
450
500
550
600
650
700
750
800
850
900
950
1000
1050
1100
Channel Distance (feet)
Elev
atio
n (fe
et)
Thalweg Year 1 (7-28-2005) Thalweg Year 2 (5-18-2006) Thalweg Year 3 (4-11-2007) Thalweg Year 4 (3-20-2008) Thalweg Year 5 (3-18-2009)Water Surface Year 5 Left Bankfull Year 5 Right Bankfull Year 5 Crossvane J-hookRootwad Single Vane Thalweg As-Built (6-14-2004)

Longitudinal Profile Overlay (Years 0-5)Wells Creek - Reach 2
594
595
596
597
598
599
600
601
602
603
604
605
606
607
0 50 100
150
200
250
300
350
400
450
500
550
600
650
700
750
800
850
900
950
1000
1050
Channel Distance (feet)
Elev
atio
n (fe
et)
Thalweg Year 1 (7-28-2005) Thalweg Year 2 (5-22-2006) Thalweg Year 3 (5-10-2007)Thalweg Year 4 (6-19-2008) Thalweg Year 5 (5-12-2009) Water Surface Year 5Left Bankfull Year 5 Right Bankfull Year 5 CrossvaneJ-hook Rootwad Thalweg As-Built (6-14-2004)

Longitudinal Profile Overlay (Years 0-5)Wells Creek - Reach UT
597
598
599
600
601
602
603
604
605
606
607
0 50 100
150
200
250
300
350
400
450
500
550
600
650
700
750
800
850
900
950
1000
1050
Channel Distance (feet)
Elev
atio
n (fe
et)
Thalweg Year 1 (7-19-2005) Thalweg Year 2 (5-04-2006) Thalweg Year 3 (5-02-2007) Thalweg Year 4 (6-12-2008)Thalweg Year 5 (3-25-2009) Water Surface Year 5 Left Bankfull Year 5 Right Bankfull Year 5Crossvane J-hook Rootwad As-Built (6-14-2004)

PEBBLE COUNTSite: Wells Creek
Party: IPJ & PDB
Date: 10/7/09 PARTICLE COUNTCS 1
Inches Particle Millimeters TOT# ITEM % % CUMSilt/Clay < 0.062 S/C 6 6 11% 11%
Very Fine .062-.125 4 4 7% 18%Fine .125-.25 23 23 40% 58%
Medium .25-.50 6 6 11% 68%Coarse .50-1.0 5 5 9% 77%
.04-.08 Very Coarse 1.0-2 7 7 12% 89%
.08-.16 Very Fine 2.0-4.0 1 1 2% 91%
.16-.22 Fine 4-5.7 0 0% 91%
.22-.31 Fine 5.7-8 0 0% 91%
.31-.44 Medium 8-11.3 0 0% 91%
.44-.63 Medium 11.3-16 0 0% 91%
.63-.89 Coarse 16-22.6 0 0% 91%.89-1.26 Coarse 22.6-32 2 2 4% 95%1.26-1.77 Very Coarse 32-45 0 0% 95%1.77-2.5 Very Coarse 45-64 1 1 2% 96%2.5-3.5 Small 64-90 1 1 2% 98%3.5-5.0 Small 90-128 0 0% 98%5.0-7.1 Large 128-180 0 0% 98%7.1-10.1 Large 180-256 0 0% 98%10.1-14.3 Small 256-362 1 1 2% 100%14.3-20 Small 362-512 0 0% 100%20-40 Medium 512-1024 0 0% 100%40-80 Large 1024-2048 0 0% 100%
Bedrock BDRK 0 0% 100%TOTALS 57 100% 100%
SAND
GRAVEL
COBBLE
BOULDER
Pebble Count, Cross Section 1
0%10%20%30%40%50%60%70%80%90%
100%
0.01 0.1 1 10 100 1000 10000Particle Size (mm)
Per
cent
Fin
er T
han
Cumulative Percent (Year 2) Percent Item (Year 2)Cumulative Percent (Year 3) Percent Item (Year 3)Cumulative Percent (Year 4) Percent Item (Year 4)Cumulative Percent (Year 5) Percent Item (Year 5)

PEBBLE COUNTSite: Wells Creek
Party: IPJ & PDB
Date: 10/7/09 PARTICLE COUNTCS 2
Inches Particle Millimeters TOT# ITEM % % CUMSilt/Clay < 0.062 S/C 6 6 10% 10%
Very Fine .062-.125 11 11 19% 29%Fine .125-.25 7 7 12% 41%
Medium .25-.50 4 4 7% 48%Coarse .50-1.0 7 7 12% 60%
.04-.08 Very Coarse 1.0-2 4 4 7% 67%
.08-.16 Very Fine 2.0-4.0 1 1 2% 69%
.16-.22 Fine 4-5.7 1 1 2% 71%
.22-.31 Fine 5.7-8 1 1 2% 72%
.31-.44 Medium 8-11.3 0 0% 72%
.44-.63 Medium 11.3-16 3 3 5% 78%
.63-.89 Coarse 16-22.6 2 2 3% 81%.89-1.26 Coarse 22.6-32 3 3 5% 86%1.26-1.77 Very Coarse 32-45 3 3 5% 91%1.77-2.5 Very Coarse 45-64 1 1 2% 93%2.5-3.5 Small 64-90 2 2 3% 97%3.5-5.0 Small 90-128 0 0% 97%5.0-7.1 Large 128-180 2 2 3% 100%7.1-10.1 Large 180-256 0 0% 100%10.1-14.3 Small 256-362 0 0% 100%14.3-20 Small 362-512 0 0% 100%20-40 Medium 512-1024 0 0% 100%40-80 Large 1024-2048 0 0% 100%
Bedrock BDRK 0 0% 100%TOTALS 58 100% 100%
SAND
GRAVEL
COBBLE
BOULDER
Pebble Count, Cross Section 2
0%10%20%30%40%50%60%70%80%90%
100%
0.01 0.1 1 10 100 1000 10000Particle Size (mm)
Per
cent
Fin
er T
han
Cumulative Percent (Year 1) Percent Item (Year 1)Cumulative Percent (Year 2) Percent Item (Year 2)Cumulative Percent (Year 3) Percent Item (Year 3)Cumulative Percent (Year 4) Percent Item (Year 4)Cumulative Percent (Year 5) Percent Item (Year 5)

PEBBLE COUNTSite: Wells Creek
Party: IPJ & PDB
Date: 10/7/09 PARTICLE COUNTCS 3
Inches Particle Millimeters TOT# ITEM % % CUMSilt/Clay < 0.062 S/C 10 10 22% 22%
Very Fine .062-.125 0 0% 22%Fine .125-.25 3 3 7% 29%
Medium .25-.50 12 12 27% 56%Coarse .50-1.0 14 14 31% 87%
.04-.08 Very Coarse 1.0-2 2 2 4% 91%
.08-.16 Very Fine 2.0-4.0 1 1 2% 93%
.16-.22 Fine 4-5.7 0 0% 93%
.22-.31 Fine 5.7-8 2 2 4% 98%
.31-.44 Medium 8-11.3 0 0% 98%
.44-.63 Medium 11.3-16 1 1 2% 100%
.63-.89 Coarse 16-22.6 0 0% 100%.89-1.26 Coarse 22.6-32 0 0% 100%1.26-1.77 Very Coarse 32-45 0 0% 100%1.77-2.5 Very Coarse 45-64 0 0% 100%2.5-3.5 Small 64-90 0 0% 100%3.5-5.0 Small 90-128 0 0% 100%5.0-7.1 Large 128-180 0 0% 100%7.1-10.1 Large 180-256 0 0% 100%10.1-14.3 Small 256-362 0 0% 100%14.3-20 Small 362-512 0 0% 100%20-40 Medium 512-1024 0 0% 100%40-80 Large 1024-2048 0 0% 100%
Bedrock BDRK 0 0% 100%TOTALS 45 100% 100%
SAND
GRAVEL
COBBLE
BOULDER
Pebble Count, Cross Section 3
0%10%20%30%40%50%60%70%80%90%
100%
0.01 0.1 1 10 100 1000 10000
Particle Size (mm)
Per
cent
Fin
er T
han
Cumulative Percent (Year 1) Percent Item (Year 1)Cumulative Percent (Year 2) Percent Item (Year 2)Cumulative Percent (Year 3) Percent Item (Year 3)Cumulative Percent (Year 4) Percent Item (Year 4)Cumulative Percent (Year 5) Percent Item (Year 5)

PEBBLE COUNTSite: Wells Creek
Party: IPJ & PDB
Date: 10/7/09 PARTICLE COUNTCS 4
Inches Particle Millimeters TOT# ITEM % % CUMSilt/Clay < 0.062 S/C 9 9 14% 14%
Very Fine .062-.125 3 3 5% 18%Fine .125-.25 5 5 8% 26%
Medium .25-.50 12 12 18% 45%Coarse .50-1.0 3 3 5% 49%
.04-.08 Very Coarse 1.0-2 4 4 6% 55%
.08-.16 Very Fine 2.0-4.0 1 1 2% 57%
.16-.22 Fine 4-5.7 1 1 2% 58%
.22-.31 Fine 5.7-8 0 0% 58%
.31-.44 Medium 8-11.3 3 3 5% 63%
.44-.63 Medium 11.3-16 3 3 5% 68%
.63-.89 Coarse 16-22.6 1 1 2% 69%.89-1.26 Coarse 22.6-32 2 2 3% 72%1.26-1.77 Very Coarse 32-45 6 6 9% 82%1.77-2.5 Very Coarse 45-64 6 6 9% 91%2.5-3.5 Small 64-90 2 2 3% 94%3.5-5.0 Small 90-128 3 3 5% 98%5.0-7.1 Large 128-180 0 0% 98%7.1-10.1 Large 180-256 0 0% 98%10.1-14.3 Small 256-362 0 0% 98%14.3-20 Small 362-512 0 0% 98%20-40 Medium 512-1024 0 0% 98%40-80 Large 1024-2048 1 1 2% 100%
Bedrock BDRK 0 0% 100%TOTALS 65 100% 100%
SAND
GRAVEL
COBBLE
BOULDER
Pebble Count, Cross Section 4
0%10%20%30%40%50%60%70%80%90%
100%
0.01 0.1 1 10 100 1000 10000Particle Size (mm)
Per
cent
Fin
er T
han
Cumulative Percent (Year 2) Percent Item (Year 2)Cumulative Percent (Year 3) Percent Item (Year 3)Cumulative Percent (Year 4) Percent Item (Year 4)Cumulative Percent (Year 5) Percent Item (Year 5)
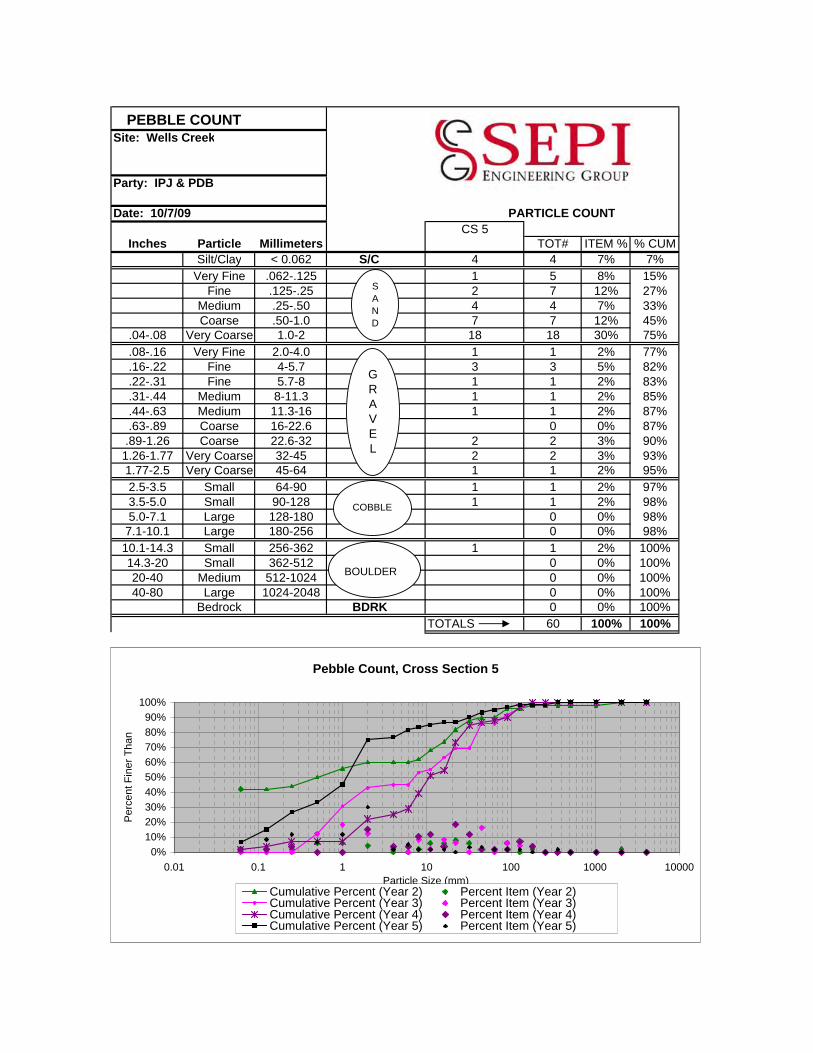
PEBBLE COUNTSite: Wells Creek
Party: IPJ & PDB
Date: 10/7/09 PARTICLE COUNTCS 5
Inches Particle Millimeters TOT# ITEM % % CUMSilt/Clay < 0.062 S/C 4 4 7% 7%
Very Fine .062-.125 1 5 8% 15%Fine .125-.25 2 7 12% 27%
Medium .25-.50 4 4 7% 33%Coarse .50-1.0 7 7 12% 45%
.04-.08 Very Coarse 1.0-2 18 18 30% 75%
.08-.16 Very Fine 2.0-4.0 1 1 2% 77%
.16-.22 Fine 4-5.7 3 3 5% 82%
.22-.31 Fine 5.7-8 1 1 2% 83%
.31-.44 Medium 8-11.3 1 1 2% 85%
.44-.63 Medium 11.3-16 1 1 2% 87%
.63-.89 Coarse 16-22.6 0 0% 87%.89-1.26 Coarse 22.6-32 2 2 3% 90%1.26-1.77 Very Coarse 32-45 2 2 3% 93%1.77-2.5 Very Coarse 45-64 1 1 2% 95%2.5-3.5 Small 64-90 1 1 2% 97%3.5-5.0 Small 90-128 1 1 2% 98%5.0-7.1 Large 128-180 0 0% 98%7.1-10.1 Large 180-256 0 0% 98%10.1-14.3 Small 256-362 1 1 2% 100%14.3-20 Small 362-512 0 0% 100%20-40 Medium 512-1024 0 0% 100%40-80 Large 1024-2048 0 0% 100%
Bedrock BDRK 0 0% 100%TOTALS 60 100% 100%
SAND
GRAVEL
COBBLE
BOULDER
Pebble Count, Cross Section 5
0%10%20%30%40%50%60%70%80%90%
100%
0.01 0.1 1 10 100 1000 10000Particle Size (mm)
Per
cent
Fin
er T
han
Cumulative Percent (Year 2) Percent Item (Year 2)Cumulative Percent (Year 3) Percent Item (Year 3)Cumulative Percent (Year 4) Percent Item (Year 4)Cumulative Percent (Year 5) Percent Item (Year 5)

PEBBLE COUNTSite: Wells Creek
Party: IPJ & PDB
Date: 10/7/09 PARTICLE COUNTCS 6
Inches Particle Millimeters TOT# ITEM % % CUMSilt/Clay < 0.062 S/C 12 12 16% 16%
Very Fine .062-.125 12 16% 31%Fine .125-.25 12 16% 47%
Medium .25-.50 2 2 3% 49%Coarse .50-1.0 3 3 4% 53%
.04-.08 Very Coarse 1.0-2 8 8 10% 64%
.08-.16 Very Fine 2.0-4.0 2 2 3% 66%
.16-.22 Fine 4-5.7 1 1 1% 68%
.22-.31 Fine 5.7-8 8 8 10% 78%
.31-.44 Medium 8-11.3 4 4 5% 83%
.44-.63 Medium 11.3-16 3 3 4% 87%
.63-.89 Coarse 16-22.6 3 3 4% 91%.89-1.26 Coarse 22.6-32 1 1 1% 92%1.26-1.77 Very Coarse 32-45 0 0% 92%1.77-2.5 Very Coarse 45-64 1 1 1% 94%2.5-3.5 Small 64-90 2 2 3% 96%3.5-5.0 Small 90-128 0 0% 96%5.0-7.1 Large 128-180 3 3 4% 100%7.1-10.1 Large 180-256 0 0% 100%10.1-14.3 Small 256-362 0 0% 100%14.3-20 Small 362-512 0 0% 100%20-40 Medium 512-1024 0 0% 100%40-80 Large 1024-2048 0 0% 100%
Bedrock BDRK 0 0% 100%TOTALS 77 100% 100%
SAND
GRAVEL
COBBLE
BOULDER
Pebble Count, Cross Section 6
0%10%20%30%40%50%60%70%80%90%
100%
0.01 0.1 1 10 100 1000 10000Particle Size (mm)
Per
cent
Fin
er T
han
Cumulative Percent (Year 1) Percent Item (Year 1)Cumulative Percent (Year 2) Percent Item (Year 2)Cumulative Percent (Year 3) Percent Item (Year 3)Cumulative Percent (Year 4) Percent Item (Year 4)Cumulative Percent (Year 5) Percent Item (Year 5)

PEBBLE COUNTSite: Wells Creek
Party: IPJ & PDB
Date: 10/7/09 PARTICLE COUNTCS 7
Inches Particle Millimeters TOT# ITEM % % CUMSilt/Clay < 0.062 S/C 25 25 52% 52%
Very Fine .062-.125 0 0% 52%Fine .125-.25 0 0% 52%
Medium .25-.50 0 0% 52%Coarse .50-1.0 1 1 2% 54%
.04-.08 Very Coarse 1.0-2 3 3 6% 60%
.08-.16 Very Fine 2.0-4.0 2 2 4% 65%
.16-.22 Fine 4-5.7 1 1 2% 67%
.22-.31 Fine 5.7-8 5 5 10% 77%
.31-.44 Medium 8-11.3 3 3 6% 83%
.44-.63 Medium 11.3-16 1 1 2% 85%
.63-.89 Coarse 16-22.6 5 5 10% 96%.89-1.26 Coarse 22.6-32 1 1 2% 98%1.26-1.77 Very Coarse 32-45 0 0% 98%1.77-2.5 Very Coarse 45-64 1 1 2% 100%2.5-3.5 Small 64-90 0 0% 100%3.5-5.0 Small 90-128 0 0% 100%5.0-7.1 Large 128-180 0 0% 100%7.1-10.1 Large 180-256 0 0% 100%10.1-14.3 Small 256-362 0 0% 100%14.3-20 Small 362-512 0 0% 100%20-40 Medium 512-1024 0 0% 100%40-80 Large 1024-2048 0 0% 100%
Bedrock BDRK 0 0% 100%TOTALS 48 100% 100%
SAND
GRAVEL
COBBLE
BOULDER
Pebble Count, Cross Section 7
0%10%20%30%40%50%60%70%80%90%
100%
0.01 0.1 1 10 100 1000 10000Particle Size (mm)
Per
cent
Fin
er T
han
Cumulative Percent (Year 1) Percent Item (Year 1)Cumulative Percent (Year 2) Percent Item (Year 2)Cumulative Percent (Year 3) Percent Item (Year 3)Cumulative Percent (Year 4) Percent Item (Year 4)Cumulative Percent (Year 5) Percent Item (Year 5)

PEBBLE COUNTSite: Wells Creek
Party: IPJ & PDB
Date: 10/7/09 PARTICLE COUNTCS 8
Inches Particle Millimeters TOT# ITEM % % CUMSilt/Clay < 0.062 S/C 13 13 26% 26%
Very Fine .062-.125 0 0% 26%Fine .125-.25 0 0% 26%
Medium .25-.50 2 2 4% 30%Coarse .50-1.0 6 6 12% 42%
.04-.08 Very Coarse 1.0-2 10 10 20% 62%
.08-.16 Very Fine 2.0-4.0 1 1 2% 64%
.16-.22 Fine 4-5.7 1 1 2% 66%
.22-.31 Fine 5.7-8 2 2 4% 70%
.31-.44 Medium 8-11.3 0 0% 70%
.44-.63 Medium 11.3-16 4 4 8% 78%
.63-.89 Coarse 16-22.6 4 4 8% 86%.89-1.26 Coarse 22.6-32 2 2 4% 90%1.26-1.77 Very Coarse 32-45 2 2 4% 94%1.77-2.5 Very Coarse 45-64 0 0% 94%2.5-3.5 Small 64-90 1 1 2% 96%3.5-5.0 Small 90-128 0 0% 96%5.0-7.1 Large 128-180 2 2 4% 100%7.1-10.1 Large 180-256 0 0% 100%10.1-14.3 Small 256-362 0 0% 100%14.3-20 Small 362-512 0 0% 100%20-40 Medium 512-1024 0 0% 100%40-80 Large 1024-2048 0 0% 100%
Bedrock BDRK 0 0% 100%TOTALS 50 100% 100%
SAND
GRAVEL
COBBLE
BOULDER
Pebble Count, Cross Section 8
0%10%20%30%40%50%60%70%80%90%
100%
0.01 0.1 1 10 100 1000 10000Particle Size (mm)
Per
cent
Fin
er T
han
Cumulative Percent (Year 2) Percent Item (Year 2)Cumulative Percent (Year 3) Percent Item (Year 3)Cumulative Percent (Year 4) Percent Item (Year 4)Cumulative Percent (Year 5) Percent Item (Year 5)

PEBBLE COUNTSite: Wells Creek
Party: IPJ & PDB
Date: 10/7/09 PARTICLE COUNTCS 9
Inches Particle Millimeters TOT# ITEM % % CUMSilt/Clay < 0.062 S/C 0 0% 0%
Very Fine .062-.125 0 0% 0%Fine .125-.25 1 1 2% 2%
Medium .25-.50 5 5 9% 11%Coarse .50-1.0 4 4 8% 19%
.04-.08 Very Coarse 1.0-2 7 7 13% 32%
.08-.16 Very Fine 2.0-4.0 0 0% 32%
.16-.22 Fine 4-5.7 2 2 4% 36%
.22-.31 Fine 5.7-8 2 2 4% 40%
.31-.44 Medium 8-11.3 1 1 2% 42%
.44-.63 Medium 11.3-16 7 7 13% 55%
.63-.89 Coarse 16-22.6 5 5 9% 64%.89-1.26 Coarse 22.6-32 5 5 9% 74%1.26-1.77 Very Coarse 32-45 3 3 6% 79%1.77-2.5 Very Coarse 45-64 3 3 6% 85%2.5-3.5 Small 64-90 4 4 8% 92%3.5-5.0 Small 90-128 3 3 6% 98%5.0-7.1 Large 128-180 1 1 2% 100%7.1-10.1 Large 180-256 0 0% 100%10.1-14.3 Small 256-362 0 0% 100%14.3-20 Small 362-512 0 0% 100%20-40 Medium 512-1024 0 0% 100%40-80 Large 1024-2048 0 0% 100%
Bedrock BDRK 0 0% 100%TOTALS 53 100% 100%
SAND
GRAVEL
COBBLE
BOULDER
Pebble Count, Cross Section 9
0%10%20%30%40%50%60%70%80%90%
100%
0.01 0.1 1 10 100 1000 10000Particle Size (mm)
Per
cent
Fin
er T
han
Cumulative Percent (Year 1) Percent Item (Year 1)Cumulative Percent (Year 2) Percent Item (Year 2)Cumulative Percent (Year 3) Percent Item (Year 3)Cumulative Percent (Year 4) Percent Item (Year 4)Cumulative Percent (Year 5) Percent Item (Year 5)

PEBBLE COUNTSite: Wells Creek
Party: IPJ & PDB
Date: 10/7/09 PARTICLE COUNTCS 10
Inches Particle Millimeters TOT# ITEM % % CUMSilt/Clay < 0.062 S/C 0 0% 0%
Very Fine .062-.125 0 0% 0%Fine .125-.25 0 0% 0%
Medium .25-.50 0 0% 0%Coarse .50-1.0 38 38 69% 69%
.04-.08 Very Coarse 1.0-2 9 9 16% 85%
.08-.16 Very Fine 2.0-4.0 0 0% 85%
.16-.22 Fine 4-5.7 0 0% 85%
.22-.31 Fine 5.7-8 0 0% 85%
.31-.44 Medium 8-11.3 0 0% 85%
.44-.63 Medium 11.3-16 0 0% 85%
.63-.89 Coarse 16-22.6 0 0% 85%.89-1.26 Coarse 22.6-32 1 1 2% 87%1.26-1.77 Very Coarse 32-45 3 3 5% 93%1.77-2.5 Very Coarse 45-64 1 1 2% 95%2.5-3.5 Small 64-90 2 2 4% 98%3.5-5.0 Small 90-128 0 0% 98%5.0-7.1 Large 128-180 1 1 2% 100%7.1-10.1 Large 180-256 0 0% 100%10.1-14.3 Small 256-362 0 0% 100%14.3-20 Small 362-512 0 0% 100%20-40 Medium 512-1024 0 0% 100%40-80 Large 1024-2048 0 0% 100%
Bedrock BDRK 0 0% 100%TOTALS 55 100% 100%
SAND
GRAVEL
COBBLE
BOULDER
Pebble Count, Cross Section 10
0%
10%
20%
30%
40%50%
60%
70%
80%
90%
100%
0.01 0.1 1 10 100 1000 10000Particle Size (mm)
Per
cent
Fin
er T
han
Cumulative Percent (Year 2) Percent Item (Year 2)Cumulative Percent (Year 3) Percent Item (Year 3)Cumulative Percent (Year 4) Percent Item (Year 4)Cumulative Percent (Year 5) Percent Item (Year 5)

PEBBLE COUNTSite: Wells Creek
Party: IPJ & PDB
Date: 10/7/09 PARTICLE COUNTCS 11
Inches Particle Millimeters TOT# ITEM % % CUMSilt/Clay < 0.062 S/C 7 7 12% 12%
Very Fine .062-.125 0 0% 12%Fine .125-.25 0 0% 12%
Medium .25-.50 5 5 9% 21%Coarse .50-1.0 8 8 14% 34%
.04-.08 Very Coarse 1.0-2 18 18 31% 66%
.08-.16 Very Fine 2.0-4.0 1 1 2% 67%
.16-.22 Fine 4-5.7 1 1 2% 69%
.22-.31 Fine 5.7-8 6 6 10% 79%
.31-.44 Medium 8-11.3 2 2 3% 83%
.44-.63 Medium 11.3-16 5 5 9% 91%
.63-.89 Coarse 16-22.6 0 0% 91%.89-1.26 Coarse 22.6-32 1 1 2% 93%1.26-1.77 Very Coarse 32-45 0 0% 93%1.77-2.5 Very Coarse 45-64 1 1 2% 95%2.5-3.5 Small 64-90 1 1 2% 97%3.5-5.0 Small 90-128 1 1 2% 98%5.0-7.1 Large 128-180 0 0% 98%7.1-10.1 Large 180-256 1 1 2% 100%10.1-14.3 Small 256-362 0 0% 100%14.3-20 Small 362-512 0 0% 100%20-40 Medium 512-1024 0 0% 100%40-80 Large 1024-2048 0 0% 100%
Bedrock BDRK 0 0% 100%TOTALS 58 100% 100%
SAND
GRAVEL
COBBLE
BOULDER
Pebble Count, Cross Section 11
0%10%20%30%40%50%60%70%80%90%
100%
0.01 0.1 1 10 100 1000 10000Particle Size (mm)
Per
cent
Fin
er T
han
Cumulative Percent (Year 1) Percent Item (Year 1)Cumulative Percent (Year 2) Percent Item (Year 2)Cumulative Percent (Year 3) Percent Item (Year 3)Cumulative Percent (Year 4) Percent item (Year 4)Cumulative Percent (Year 5) Percent Item (Year 5)

PEBBLE COUNTSite: Wells Creek
Party: IPJ & PDB
Date: 10/7/09 PARTICLE COUNTCS 12
Inches Particle Millimeters TOT# ITEM % % CUMSilt/Clay < 0.062 S/C 4 4 7% 7%
Very Fine .062-.125 0 0% 7%Fine .125-.25 0 0% 7%
Medium .25-.50 6 6 11% 18%Coarse .50-1.0 17 17 31% 49%
.04-.08 Very Coarse 1.0-2 13 13 24% 73%
.08-.16 Very Fine 2.0-4.0 0 0% 73%
.16-.22 Fine 4-5.7 0 0% 73%
.22-.31 Fine 5.7-8 2 2 4% 76%
.31-.44 Medium 8-11.3 0 0% 76%
.44-.63 Medium 11.3-16 1 1 2% 78%
.63-.89 Coarse 16-22.6 1 1 2% 80%.89-1.26 Coarse 22.6-32 2 2 4% 84%1.26-1.77 Very Coarse 32-45 0 0% 84%1.77-2.5 Very Coarse 45-64 0 0% 84%2.5-3.5 Small 64-90 1 1 2% 85%3.5-5.0 Small 90-128 0 0% 85%5.0-7.1 Large 128-180 0 0% 85%7.1-10.1 Large 180-256 0 0% 85%10.1-14.3 Small 256-362 0 0% 85%14.3-20 Small 362-512 0 0% 85%20-40 Medium 512-1024 0 0% 85%40-80 Large 1024-2048 0 0% 85%
Bedrock BDRK 8 8 15% 100%TOTALS 55 100% 100%
SAND
GRAVEL
COBBLE
BOULDER
Pebble Count, Cross Section 12
0%10%20%30%40%50%
60%70%80%90%
100%
0.01 0.1 1 10 100 1000 10000Particle Size (mm)
Per
cent
Fin
er T
han
Cumulative Percent (Year 2) Percent Item (Year 2)Cumulative Percent (Year 3) Percent Item (Year 3)Cumulative Percent (Year 4) Percent item (Year 4)Cumulative Percent (Year 5) Percent Item (Year 5)