well-to-wheels analysis of future fuels and associated ...€¦ · of future fuels and associated...
TRANSCRIPT

13/05/03
EUCAR
Preliminary
Slide 1
Well-to-Wheels analysis of future fuels and associated automotive powertrains
in the European context
A joint initiative of EUCAR/JRC/CONCAWE
Preliminary Results for Hydrogen
Summary of Material Presented to the EC Contact Group on Alternative Fuelsin May 2003

13/05/03
EUCAR
Preliminary
Slide 2
Well-to-Wheels analysis of future fuels and associated automotive powertrains
in the European contextPartial and preliminary results
Conventional fuels/enginesHydrogen powertrains
Well-to-tankGasoline and diesel production and distributionHydrogen pathways
Tank-to Wheels 2002, assessments 2010Conventional advanced gasoline, diesel, natural gas vehiclesHydrogen vehicles
Well-to-Wheels integration
13/05/03
EUCAR
Preliminary
Slide 3
WELL-TO-TANK

13/05/03
EUCAR
Preliminary
Slide 4
Well-to-Tank analysisConventional oil pathways
At the 2010-2020 horizon, alternative fuels will replace some fraction of the current conventional fuels market
The energy that can be saved and the GHG emissions that can be avoided therefore pertain to the MARGINAL production of conventional fuels
Europe is short in diesel and long in gasoline: the “natural” balance between gasoline and middle distillates is stretched
As a result, refinery production of marginal diesel is more energy-intensive than that of marginal gasoline
Energy
0.00
0.02
0.04
0.06
0.08
0.10
0.12
0.14
0.16
0.18
Extraction &Processing
Transport Refining Distribution Total chain
MJ/
MJ Gasoline
Diesel
GHG
0.0
2.0
4.0
6.0
8.0
10.0
12.0
14.0
16.0
Extraction &Processing
Transport Refining Distribution Total chain
g C
O2
eq /
MJ
GasolineDiesel
CO2 on combustion is about 75g/MJ
13/05/03
EUCAR
Preliminary
Slide 5
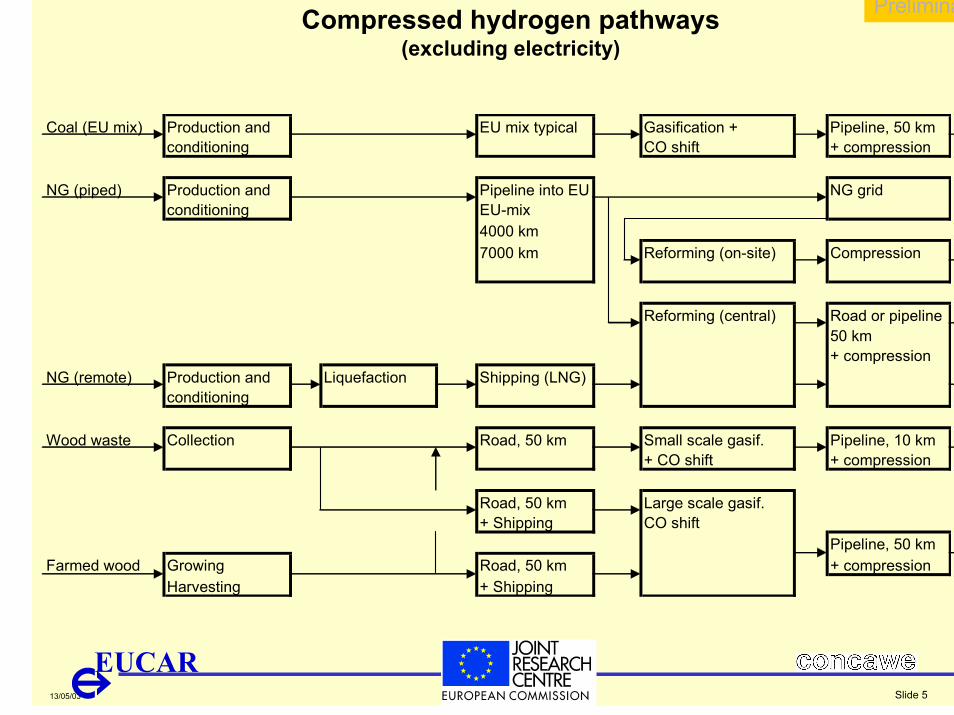
Compressed hydrogen pathways(excluding electricity)
Coal (EU mix) Production and EU mix typical Gasification + Pipeline, 50 kmconditioning CO shift + compression
NG (piped) Production and Pipeline into EU NG gridconditioning EU-mix
4000 km7000 km Reforming (on-site) Compression
Reforming (central) Road or pipeline50 km+ compression
NG (remote) Production and Liquefaction Shipping (LNG)conditioning
Wood waste Collection Road, 50 km Small scale gasif. Pipeline, 10 km+ CO shift + compression
Road, 50 km Large scale gasif.+ Shipping CO shift
Pipeline, 50 kmFarmed wood Growing Road, 50 km + compression
Harvesting + Shipping

13/05/03
EUCAR
Preliminary
Slide 6
Liquefied hydrogen pathways(excluding electricity)
NG (piped) Production and Pipeline into EU Reforming Road, 300 kmconditioning (central)
+ H2 Liquefaction
NG (remote) Production and Reforming Shipping Road, 500 kmconditioning + H2 liquefaction (LH2)
NG (remote) Production and Liquefaction Shipping (LNG) Reforming (central) Road, 500 kmconditioning + H2 liquefaction

13/05/03
EUCAR
Preliminary
Slide 7
Electricity to hydrogen pathways
Electricity Electrolysis Pipeline(grid) (central) Compression
Electrolysis Compression(on-site)
Electricity Electrolysis Road, 300 km(grid) (central)
+ H2 Liquefaction
Electricity production pathways
Coal (EU mix) Production and Typical of EU mix IGCC MV gridconditioning
NG (piped) Production and Pipeline into EU CCGT MV gridconditioning
NG (remote) Liquifaction Shipping (LNG) CCGT MV grid
EU fuel mix EU mix typical MV grid
Wind Wind turbine MV gridOn/offshore
13/05/03
EUCAR
Preliminary
Slide 8
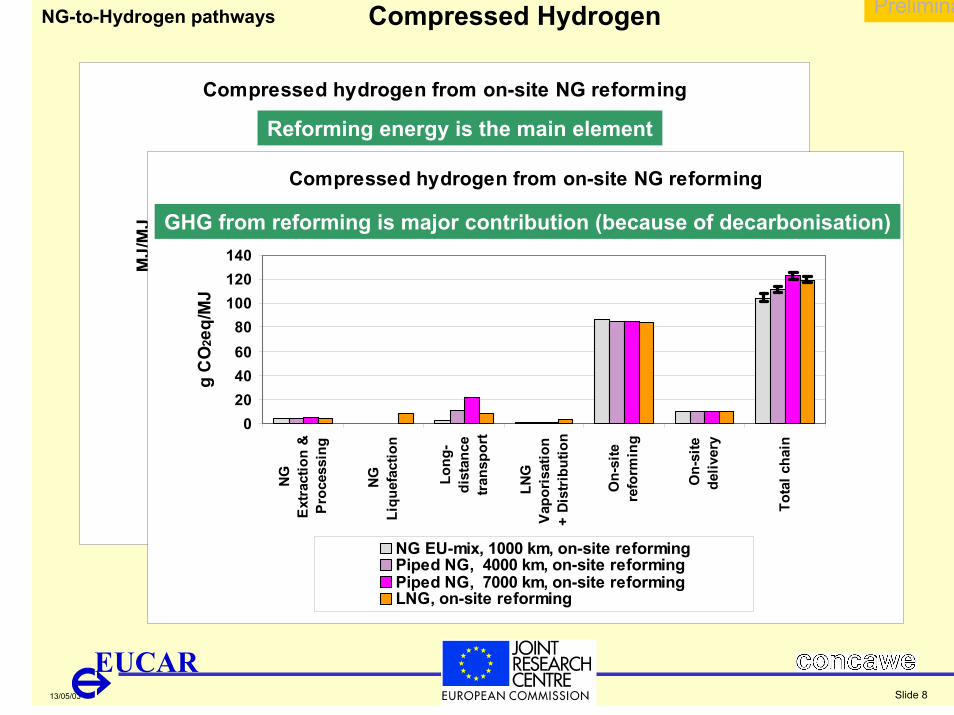
Compressed HydrogenNG-to-Hydrogen pathways
Compressed hydrogen from on-site NG reforming
0.00.20.40.60.81.01.21.4
NG
Extr
actio
n &
Proc
essi
ng
NG
Liqu
efac
tion
Long
-di
stan
cetr
ansp
ort
LNG
Vapo
risat
ion
+
On-
site
refo
rmin
g
On-
site
deliv
ery
Tota
l cha
in
MJ/
MJ
NG EU-mix, 1000 km, on-site reformingPiped NG, 4000 km, on-site reformingPiped NG, 7000 km, on-site reformingLNG, on-site reforming
Compressed hydrogen from on-site NG reforming
020406080
100120140
NG
Ext
ract
ion
&Pr
oces
sing
NGLi
quef
actio
n
Long
-di
stan
cetr
ansp
ort
LNG
Vap
oris
atio
n+
Dis
trib
utio
n
On-
site
refo
rmin
g
On-
site
deliv
ery
Tota
l cha
in
g C
O2e
q/M
J
NG EU-mix, 1000 km, on-site reformingPiped NG, 4000 km, on-site reformingPiped NG, 7000 km, on-site reformingLNG, on-site reforming
Reforming energy is the main element
GHG from reforming is major contribution (because of decarbonisation)
13/05/03
EUCAR
Preliminary
Slide 9
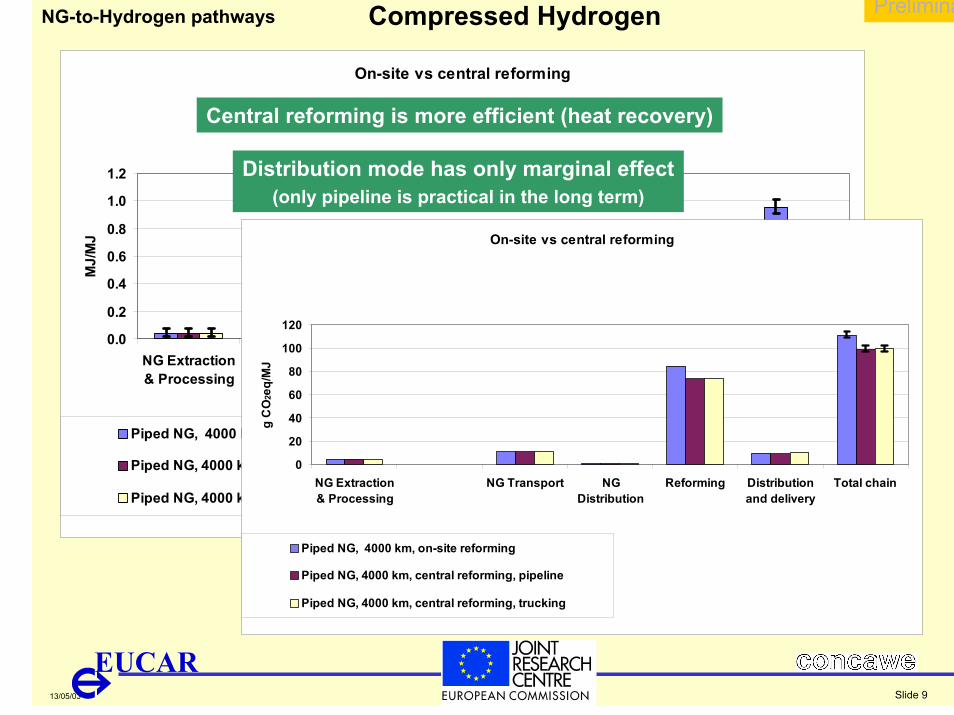
Compressed HydrogenNG-to-Hydrogen pathways
On-site vs central reforming
0.0
0.2
0.4
0.6
0.8
1.0
1.2
NG Extraction& Processing
NG Transport NGDistribution
Reforming Distributionand delivery
Total chain
MJ/
MJ
Piped NG, 4000 km, on-site reforming
Piped NG, 4000 km, central reforming, pipeline
Piped NG, 4000 km, central reforming, trucking
On-site vs central reforming
0
20
40
60
80
100
120
NG Extraction& Processing
NG Transport NGDistribution
Reforming Distributionand delivery
Total chain
g C
O2e
q/M
J
Piped NG, 4000 km, on-site reforming
Piped NG, 4000 km, central reforming, pipeline
Piped NG, 4000 km, central reforming, trucking
Central reforming is more efficient (heat recovery)
Distribution mode has only marginal effect(only pipeline is practical in the long term)
13/05/03
EUCAR
Preliminary
Slide 10
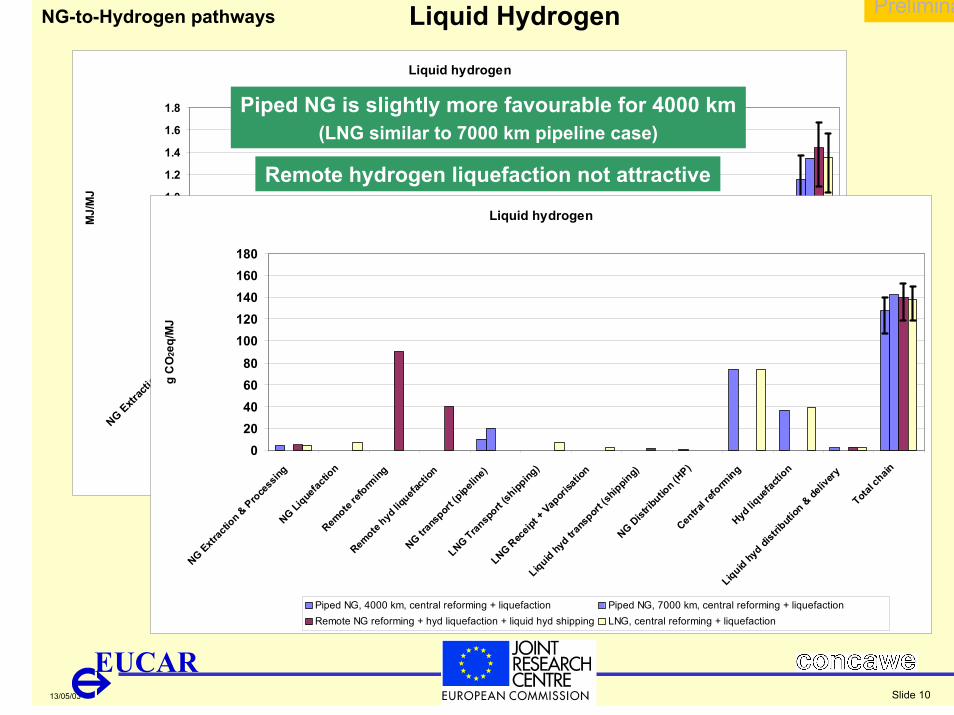
Liquid HydrogenNG-to-Hydrogen pathways
Liquid hydrogen
0.0
0.2
0.4
0.6
0.8
1.0
1.2
1.4
1.6
1.8
NG Extrac
tion &
Proces
sing
NG Liquefactio
nRem
ote ref
orming
Remote
hyd liquefa
ction
NG tran
sport
(pipeline)
LNG Transport
(shipping)
LNG Rec
eipt + Vap
orisati
on
Liquid hyd tr
ansp
ort (shipping)
NG Dist
ributio
n (HP)
Centra
l refo
rming
Hyd liq
uefactio
n
Liquid hyd dist
ributio
n & deliv
eryTotal c
hain
MJ/
MJ
Piped NG, 4000 km, central reforming + liquefaction Piped NG, 7000 km, central reforming + liquefactionRemote NG reforming + hyd liquefaction + liquid hyd shipping LNG, central reforming + liquefaction
Liquid hydrogen
020406080
100120140160180
NG Extrac
tion &
Pro
cess
ingNG Li
quefac
tion
Remote
reform
ing
Remote
hyd liq
uefacti
on
NG tran
spor
t (pipeli
ne)
LNG Transp
ort (sh
ipping
)
LNG Rec
eipt +
Vapor
isatio
n
Liquid hyd tr
ansp
ort (s
hippin
g)NG D
istrib
ution (H
P)Cen
tral r
eform
ingHyd
lique
factio
n
Liquid hyd di
stributi
on &
deliv
ery
Total c
hain
g C
O2e
q/M
J
Piped NG, 4000 km, central reforming + liquefaction Piped NG, 7000 km, central reforming + liquefactionRemote NG reforming + hyd liquefaction + liquid hyd shipping LNG, central reforming + liquefaction
Piped NG is slightly more favourable for 4000 km(LNG similar to 7000 km pipeline case)
Remote hydrogen liquefaction not attractive
13/05/03
EUCAR
Preliminary
Slide 11
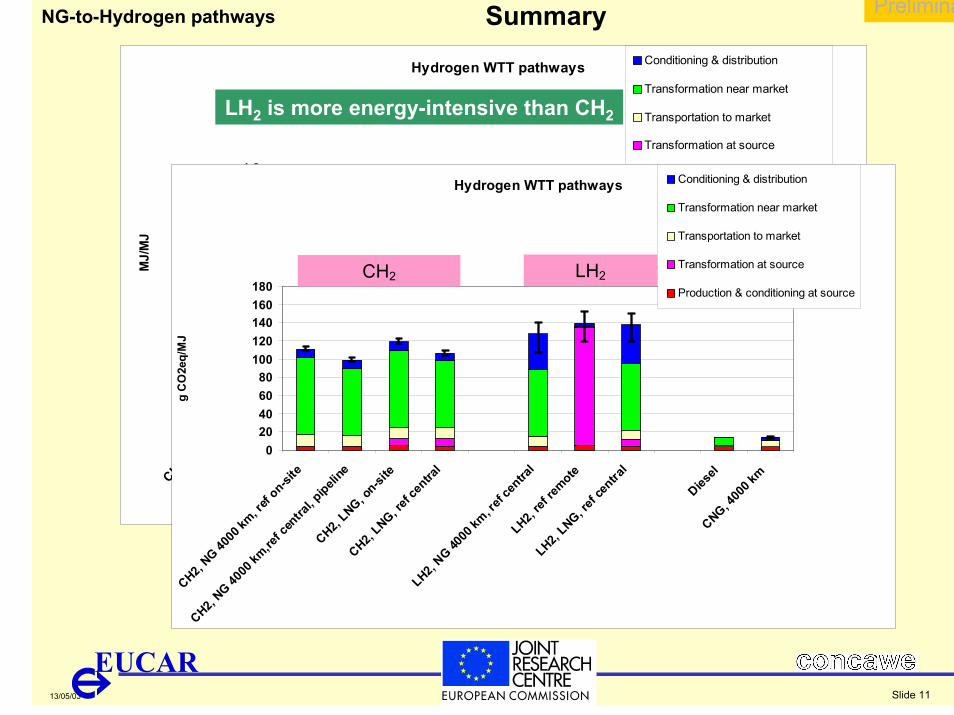
SummaryNG-to-Hydrogen pathways
Hydrogen WTT pathways
0.00.20.40.60.81.01.21.41.61.8
CH2, NG 40
00 km
, ref
on-site
CH2, NG 40
00 km
,ref c
entra
l, pipeli
ne
CH2, LNG, o
n-site
CH2, LNG, re
f cen
tral
LH2, NG 40
00 km
, ref c
entra
lLH2,
ref re
mote
LH2, LNG, re
f cen
tral
Diesel
CNG, 400
0 km
MJ/
MJ
Conditioning & distribution
Transformation near market
Transportation to market
Transformation at source
Production & conditioning at sourceHydrogen WTT pathways
020406080
100120140160180
CH2, NG 40
00 km
, ref
on-site
CH2, NG 40
00 km
,ref c
entra
l, pipeli
ne
CH2, LNG, o
n-site
CH2, LNG, re
f cen
tral
LH2, NG 40
00 km
, ref c
entra
lLH2,
ref re
mote
LH2, LNG, re
f cen
tral
Diesel
CNG, 400
0 km
g C
O2e
q/M
JConditioning & distribution
Transformation near market
Transportation to market
Transformation at source
Production & conditioning at source
LH2 is more energy-intensive than CH2
CH2 LH2

13/05/03
EUCAR
Preliminary
Slide 12
Wood-to-Hydrogen pathways
Wood to Hydrogen
0.00.20.40.60.81.01.21.41.61.8
Farm
ing
/co
llect
ion
and
chip
ping
Mix
edtr
ansp
ort
Gas
ifier
+C
O s
hift
+po
wer
gene
ratio
n
Liqu
efac
tion
Dis
trib
utio
n&
del
iver
y
Tota
l cha
in
MJ/
MJ
Wood waste, on-site gasification, 10 MW (biomass)Wood waste, large scale gasification, 200 MW (biomass)Farmed wood , on-site gasification, 10 MW (biomass)Farmed wood, large scale gasification, 200 MW (biomass)Farmed wood, large scale gasification, 200 MW (biomass), liquefaction
200 MW (biomass) is a very large plant! (about 50 t/h of wood)
Wood to Hydrogen
05
101520253035
Farm
ing
/co
llect
ion
and
chip
ping
Mix
edtr
ansp
ort
Gas
ifier
+C
O s
hift
+po
wer
gene
ratio
n
Liqu
efac
tion
Dis
trib
utio
n&
del
iver
y
Tota
l cha
in
g C
O2e
q/M
J
Wood waste, on-site gasification, 10 MW (biomass)Wood waste, large scale gasification, 200 MW (biomass)Farmed wood , on-site gasification, 10 MW (biomass)Farmed wood, large scale gasification, 200 MW (biomass)Farmed wood, large scale gasification, 200 MW (biomass), liquefaction
13/05/03
EUCAR
Preliminary
Slide 13
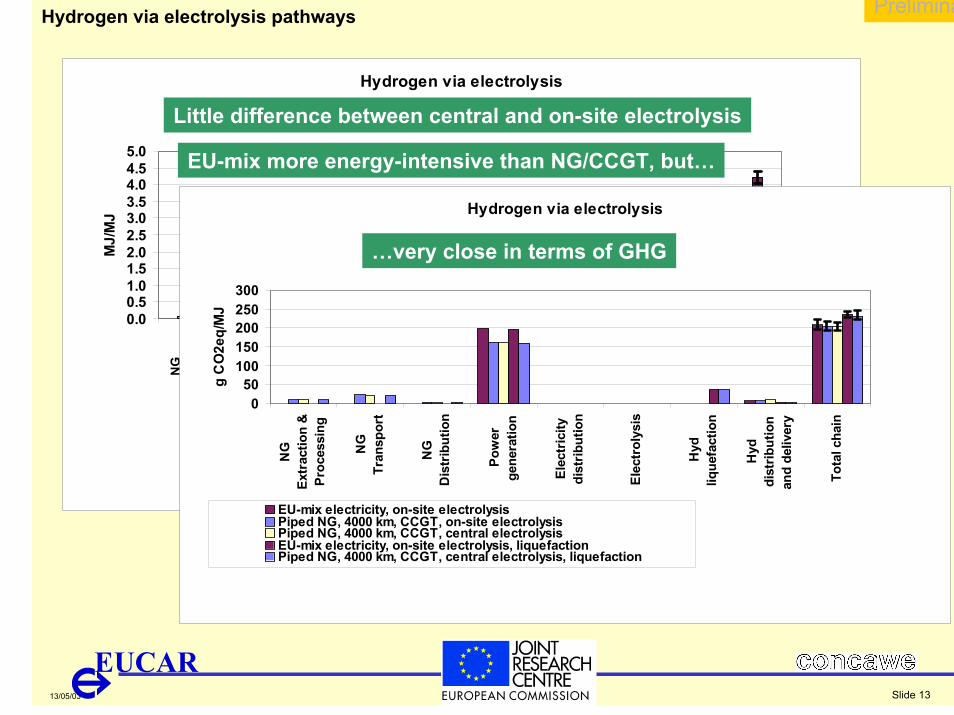
Hydrogen via electrolysis pathways
Hydrogen via electrolysis
0.00.51.01.52.02.53.03.54.04.55.0
NG
Extr
actio
n &
Proc
essi
ng
NG
Tran
spor
t
NG
Dis
trib
utio
n
Pow
erge
nera
tion
Elec
tric
itydi
strib
utio
n
Elec
trol
ysis
Hyd
lique
fact
ion
Hyd
dist
ribut
ion
and
deliv
ery
Tota
l cha
in
MJ/
MJ
EU-mix electricity, on-site electrolysisPiped NG, 4000 km, CCGT, on-site electrolysisPiped NG, 4000 km, CCGT, central electrolysisEU-mix electricity, on-site electrolysis, liquefactionPiped NG, 4000 km, CCGT, central electrolysis, liquefaction
Little difference between central and on-site electrolysis
EU-mix more energy-intensive than NG/CCGT, but…
Hydrogen via electrolysis
050
100150200250300
NG
Extr
actio
n &
Proc
essi
ng
NG
Tran
spor
t
NG
Dis
trib
utio
n
Pow
erge
nera
tion
Elec
tric
itydi
strib
utio
n
Elec
trol
ysis
Hyd
lique
fact
ion
Hyd
dist
ribut
ion
and
deliv
ery
Tota
l cha
in
g C
O2e
q/M
J
EU-mix electricity, on-site electrolysisPiped NG, 4000 km, CCGT, on-site electrolysisPiped NG, 4000 km, CCGT, central electrolysisEU-mix electricity, on-site electrolysis, liquefactionPiped NG, 4000 km, CCGT, central electrolysis, liquefaction
…very close in terms of GHG
13/05/03
EUCAR
Preliminary
Slide 14
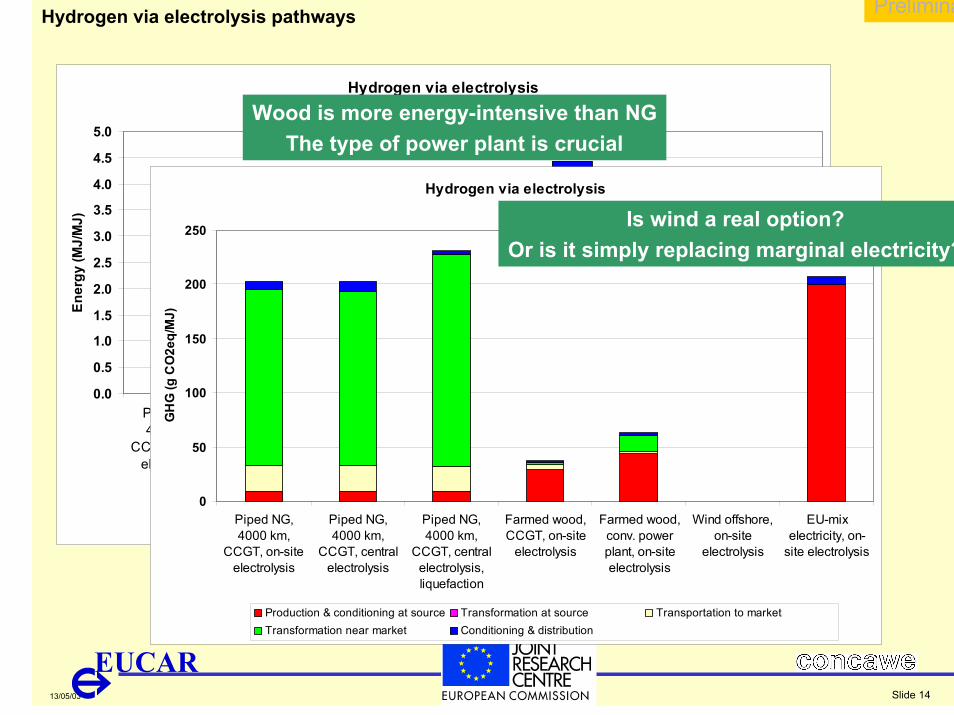
Hydrogen via electrolysis pathways
Hydrogen via electrolysis
0.0
0.5
1.0
1.5
2.0
2.5
3.0
3.5
4.0
4.5
5.0
Piped NG,4000 km,
CCGT, on-siteelectrolysis
Piped NG,4000 km,
CCGT, centralelectrolysis
Piped NG,4000 km,
CCGT, centralelectrolysis,liquefaction
Farmed wood,CCGT, on-site
electrolysis
Farmed wood,conv. powerplant, on-siteelectrolysis
Wind offshore,on-site
electrolysis
EU-mixelectricity, on-
site electrolysis
Ener
gy (M
J/M
J)
Production & conditioning at source Transformation at source Transportation to marketTransformation near market Conditioning & distribution
Hydrogen via electrolysis
0
50
100
150
200
250
Piped NG,4000 km,
CCGT, on-siteelectrolysis
Piped NG,4000 km,
CCGT, centralelectrolysis
Piped NG,4000 km,
CCGT, centralelectrolysis,liquefaction
Farmed wood,CCGT, on-site
electrolysis
Farmed wood,conv. powerplant, on-siteelectrolysis
Wind offshore,on-site
electrolysis
EU-mixelectricity, on-
site electrolysis
GH
G (g
CO
2eq/
MJ)
Production & conditioning at source Transformation at source Transportation to marketTransformation near market Conditioning & distribution
Wood is more energy-intensive than NGThe type of power plant is crucial
Is wind a real option?Or is it simply replacing marginal electricity?
13/05/03
EUCAR
Preliminary
Slide 15
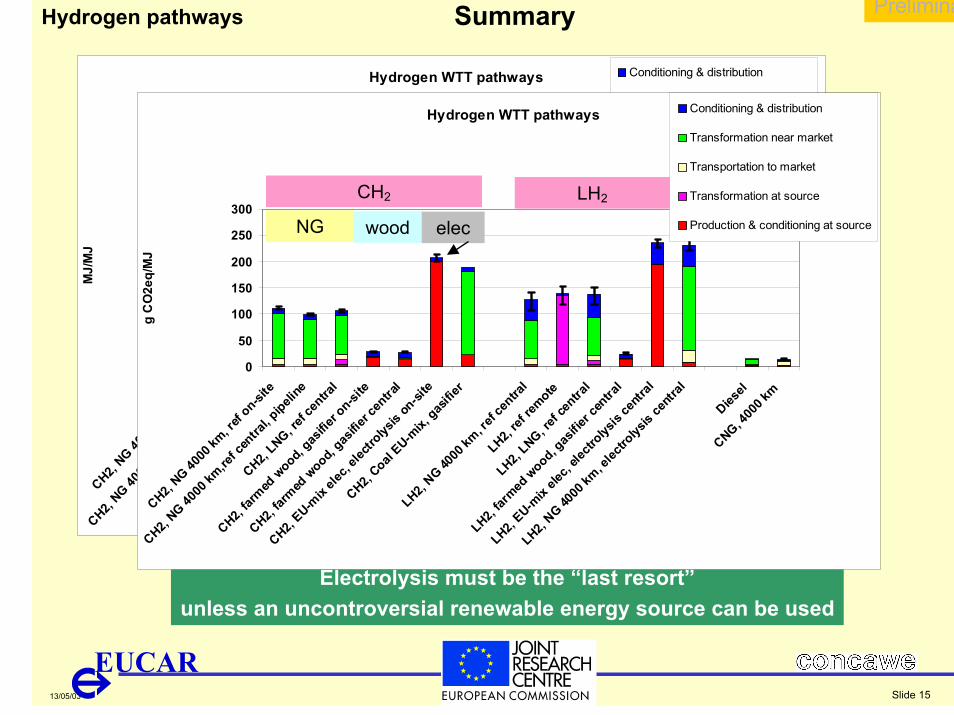
SummaryHydrogen pathways
Hydrogen WTT pathways
0.00.51.01.52.02.53.03.54.04.55.0
CH2, NG 40
00 km
, ref
on-site
CH2, NG 40
00 km
,ref c
entra
l, pipeli
ne
CH2, LNG, re
f cen
tral
CH2, far
med w
ood, gas
ifier o
n-site
CH2, far
med w
ood, gas
ifier c
entra
l
CH2, EU-m
ix ele
c, ele
ctrolys
is on
-site
CH2, Coal
EU-mix,
gasifie
r
LH2, NG 40
00 km
, ref c
entra
l
LH2, ref
remote
LH2, LNG, re
f cen
tral
LH2, far
med w
ood, gas
ifier c
entra
l
LH2, EU-m
ix ele
c, ele
ctrolys
is ce
ntral
LH2, NG 40
00 km
, elec
trolys
is ce
ntral
Diesel
CNG, 400
0 km
MJ/
MJ
Conditioning & distribution
Transformation near market
Transportation to market
Transformation at source
Production & conditioning at source
Electrolysis must be the “last resort”unless an uncontroversial renewable energy source can be used
Hydrogen WTT pathways
0
50
100
150
200
250
300
CH2, NG 40
00 km
, ref
on-site
CH2, NG 40
00 km
,ref c
entra
l, pipeli
ne
CH2, LNG, re
f cen
tral
CH2, far
med w
ood, gas
ifier o
n-site
CH2, far
med w
ood, gas
ifier c
entra
l
CH2, EU-m
ix ele
c, ele
ctrolys
is on
-site
CH2, Coal
EU-mix,
gasifie
r
LH2, NG 40
00 km
, ref c
entra
l
LH2, ref
remote
LH2, LNG, re
f cen
tral
LH2, far
med w
ood, gas
ifier c
entra
l
LH2, EU-m
ix ele
c, ele
ctrolys
is ce
ntral
LH2, NG 40
00 km
, elec
trolys
is ce
ntral
Diesel
CNG, 400
0 km
g C
O2e
q/M
J
Conditioning & distribution
Transformation near market
Transportation to market
Transformation at source
Production & conditioning at source
CH2 LH2
NG wood elec
13/05/03
EUCAR
Preliminary
Slide 16
WTT Conclusions
LH2 is more energy and GHG intensive than CH2
Central reforming requires somewhat less energy than on-site
Electrolysis is very energy-intensive and can only be justified if genuinely renewable electricity is available

13/05/03
EUCAR
Preliminary
Slide 17
TANK-TO-WHEELS
Gasoline, Diesel, Natural gas, Hydrogen2002 - 2010
13/05/03
EUCAR
Preliminary
Slide 18
Tank-to-Wheels study:Gasoline, Diesel, Natural gas, Hydrogen
For the purpose of this study, a “virtual” vehicle was created, figurableas a VW Golf 1.6 l gasoline (most popular segment of the market)The results do not represent a fleet average
The Fuels / powertrains considered here are :- Technologies 2002 are purely Internal Combust. Engines (I.C.E.)- Technologies assessed for 2010 include : I.C.E. & Fuel Cells
The engine technologies and fuels investigated do not imply any assumptions with regard to their potential market share
ICE hybrid vehicles will be included later

13/05/03
EUCAR
Preliminary
Slide 19
Tank-to-Wheels studyPerformance & Emissions
All technologies fulfil at least minimal customer performance criteriaFor bi-fuel (gasoline-CNG) the vehicle performance decay (12% torque down-shift) is accepted. A dedicated CNG engine, upsized at 2 l. to fulfil the required performances is simulated.
The H2 I.C. engine is simulated as extrapolated from single cylinder present studies : 1.3 liter, already turbo-charged to meet the performances.
“Vehicle / Fuel” combinations comply with emissions regulationsThe 2002 vehicles comply with Euro IIIThe 2010 vehicles comply with EU IV
Direct Injection for gaseous fuels is not simulated as still at the level of research with open issues to be adressed (energy penalty or limited range)

13/05/03
EUCAR
Preliminary
Slide 20
Tank-to-Wheels studyFuels & adapted technologies for comparable performance
PISI SIDI CIDIGasoline 1.6 lit. DieselCNG (Bi Fuels)CNG (dedicated)CGH2LH2
1.6 lit.*
1.6 lit.
2.0 lit.
1.9 lit.
1.3 lit. TC1.3 lit. TC
Engine Type F.C.
75 kW75 kW
dieselgasolineFuelcell
Objective is to compare vehicles at same level
of technology
* Reduced performance
PISI : Port Injection Spark IgnitionSIDI : Spark Ignition Direct InjectionCIDI : Compression Ignition Direct Injection (Common Rail)F.C. : Fuel Cells (Direct Hydrogen)

13/05/03
EUCAR
Preliminary
Slide 21
Tank-to-Wheels studyComments : state of the art 2002
H2 ICE : Energy efficiency results from simulation are better than gasoline reference :Reason:- The S.I. H2 engine model is, already in 2002, simulated as downsized and turbo charged (DSTC), while the reference gasoline engine is not.
- The gasoline ICE will include the same technology in the 2010 version(and therefore be more energy efficient)
- The benefit of DSTC will not be accounted twice for H2 in 2010
No GHG are emitted by the H2 powertrain, except the NOx contribution

13/05/03
EUCAR
Preliminary
Slide 22
Tank-to-Wheels studyCompared Energy Efficiency
Cold start on NEDC PISI 1,6 SIDI 1,6 DIESEL1,9 CNGBF 1,6 CNG2,0 CGH2 LH2CO2 (g/km) 166,2 155,3 135 129 130 0 0ENERGY EFF. (MJ/100km) 223,5 209 183 229 230 180 180MASS Consump. (kg/100km) 5,21 4,87 4,26 5,08 5,1 1,50 1,50FUEL Consump. (l /100km) 6,95 6,49 5,1 7,12 7,15 5,60 5,60Other G.H.G. (g/km)Methane (g/kmCO2 eq.) 0,84 0,84 0,25 3,36 3,36N2O (g/km CO2 eq 0,93 0,93 3,1 0,93 0,93 0,93 0,93GHG global g/km 168,0 157,0 137,9 133,3 133,8 0,9 0,9
CNGbi-fueldieselgasoline CNG
dedicated
E n e r g y e f f ic ie n c y (M J / k m )
0 ,0 0
0 ,5 0
1 ,0 0
1 ,5 0
2 ,0 0
2 ,5 0
PISI 1,6
SIDI 1
,6
DIESEL1,9
CNGBF 1,6
CNG2,0
CGH 2
LH 2
ICE en
giARnes
STATE of the
T 2002

13/05/03
EUCAR
Preliminary
Slide 23
Tank-to-Wheels studyCompared G.H.G. emissions
Cold start on NEDC PISI 1,6 SIDI 1,6 DIESEL1,9 CNGBF 1,6 CNG2,0 CGH2 LH2CO2 (g/km) 166,2 155,3 135 129 130 0 0ENERGY EFF. (MJ/100km) 223,5 209 183 229 230 180 180MASS Consump. (kg/100km) 5,21 4,87 4,26 5,08 5,1 1,50 1,50FUEL Consump. (l /100km) 6,95 6,49 5,1 7,12 7,15 5,60 5,60
Other G.H.G. (g/km)Methane (g/kmCO2 eq.) 0,84 0,84 0,25 3,36 3,36N2O (g/km CO2 eq 0,93 0,93 3,1 0,93 0,93 0,93 0,93
GHG global g/km 168,0 157,0 137,9 133,3 133,8 0,9 0,9
ICE en
gines
STATE of the A
RT 2002
Fuels / Vehicles G.H.G. (g/km CO2 eq.)
0
20
40
60
80
100
120
140
160
180
PISI 1,6 SIDI 1,6 DIESEL1,9 CNGBF 1,6 CNG2,0 CGH2 LH 2
CO2 on the NEDC (g/km) cold Other GHG global g/km

13/05/03
EUCAR
Preliminary
Slide 24
Tank-to-Wheels studyEvolutions 2002 - 2010
From present State of the Art until 2010, Fuel efficiency evolutions should occur, depending on:
- the maturity of the technology- the specific possibilities and constraints of the fuel
Car manufacturers globally converge towards assumptions :- Port injection S.I. : + 15 % (includ. Downsizing Turbo Charged)- Direct injection S.I. : + 10 %- Diesel : + 6 % ( or 2 %, only, under Particle Trap)- Hydrogen I.C.E. : + 6 % ( D.S.T.C. already accounted as 2002)
- Nat. Gas & H2 : + 1 % supplementary for optimal air - gas mixture
DPF w/o DPFPISI SIDI DIESEL DIESEL CNGl H2
2010 improvement 15 10 2 6 16 7

13/05/03
EUCAR
Preliminary
Slide 25
Tank-to-Wheels studyCompared Energy Efficiency
Forecas
t 201
0
I.C.E.s
’
DPF w/o DPFCold start N.E.D.C. PISI SIDI DIESEL DIESEL CNG CGH2 LH2CO2 (g/km) 140 138 131 126 107 0 0ENERGY EFF. (MJ/100km) 190,0 188,0 179,1 171,8 190,8 168,1 168,1MASS Consump. (kg/100km) 4,43 4,38 4,17 4,00 4,23 1,40 1,40Cons. NEDC (l/100km) 2010 5,91 5,84 4,99 4,79 5,93 5,22 5,22Other G.H.G. (g/km)Methane (g/kmCO2 eq.) 0,42 0,42 0,21 0,21 0,84N2O (g/km CO2 eq 0,5 0,5 1,55 1,55 0,5 0,5 0,5
GHG global g/km 140,5 138,9 133,0 127,6 108,8 0,5 0,5
Gasoline
MJ / km on the NEDC (cold)
1,55
1,60
1,65
1,70
1,75
1,80
1,85
1,90
1,95
PISI SIDI DIESEL DPF
DIESELw.o. DPF
CNG CGH2 LH2
13/05/03
EUCAR
Preliminary
Slide 26
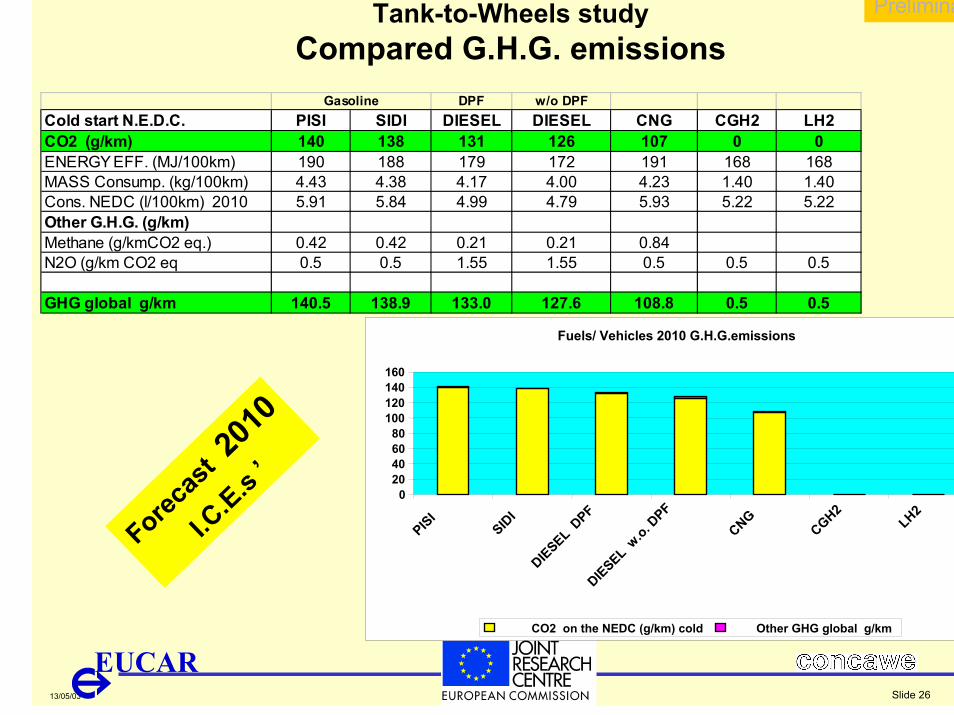
Tank-to-Wheels studyCompared G.H.G. emissions
DPF w/o DPFCold start N.E.D.C. PISI SIDI DIESEL DIESEL CNG CGH2 LH2CO2 (g/km) 140 138 131 126 107 0 0ENERGY EFF. (MJ/100km) 190 188 179 172 191 168 168MASS Consump. (kg/100km) 4.43 4.38 4.17 4.00 4.23 1.40 1.40Cons. NEDC (l/100km) 2010 5.91 5.84 4.99 4.79 5.93 5.22 5.22Other G.H.G. (g/km)Methane (g/kmCO2 eq.) 0.42 0.42 0.21 0.21 0.84N2O (g/km CO2 eq 0.5 0.5 1.55 1.55 0.5 0.5 0.5
GHG global g/km 140.5 138.9 133.0 127.6 108.8 0.5 0.5
Gasoline
Fuels/ Vehicles 2010 G.H.G.emissions
020406080
100120140160
PISI
SIDI
DIESEL DPF
DIESEL w.o. D
PF
CNG
CGH2
LH2
CO2 on the NEDC (g/km) cold Other GHG global g/km
Forecas
t s ’20
10
I.C.E.
13/05/03
EUCAR
Preliminary
Slide 27
Tank-to-Wheels studyComments : assessments 2010
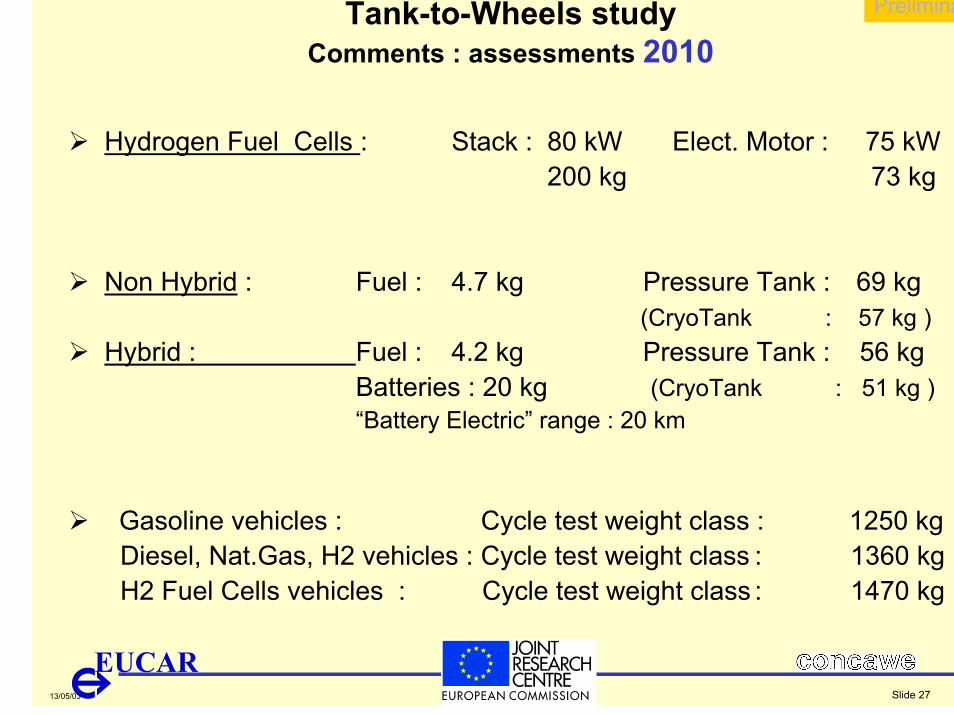
Hydrogen Fuel Cells : Stack : 80 kW Elect. Motor : 75 kW200 kg 73 kg
Non Hybrid : Fuel : 4.7 kg Pressure Tank : 69 kg(CryoTank : 57 kg )
Hybrid : Fuel : 4.2 kg Pressure Tank : 56 kgBatteries : 20 kg (CryoTank : 51 kg )“Battery Electric” range : 20 km
Gasoline vehicles : Cycle test weight class : 1250 kgDiesel, Nat.Gas, H2 vehicles : Cycle test weight class : 1360 kgH2 Fuel Cells vehicles : Cycle test weight class : 1470 kg
13/05/03
EUCAR
Preliminary
Slide 28
Tank-to-Wheels studyComments : assessments 2010
FC Engine efficiency
0%
10%
20%
30%
40%
50%
60%
0% 20% 40% 60% 80% 100%% Net Power
Syst
em E
ffici
ency
H2 FC
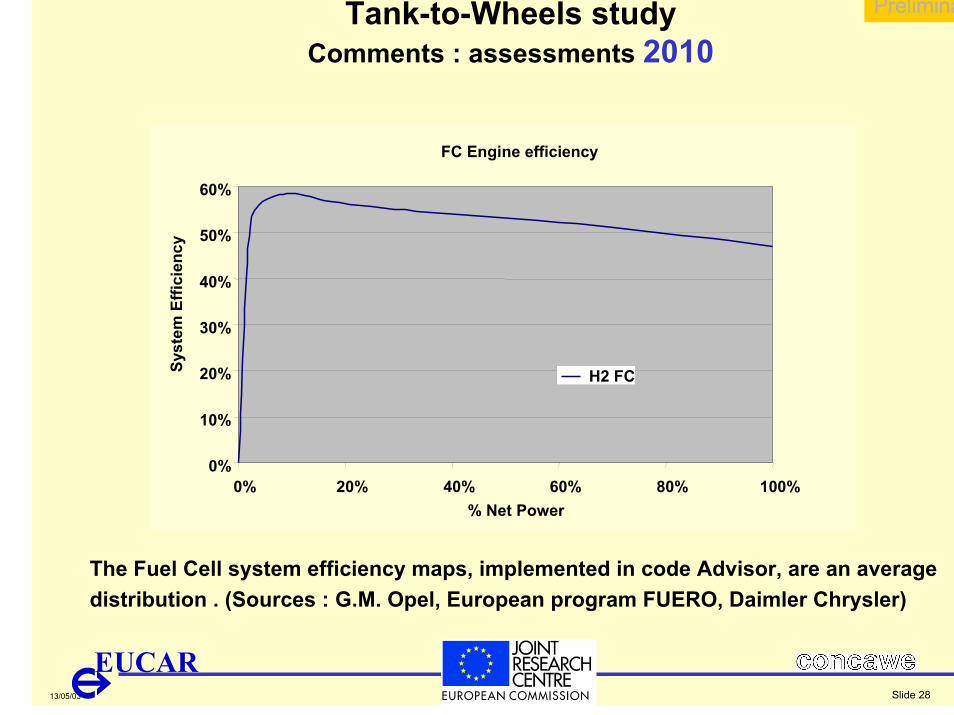
The Fuel Cell system efficiency maps, implemented in code Advisor, are an average distribution . (Sources : G.M. Opel, European program FUERO, Daimler Chrysler)

13/05/03
EUCAR
Preliminary
Slide 29
Tank-to-Wheels studyCompared Energy Efficiency
Forecas
t 201
0
Direct
H2 Fuel
Cells
Cold start N.E.D.C. PISI DIESEL CNG LH2 ICE CGH2 F.C. CGH2 Hyb. F.C.CO2 (g/km) 140 131 107 0 0 0ENERGY EFF. (MJ/100km) 190 179 191 168 94 84MASS Consump. (kg/100km) 4,43 4,17 4,23 1,40 0,78 0,70Cons. NEDC (l/100km) 2010 5,91 4,99 5,93 5,22 2,92 2,60Other G.H.G. (g/km)Methane (g/kmCO2 eq.) 0,42 0,21 0,84N2O (g/km CO2 eq 0,5 1,55 0,5 0,5GHG global g/km 140,5 133,0 108,8 0,5 0,0 0,0
MJ / km on the NEDC (cold)
0,00
0,50
1,00
1,50
2,00
2,50
PISI DIESEL DPF
CNG LH2 ICE CGH2F.C.
CGH2Hyb. F.C.
13/05/03
EUCAR
Preliminary
Slide 30
Tank-to-Wheels studyCompared G.H.G. emissions
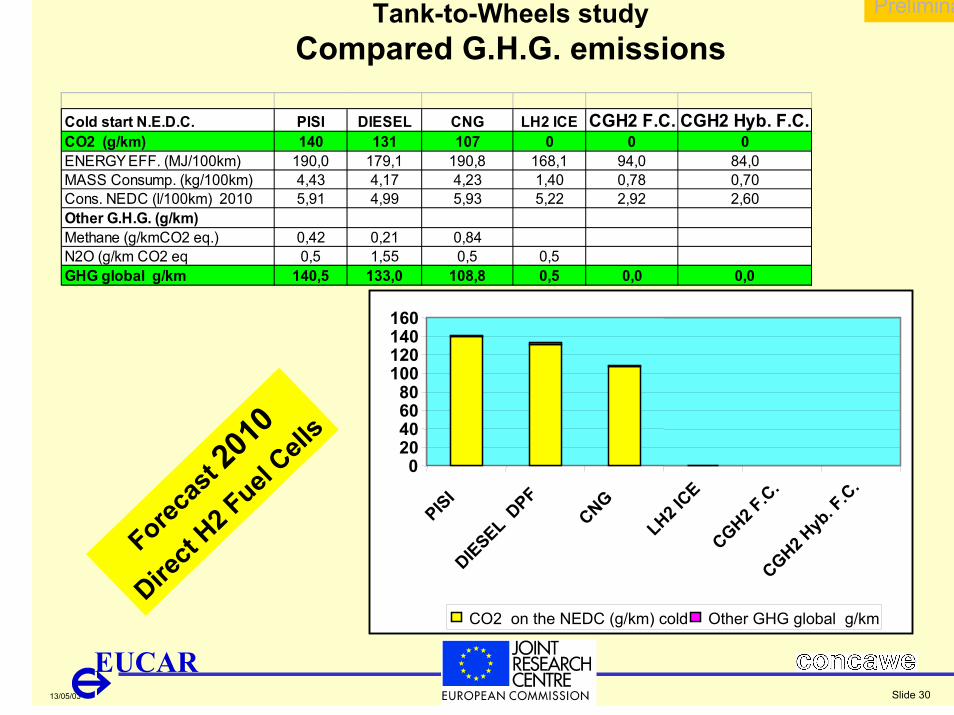
Cold start N.E.D.C. PISI DIESEL CNG LH2 ICE CGH2 F.C. CGH2 Hyb. F.C.CO2 (g/km) 140 131 107 0 0 0ENERGY EFF. (MJ/100km) 190,0 179,1 190,8 168,1 94,0 84,0MASS Consump. (kg/100km) 4,43 4,17 4,23 1,40 0,78 0,70Cons. NEDC (l/100km) 2010 5,91 4,99 5,93 5,22 2,92 2,60Other G.H.G. (g/km)Methane (g/kmCO2 eq.) 0,42 0,21 0,84N2O (g/km CO2 eq 0,5 1,55 0,5 0,5GHG global g/km 140,5 133,0 108,8 0,5 0,0 0,0
020406080
100120140160
PISIDIESEL D
PF
CNG
LH2 ICE
CGH2 F.C
.CGH2 H
yb. F
.C.
CO2 on the NEDC (g/km) cold Other GHG global g/km
Forecas
t 201
0
Direct
H2 Fuel
Cells

13/05/03
EUCAR
Preliminary
Slide 31
WELL-TO-WHEELS

13/05/03
EUCAR
Preliminary
Slide 32
Well-to-Wheels analysisSELECTED PATHWAYS
The following WTW integration aims at comparing:2002 / 2010 technologies
Gasoline, Diesel, NG Conventionals and H2 ICE, Direct & Hybrid FCFuelled by
Diesel & Gasoline Fossil FuelCNG 4000 km for Conventionals
Liquid H2LH2, NG 4000 km, central reformingLH2, remote reformingLH2, LNG, central reformingLH2, farmed wood, gasifier centralLH2, EU-mix electricity, electrolysis centralLH2, NG 4000 km, CCGT, electrolysis central
for ICE, Direct & Hybrid FC
Compressed H2CH2,NG 4000 km, on-site reformingCH2 and LH2, NG 4000 km, central reformingCH2, LNG, central reformingCH2, farmed wood, gasifier on-siteCH2, farmed wood, gasifier centralCH2, EU-mix electricity, electrolysis on-site CH2, EU-mix coal, gasifier central

13/05/03
EUCAR
Preliminary
Slide 33
Well-to-Wheels analysisICE H2 vs conventional pathways
WTW, 2010 technologies, hydrogen ICE
0.01.02.03.04.05.06.07.08.09.0
10.0
Gasoli
ne P
ISI
Gasoli
ne S
IDI
Diesel
CIDI d
pfDies
el CID
I
CNG, 400
0 km
CH2, NG 40
00 km
, ref o
n-site
CH2, NG 40
00 km
,ref c
entra
l, pipe
line
CH2, LN
G, ref c
entra
l
CH2, far
med w
ood,
gasif
ier on
-site
CH2, far
med w
ood,
gasif
ier ce
ntral
CH2, EU-m
ix ele
c, ele
ctroly
sis on
-site
CH2, Coa
l EU-m
ix, ga
sifier
LH2,
NG 4000
km, re
f cen
tral
LH2,
ref re
mote
LH2,
LNG, re
f cen
tral
LH2,
farmed
woo
d, ga
sifier
centr
al
LH2,
EU-mix
elec,
electr
olysis
centr
al
LH2,
NG 4000
km, e
lectro
lysis
centr
al
MJ/
km
2002-2010 performance rangeTTWWTT
Conventionals Liquid H2Compressed H2
ICE ICEICE

13/05/03
EUCAR
Preliminary
Slide 34
Well-to-Wheels analysisICE H2 vs conventional pathways
WTW, 2010 technologies, Hydrogen ICE
050
100150200250300350400450
Gasoli
ne P
ISI
Gasoli
ne S
IDI
Diesel
CIDI d
pfDies
el CID
I
CNG, 400
0 km
CH2, NG 40
00 km
, ref
on-si
te
CH2, NG 40
00 km
,ref c
entra
l, pipe
line
CH2, LN
G, ref
centr
al
CH2, far
med w
ood,
gasif
ier on
-site
CH2, far
med w
ood,
gasif
ier ce
ntral
CH2, EU-m
ix ele
c, ele
ctroly
sis on
-site
CH2, Coa
l EU-m
ix, ga
sifier
LH2,
NG 4000
km, re
f cen
tral
LH2,
ref re
mote
LH2,
LNG, re
f cen
tral
LH2,
farmed
woo
d, ga
sifier
centr
al
LH2,
EU-mix
elec,
electr
olysis
centr
al
LH2,
NG 4000
km, e
lectro
lysis
centr
al
g C
O2e
q/km
2002-2010 performance rangeTTWWTT
Conventionals Liquid H2Compressed H2
ICE ICEICE

13/05/03
EUCAR
Preliminary
Slide 35
Well-to-Wheels assessmentFuels / Vehicles assumptions 2010
Remarks for ICE
Highest energy use ------------------------------------------------------------------------Lowest energy use
Global Primary Energy Intensity: for all fossil energy sources, used in ICE:
LH2 > CGH2 > Conventional fuels
GHG global impact :Direct use of NG as CNG better than hydrogenHydrogen ICE more GHG-intensive than conventional engines/fuelsElectrolysis worst option unless electricity is from renewable sourceCoal could only compete with CO2 sequestration
Renewable sources obviously give best GHG but…Are there alternative use for these?

13/05/03
EUCAR
Preliminary
Slide 36
Well-to-Wheels analysisFuel Cell vs conventional pathways
WTW, 2010 technologies, hydrogen FC
0.0
1.0
2.0
3.0
4.0
5.0
6.0
Gasolin
e PISI
Gasolin
e SID
I
Diesel
CIDI d
pfDies
el CID
I
CNG, 400
0 km
CH2, NG 40
00 km
, ref o
n-site
CH2, NG 40
00 km
, ref o
n-site
, Hyb
rid
CH2, NG 40
00 km
,ref c
entra
l, pipeli
ne
CH2, LNG, re
f cen
tral
CH2, far
med woo
d, gas
ifier o
n-site
CH2, far
med woo
d, gas
ifier c
entral
CH2, EU-m
ix ele
c, elec
trolys
is on
-site
CH2, Coa
l EU-m
ix, ga
sifier
LH2,
NG 4000
km, re
f cen
tral
LH2,
ref re
mote
LH2,
LNG, re
f centr
al
LH2,
farmed
wood
, gas
ifier c
entra
l
LH2,
EU-mix
elec,
electr
olysis
centr
al
LH2,
NG 4000
km, e
lectro
lysis
centra
lM
J/km
2002-2010 performance rangeTTWWTT
Conventionals Liquid H2Compressed H2
ICE FCFC

13/05/03
EUCAR
Preliminary
Slide 37
Well-to-Wheels analysisFC vs conventional pathways
WTW, 2010 technologies, Hydrogen FC
0
50
100
150
200
250Gas
oline
PIS
I
Gasoli
ne S
IDI
Diesel
CIDI d
pfDies
el CID
I
CNG, 400
0 km
CH2, NG 40
00 km
, ref
on-si
te
CH2, NG 40
00 km
, ref
on-si
te, H
ybrid
CH2, NG 40
00 km
,ref c
entra
l, pipe
line
CH2, LN
G, ref
centr
al
CH2, far
med w
ood,
gasif
ier on
-site
CH2, far
med w
ood,
gasif
ier ce
ntral
CH2, EU-m
ix ele
c, ele
ctroly
sis on
-site
CH2, Coa
l EU-m
ix, ga
sifier
LH2,
NG 4000
km, re
f cen
tral
LH2,
ref re
mote
LH2,
LNG, re
f cen
tral
LH2,
farmed
woo
d, ga
sifier
centr
al
LH2,
EU-mix
elec,
electr
olysis
centr
al
LH2,
NG 4000
km, e
lectro
lysis
centr
al
g C
O2e
q/km
2002-2010 performance rangeTTWWTT
Conventionals Liquid H2Compressed H2
ICE FCFC

13/05/03
EUCAR
Preliminary
Slide 38
Well-to-Wheels assessmentFuels / Vehicles ICE - F.C. 2010
Remarks
Global Primary Energy Intensity: for all fossil sources:
LH2/FC ~ conventional ICEs > CH2/FC
GHG global impact :
H2 Fuel Cells, even with H2 from NG, compare favourably with conventional fuels ICE’s
Worst option remains Electrolysis from EU-mix power
Highest energy use ------------------------------------------------------------------------Lowest energy use
ICE hybrids still to be calculated