well productivity related to drilling muds: umiat …
TRANSCRIPT

I bureau of minesreport of investigations 5706
.... IP~_,l I- ,, I ,,,,I/A, I 0 11thS~11i,7; etX1I . IE l ''g~l -- · " · .':~ :::-':" :;.t-~ ;··- i· ·~:
*
WELL PRODUCTIVITY RELATEDTO DRILLING MUDS: UMIAT FIELD,NAVAL PETROLEUM RESERVE NO. 4,ALASKA
By George L. Gates and W. Hodge Caraway
1910
THE BUREAU OF ANNIVERSARY
UNITED STATES DEPARTMENT OF THE INTERIOR
I - -

S
WELL PRODUCTIVITY RELATEDTO DRILLING MUDS: UMIAT FIELD,NAVAL PETROLEUM RESERVE NO. 4,ALASKA
By George L. Gates and W. Hodge Caraway
* * * * 4 * . .* . report of investigations 5706
UNITED STATES DEPARTMENT OF THE INTERIORFred A. Seaton, Secretary
BUREAU OF MINESMarling J. Ankeny, Director

Gates, George LWell productivity related to drilling muds: Umiat Field,
Naval Petroleum Reserve No. 4, Alaska, by George L. Gatesand W. Hodge Caraway. [Washington] U.S. Dept. of the Interior,Bureau of Mines [1960]
ii, 21 p. illus., tables. 27 cm. (U. S. Bureau of Mines. Reportof investigations. 5706)
Bibliographical footnotes.
1. Petroleum engineering. 2. Drilling mud. 3. Umiat Field,NavalPetroleum Reserve, No. 4, Alaska. (Series)
[TN23.U7 no. 57061 622.06173
U. S. Dept. of the Int. Library
This publication has been cataloged as follows:
J.

CONTENTSPage
Introduction and summary .................................. 1Acknowledgments ........... .............. .................. 1General description of the area........ ..................... 2
Climate ........................ ........................ 3Length of day ................................ ....... 3Vegetation ............. ....................... 3Permafrost ..... ............................. ......... 4Geothermal gradients ................................ 4Transportation ....................................... 7
Drilling and completion data on test wells................ 7Water-base mud completions--wells 1, 2, and 3 ........ 7
Description of reservoir rocks...... ............ 9Drilling mud................................ 9
Cable-tool completions--wells 4, 6, 8, and 10 ........ 9Drilling mud ..................................... 9Well 7 ... ........................................ 9
Emulsion-mud completion--well 11 ................... 10Drilling mud .... ........................... 10
Cable-tool completion followed by wall scraping usingcrude oil--well 5 .................................. 10
Oil-base mud completion--well 9 ...................... 11Drilling mud.. ................. ..... *... 11Swabbing and pumping tests...................... 11Effect of water on permeability of core samples
from well 9............... . ........ ...... 13Volume of drilling mud filtrate in cores from
well 9......................... .. ........... 16Discussion of results .................................... 16
Comparison of wells 2 and 5........................ 17Unusual features of well 9........................... 18Effect of water on relative permeability to oil...... 18Formation pressure ................................... 19Low formation temperatures ........................... 19
Properties of the crude oil ................... ....... . 20Basic well data...... .......................... 20

ii
ILLUSTRATIONS
Fig. Page
1. Umiat field and Naval Petroleum Reserve No. 4 innorthern Alaska..................... ................ 2
2. Permafrost zones in Alaska, showing location of NavalPetroleum Reserve No. 4 and Umiat field.... ......... 5
3. Temperature-depth relation in permafrost zone ofwell 6 ................. . .................. 6
4. Well location map, Umiat field, Alaska.. .............. 85. Permeability of core samples to oil and water ......... 146. Production capacity of Umiat wells related to drilling
mud ....... . ....... .... ............ ....... 187. Effect of water content of sands on permeability to
oil ................................................. .19
TABLES
1. Properties of oil-base drilling mud used in Umiatwell 9............... .. . .. .. ... . . . ..... . 12
2. Permeability of well 9 core samples to oil and water.. 153. Permeability of selected Umiat 9 cores to air, salt
water, and fresh water ..... ..... .............. 164. Drilling and production data, Umiat field, Alaska,
1944-53.. ..... ...................................... 17
,.
-

WELL PRODUCTIVITY RELATED TO DRILLING MUDS:UMIAT FIELD, NAVAL PETROLEUM
RESERVE NO. 4, ALASKA-/
by
George L. Gates 2/ and W. Hodge Caraway-/
INTRODUCTION AND SUMMARY
This report presents an evaluation by the Federal Bureau of Mines of theeffect of clay-water, brine, and oil-base drilling fluids on the productivityof test wells drilled on the Umiat anticline in U.S. Naval Petroleum ReserveNo. 4 in northern Alaska. Eleven wells were drilled on the Umiat structureas part of the U.S. Navy's extensive exploration of the Reserve during 1944-53to determine the possibilities for oil production. The Federal GeologicalSurvey cooperated in the exploration program and has published a comprehensivereport3/ on the geology of the area and case histories of the wells. The re-port also includes the results of special studies by the Bureau in connectionwith the drilling and coring of well 9 with oil-base mud in the hole and wasthe source of much of the information used in preparing this publication.
Of the eleven wells, four were drilled with rotary tools and water-basemud (one of the water-base muds was an oil-in-water emulsion mud), five weredrilled with cable tools with brine in the hole, one was drilled with cabletools with brine in the hole and later reamed with rotary tools and crude oil,and one was drilled with rotary tools and oil-base mud. Although all of thewells penetrated sandstones that contained oil and gas, some were productiveand others were not. The latter two wells, one completed with crude oil inthe hole (with some added brine) and the other with oil-base mud, had thegreatest productive capacities. The wells drilled with cable tools and brinein the hole had lower productive capacities. In contrast, two of three wellscompleted with rotary methods and fresh-water drilling mud and the well com-pleted with rotary and emulsion mud were unproductive.
ACKNOWLEDGMENTS
Grateful acknowledgment is made to members of the Alaska Branch of theFederal Geological Survey, headed by George 0. Gates, who supplied helpfulinformation used in preparing this report.
1/ Work on manuscript completed November 1959.2/ Petroleum engineer, Bureau of Mines, San Francisco, Calif.3/ Collins, Florence Rucker, Bergquist, Harlan R., Brewer, Max C., and Gates,
George L., Test Wells, Umiat Area, Alaska: Geol. Survey Prof. Paper305-B, 1958, pp. 71-206.

r�
2
GENERAL DESCRIPTION OF THE AREA
The Umiat area (fig. 1) is in the southeastern part of the Reserve on theArctic slope. The arctic slope is bounded on the south by the crest of theBrooks Range and on the north by the Arctic Ocean. The Brooks Range, theAlaskan counterpart of the Rocky Mountains, comprises several groups of rugged,glaciated mountains having a relief of 3,000 to 6,000 feet and maximum alti-tudes of 3,600 to 9,200 feet. Anaktuvuk Pass (2,200 feet) is the highestelevation on the land route between Fairbanks and the Arctic plain.
The Arctic coastal plain is characterized by abundant lakes, swampy areas,wet tundra, meandering streams and--during the summer--hordes of hungry mos-quitoes. Local relief rarely exceeds 100 feet; however, the surface of theUmiat anticline is marked by a maximum relief of about 500 feet.
- - ,,, go - -
50 0 50 100 150Scale, milesScale, miles
1320
FIGURE 1. - Umiat Field and Naval Petroleum Reserve No. 4 in Northern Alaska.(Adapted From Federal Geological Survey Outline Map.)

1
3
The Umiat anticline is about 150 miles southeast of Point Barrow (fig. 1).The anticline is about 10 miles long, 3 miles wide; the axis trends east andwest and the structure has more than 800 feet of closure. It is the highestpart in a structural trend extending many miles beyond the limits of theclosed anticline and its limits were defined by field and photogeologic map-ping. Seismic data on the region are also available.
The oil-productive sand in this area is the Grandstand formation ofCretaceous age. Most of this formation is within the designated zone of con-tinuous permafrost. It is not known that all of the producing formation iscolder than the freezing temperature of the interstitial brine. Nearly water-free oil, produced from this sandstone, indicates that the interstitial wateris virtually immobile.
Climate
The climate on the Arctic slope is cloudy, cold, and sometimes windy.The annual mean temperature is 10.8° F. at Umiat. The maximum recorded tem-perature at Umiat is 79° F. and the minimum is -57° F. At Barrow the warmestmonth, July, has an average of 13 days with freezing temperatures. Mean an-nual precipitation is 5.4 inches at Umiat. Half of the precipitation is de-rived from rainfall during July, August, and September. Annual snowfall isabout 33 inches at Umiat. Low temperatures, high humidities, and cloudyskies minimize the rate of evaporation and tend to conserve the small totalprecipitation for surface and ground-water supplies. In contrast to northernAlaska precipitation, the average annual precipitation in southeastern Alaskais about 100 inches.
Length of Day
At the Arctic Circle on the shortest day of the year the sun touches thesouthern horizon at noon, then drops from sight. Below the Arctic Circle thesun rises a correspondingly longer time, but farther north it stays below therim of the horizon on this day. For instance, on December 21 at Fairbanks,about 2.5 degrees south of the circle the sun rises at 9:58 a.m. and sets at1:40 p.m. At Barrow, about 4 degrees north of the circle, the sun is not seenfrom late November until late January. In summer the length of the days isthe reverse of the winter.
Vegetation
The Arctic slope lies beyond the northern limit of the spruce. Smallwillows and scattered alders grow along the channels of some of the streamsin the southern part of the region. Tundra consisting primarily of dwarfshrubs, grasses, sedges, lichens, and herbaceous plants cover a large partof the other areas.

�_���_ .___
4
Permafrost
One of the important characteristics of the region to be considered indrilling and producing operations is the permafrost. This area of subground-level ice is discussed in detail by Hopkins, Karlstrom, and others.4/
Permafrost has been defined by MullerS/ as "a thickness of soil or othersurficial deposit or even of bedrock, at a variable depth beneath the surfaceof the earth in which a temperature below freezing has existed continuouslyfor a long time (from two to tens of thousands of years)."
The four permafrost zones in Alaska (fig. 2) are not rigidly defined andtheir boundaries are arbitrarily drawn. The ground is perennially frozennearly everywhere in the continuous-permafrost zone; unfrozen ground is foundonly at a few widely scattered sites. As shown in figure 2, the Umiat area isentirely within the continuous-permafrost zone. Perennially frozen ground isless widely distributed in the discontinuous-permafrost zone, and areas of un-frozen ground predominate in the southern part. In the sporadic-permafrostzone perennially frozen ground is confined to isolated sites where vegetation,topography, soil, and drainage permit its continued existence or its forma-tion. Permafrost also is encountered locally in the no-permafrost zone, butit is so rare that it has little influence on the landscape. or humanactivities.
Permafrost is affected locally by subsurface drainage and surface insula-tion. In the rigorous climate of northern Alaska local differences in theseconditions generally result only in differences in the depth to permafrost.Permafrost is affected by lakes, ponds, and streams which have appreciableheat capacity.
Permafrost is present nearly everywhere beneath the Arctic slope ofAlaska. Frozen ground generally extends to a depth of about 1,000 feet inthis area. The permafrost lies at considerable depth or may be absent undermajor rivers, such as the Colville, which flows throughout the winter and hasflood plains several thousand feet wide. Permafrost also lies at considerabledepth or is absent beneath most lakes deeper than 8 feet and wider than 2,000feet.
Geothermal Gradients
The geothermal profile or depth-temperature relation in well 6 is shownin figure 3. This survey was made by the Federal Geological Survey by placingthermistor cables in the bore for a period of about one year (10 months) aftercompletion and abandonment of the hole.
4/ Hopkins, David M., Karlstrom, N. V., and others, Permafrost and GroundWater in Alaska: Geol. Survey Prof. Paper 264-F, 1955, pp. 113-146.
5/ Muller, S. W., Permafrost or Permanently Frozen Ground and RelatedEngineering Problems: J. W. Edwards, Inc., 1947, 231 pp.

rI
FIGURE 2. - Permafrost Zones in Alaska, Showing Location of Naval PetroleumReserve No. 4 and Umiat Field.
(Adapted From Federal Geological Survey Prof. Paper 264-F.) m

100
200
- 300
I-a-LL.
a 400
500
600
Ann
6
TEMPERATURE, °F The geothermal gradient
o!4 16 18 20 22 24 26 28 30 32 in well 9 shows an increase of,14 16 18 20 22 24 26 28 30 32I I I | I I i I I- 1" C. per 135 feet (1.33" F.
per 100 feet) of depth fromapproximately 100 to 870 feet.This is the largest gradientfound in the Umiat area. Thegeothermal gradient at wells 4and 6 is approximately 115feet per degree Centigrade(1.56° F. per 100 feet) forsimilar depths.
A short extrapolation ofthe thermal profile in well 9on Oct. 13, 1953 indicated adepth of permafrost of 1,055feet. This thickness of perma-frost is approximately 150 feetgreater than that found at anyof the other Umiat wells wheretemperature measurements havebeen made.
A Schlumberger temperaturesurvey was run in well 2 whenthe final electrical log wasrun. The lowest recorded tem-perature was 40.5° F. at 260feet. Above that depth thetemperature was about 42° F.It fluctuated slightly around43° F. between 310 and 525feet and increased graduallywith depth to 104° F. at 6,198feet. These well temperaturesare htiher than the undisturbedL~ vu --
temperatures found in a temper-FIGURE 3. - Temperature-Depth Relation in Permafrost ature study in a well drilled
Zone of Well 6 (data from Geol. Survey). near Barrow, Alaska.6/ Thewarming of the formations is
the result of friction developed in the drilling operation and the circulationof relatively warm mud during drilling.
The method used to obtain the temperatures has been described by Brewer.-/
6/ Lachenbruch, Arthur H., Brewer, Max C., Dissipation of the TemperatureEffect of Drilling as Well in Arctic Alaska: Federal Geological SurveyBull. 1083-C, 1959, 109 pp.
7/ Brewer, Max C., Some Results of Geothermal Investigations of Permafrost inNorthern Alaska: Trans. American Geophysical Union, vol. 39, No. 1,Feb. 1958, pp. 19-26.

The first U.S.S.R. oil deposits in permafrost were found in Nordvik,Siberia, where the permafrost was 540 meters (1,770 feet) deep and the rocktemperature was -12.7° C. (+9.2° F.) at a depth of 56-60 meters (184-197feet).8/
Transportation
Development of this area is greatly dependent on air travel. Point Barrowhas a hard-surfaced airstrip and Umiat has a gravel airstrip. Lakes suitablefor float planes are not abundant, however, a few such lakes are in the area.Ships can reach Point Barrow about three months of the year.
Tracked vehicles such as weasels are suitable for use in this region. Inthe winter sleds pulled by tractors on tracks are well suited for haulingequipment in the Arctic Coastal plain and the Arctic foothills when the groundis covered with snow.
DRILLING AND COMPLETION DATA ON TEST WELLS
The eleven wells drilled are considered in groups to point out importantdifferences in drilling and completion practices that could have affected theproductivity of the wells. A map of the well locations is shown in figure 4.
Water-Base Mud Completions--Wells 1, 2 and 3
The first and least productive group, comprising wells 1, 2, and 3, weredrilled with rotary tools using water-base drilling mud. Well 1 was drilledabout 5 miles west of 2 and 3, and oil-bearing formations were logged in eachwell. Formation tests were made either by bailing or running a packer on2-1/2-inch tubing and swabbing. Wells 1 and 2 were dry and well 3 producedoil at a rate of about 24 barrels per day.
Evidence of the presence of petroleum in formations penetrated by thesethree holes was observed during drilling. Additional evidence of oil and gasin well 2 was obtained when the hole was being prepared for a temperature sur-vey after it had been drilled to 6,212 feet. The Grandstand formation wasfound between 365 and 1,060 feet in this hole. Preparatory to the temperaturesurvey, well 2 was bailed to 950 feet. When the blowout preventers were re-moved a small gas flow was noted. In preparation for a gas-flow test the holewas found to contain liquid at 730 feet. The hole was bailed to 1,075 feetand the gas flow, as measured by means of a Pitot tube and a water manometer,was estimated at 15,000 cubic feet per day. The gas contained 82 percentmethane, 16 percent heavier hydrocarbons, and 1.7 percent carbon dioxide.Natural gas containing such a large quantity (16 percent) of hydrocarbonsheavier than methane generally is associated with crude oil in the formation.
7
8/ Lappo, V. I. (Petroleum Occurrence in Nordvik (IfURUNG-TUMUS): Neftfanoemestorozhdenie Nordvik (lUrung-Tumus): Nedra Arktiki, vol. 1, 1946,pp. 74-129.

0c
FIGURE 4. - Well Location Map, Umiat Field, Alaska.(Adapted From Geol. Survey Prof. Paper305-B, Test Wells, Umiat Area, Alaska.)

Well 2 is of particular interest because of its proximity to well 5 whichhad good productivity. This relationship is discussed in detail later in thisreport.
Description of Reservoir Rocks
A study2/ of thin sections from cores from these wells showed that thefine Graywacke sandstone was not well sorted and that it was composed pri-marily of angular quartz grains. Authigenic illite was present, surroundingand partly replacing some quartz grains as coatings or elongate masses. AnX-ray diffraction pattern of the material through 325-mesh sieve showed thatit was composed of quartz and illite with small amounts of montmorillonite,albite, kaolinite, and chlorite. The pore space was lined with a thin coatingof clay minerals, mostly illites.
Drilling Mud
The drilling mud used in wells 1, 2, and 3 was a water-base mud contain-ing Wyoming bentonite, to which only a little lost circulation material andchemicals were added to control cement contamination. The density of the mudranged from about 72 to 85 pounds per cubic foot. The API funnel viscosityranged from about 33 to 40 seconds. The API filtrate volume ranged from about17 to 7.0 milliliters.
Cable-Tool Completions--Wells 4, 6, 8, and 10
Several wells were drilled with cable tools after the first three holesdrilled with rotary tools and water-base mud were unproductive (although oiland gas shows were observed). A sodium chloride brine was used to minimizethe invasion of water into the formation and possible swelling of the clayminerals observed in the oil-bearing sandstones. Sloughing was common indrilling these holes and it retarded drilling. Good showings of oil and gaswere observed in this group of wells and the average oil productivity wasabout 78 barrels per well per day. Most of the production testing was doneby bailing which would result in lower than normal productivity when comparedwith testing by pumping.
Drilling Mud
The brine drilling muds were prepared by adding about 35 pounds of sodiumchloride to each barrel of water. This lowered the freezing temperature ofthe solution below that of the minimum permafrost. The objective was to pre-vent freezing of the brine filtrate in the cold petroleum reservoir rocks andto minimize the swelling of clay minerals.
Well 7
Well 7 was drilled with cable tools and brine drilling mud. Sandstonescontaining oil and gas were penetrated and considerable water was produced in
9/ Work cited in footnote 3, p. 1.
9

10
the bailing tests. Small quantities of oil and gas were recovered by bailing.Based on the meager information available, some investigators believed thiswell to be below the edgewater in this reservoir.
Emulsion Mud Completion--Well 11
Well 11 was drilled to test the production possibilities of the sand-stones of the Grandstand formation on the northern downthrow side of a faultthat parallels the axis of the structure. The hole was drilled with rotarytools using an oil-in-water emulsion mud which had a water filtrate. Oil andgas shows were noted in the permeable sandstones penetrated, but no commercialproduction was indicated in eleven formation tests.
Drilling Mud
The drilling mud had an API filgrate volume of about 2.0 milliliter (ml),an API funnel viscosity of about 100 seconds, a weight density of about 85pounds per cubic foot, and about 30 percent (by volume) of Umiat crude oilwhich had the fractions boiling below 325° F. removed.
Cable-Tool Completion Followed by Wall ScrapingUsing Crude Oil--Well 5
Well 5, 175 feet east and 97 feet north of well 2, was drilled with cabletools using 5-7/8-inch bits and brine drilling water. Bailing tests showedthe presence of oil and gas. When the depth reached 615 feet a pump was in-stalled to test the productive capacity of the well. In a test that lasted15 days production averaged about 70 barrels of clean oil per day. Drillingwith cable tools was continued to 1,075 feet, using a brine containing 40 to50 pounds of sodium chloride per barrel of water.
Tubing was run for a swabbing test. A packer set at 630 feet was used toshut off liquids from sands that had been tested at a depth of 615 feet. Afterthe drilling water was swabbed from the hole, oil flowed at the rate of 10 to16 barrels per hour for short periods. Flow stopped several times; apparentlyresulting from restricted flow into the well bore or from the formation of icein the tubing at shallow depths. The tubing was pulled, the rig removed inSeptember 1950, and the well was shut in for the winter.
In April 1951 a rotary rig was moved in place. The hole was cleaned outand reamed in an effort to stimulate production. Circulation was lost andsome brine was added to the crude-oil drilling fluid to restore circulation.The hole was reamed to 9-1/2 and 10-1/4 inches in the sandstone sectionspenetrated by the bit.
During alternate reaming and swabbing tests from May 21 to June 17 thefirst liquids recovered were brine and crude oil used for circulation whilereaming. In the last part of the reaming operation, fresh crude oil wasswabbed from the hole at an estimated rate of 400 barrels per day. One ofthe first samples of oil recovered contained 4.7 percent water and 0.1 percentsediment.

A pump with an electrical heater attached to the bottom of the tubing wasset at 1,055 feet. In a 93-day pumping test the maximum production rate wasabout 400 barrels per day. However, the pump was too small to test the fullproductive capacity of the well. The water content of the 35.5° API gravityoil decreased from 1.35 to 0.4 percent. The temperature of the oil in theflow line ranged from 27° to 28° F.
Oil-Base Mud Completion--Well 9
Well 9, about two miles west of well 2, was drilled with a rotary rig.Core analyses indicated that this well penetrated a sandstone with appreciableporosity, permeability, and oil content.
Drilling Mud
Water-base mud was used to 209 feet. Below 209 feet to 1,257 feet, anoil-base mud was used to prevent the infiltration of water from a water-basemud into the formations penetrated and to provide cores uncontaminated by waterfrom the mud. The mud contained a chemical tracer that was soluble in oil, in-soluble in water, and unaffected by bacteria, to determine the volume of oilfiltrate that entered the cores. The tracer was an organic chloride compoundcontaining about 54 percent chlorine by weight. The method for following thevolume of tracer-bearing filtrate has been described in detail. 0/
The oil-base mud was composed of diesel oil, a low-gravity crude oil fromFish Creek test well 1, Ken-Oil concentrate, and some unslaked lime. Additionof the concentrate and/or the heavy crude oil increased the viscosity of themud, whereas, addition of diesel oil decreased viscosity. Gel strength wasincreased by adding the concentrate and lime, which also decreased the filterrate. The mud weight was kept low to minimize the flow of drilling mud fil-trate into the formations. To keep the weight low, it was necessary to reducethe viscosity to less than 50 seconds API funnel viscosity at about 45° F.Cuttings would not drop from suspension otherwise, as no vibrating screen wasavailable during drilling.
The properties of the drilling mud are listed in table 1.
Swabbing and Pumping Tests
Three formation tests in both the upper and lower sandstone sections inthe Grandstand formation were made by swabbing through 2-1/2-inch tubing forabout 4 hours. A cone packer set above different sections of the formation wasused but no oil was produced. The Grandstand formation was found in this holebetween 425 and 1,090 feet. The first swabbing test was made with the holeopen from 476 to 533 feet. The second swabbing test was made with the holeopen from 866 to 901 feet. The third test was made with the hole open from959 to 1,017 feet.
11
10/ Gates, George L., Morris, Frank C., and Caraway, W. Hodge, Effect of Oil-Base Drilling Fluid Filtrate on Analysis of Cores From South ColesLevee, Calif., and Rangely, Colo., Fields: Bureau of Mines Rept. ofInvestigations 4716, 1950, 25 pp.

P-
TABLE 1. - Properties of oil-base drilling mud used in Umiat well 9
Drilling fluid Drilling fluidAPI funnel filtrate
Core Core Filtrate viscosity, Water TracerNo. interval, volume, Water content (1 quart out) content, concen-
feet mg./30 min. Weight density Weight- Volume- Time, Temperature, weight- tration,45° F. 75° F. lb./gal. lb./ft.3 percent percent seconds °F. percent mg./ml.
374-384 0 - 8.6 64.5 10.95 11.34 95 61 - -4 413-423 0 9 8.8 66.0 8.85 9.38 79 50 - 14.29 464-474 1.3 12 9.0 67.0 9.08 9.77 83 48 1.05 14.710 474-484 1.1 10 9.1 68.0 9.07 9.90 85 45 1.07 14.311 484-494 1.1 10 9.2 69.0 8.76 9.70 95 46 0.33 14.315 502-512 1.1 12 9.4 70.0 8.59 9.65 90 44 0.82 14.123 573-583 5.2 16 9.8 73.0 6.92 8.11 72 45 0.16 10.438 858-868 20.0 29 10.2 76.0 3.65 4.45 76 48 0 4.539 868-878 20.0 30 10.3 77.0 3.57 4.41 69 47 l/ 18.540 878-888 20.0 27 10.3 77.0 3.64 4.50 69 47 do. 17.741 888-898 20.0 34 10.4 78.0 3.71 4.64 69 46 do. 21.742 898-901 20.0 33 10.4 78.0 3.72 4.65 69 46 do. 17.543 901-911 21.0 36 10.3 77.0 4.03 4.98 59 45 do. 15.648 949-959 21.0 38 10.4 77.5 4.02 5.00 60 46 do. 15.349 959-969 21.0 42 10.4 77.5 4.29 5.37 60 46 do. 14.650 969-979 6.4 12 10.4 78.0 4.33 5.42 59.5 46 do. 13.852 989.5-1,000 7.9 14 10.5 78.5 4.54 5.72 57.0 46 do. 13.453 1,000-1,010 7.9 10 10.5 78.5 4.67 5.88 57.0 46 do. 12.854 1,010-1,017 - 13 10.4 78.0 4.41 5.52 57.0 46 0 13.257 1,037-1,047 3.4 7 10.2 76.5 5.01 6.15 53.0 41 - 10.658 1,047-1,057 2.2 - - 72.0 - - 52.0 42 -59 1,057-1,067 3.0 - - 72.0 - - 46.0 42 - -61 1,077-1,086 1.9 - - 59.5 - - 42.0 45 - -62 1,086-1,096 4.1 - - 59.5 - - 44.0 42 - -67 1,137-1,147 2.0 - - 60.5 - - 48.0 40 - -
I/ The drilling-tluid filtrates trom drilling fluid sampleswater content of the combined samples was negligible.
39, 4U, 42, 43, 48, and 49 were combined, and the

U
After the third formation test, the hole was reamed with 7-7/8-inch bitsto total depth of 1,257 feet. Two-inch tubing was run to 1,247 feet and theoil-base mud was swabbed from the hole and pumped into storage tanks. Shortlybefore all of the mud was swabbed from the hole, crude oil flowed into thehole. After twelve hours of swabbing no trace of oil-base mud was detectedin the produced oil. Two hundred barrels of crude oil were swabbed in 15hours. When swabbing was stopped, for lack of storage space, the liquid levelrose to 50 feet from the surface. A subsequent pumping test of 6-1/2 weeksindicated a maximum productivity of approximately 300 barrels per day of cleanoil.
Following the pumping test the well was plugged back, in stages, to 400feet from the surface in an effort to determine the source of the oil. Thisprocedure was partly successful in disclosing the productive sands. Thecement plug was then drilled out to 1,077 feet using reverse circulationwith oil as the drilling liquid. From that depth to bottom, 1,257 feet,brine containing 40 pounds of salt per barrel of water was used in drillingout the cement. Circulation was lost several times and cleaning the holewas difficult.
A string of 5-1/2-inch casing was cemented at 1,257 feet, total depth.The pipe was perforated repeatedly opposite the permeable sandstones but nooil entered the hole, even after swabbing, for periods longer than a week.The pore space around the well bore was blocked to the flow of crude oil andapparently the blocked area could not be penetrated by gun perforating.
Effect of Water on Permeability of Core SamplesFrom Well 9
A series of tests was made to study the effect of water on the permeabil-ity of cores from the Grandstand formation. The effect of invasion of thesandstone by water from a fresh-water drilling mud was simulated. In thisseries of tests at room temperature one sample from each of four cores wasselected. The cores had been sealed in cans at the well. The four selectedsamples containing the interstitial water and oil, present in the cores whenthey came from the core barrel, were mounted in low-temperature-settingplastic inert to both water and kerosine. The permeability of these foursamples to kerosine was measured without cleaning the samples. The initialwater and oil contents were not changed except that the crude oil was dis-placed by kerosine. The same unextracted core samples were then used indetermining the permeability to fresh water. Note in table 2 that only one ofthe samples had measurable permeability to water. However, a small volume ofwater entered the three samples that were impermeable to the water. The sam-ples were left in water overnight. Entrance of water into the core samplesis analogous to exposure of the wall of the bore hole to fresh water fromdrilling mud during completion of the well. Following the contact of thecores with water, the permeability to kerosine was determined again and oilwas flowed through the samples for several hours, apparently flushing partof the invasion water from the core sample. The results are shown graphicallyin figure 5 and are listed in table 2.
13

14
2
I
.--J
0
20
a
c-
a_
Q-
I
I00
150
100
50
0871.5 --
0
0
.-
a,a,E
1.
3
0:t
4=-
-
Ea.D-
oL
{0*S.0
D Permeability to water
D Permeability to oil
o 0.0-
4-
a,E
a.
.15
a,EL.Qa
- 977 --- 995876.5CORE DEPTH, feet
FIGURE 5. - Permeability of Core Samples to Oil and Water.
The observed reduction in permeability to oil after water invaded thecore sample is believed to be, primarily, the result of the relative perme-ability changes.
When water entered the pore space the permeability to oil was reduced.Apparently when oil was flowed through the core some of the invasion waterremained in the pore space. The core samples were left in water overnightso that the clays in the sandstone would have ample time to become fully hy-drated. Overnight may not have been long enough for complete hydration be-cause some clays required several days to reach equilibrium. In evaluationof drilling-mud clays the American Petroleum Institute Recommended Practice29, May 1957, the minimum time for hydration of bentonite is 72 hours.
f

TABLE 2. - Permeability of well 9 core samples to oil and water
Sample from--feet871.5 | 876.5 977 I 995
Permeability before soaking, md.
Oil (water phase remained immobile)............ 206.0 56.5 24.0 2.1Water (oil phase remained immobile)........... 78.1 .0 .0 .0
Oil permeability after soaking overnight in water, md.
Immediately after removal ...................... 31.4 - -30 minutes after beginning test ................ 37.9 - 10.81 hour after beginning test.................... - 8.9 - -2 hours after beginning test..................... - - - 0.32-1/4 hours after beginning test............... - 13.4 - -3 hours after beginning test ................... - - 13.44-1/2 hours after beginning test............... 56.6 - -6 hours after beginning test........ .......... - - - .6
Six samples having a range of permeabilities were selected to determinethe relative effects of air, oil, salt water, and fresh water on the perme-ability of extracted cores. The samples were cleaned by extraction with tolu-ene to remove the water and oil simultaneously. The permeability to dry airwas measured, cores were saturated with oil, and the oil permeability was de-termined. As shown in table 3 the two values were nearly the same. The coresamples were cleaned of oil by toluene extraction again and then saturatedwith 0.5 N sodium chloride solution. The permeability to this solution wasfound to be less than the previously determined values. Finally the perme-ability to distilled water was measured and found to be less than any of theprevious permeabilities. This change in permeability indicates that the freshwater entered the cores to lower the permeability as shown in figure 5. Simi-lar reduction in permeability of Umiat cores was found by Yusterll/ andBaptist.l2/ This permeability reduction is independent of reduction thatmay have been caused by freezing of fresh-water filtrate in the pore channels.
When the formation tests in well 9 indicated no producible crude oil al-though the cores contained crude oil and gas, a study was made to determinethe effect of the low formation temperature on the filtrate from the oil-basemud. A sample of filtrate from the mud was blended with crude oil and placedin the camp refrigerator for several days. The refrigerator was maintainedat 8° F., which is 10° F. below the lowest permafrost temperature measured inthis hole. Neither the filtrate nor the blends of filtrate with crude oilgelled at this temperature, indicating that filtrate from the oil-base mudwas not blocking the pore channels of the formation by the formation of a gel.
15
11/ Yuster, S. T., Oil and Gas Investigations Map OM 126 (in 3 sheets)sheet 2: Geol. Survey, 1951.
12/ Baptist, 0. C., Oil Production From Frozen Reservoir Rocks, Umiat, Alaska:Jour. Petrol. Technol., vol. 11, No. 11, Nov. 1959, pp. 85-88.

16
TABLE 3. - Permeability of selected Umiat 9 cores to air,salt water. and fresh water
Permeability in millidarcys to--0.5 normal
Depth (feet) Dry air Oil sodium chloride Distilled____________________solution./ water
866-867 ................................ 22 18 15 13867-868......................... 31 34 32 30873-874......................... 270 260 250 200875-876......................... 150 160 140 120880-881......................... 140 150 130 100907-908 ......................... 54 54 35 261/ Samples were extracted and dried before permeability to salt water was
determined.
Volume of Drilling Mud Filtrate in Cores From Well 9
A tracer was added to the drilling mud to obtain a quantitative measureof the volume of filtrate from the oil-base drilling mud that entered the porespace of the cores. This tracer was soluble in oil, insoluble in water, andnot affected by bacteria. Analysis of the oil extracted from the cores wasmade by a chemical method that has been described previously. 13 / The resultsindicated that about 3 percent of the pore space in the permeable sectionscontained filtrate from the oil-base mud.
DISCUSSION OF RESULTS
Drilling and production data for the eleven test wells in the Umiat fieldare summarized in table 4 and shown in figure 6. The results indicate thatthe use of clay-water and clay-brine completion fluids damaged the productiv-ity of some of the wells. This damage was a result of reduction in perme-ability of the sand at the well bore by the invasion of filtrates from thedrilling fluids.
The two best wells in the field were completed with oil-base mud. Thesewells were approximately two miles apart. Four wells completed with brine mud(using cable tools) had a productivity of about 78 barrels of oil per day. Incontrast, three wells drilled with water-base mud also penetrated oil-bearing(not necessarily oil-productive) sandstones, but none was completed asproducers.
Information on the wells drilled indicates that all of the wells pene-trated oil-bearing sandstones and the correlation between the type of drillingfluid used and the well productivity has been shown. However, any study ofwell completion practices is difficult because generally a well can be com-pleted only once and the productivity attainable by any other method is a
13/ Gates, George L., Morris, Frank C., and Caraway, W. Hodge, Effect of Oil-Base Drilling Fluid Filtrate on Analysis of Cores From South ColesLevee, Calif., and Rangely, Colo., Fields: Bureau of Mines Rept. ofInvestigations 4716, 1950, 25 pp.
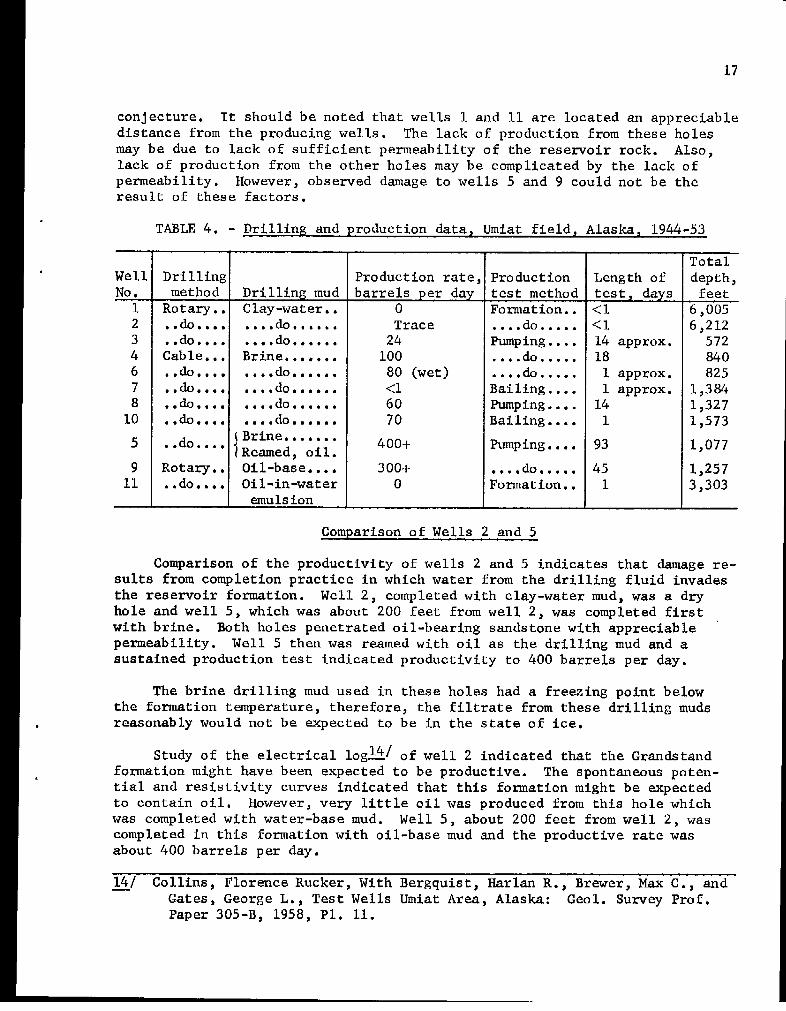
conjecture. It should be noted that wells 1 and 11 are located an appreciabledistance from the producing wells. The lack of production from these holesmay be due to lack of sufficient permeability of the reservoir rock. Also,lack of production from the other holes may be complicated by the lack ofpermeability. However, observed damage to wells 5 and 9 could not be theresult of these factors.
TABLE 4. - Drilling and production data, Umiat field, Alaska, 1944-53
TotalWell Drilling Production rate, Production Length of depth,No. method Drilling mud barrels per day test method test, days feet
1 Rotary.. Clay-water.. 0 Formation.. <1 6,0052 ..do.... ....do.... Trace ....do..... <1 6,2123 ..do........do...... 24 Pumping .... 14 approx. 5724 Cable... Brine....... 100 ....do..... 18 8406 .. do........ do...... 80 (wet) ....do..... 1 approx. 8257 ..do.... . . <1 Bailing .... 1 approx. 1,3848 ..do.... ....do..... 60 Pumping.... 14 1,32710 ..do........ do ..... 70 Bailing .... 1 1,573
5 ..do ... Brine ... 400+. Pumping.... 93 1,077'Reamed, oil.
9 Rotary.. Oil-base.... 300+ ....do..... 45 1,25711 ..do.... Oil-in-water 0 Formation.. 1 3,303
_____ emulsion _____
Comparison of Wells 2 and 5
Comparison of the productivity of wells 2 and 5 indicates that damage re-sults from completion practice in which water from the drilling fluid invadesthe reservoir formation. Well 2, completed with clay-water mud, was a dryhole and well 5, which was about 200 feet from well 2, was completed firstwith brine. Both holes penetrated oil-bearing sandstone with appreciablepermeability. Well 5 then was reamed with oil as the drilling mud and asustained production test indicated productivity to 400 barrels per day.
The brine drilling mud used in these holes had a freezing point belowthe formation temperature, therefore, the filtrate from these drilling mudsreasonably would not be expected to be in the state of ice.
Study of the electrical logl 4 / of well 2 indicated that the Grandstandformation might have been expected to be productive. The spontaneous poten-tial and resistivity curves indicated that this formation might be expectedto contain oil. However, very little oil was produced from this hole whichwas completed with water-base mud. Well 5, about 200 feet from well 2, wascompleted in this formation with oil-base mud and the productive rate wasabout 400 barrels per day.
14/ Collins, Florence Rucker, With Bergquist, Harlan R., Brewer, Max C., andGates, George L., Test Wells Umiat Area, Alaska: Geol. Survey Prof.Paper 305-B, 1958, P1. 11.
17

400
.0
x 300
soo
|200o
3a00
n- 100-.
IOO
1-
- 1 Salt-water
l Clay-water
18
II II II
II
a Oil-base drilling mud completion
II II
I
0.
34 c
a
IIC
I.07)a
c>
C,
r_0.o
Ea)
0
I
n
I/
A5
I
*
1 2 3 1 1 4 6
0L.a
8
7 8 10 9nv
WELL NUMBER
FIGURE 6. - Production Capacity of Umiat Wells Related to Drilling Mud.
Unusual Features of Well 9
Because of the time required to pump the oil-base mud from the mud pitinto tanks the formation was exposed to a low pressure from the liquid columnfor about 6 hours. Why the crude oil came into the hole after this time in-terval and did not flow into the hole during the 4-hour formation tests isnot understood. There is nothing in Darcy's law to indicate that time (sev-eral hours) is required for crude oil to flow from the formation into thebore hole.
Effect of Water on Relative Permeability to Oil
f
Where water from the drilling mud or any other source enters the porespace (especially if the water freezes) the channels available to the flowof oil are greatly reduced. A large decrease in permeability to oil with asmall increase in water content has been established from relative permeabil-ity studies. Dunlap.5/ showed this relation in a laboratory study of the oil
15/ Dunlap, Eldon N., Influence of Connate Water on Permeability of Sands forOil: AIME Petrol. Trans., vol. 127, 1938, pp. 215-225.

U
100
C
0
to
C,
aQW
0
AL
>-I-
-Jw
19
...
80
60
40
20
0
permeaoDilty ot sanas contain-ing increasing volumes ofwater (fig. 7). The testsshowed that a 5 percent in-crease in the water contentof the sand resulted in a 40percent decrease in perme-ability to oil. The perme-abilities of the sands usedin the laboratory tests weremuch higher than normal oil-reservoir sands. However,data are considered indica-tive of relative permeabilitytrends.
Formation Pressure
Although few data areavailable regarding the for-mation pressure in the Grand-stand sandstone in the Umiatfield, some indication of thepressure may be obtained in-directly. Shut-in gas pres-sure at the surface of well 8reached a maximum observed
0 20 40
PORE SPACE SATURATED WITH WATER, perc
60 value of 270 pounds persquare inch. The depth from
e nt which the gas was flowing andthe liquid level in the wellwere unknown.FIGURE 7. - Effect of Water Content of Sands on
Permeability to Oil. (Adapted FromJunlap, ANIME I'etrol. I rans. 1J3). Wells 5 and 9 had liquid
levels that reached nearly tothe surface. Based on a crude oil specific gravity of 0.84 the pressure inwell 9 at a depth of 900 feet was 900 x 0.84 x 0.43 lb./ft. of water = 325pounds per square inch. The calculated pressure in the upper Grandstand sand-stone at a depth of 470 feet was 170 pounds per square inch.
These pressures available to push water (brine) or ice from the porechannels are not large. The affinity of the clays in the reservoir rock alsotends to hold water solutions in the pore channels thereby restricting therate of flow of crude oil through the rock into the well bore.
Low Formation Temperatures
Wells in this field penetrated rocks at temperatures below the freezingtemperature of water and some of the oil produced from these holes was shownto be flowing through rocks below 32° F. The measured oil flow temperaturewas about 26° F. indicating approximately the temperature of the oil-reservoir

20
- -- --- ·
rock. Although this temperature is below the freezing temperature of freshwater in large containers, tests have shown that water solutions in smallpores may have a freezing point at temperatures below 32° F.l6/ The relativeamounts of water in the liquid and solid states in ground at temperature below32° F. depend on the physiochemical composition of the ground, on the presenceof water-soluble particles, and on the temperature and pressure.
PROPERTIES OF THE CRUDE OIL
The produced crude oil has the following characteristics: API gravity,about 36°; pour point, -5° F.; sulfur, 0.1 percent, no hydrogen sulfide;Saybolt Universal viscosity at 100° F., 37 seconds; color, National PetroleumAssociation No. 4; and carbon residue, Conradson, weight percent, 0.1 to 0.2.The crude oil was relatively high in naphthene hydrocarbons. Analyses of somecrude oils from Alaska have recently been published by the Bureau of Mines.17/
BASIC WELL DATA
Well 1 had a ground elevation of 801 feet and the elevation of the kellybushing was 810 feet. The total depth from the surface was 6,005 feet. Six-teen feet of 24-inch conductor pipe was set 19 feet below the kelly bushingin a 30-inch hole. Sixteen-inch casing was cemented at 97 feet. A string of11-3/4-inch casing was cemented at 685 feet.
Well 2 had a ground elevation of 333 feet and the kelly bushing was lo-cated at an elevation of 342 feet. Sixteen-inch conductor pipe was cementedat 103 feet. A string of 11-3/4-inch casing was cemented at a depth of 1,005feet. The well was drilled to a total depth of 6,212 feet.
Ground elevation at well 3 was 351 feet and elevation of the kelly bush-ing was 360 feet. Seven-inch casing was cemented at a depth 72 feet below thekelly bushing. The well was drilled to a total depth of 572 feet.
The ground elevation of well 4 was 482 feet. Surface pipe was set at adepth of 33 feet. This hole was drilled to a total depth of 840 feet.
The ground level of well 5 was 334 feet and the rig floor was 335 feetabove sea level. At a depth of 23.5 feet, 8-5/8-inch casing was cemented.The well was drilled to a total depth of 1,077 feet. After the 93-day pumpingtest, 5-1/2-inch casing was cemented at a depth of 1,068 feet with the top ofthe plug at 1,065 feet. The pipe was filled with Umiat crude oil and shut in.
16/ Nersesova, Z. A., (The Relative Amounts of Water the Solid and LiquidStates Present in the Ground During Freezing or Thawing.) Fazovyysostav vody v gruntakh pri zamerzanii i ottaivanii, Materialy poLaboratornym Issledovaniiam Merzlykh Gruntov, vol. 1, 1953, pp. 37-51.
17/ McKinney, C. M., Garton, E. L., and Schwartz, F. G., Analyses of SomeCrude Oils From Alaska: Bureau of Mines Rept. of Investigations5447, 1959, 29 pp.

Well 6nwas at a ground level of 334 feet and the rig floor was at 337feet. Surface casing was driven to a depth of 35 feet. The hole was drilledto a total depth of 825 feet.
Well 7 was spudded from a ground level of 326 feet and a derrick floorlevel of 330 feet. Surface pipe was driven to 52 feet. The hole was drilledto a total depth of 1,384 feet.
Well 8 was at a ground level of 735 feet and the derrick floor was 5 feethigher. Two joints of 11-3/4-inch casing were set at 50 feet. After testingpromising sandstones, excessive caving of the walls of the hole resulted insetting 8-5/8-inch casing at a depth of 1,231 feet. The hole was drilled toa total depth of 1,327 feet.
Well 9 was at a ground level of 418 feet and the kelly bushing was 6 feethigher. A string of 8-5/8-inch surface pipe was cemented at a depth of 61feet. After a sustained pumping test, 5-1/2-inch casing was run to bottom,cemented, and gun perforated. The total depth of this hole was 1,257 feet.
Well 10 was at a ground level of 741 feet and the derrick floor was 5feet higher. A string of 11-3/4-inch casing was cemented at a depth of 70feet. After caving and several fishing jobs, casing was cemented at a depthof 1,339 feet. The hole was drilled to a total depth of 1,573 feet.
Well 11 was at a ground level of 464 feet and the kelly bushing was 7feet higher. The 13-3/8-inch casing was cemented at a depth of 89 feet, with57.7 feet jacketed with 16-5/8-inch casing. The hole was drilled to a totaldepth of 3,303 feet.
I
21
INT. - BU OF MINES.PGH. PA. 2027