welfare magnet hypothesis, fiscal burden and immigration skill selectivity assaf razin (cornell...
Post on 22-Dec-2015
219 views
TRANSCRIPT
Welfare Magnet Hypothesis, Fiscal Burden and Immigration Skill
Selectivity
Assaf Razin (Cornell University, Tel Aviv University,
CEPR & NBER)
and
Jackline Wahba(University of Southampton (UK))
October 2011

Introduction• Public debate on immigration has
increasingly focused on the welfare state amid concerns that immigrants are a fiscal burden.
• There has also been a sizeable literature on how welfare-state generosity works as a magnet to migrants.
• What about the evidence?
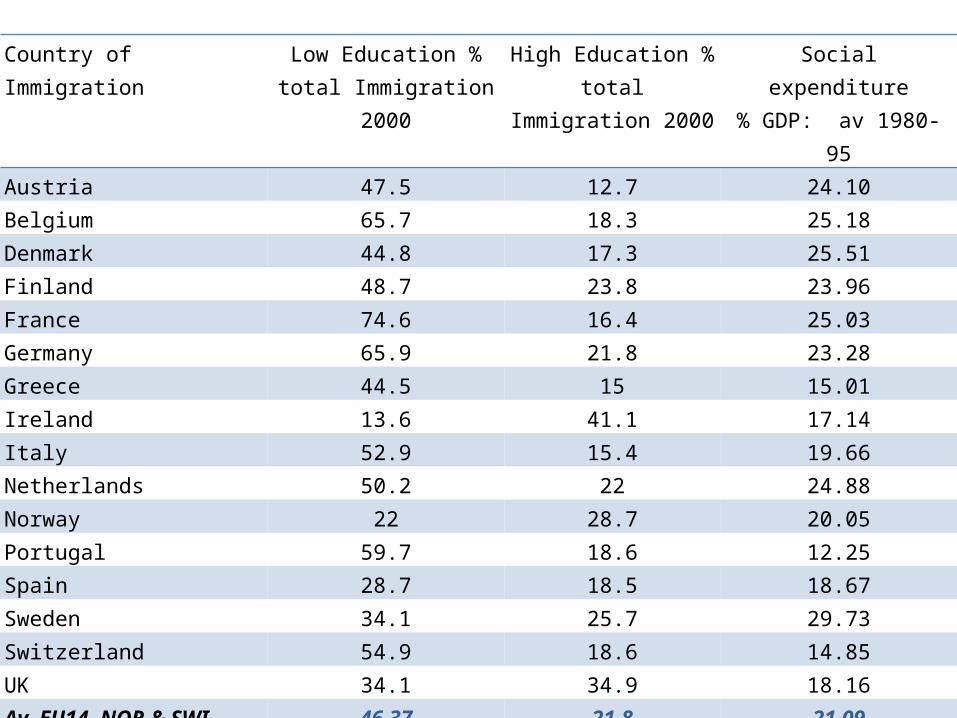
Country of Immigration Low Education % total Immigration 2000
High Education % total Immigration 2000
Social expenditure% GDP: av 1980-95
Austria 47.5 12.7 24.10Belgium 65.7 18.3 25.18Denmark 44.8 17.3 25.51Finland 48.7 23.8 23.96France 74.6 16.4 25.03Germany 65.9 21.8 23.28Greece 44.5 15 15.01Ireland 13.6 41.1 17.14Italy 52.9 15.4 19.66Netherlands 50.2 22 24.88Norway 22 28.7 20.05Portugal 59.7 18.6 12.25Spain 28.7 18.5 18.67Sweden 34.1 25.7 29.73Switzerland 54.9 18.6 14.85UK 34.1 34.9 18.16Av. EU14, NOR & SWI 46.37 21.8 21.09Australia 35.3 40.3 12.93Canada 29.6 58.8 16.91USA 37.9 42.7 17.50Av. AUS, CAN & US 34.27 47.27 15.78
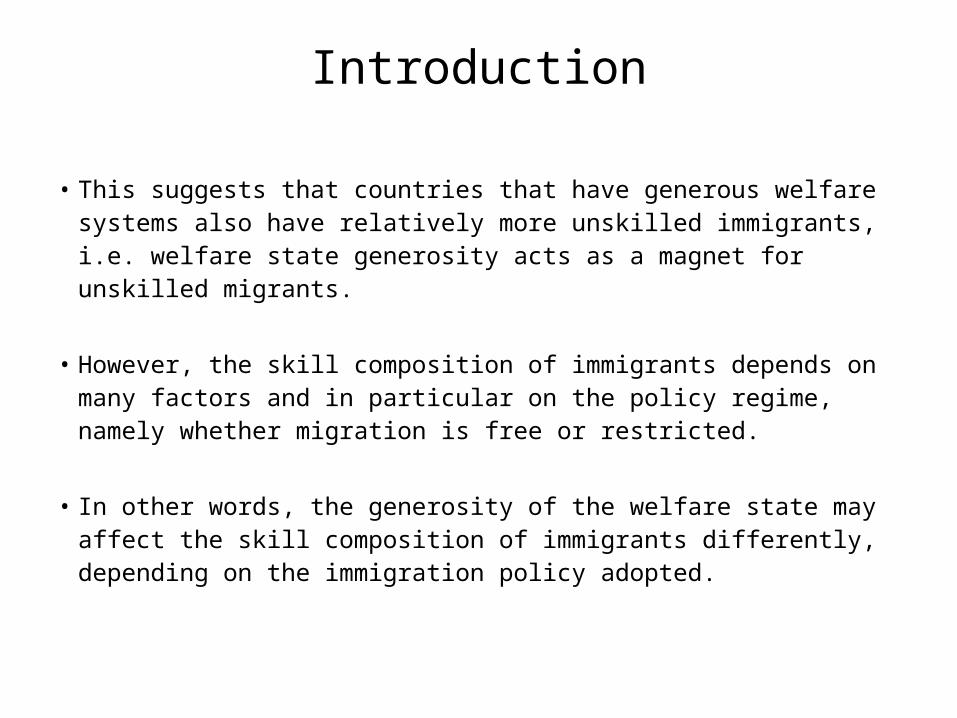
Introduction
• This suggests that countries that have generous welfare systems also have relatively more unskilled immigrants, i.e. welfare state generosity acts as a magnet for unskilled migrants.
• However, the skill composition of immigrants depends on many factors and in particular on the policy regime, namely whether migration is free or restricted.
• In other words, the generosity of the welfare state may affect the skill composition of immigrants differently, depending on the immigration policy adopted.
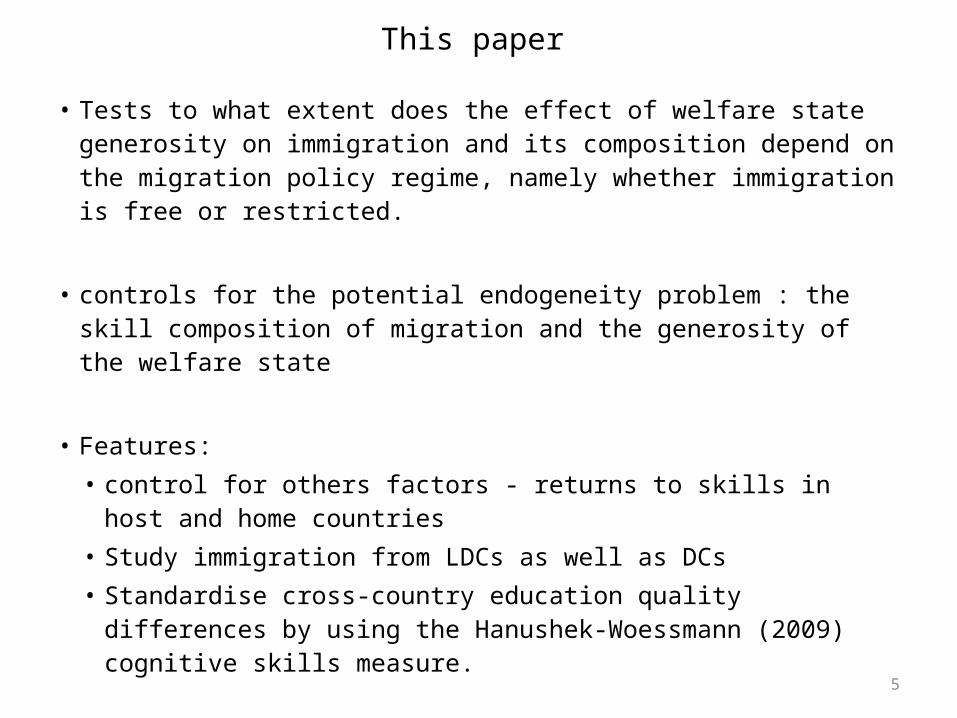
This paper
• Tests to what extent does the effect of welfare state generosity on immigration and its composition depend on the migration policy regime, namely whether immigration is free or restricted.
• controls for the potential endogeneity problem : the skill composition of migration and the generosity of the welfare state
• Features:• control for others factors - returns to skills in host
and home countries• Study immigration from LDCs as well as DCs• Standardise cross-country education quality
differences by using the Hanushek-Woessmann (2009) cognitive skills measure. 5
Theoretical Underpinning: Free RegimeSocial Magnet Hypothesis
• A typical welfare state with relatively abundant capital and high total factor productivity (implying relatively high wages for all skill levels) attracts both unskilled and skilled migrants.
• On the other hand, the generosity of the welfare state attracts unskilled (poor) migrants, as they expect to gain more from the benefits of the welfare state than what they expect to pay in taxes for these benefits: that is, they are net beneficiaries of the generous welfare state.
• In contrast, potential skilled (rich) migrants are deterred by the generosity of the welfare state. Thus the generosity of the welfare state shifts the migrant skill composition towards the unskilled.
Theoretical Underpinning: Restricted RegimeFiscal Burden Hypothesis
• In the restricted-migration regime, voters are motivated by two considerations: how migration affects their wages, and how it bears on the finances of the welfare state.
• Typically, unskilled migration depresses the unskilled wage and boosts the skilled wage.
• The opposite occurs with skilled migration. The effect of migration on the finances of the welfare state is common to all voters of all skills, because skilled migrants are net contributors to the welfare state, whereas unskilled migrants are net beneficiaries.
• From a public finance point of view, native- born voters of all skills would therefore opt for the skilled to come and for the unskilled to stay away to mitigate the fiscal burden

Previous Literature : US• Welfare migration empirical literature is inconclusive.
• Normally, evidence suggests that welfare serves as a magnet for immigrants:– Southwick (1981); Gramlich and Laren (1984); Blank (1988);
Borjas (1999); Gelbach (2000); McKinnish (2005, 2007) – e.g. Borjas (1999) finds that low-skilled migrants are much
more heavily clustered in high-benefit states.
• On the other hand, some find that welfare benefits has no significant effect over migration:
–Levine & Zimmerman (1999): welfare benefit have little effect on relocation. Walker (1994): no evidence in support of the magnet hypothesis.
• These studies however, do not address international immigration, only migration within the U.S.

Previous Literature: OECD/Int’l
• Peridy (2006) and Warin and Svaton (2008) find that aggregate welfare-state benefits have a positive effect on migration. They do not, however, separate between high-skilled and low-skilled immigrants.
• De Giorgi and Pellizzari (2006) find positive effect across different levels of education among the immigrants.
• Docquier, Lohest and Marfouk (2006) find that while all educational groups are indeed attracted to welfare-benefits, the unskilled are motivated by social expenditure much more than the skilled.
• All these studies, however, do not differentiate between free and policy-controlled migration!
Previous Literature
• None of those study take into account the immigration regime:– Studies of migration between states within the US,
can help only in providing evidence of a free-migration regime.
– Studies that are confined to the policy-controlled migration regime, but employ a model of the migrants’ choice whether to migrate and to which country, are evidently problematic.
– Studies that refer to both migration regimes
without controlling for them are problematic: they do not disentangle migration policies in the host countries, and the individual migrant’s migration choices in the source countries.
10
Data
• Utilise free-movement within the EU to examine the free migration regime and compare that to immigration into the EU from two other groups, developed and developing source countries, to capture immigration-restricted regimes.
• Bilateral data from the year 2000 on 16 EUR countries (14 out of the EU-15 + Norway & Switzerland), 10 non-EU OECD countries, and 23 developing countries. (Docquier & Marfouk (2006)).
• Three groups: – Group A contains only the source-host pairs of EUR which allow
free mobility of labour between them. – Group B includes the developed source- EUR host pairs of
countries. – Group C developing source- EUR host pairs.
• EUR is always the host. 11

Quality of Education and Enforcement of Immigration Policies
• Immigrants with the same years of schooling may be treated equally in a points system, although they may vary in their labour market productivity
• If immigration policies favour higher educated immigrants, this would overestimate the effect of skill composition for LDCs.
• But if high educated immigrants are of poor quality then their productivity/behaviour would not be that different from the low-skilled ones, resulting in an underestimate of the effect of welfare generosity on the skill composition.
• Thus not controlling for educational quality is problematic since we cannot know a priori which way that would bias our results.
12

Data on Educational Quality
• Hanushek and Woessmann (2009) use international assessments of student achievement such as the First International Mathematics Study (FIMS), the Trends in International Mathematics and Science Study (TIMSS) and the Programme for International Student Assessment (PISA).
• A total of 12 international student achievement tests (ISATs) were collected.
• In order to compare performance on the ISATs across tests and over time, they project the performance of different countries on different tests onto a common metric.
• We use Hanushek-Woessmann (2009) imputed average test scores in maths and science for primary through end of secondary school (scaled to PISA scale divided by 100).
• We adjust all the migration stocks for quality of education using Hanushek and Woessmann (2009) new measures of international differences of cognitive skills.
13

Tabl e 2: Test ScoresGroup A Group B Group C
Country EQ Country EQ Country EQAustria 5.089 Australia 5.094 Argentina 3.920Belgium 5.041 Canada 5.038 Brazil 3.638Switzerland 5.142 Hong Kong 5.195 Chile 4.049Denmark 4.962 Israel 4.686 China 4.939Spain 4.829 Japan 5.310 Colombia 4.152Finland 5.126 Korea, Rep. 5.338 Egypt 4.030France 5.040 New Zealand 4.978 Indonesia 3.880
UK 4.950 Singapore 5.330 India 4.281
Germany 4.956 Taiwan 5.452 Iran 4.219Greece 4.608 US 4.903 Jordan 4.264Ireland 4.995 Lebanon 3.950Italy 4.758 Morocco 3.327Netherlands 5.115 Mexico 3.998Norway 4.830 Malaysia 4.838Portugal 4.564 Nigeria 4.154Sweden 5.013 Peru 3.125 Philippines 3.647 Thailand 4.565 Tunisia 3.795 Turkey 4.128 South Africa 3.089
Group Averages
4.939 5.132 3.999
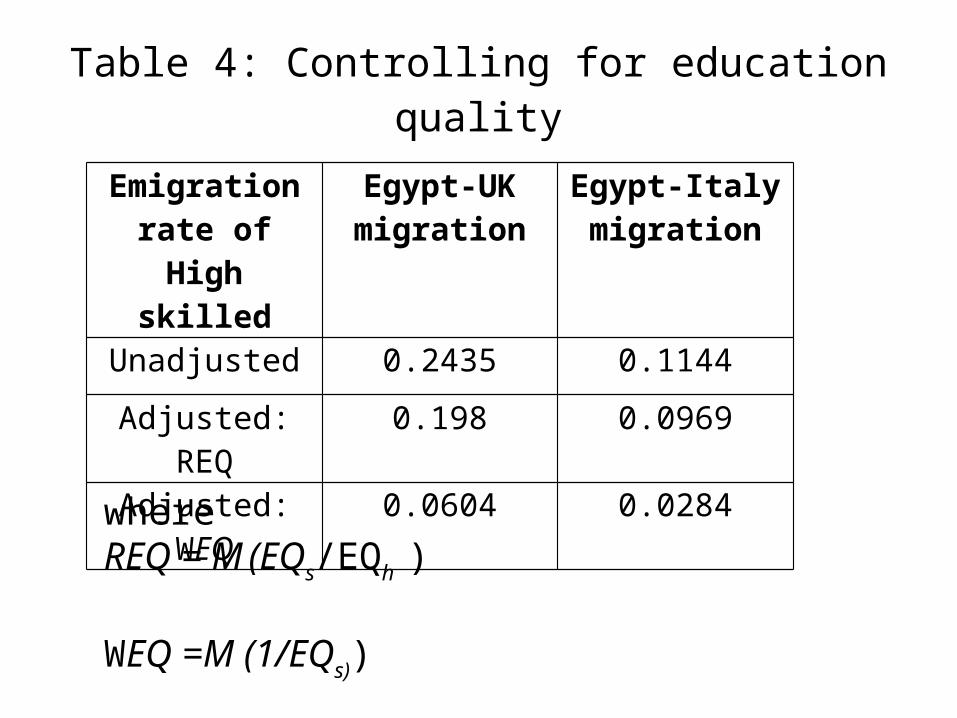
Table 4: Controlling for education quality
Emigration rate of High
skilled
Egypt-UK migration
Egypt-Italy migration
Unadjusted 0.2435 0.1144
Adjusted: REQ
0.198 0.0969
Adjusted: WEQ
0.0604 0.0284
where REQ = M (EQs/EQh ) WEQ =M (1/EQs))
Hypothesis
• The effect of welfare-state policy on immigrants, is different across skill levels; thus the skill composition of immigrants is adversely affected by the welfare generosity of host countries.
• If immigration is controlled and screened by policy of the host country, the opposite may occur, given the considerations of voters in the host country.
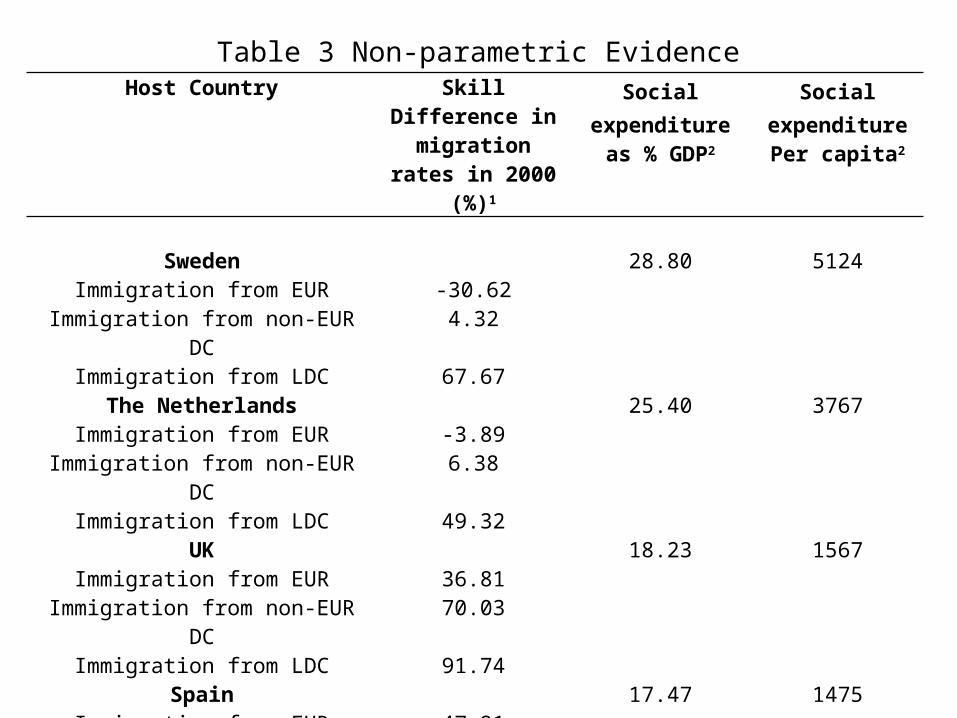
Table 3 Non-parametric EvidenceHost Country Skill
Difference in migration
rates in 2000 (%)1
Social expenditureas % GDP2
Social expenditurePer capita2
Sweden 28.80 5124Immigration from EUR -30.62
Immigration from non-EUR DC 4.32Immigration from LDC 67.67
The Netherlands 25.40 3767Immigration from EUR -3.89
Immigration from non-EUR DC 6.38Immigration from LDC 49.32
UK 18.23 1567Immigration from EUR 36.81
Immigration from non-EUR DC 70.03Immigration from LDC 91.74
Spain 17.47 1475Immigration from EUR 47.91
Immigration from non-EUR DC 68.86Immigration from LDC 63.69
EUR 20.56 3072Immigration from EUR 15.77
Immigration from non-EUR DC 59.36Immigration from LDC 65.60
Econometric model
• As mentioned above the generosity of the welfare state determines the self-selection of potential migrants (supply-side mechanism) and the immigration policy in the destination country (demand-side mechanism).
• We take advantage of heterogeneous bilateral immigration regimes to identify and quantify these two mechanisms.
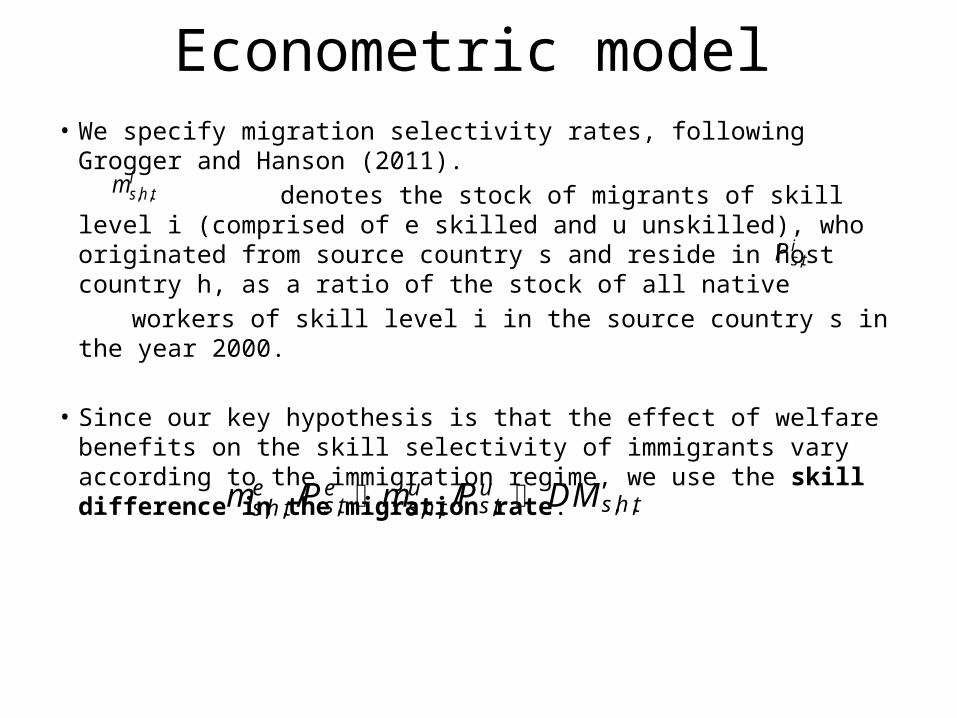
Econometric model• We specify migration selectivity rates, following Grogger and
Hanson (2011). denotes the stock of migrants of skill level i (comprised
of e skilled and u unskilled), who originated from source country s and reside in host country h, as a ratio of the stock of all native
workers of skill level i in the source country s in the year 2000.
• Since our key hypothesis is that the effect of welfare benefits on the skill selectivity of immigrants vary according to the immigration regime, we use the skill difference in the migration rate.
m s,h,ti
Ps,ti
ms,h,te /Ps,te ms,h,t
u /Ps,tu DMs,h,t #
Econometric Specification 1
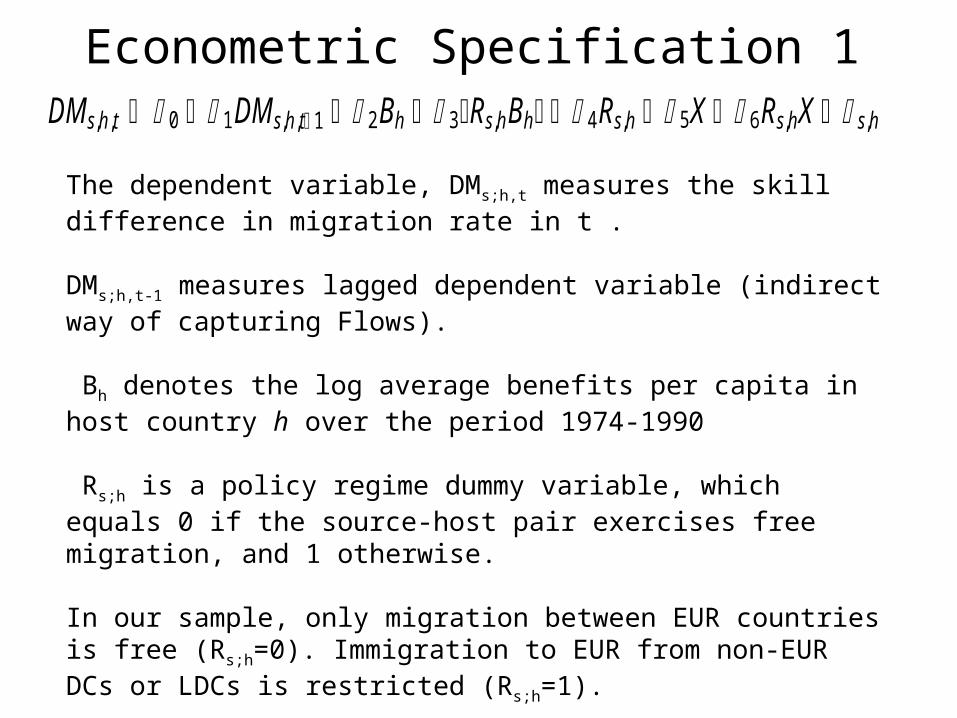
The dependent variable, DMs;h,t measures the skill difference in migration rate in t .
DMs;h,t-1 measures lagged dependent variable (indirect way of capturing Flows).
Bh denotes the log average benefits per capita in host country h over the period 1974-1990
Rs;h is a policy regime dummy variable, which equals 0 if the source-host pair exercises free migration, and 1 otherwise.
In our sample, only migration between EUR countries is free (Rs;h=0). Immigration to EUR from non-EUR DCs or LDCs is restricted (Rs;h=1).
DMs,h,t 0 1DMs,h,t 1 2Bh 3Rs,hBh 4Rs,h 5X 6Rs,hX s,h #

Econometric Specification 1
Hypotheses: the effect of welfare state generosity on the skill difference selectivity of the migrants under free migration is negative
the effect of welfare state generosity on the skill difference selectivity of the migrants under restricted migration is positive
DMs,h,t 0 1DMs,h,t 1 2Bh 3Rs,hBh 4Rs,h 5X 6Rs,hX s,h #
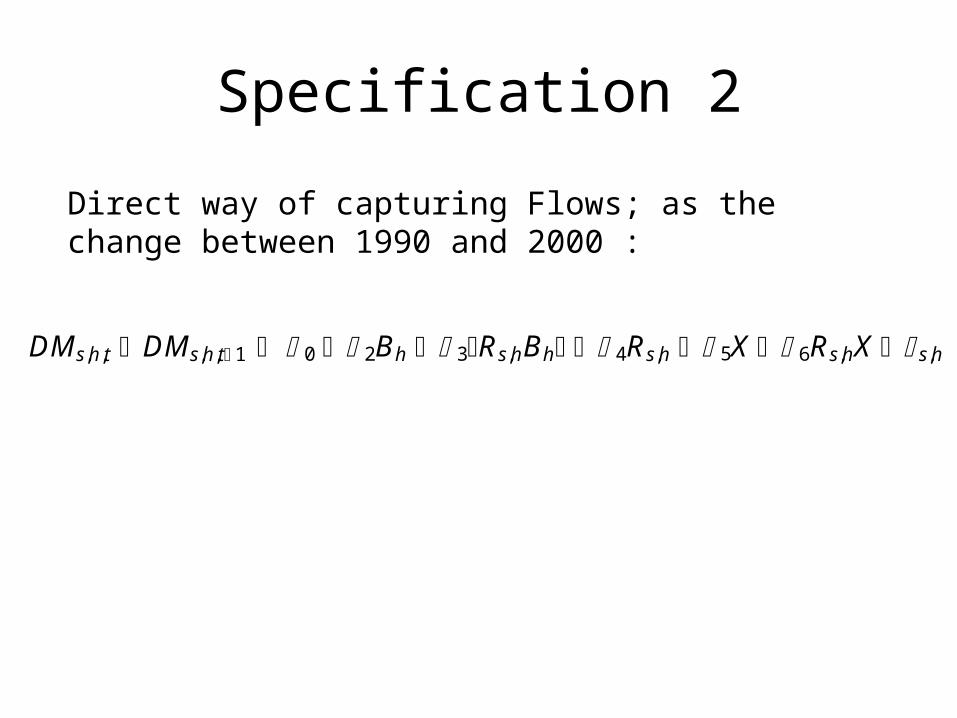
Specification 2
Direct way of capturing Flows; as the change between 1990 and 2000 :
DMs,h,t DMs,h,t 1 0 2Bh 3Rs,hBh 4Rs,h 5X 6Rs,hX s,h #
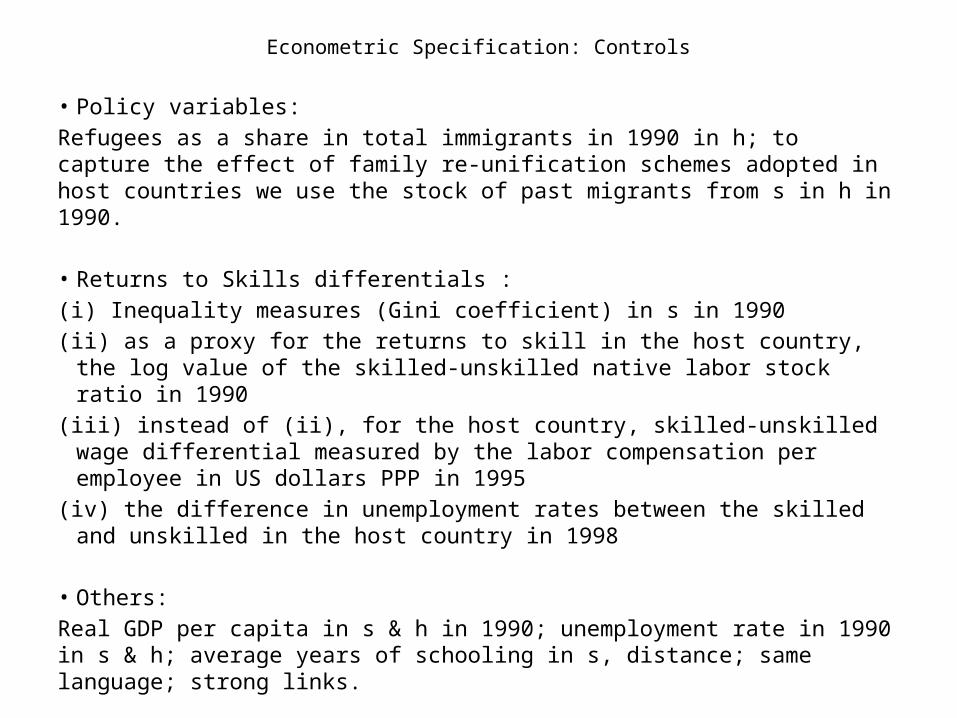
Econometric Specification: Controls
• Policy variables: Refugees as a share in total immigrants in 1990 in h; to capture the effect of family re-unification schemes adopted in host countries we use the stock of past migrants from s in h in 1990.
• Returns to Skills differentials :(i) Inequality measures (Gini coefficient) in s in 1990(ii) as a proxy for the returns to skill in the host country, the log
value of the skilled-unskilled native labor stock ratio in 1990(iii) instead of (ii), for the host country, skilled-unskilled wage
differential measured by the labor compensation per employee in US dollars PPP in 1995
(iv) the difference in unemployment rates between the skilled and unskilled in the host country in 1998
• Others: Real GDP per capita in s & h in 1990; unemployment rate in 1990 in s & h; average years of schooling in s, distance; same language; strong links.
Endogeneity of Welfare• To address potential endogeneity problem between the level of
benefits Bh in the host country and the skill selectivity/composition of the migrants :
• We instrument the lagged level of benefits per capita (1974-90) in the host country using the legal origin (LO) in the host country (English, Scandinavian, or French-German) as instrument.
• Legal system indicates cultural features of the countries and reflects basic constitutional notion regarding the attitude towards property rights on the one hand, and social rights on the other hand. (Bh & LO cor = 60%).
• A concern is if LO is correlated with, for example, economic development/growth which is known to affect migration. The empirical literature is mixed with respect to whether legal origin impacts economic growth. E.g. Acemoglu and Johnson (2005) questions the impact of legal system on economic growth. However to ensure that this is not a possible channel, we include GDP growth rate in the host country as a control.
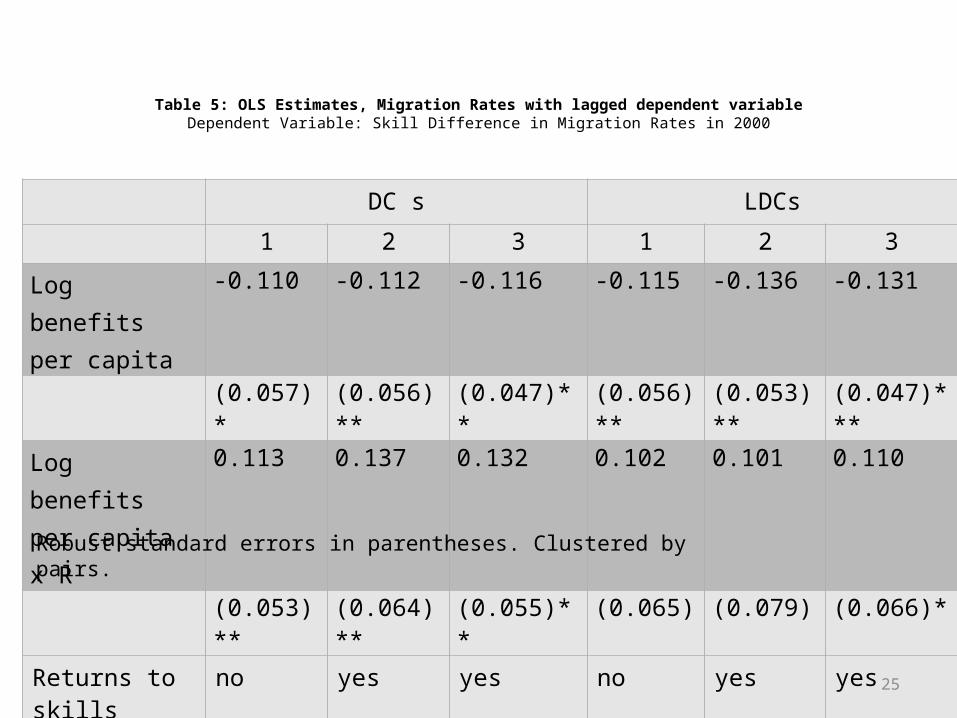
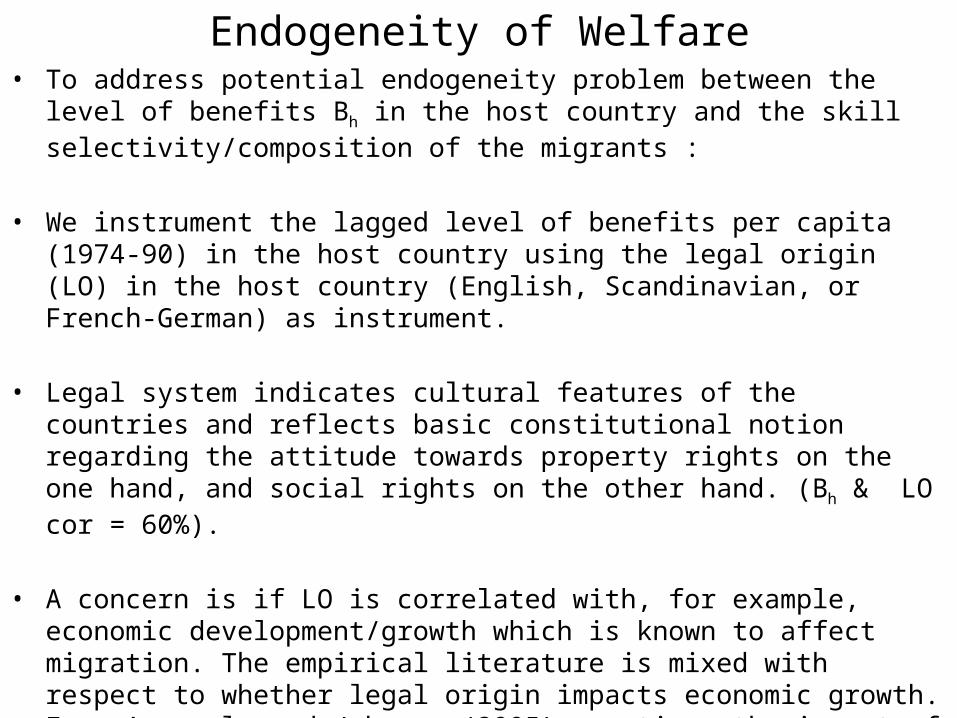
Table 5: OLS Estimates, Migration Rates with lagged dependent variableDependent Variable: Skill Difference in Migration Rates in 2000
DC s LDCs
1 2 3 1 2 3
Log benefits per capita
-0.110 -0.112 -0.116 -0.115 -0.136 -0.131
(0.057)* (0.056)** (0.047)** (0.056)** (0.053)** (0.047)***
Log benefits per capita x R
0.113 0.137 0.132 0.102 0.101 0.110
(0.053)** (0.064)** (0.055)** (0.065) (0.079) (0.066)*
Returns to skills
no yes yes no yes yes
25
Robust standard errors in parentheses. Clustered by pairs.
DC s LDCs
1 2 3 1 2 3
Log benefits per capita
-0.105 -0.115 -0.109 -0.111 -0.116 -0.138
(0.052)** (0.049)** (0.042)** (0.051)** (0.054)** (0.054)**
Log benefits per capita x R
0.115 0.139 0.135 0.104 0.111 0.132
(0.053)** (0.062)** (0.054)** (0.059)* (0.070) (0.062)**
Returns to skills
no yes yes no yes yes
Table 6: OLS Estimates of Migration Rates with lagged dependent variable; Adjusted by Relative
Educational QualityDep. Variable: Skill Difference in Migration (REQ) Rates in 2000
26
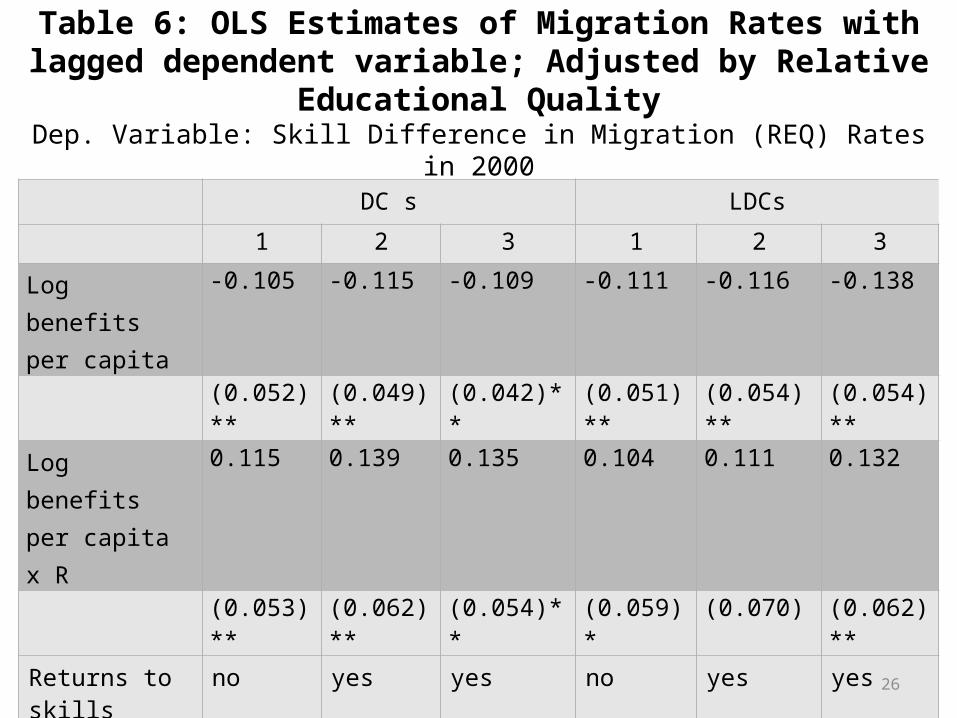
Table 7: IV Estimates: Migration Rates with lagged dependent variable
Dependent Variable: Skill Difference in Migration Rate in 2000
DC s LDCs
1 2 3 1 2 3
Fitted benefits per capita
-0.157 -0.217 -0.118 -0.181 -0.180 -0.154
(0.081)* (0.097)** (0.063)* (0.080)** (0.089)** (0.070)**
Fitted benefits per capita x R
0.270 0.261 0.207 0.198 0.209 0.161
(0.089)*** (0.099)*** (0.078)*** (0.088)** (0.103)** (0.083)*
Returns to skills
no yes yes no yes yes
27
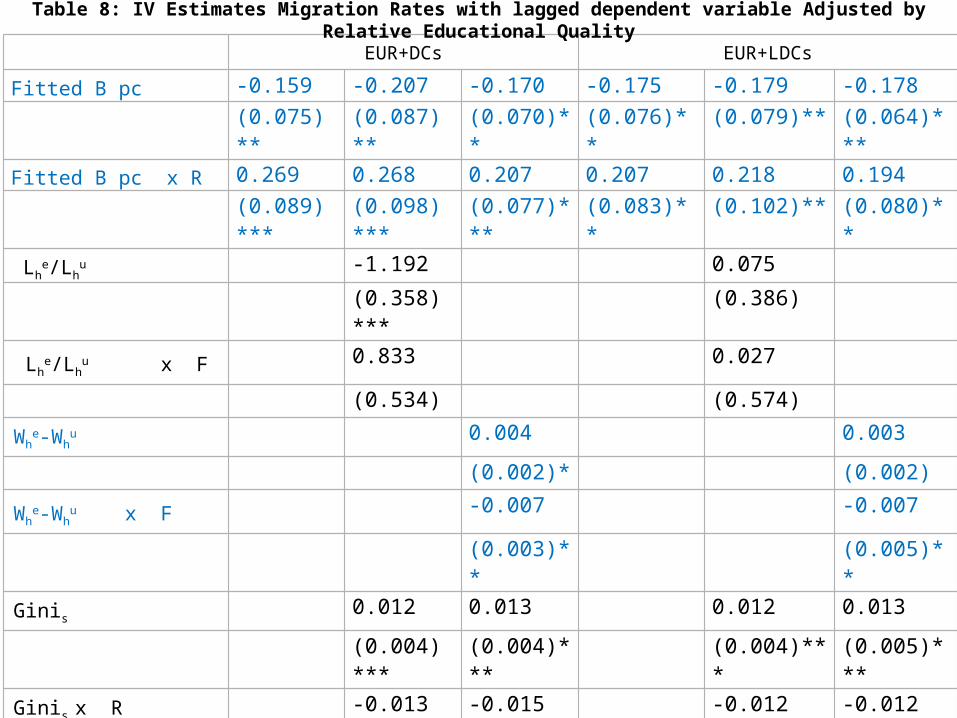
EUR+DCs EUR+LDCs
Fitted B pc -0.159 -0.207 -0.170 -0.175 -0.179 -0.178(0.075)** (0.087)** (0.070)** (0.076)** (0.079)** (0.064)**
*Fitted B pc x R 0.269 0.268 0.207 0.207 0.218 0.194
(0.089)***
(0.098)***
(0.077)***
(0.083)** (0.102)** (0.080)**
Lhe/Lh
u -1.192 0.075(0.358)***
(0.386)
Lhe/Lh
u x F 0.833 0.027
(0.534) (0.574)
Whe-Wh
u 0.004 0.003
(0.002)* (0.002)
Whe-Wh
u x F -0.007 -0.007
(0.003)** (0.005)**
Ginis0.012 0.013 0.012 0.013
(0.004)***
(0.004)***
(0.004)*** (0.005)***
Ginis x R -0.013 -0.015 -0.012 -0.012
(0.005)***
(0.005)***
(0.004)*** (0.004)***
% Refugeesh -0.003 -0.003 -0.003 -0.002 -0.003 -0.0004
(0.003) (0.004) (0.004) (0.002) (0.004) (0.0004)
Total stock Msh in 90
-0.001 -0.001 -0.001 -0.002 -0.002 -0.002
(0.001) (0.001) (0.001) (0.0001)**
(0.0001)***
(0.0001)***
Table 8: IV Estimates Migration Rates with lagged dependent variable Adjusted by Relative Educational Quality

Table 9: IV Estimates: Second Specification
EUR+DCs EUR+LDCs
Flows,
Fitted benefits per capita -0.571 (0.242)** -0.292 (0.118)**Fitted benefits per capita x R 0.598 (0.303)** 0.294(0.156)**
Flows, Corrected using REQ
Fitted benefits per capita -0.576 (0.248)** -0.372 (0.181)**Fitted benefits per capita x R 0.598 (0.303)** 0.393(0.204)**
29

Robustness Checks• Use different methods to adjust for the quality of
education– Scale (weight DM=WEQ; weight High only=HEQ);– interact (IEQ)
• Use benefits as % GDP in 1980-90 (host, logs)
• Use fixed effects for source country
• All results are robust.
30
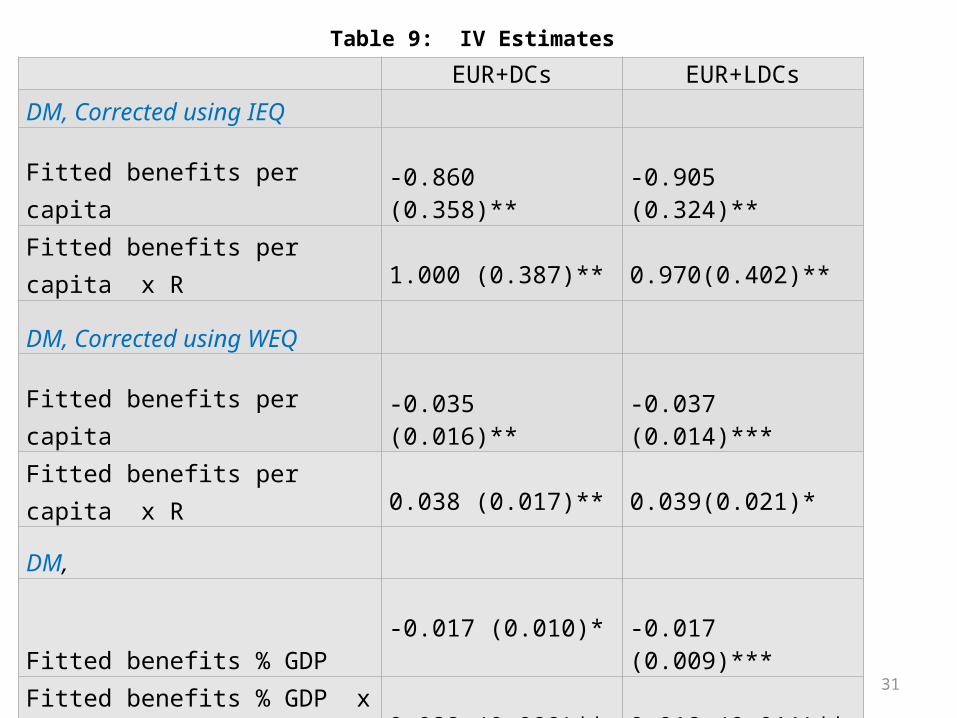
Table 9: IV Estimates
EUR+DCs EUR+LDCsDM, Corrected using IEQ
Fitted benefits per capita -0.860 (0.358)** -0.905 (0.324)**Fitted benefits per capita x R 1.000 (0.387)** 0.970(0.402)**
DM, Corrected using WEQ
Fitted benefits per capita -0.035 (0.016)** -0.037 (0.014)***Fitted benefits per capita x R 0.038 (0.017)** 0.039(0.021)*
DM,
Fitted benefits % GDP -0.017 (0.010)* -0.017 (0.009)***
Fitted benefits % GDP x R 0.022 (0.009)** 0.018 (0.011)**
DM, Corrected using REQFitted benefits % GDP -0.017 (0.010)* -0.022 (0.008)***
Fitted benefits % GDP x R 0.022 (0.009)** 0.238 (0.010)** 31
Summary of ResultsThe effect of the generosity tends to be larger for DCs relative to LDCs: a 1% increase in welfare-state benefit spending would increase the skill difference migration rate of LDCs migrants by around 2.0% and of DCs migrants by around 3.5%.
Controlling for quality of education strengthens the positive effect of the skill composition of LDCs and hardly changes the estimate for DCs, thus narrowing the gap between the effects for LDCs vs. DCs. Thus a 1% increase in welfare-state benefit spending would increase the skill composition of LDCs migrants by around 2.5% and of DCs migrants by around 3.4%.
Conclusion• Findings:
– Find evidence of the magnet hypothesis: that the generosity of the welfare state adversely affects the skill-composition of migrants under free-migration;
– And of the fiscal burden hypothesis : positive effect under a policy-controlled migration regime even after controlling for the differential returns in skills in source and host countries.
– The effect tends to be larger for DCs. But once we adjust for educational quality, the effect for LDCs converges to that from DCs.
• Policy Implications:– Immigration policies favouring high-skilled migrants need
to take into account educational quality– Under free-migration, the generosity of the welfare state
acts as a magnet for the unskilled harmonizing the minimum welfare provision within the EU ? 33