welex, a halliburton company - doctor neutrondoctorneutron.info/images/1986_yy.pdf · welex, a...
TRANSCRIPT

SPWLA TWENTY-SEVENTH ANNUAL LOGGING SYMPOSIUM,JUNE g-13.1986
CALIBRATION, CHECKING AND PHYSICAL CORRECTIONS FOR A NEW DUAL-SPACED NEUTRON POROSITY TOOL
M.P. Smith Welex, a Halliburton Company
Houston, Texas
ABSTRACT
A new dual-spaced neutron tool has been developed that features high count rates and improved
statistical precision and log repeatability. Environmental corrections including borehole diameter, standoff, and lithology are at acceptable levels for DSN@-II.
The effects of varying source-to-detector spacings and shielding are summarized. Porosity
measurement resolution and statistical precision are discussed and it is indicated how tradeoffs between higher count rates and increased environmental corrections must be considered.
The absolute calibration of a standard tool is based on its response to limestone test pits, field data,
and theoretical calculations, Test data for actual manufactured tools are presented. Shop calibration and wellsite check procedures are discussed. The advantages of multiposition check operations are explained, including reduced sensitivity to check block positioning and external environment. An analysis is presented of errors from tool manufacturing, calibration, and check procedures.
A generalized theory of neutron scattering and absorption has been developed to correct dual- spaced neutron logs for unusual minerals and fluids. Recently, this theory has been extended to model tool response in liquid-filled boreholes; significant improvements in absolute calibration accuracy at ultra-high porosities have resulted. Theoretical and experimental results are presented for sandstones and it is shown that the matrix neutron absorption cross section must be specified for accurate porosity
determinations.
Theoretical results are presented for an extended density-neutron porosity crossplot that includes Si02 matrix densities from 2.2 to 2.65 g/cc and porosity values from 0 to 100%. Field data in diatomaceous formations are discussed and are shown to closely agree with theoretical predictions.
DSN-II ratios and apparent limestone porosity values can be calculated from the model for a wide class of formations using direct specification of the minerals, liquids, and gases present. Calculated
neutron properties for selected minerals are presented.
INTRODUCTION
Dual-spaced neutron logs are a standard means for determining formation porosity.4~6~8~13 Figure 1 shows the general features of a dual-spaced neutron logging tool that comprises a fast neutron source, shielding materials, and two thermal neutron detectors. The fast neutrons spread out and slow down by elastic scattering, approach thermal equilibrium, diffuse at thermal energy, and are absorbed by nuclei in the borehole/formation environment. During the thermal diffusion process, some neutrons are detected by either the near or the far detector and count rates are developed that become the primary logging input variables. A standard means for processing is to form the ratio of near count rate to far count rate and then
to compute formation porosity from ratio measurements made in laboratory test tanks and real earth formations. Both ratio and porosity measurements must be corrected to standard conditions (Figure 1). Deviations from standard conditions are handled by departure curves. The dual-spaced ratio method is less sensitive to many practical problems that occurwith single detector logging methods, The DSN-II is
YY
a,A registered mark of Halllburton Company
-l-

SPWLA TWENTY-SEVENTH ANNUAL LOGGING SYMPOSIUM,JUNE g-13,1986
the dual-spaced thermal neutron tool of the Precision Logging System and it may be combined with any
PLS’ family members.
DSN-II research and development have focused on three areas for improvements: (1) statistical precision, (2) absolute calibration accuracy, and (3) response predictions in formations with unusual minerals and/or fluids. Particular emphasis has been given to precision and accuracy improvements at
very high porosity values, including high apparent porosities in shaly sands and ultra-high effective porosities in diatomaceous formations.
This paper shows how the precision of dual-spaced neutron porosity measurement is related to near-far detector separation and how precision can be improved without sacrificing sensitivity to borehole diameter and standoff variations. Theory can be combined with data to improve absolute porosity calibration accuracy, particularly at high porosities. Tools can be manufactured in quantity with excellent uniformity. Shop calibration and wellsite checks can accurately match a tool’s response to the
standard tool response.
Theoretical calculations via a direct ratio computation technique permit the prediction of DSN-II ratios for a wide range of minerals and fluids that are impractical for incorporating into laboratory test tanks. In those cases where specific information about a reservoir is available, accurate calculations can be provided for the DSN-II, thereby improving porosity and saturation determinations, An important by-product of this process is that the absolute calibration of the dual-spaced neutron tool and its
corrections for lithology and fluid composition are combined into one coherent description. Significant improvements in overall accuracy are thereby achieved.
STATISTICAL PRECISION IMPROVEMENTS
Perhaps the simplest observation about neutron measurements in earth formations is that low porosity formations tend to have high count rates and, conversely, high porosity formations have low
count rates; a notable exception is the occurrence of gas, which responds like low porosity. Neutron spreading and count rate behavior is strongly controlled by the presence of hydrogen in the fluids within the pore system. Low count rates lead to poor statistical precision. This has been a serious problem for the far-spaced detector of dual-spaced neutron detector systems in highly porous formations,
Figure 2 is a plot of DSN-II ratio versus an earlier tool (DSN) ratio for a wide variety of test tanks, including quarried limestones, sandstones, dolomites, sand packs, and 100% freshwater. These tanks
are saturated with freshwater, saltwater, borated saltwater, or oil. Data were taken in freshwater and saltwater boreholes, with diameters ranging from 6 to 14 inches. Figure 2 shows the end results of optimizing the DSN-II towards improved high porosity precision and log repeatability. This was achieved by decreasing the far detector spacing, decreasing the size of the near detector, and improving the source and near detector shielding. In this process, far detector count rates have improved by a factor of 10.
Figure 2 shows that DSN ratios vary from about 20 to 320 while DSN-II ratios vary from about 2 to 16. The DSN is believed to have the longest far-spaced detector and far-near separation of any currently available logging tool. It has excellent depth of investigation in low porosity formations and high porosity gas reservoirs, It will be shown that the DSN-II has superior repeatability and accuracy in high porosity formations, making it ideally suited for shaly sand reservoirs and ultra-high porosity diatomite formations, as well as for normally encountered formations.
‘A mark of Halllburton Company
- 2-
SPWLA TWENTY-SEVENTH ANNUAL LOGGING SYMPOSIUM, JUNE g-13,1986
-
Several simple, yet very important conclusions can be drawn from Figure 2. Despite significant changes in detector spacings, both ratios are strongly correlated for a wide range of borehole/formation conditions: there are no big changes in sand/lime/dolomite or salinity/ boron behavior. The baseline shift is due mainly to source/near detector shielding differences. Closer study shows that deviations from straightline correlation are due to borehole diameter variations. In the limit of zero borehole diameter effects, nearly perfect straightline correlation would occur. Borehole effects are strongest at low porosities and nearly disappear at high porosities, where differences in borehole and formation hydrogen
content are minimized.
A more detailed analysis is needed in order to quantitatively describe the porosity measurement characteristics of dual-spaced neutron tools. Denote by R the near/far count rate ratio. (Count rates have been depth aligned, filtered to achieve sampling of the same material, and dead-time corrected.) It is convenient to define sensitivity or signal by
(1) 1 aR
signal = - -’ R a4
The fractional statistical noise (one standard deviation) associated with near count rate (N) and far count rate (F) may be obtained from
(2) fractional statistical noise = + d-I&X$
where the factor of 6 arises from 3 ft averaging at a logging speed of 30 ft/min. The corresponding one standard deviation in porosity is
(3) s#J = $+ 6R
S4 IS called the porosity measurement resolution. A spread in ratio values causes a spread in porosity values that depends directly on both ratio spread and slope. From (1) and (2) the signal-to-noise ratio is
(4) 1 dR / 6R = 1 = 1 signal/noise = - - ---R- ~ - R a4 g 6R ”
Using these definitions, signal-to-noise ratio and porosity measurement resolution are reciprocals: doubling the signal-to-noise ratio halves the porosity resolution.
Figure 3 is a plot of signal-to-noise ratio versus far-near separation for several test formations, A fixed near detector position and shielding is shown. Reasonably comparable far shielding was used. Figure 3 shows that, from a statistics point of view, shorter far-near detector separations are preferred in all formations. However, notice that the high porosity water sand signal-to-noise ratio saturates at a
separation of about 14 inches. Comparable results are projected for an ultra-high porosity sand at 63% porosity, such as found in diatomites and clay minerals. Further decreases in separation in high porosity formations will not improve signal-to-noise ratio. Shorter spacings and separations were also found to produce significant increases in the borehole diameter correction, particularly at low porosities.
YY
Recall from Figure 2 that the slope JR/d@ has been significantly reduced. In view of equation (4) this means that signal-to-noise ratios improved because signal (slope) reductions were overwhelmed with statistical noise reductions. With a nominal 20 Ci AmBe logging source, DSN-II far detector count rates in 100% freshwater are over 800 cps.
- 3 -

SPWLA TWENTY-SEVENTH ANNUAL LOGGING SYMPOSIUM, JUNE g-13.1986
Using stationary field measurements in a 67% porosity diatomaceousformation, direct observations of porosity resolution were made, resulting in + 2.3% for DSN-II and t 4.6% for DSN. The effective logging
speed was 30 ft/min, with 3 ft averaging. This porosity regime is most challenging for dual-spaced neutron logging. DSN-II development efforts have resulted in a factor of two improvement in statistical
precision.
BOREHOLE DIAMETER AND STANDOFF EFFECTS
Log accuracy depends on features in addition to statistical precision. Corrections for borehole diameter and standoff variations need to be small, particularly since precise measurements of diameter and standoff may be difficult or impossible under certain hole conditions (rugose wall, elliptical shape, casing presence, unknown cement conditions, etc.).
Figure 4 shows a plot of the DSN-II borehole diameter correction versus porosity. For a 6 inch
borehole diameter, this correction is about 1 pu larger than that for the DSN. For a 10 inch borehole diameter, the DSN-II correction is only about 0.4 pu larger. Porosity values for these observations range from 2 to 35%. Careful selection of source-near detector and near detector shielding are responsible for these only minor differences in borehole diameter correction despite the significant DSN-II decrease in both far detector spacing and far-near detector separation.
Similar results were obtained for the DSN-II standoff correction over the porosity range 2 to 40%. For standoffs of % inch and 1 inch in an 8 inch diameter borehole, respective DSN corrections average -2.2 and -3.8 pu; respective DSN-II corrections average only -2.0 and -3.5 pu. Again, optimal shielding is thought to be responsible for acceptable standoff corrections.
ABSOLUTE CALIBRATION DATA IN LIMESTONES
Figure 5 is a crossplot of measured porosity values and ratios in 6 and 10 inch diameter limestones
and 100% freshwater. These data were supplemented by sand pack measurements at roughly 18% and 40% porosity, with diameters 6,8,10, and 14 inches; and by field measurements in an Arbuckle limestone.
Table 1 summarizes these data. The sand pack data are used only as an aid to correct ratio values to an 8 inch borehole diameter. The 6 and 10 inch limestone data are consistent with data recorded at the University of Houston API Neutron Test Pit Facility at a diameter of 8 inches, but with much smaller errors due to sonde mispositioning.
The continuous curve shown in Figure 5 is the transform that relates ratio values to porosity values during logging. The determination of this curve is based on the test pit and field data, together with theoretical calculations, as will be explained later. It represents the absolute calibration of the DSN-II. The data in Figure 5 and Table 1 need to be corrected for borehole diameter and actual rock volume sampled by the tool. Corrections are also needed for (1 ) matrix density, (2) sigma matrix, and (3) water saturation, These corrections are made in order to conform to standard conditions (Figure 1).
Considerable practical problems exist in determining the exact ratio-porosity transform based upon a limited amount of limestone test tank and field data, particularly at high porosities. Table 1 shows that the highest porosity attained with artificial sand packs is about 42%. However, field experience indicates shale apparent porosities as high as 65% and diatomite effective porosities in excess of 75%. However, note that the freshwater point is both very large and precisely known, ie. 100%. Moreover, its ratio can be measured with a precision of about 0.1%. An important feature of the theoretical calibration procedure that will be described later is that this freshwater point is explicitly included in determining the DSN-II ratio-porosity curve. This significantly improves high porosity absolute calibration accuracy.
- 4 -

SPWLA TWENTY-SEVENTH ANNUAL LOGGING SYMPOSIUM, JUNE g-13.1988
Pronounced curvature in Figure 5 below 2% porosity is the result of field measurements in dense, low porosity limestones such as the Arbuckle in Oklahoma. This behavior is typical for dual-spaced neutron systems,618 but it is not well understood. Several mechanisms have been examined to explain it, including: (1) dead-time correction modifications; (2) unusual behavior in neutron flux at extremely low
formation hydrogen content; (3) detector counting center shifts; and (4) unusual borehole diameter effects. We are continuing to study this problem because it impacts the assignment of apparent limestone porosity values at very low ratio values, such as found on logs through some evaporites. Our theoretical calculations are not as accurate in this ultra-low porosity/ratio region as log measurements require.
However, once this ratio-porosity curve (Figure 5) is determined, using data and theoretical calculations for porosities 2 to 100% and field data below 2%, values along its path are used to determine the coefficients AI,Az,._,A~ in the polynomial expansion
(5) porosity = AO + Aleratio + Az+(ratio)z + ..+ A,+ratio”.
This relationship permits porosity values to be easily obtained from ratio values during logging operations. Segmented polynomials or different kinds of polynomials could also be used.
THEORIES OF NEUTRON SCATTERING AND ABSORPTION
-
Generalized Theory for Lithology and Fluid Corrections
A generalized theory of neutron scattering and absorption has proven helpful for developing corrections to dual-spaced neutron logs to account for unusual lithology and fluid conditions, Such a theory does not have to be able to reproduce actual tool responses in real boreholes to be useful. We adapted a treatment by Beckhurts and WirtzJ for the calculation of the mean squared distance a neutron
travels from birth at high energy in the neutron source; through slowing down by elastic scattering and thermalization; to thermal diffusion and eventual absorption by the formation nuclei. Our method is
equivalent to a five-group diffusion theory and includes special means for handling hydrogen. Averages are performed over all collision angles, path lengths, and energies.
Calculated mean squared distances are related to characteristic lengths by equations of the form:
(6) ave [(distance)21 = 6*(characteristic length)*.
Both quantities are for a specified interval of neutron energies. Characteristic lengths can be measuredll*j3 and crudely pictured as the mean distance for neutrons from a steady source to decay in intensity by a factor 1 /e (=0.368). Characteristic lengths are the spatial analogues of thermal neutron decay times from a pulsed neutron generator. Important examples of characteristic lengths and energies
are:
CHARACTERISTIC LENGTH NEUTRON ENERGY INTERVAL
slowing-down length (Ls) 4.6 MeV-1.46 eV thermalizing length (Le) 1.46 eV-0.025 eV thermal diffusion length (L) 0.025 eV-0.025eV
The DSN-II AmBe neutron source has an average energy of 4.6 MeV; the energy 1.46 eV corresponds to the indium resonance and represents a common point to compare theory and experimental data; finally, the energy 0.025 eV is the thermal equilibrium energy at 20°C. The total migration length (M), corresponding to the neutron energy interval 4.5 MeV to 0.025 eV and to the total mean squared distance of the neutrons from birth to capture, is related to Ls, Le, and L by
(7) M* = L2, + L2, + L2.
w
-5-

SPWLA TWENTY-SEVENTH ANNUAL LOGGING SYMPOSIUM, JUNE g-13,1986
Even though generalized theory does not compute dual-spaced neutron ratio or porosity values in a
borehole environment, it has been useful~for predicting the change in response of DSN and DSN-II to unusual minerals and fluids. This has been accomplished by assuming that tool response (ratio) and total migration length are directly related.5115~16
Our program LCALC embodies this generalized theory and features modest program size, fast
execution speeds, and the ability to combine a number of minerals and fluids together volumetrically. Specification of each mineral or fluid to LCALC generally requires (1) volume fraction, (2) density, and (3) chemical formula. For any mixture of minerals and fluids, LCALC provides a computation of these nuclear properties: (1) bulk density, (2) electron density index, (3) apparent (log) density, (4) photoelectric factor, (5) equivalent Z-value, (6) hydrogen index, (7) capture cross section, (8) thermal diffusion length, (9) thermal diffusion coefficient, (10) thermalizing length, (11) slowing-down length, and (12) total migration
length. The LCALC nuclear data base includes atomic weight, atomic number, and energy dependent cross section information for most of the elements found in logging earth formations.
LCALC calculated thermal diffusion lengths are in excellent agreement with experimental data.3
Experimental values in water range from 2.74 to 2.835 cm; the LCALC value is 2.835 cm. Lucite, with a chemical formula &Ha02 and density 1 .18 g/cc, has an experimental value of 3.14 f 0.03 cm; the LCALC value is 3.103 cm. Carbon at a density of 1.65g/cc has experimental values that range from 52.5 to 56.5 cm; the LCALC value is 55.14 cm.
Table 2 shows LCALC characteristic lengths for limestone plus freshwater. Tabulated slowing down
and migration lengths are in similarly good agreement with other calculated values.9~15 Valente and Sullivan1 reported a slowing-down length measurement of 7.57 f 0.13 cm in water; the LCALC value is 7.77 cm.
Tool Model and Absolute Calibration
Recently we have been able to apply the generalized theory of neutron scattering and absorption to compute DSN-II tool ratios at standard conditions. This method is called direct ratio computation. The density, chemical composition, and volume fraction data of the matrix and fluid components of a
formation can be combined to compute the DSN-II ratio of the formation. Parameters for calibrating the method are determined from DSN-II ratios in limestone and 100% freshwater. It is a semiempirical tool model in which the borehole response is deconvolved from the formation response: portions of the near
and far detector count rates are independent of formation porosity and have been identified with background events arising from neutrons that stream up the tool/borehole region. This method was used to compute the smooth curve in Figure 5 for porosities from 2 to 100% and thereby complete the absolute calibration of DSN-II. Table 2 shows computed DSN-II ratios and corresponding porosity values,
This calibration method combines data and theory with a simple borehole model and represents an
improvement over methods based on arbitrarily drawing in the curve; or using field data with variable composition, density, and absorption cross section; or indirectly using total migration lengths. The explicit use of 100% freshwater data is an important feature of this method. The result is significant improvement in calibration accuracy in ultra-high porosity diatomites and hydrogen-rich clay minerals.
- 6 -

SPWLA TWENTY-SEVENTH ANNUAL LOGGING SYMPOSIUM, JUNE g-13.1986
_*e..
/-
VERIFICATIONS OF DIRECT RATIO COMPUTATION THEORY
Laboratory Sandstone Data
One means for verifying the direct ratio computation method is to examine its predictions for laboratory sandstone data, since the basic response curve was derived from limestone data only. Results are detailed in Figure 6 and Table 3. Laboratory sandstones and sand packs were saturated with a variety of fluids, including freshwater, saltwater, and oil. The most important feature of this treatment is the use of
sigma matrix values in the computation of DSN-II ratios. The need for sigma matrix values to interpret pulsed neutron logs is well established. 10,14 Sigma effects on dual-spaced neutron logs are also known.7,13 In Figure 6, curves of ratio versus porosity have been constructed with sigma matrix values of 4.6, 10, 20, and 40 cu. The predicted clean lime, clean sand difference is 7 pu at 30% porosity; this is too large by about 3 pu compared with field results because sigma matrix is only 4.6 cu for clean sand. The dashed curve in Figure 6 is the predicted DSN-II field sandstone ratio-porosity transform for a sigma matrix of 10 cu. Test pit data points are shown superimposed with the theoretical curves in Figure 6. These formations have measured sigma matrix values17 that vary from 8 to 12 cu. It can be seen that the
freshwater points lie almost directly on the calculated field sand line, thereby verifying the direct ratio computatron method.
A more detailed analysis is needed because the laboratory sands do not have matrix capture cross sections exactly equal to 10 cu. Also, two of the sand packs are saturated with oil or saltwater. Table 3 summarizes the results of this detailed analysis. The tabulated matrix, liquid, and air volume fractions, when applied to the density, sigma matrix, and fluid compositions, produce calculated ratios equal to the experimentally measured DSN-II ratios. The measured liquid volume fractions are equal to the calculated volume fractions to within an average of less than 0.005 (0.5 pu). It is evident that the direct ratio
computation method represents a reasonable model of DSN-II response to formation minerals and fluids for liquid-filled boreholes. This view will be reinforced later when calculated values of apparent bulk density
versus apparent limestone porosity are presented (Figure 7) and a discussion of density and neutron measurements in diatomites is presented (Figure 6).
Of particular Interest is the treatment of the oil and saltwater sands at 36% porosity. These two formations plot 2 or 3 pu to the northwest of the field sand line at 10 cu, despite the fact that both have sigma matrix values of 8 cu. The oil has a density of 0.8072 g/cc and a carbon weight fraction of 0.8585
g/g The saltwater sand has a salinity of 150 Kppm NaCI. Both sands have a matrix density of 2.64 g/cc. Direct ratio computations combine all this information together simultaneously with matrix composition
and porosity to accurately predict both salinity and hydrocarbon effects. With the direct ratio computation method, there is no need to cascade such corrections or to use hydrogen index arguments based on average hydrocarbon behavior. An important by-product of this process is that the absolute calibration of the dual-spaced neutron tool and a number of its corrections for lithology, salinity, hydrocarbons, other gases, etc. are combined into a single, coherent description of the response of DSN-II to earth formations,
Dirty field sands were modeled by inserting trace amounts of gadolinium into the sand matrix; this has a strong effect on sigma values but a negligible effect on all other density and neutron parameters, Similar results were obtained using boron. A correction for compaction was not made, but this would bring measured and calculated volume fractions into even closer agreement.
Other Predicted Features in Sandstones
Figure 6 shows that the sigma matrix effect saturates. The effect on ratio and porosity values in going from 20 to 40 cu is less than 50% of the effect in going from 4.6 to 20 cu. Analysis shows that this is due to the relationship between slowing down and thermal diffusion lengths and their relative sensitivities to the presence of strong thermal neutron absorbers such as boron, chlorine, and the rare earths. This saturation exhibited by the sigma matrix effect represents an important advantage of dual-spaced ratio logging in comparison with single detector logging methods.
YY
- 7 -

SPWLA TWENTY-SEVENTH ANNUAL LOGGING SYMPOSIUM,JUNE g-13.1986
Detailed study shows that sigma matrix values can be a controlling factor not only in determining the
basic freshwater sandstone response, but also in obtaining salinity and hydrocarbon effects. In some cases, no difference between oil and saltwater will occur. In other situations, a contrast will appear.16 These oil-water differences are not suitable for hydrocarbon saturation determinations in primary or exploratory logging. However, for monitoring production or flood programs, these differences can be carefully accounted for and/or utilized to improve porosity and saturation determinations.
Extended Neutron-Density Crossplot
Another means for using sandstone data to verify direct ratio computation theory is to examine its
predictions for neutron-density crossplots. Figure 7 shows computed results for freshwater saturated formations with sigma matrix set to IO cu for dolomite and all Si02 minerals. Sigma matrix for limestone was fixed at 7.1 cu. In the porosity region from about 2 to 40%, the sandstone-limestone differences are in
excellent agreement with prior published crossplots and thereby support the direct ratio computation
method.
The accuracy of computed density-neutron crossplots such as for Figure 7 is questionable for
porosities below about 2%. This region needs more field data and theoretical study. Direct ratio computations can effectively generate crossplot information for a mixture of any mineral and any fluid in any volumetric combination. Calculated Pe information is also available for these mixtures.
Diatomaceous Formations
Figure 6 also includes a field data point at an ultra-high porosity labelled “diatomaceous”. Stationary log measurements show that this point has a DSN-II ratio of 13.24 (corrected to an 8 inch borehole diameter) and a Spectral Density Log apparent bulk density of 1.483 g/cc. Use of the nominal field sand curve in Figure 6 yields an apparent sandstone porosity of 64.4%. At a matrix density of 2.65 g/cc, the bulk density represents an SDL* porosity of 70.7%. This neutron-density crossover is not due to the presence of gas - it is generated because the true matrix density is not 2.65 g/cc. Both the SDL and DSN-II logs need to be corrected to the proper density in order to obtain the true formation porosity.
Direct ratio computations were used to obtain unique matrix density and porosity values for this formation at 2.48 g/cc and 66.9% - these values are in excellent agreement with core data and field
experience in this area. Tfie measured values of DSN-II ratio and SDL bulk density, along with a sigma matrix value of 10 cu, were input to the direct ratio computation program and both matrix density and porosity were independently varied until the above unique solution was obtained. Freshwater with no gas was used as the formation fluid.
Recall the discussion of extended density-neutron crossplots and Figure 7. Notice from this figure
that a neutron porosity value of 64% obtained while logging on a sandstone matrix and a bulk density log reading of 1.48 g/cc correspond to an SiOp porosity of 67% at a matrix density of 2.48 g/cc, in agreement with the present discussion.
Si02 can exist in nine states called polymorphs with matrix densities from 2.20 to 4.35 g/cc.18
Stishovite (4.35 g/cc), coesite (3.01 g/cc), high quartz (2.53 g/cc), high tridymite (2.20 g/cc) and high cristobalite (2.20 g/cc) are rare. Keatite (2.50 g/cc) is synthetic. Low quartz (2.65 g/cc), low tridymite (2.26 g/cc), and low cristobalite (2.32 g/cc) are common. Pure diatomites with a matrix density as low as 2.26 g/cc can exhibit extremely high porosities owing to the honeycomb-like internal structure of their diatom shells. These diatoms are siliceous in nature. Bound water is not necessarily a component of their ultra-high neutron porosity log values. 11,20 A mixture of low quartz and low tridymite could produce an average density of 2.48 g/cc obtained in the above example.
The fact that the DSN-II can perform at these ultra-high effective porosities also means that more accurate interpretations in other very high apparent porosities (eg. shaly sands) are anticipated. There is
*A mark of Halliburton Company
-a-

SPWLA TWENTY-SEVENTH ANNUAL LOGGING SYMPOSIUM,JUNE g-13,1986
no need to modify the very high porosity limestone ratio-porosity transform to fit high porosity sandstone logging data.12 These accuracy improvements are a direct result of combining limestone test tank data, 100% freshwater data, and theory to determine the DSN-II absolute porosity calibration.
MAINTAINING PRECISION AND ACCURACY
Although the precision and accuracy of dual-spaced neutron measurements have been improved by DSN-II development, considerable effort is required to maintain these improvements through the manufacture and routine use of a series of logging tools. Tool design and manufacturing techniques have been greatly improved to insure uniformity of individual DSN-II tools. Both shop calibration and wellsite
checks have been made more accurate and precise. All of these improvements combine to provide precise and accurate DSN-II porosity measurements in routine use.
The error analyses for these areas of improvement were based on direct repetition experiments and represent errors due mainly to difficulties in positioning of equipment. Errors due to nuclear statistical fluctuations are negligible because count times for calibration and checking were sufficiently long to
make them so. Porosity errors corresponding to ratio errors will be quoted at a porosity of 20%.
Uniformity of Manufactured Tools
Table 4 shows actual test tank, calibrator tank, and field check block data for the first twelve manufactured DSN-II tools. This information was recorded to estimate manufacturing tolerances for the DSN-II. Mean and standard deviation values are provided for each measurement. The 100% freshwater data point permits a direct look at manufacturing uniformity because it has less than 0.1% precision errors. Data for the 6 inch diameter limestones, calibrator tank, and field check block have larger errors due to standoff, etc. Looking at the 100% freshwater column, it is evident that DSN-II tools are being manufactured with a tolerance of 1 .l%, corresponding to an error of 0.3 pu at 20% porosity. This means that all DSN-I I units will be corrected by about the same amount when they are initially calibrated to match the response (ratio) of the standard tool.
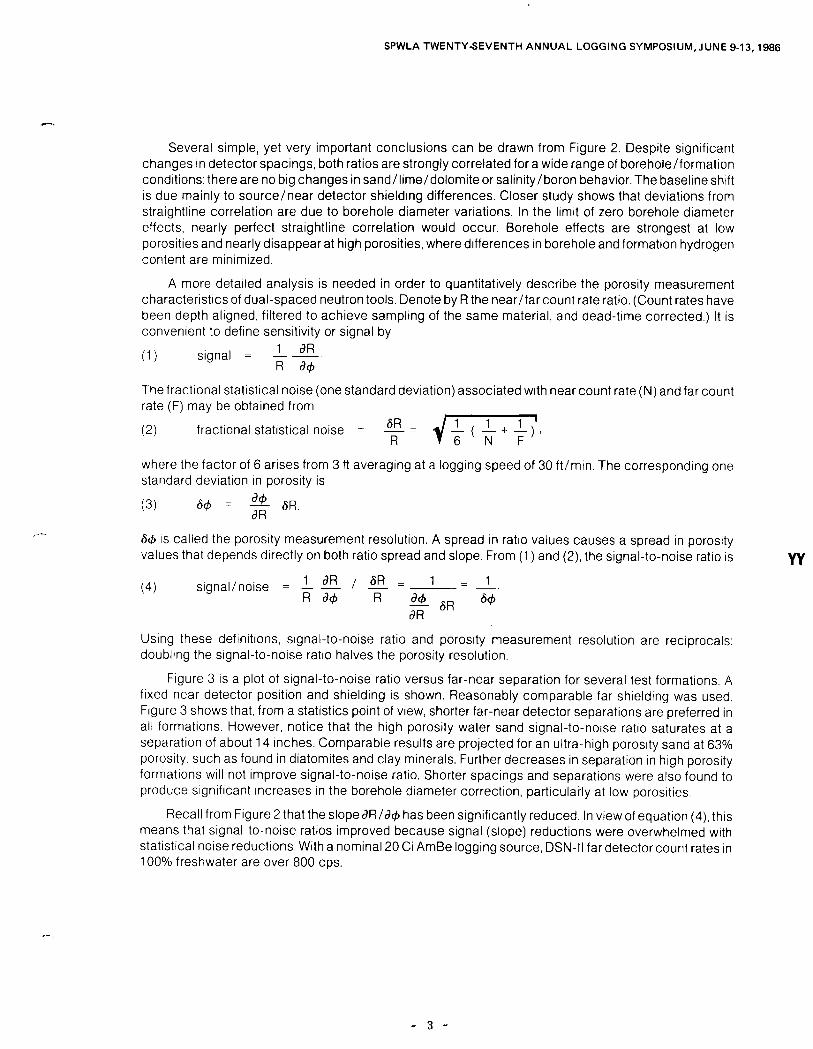
Shop Calibration Accuracy
Figure 8 shows a horizontal water-filled tank that is used to calibrate the DSN and DSN-II dual- spaced neutron tools and the TMD* tool. This tank is sufficiently large that calibrations are independent of shop environment, such as the presence of walls, personnel, etc. The master calibrator tank in Houston has a standard DSN-II ratio of 6.933. This corresponds to a standard conditions porosity of 26.6%. Shop
calibrators are similar tanks located in districts worldwide. Each shop tank has its own ratio as determined in Houston using a standard tool and the master tank.
Calibration of a DSN-II tool to a shop calibrator tank consists in matching that tool’s ratio to the tank ratio by the determination of the tool’s gain factor. This factor converts, by multiplication, any raw ratio into a calibrated ratio during subsequent checking and logging operations. The ratio response of the standard tool and the calibrated tool are thereby made identical and they will yield the same porosity values, Calibration involves placement of the actual logging source directly into the DSN-II sonde in the standard logging position.
The total measured precision in determining a tool’s gain factor is less than 0.23%, corresponding to an error of less than 0.1 pu at a porosity of 20%. During a shop calibration, the tool gain factor is checked to make certain that it remains in the interval 0.9 to 1 .l , ie. that its response is within 10% of the standard tool. This policy is very conservative, since gain factors as high as 1.6 have been induced in the laboratory to calibrate DSN-II tools and then successfully log with them.
YY
*A mark of Hahburton Company
- 9 -

SPWLA TWENTY-SEVENTH ANNUAL LOGGING SYMPOSIUM, JUNE g-13.1986
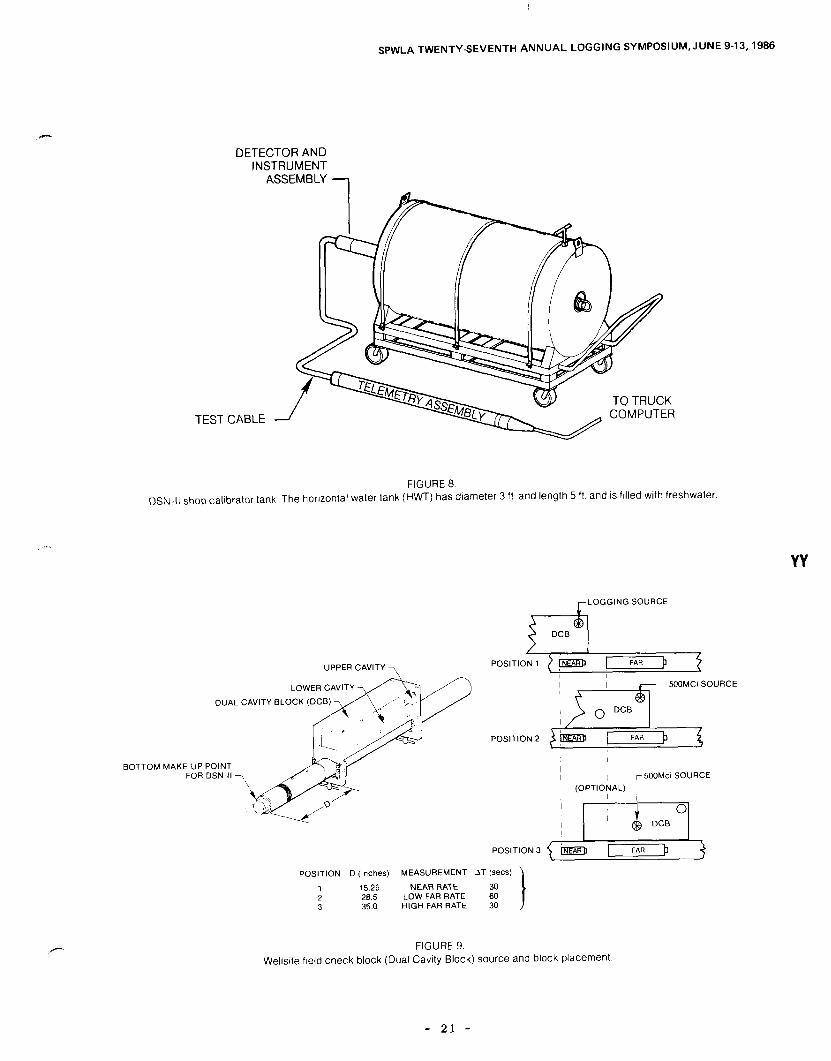
Wellsite Check Precision and Accuracy
A dual-cavity block is a portable device that verifies the current tool calibration during checks at the wellsite before and after logging. This block contains material with a high hydrogen index. Because of its
small size, block measurements are not accurate and not suitable as a calibrator -they are somewhat sensitive to the external environment. The precision for check block usage is less than 3% and
corresponds to an error of 0.8 pu at 20% porosity.
Figure 9 shows that checks involve placement of both the logging source and subsequently, an auxiliary source, into the block, ie. not directly into the sonde logging position. Two different source positions within the block are used, as well as two different positions of the block relative to the sonde. A check ratio is computed from near and far rates, but these rates do not correspond to one single source
placement and block positioning.
Dual-cavity block field check sequences were developed in order to improve both measurement precision and accuracy. For a source in either cavity, the block is positioned on the sonde so as to maximize the observed count rate. This strategy improves accuracy because it accentuates detection of neutrons that thermalize and transmit within the block relative to those that leave, scatter in the surrounding environment, and then are detected. Measurements are thereby made less sensitive to this environment. Also, at the position of maximum count rate, sensitivity to block positioning on the sonde is minimized. Another feature of field block checks is that they involve near and far count rates actually encountered in real logging operations, so that counting performance and dead-time effects are carefully
monitored.
During check operations, block apparent porosity values are compared with a tolerance level of f0.9 pu to help the engineer determine the validity of the current tank calibration. Shop, before and after
checks are influenced by changes not only in tool operation, but also by changes In tool/block environment, such as herght above ground level or the presence of steel plates or girders or barrels of liqurds. If a check is out of tolerance, the logging engineer must determine if significant environmental dtfferences have prevented calibration validation. If he decides that the primary tool has caused a check failure, then the following hierarchy of operations is generally followed:
(1 ) use the backup tool, it it is within tolerance; (2) use the tool closest to tolerance, log, recalibrate in the shop, and recompute the log; (3) obtain a third tool.
LOG REPEATABILITY IN LOW POROSITY LIMESTONES AND HIGH POROSITY SANDS
Figures 1 Oa and 1 Ob show typical DSN-II logs and repeat sections in low porosity limestones and high porosity sands, respectively. In both examples, the logging speed was 30 ft/min and 3 ft averaging was used. Repeatability is excellent in the low porosity open hole logs shown in Figure 1 Oa because count rates are very high and the corresponding statistical noise is very low. Refer to equation (2). Figure 1 Ob shows present DSN-II repeatability in very shallow, uncompacted Gulf Coast shaly sands in a cased borehole. Repeatability here is controlled by lower count rates and higher statistical noise due to (1) high hydrogen content, (2) trace amounts of strong thermal neutron absorbers often associated with shaly sands, and (3) casing presence. This example is typical of the high porosity logging environments that DSN-II development seeks to address. Count rates here are similar to those seen in diatomites. Absolute porosity calibration accuracy has been significantly improved at these high and ultra-high porosities relative to prior loggrng tools. Statistical noise has been reduced by a factor or two, but it remains a major factor limiting log repeatability. Slower logging speeds and/or repeat runs can be used to further reduce statistical noise and improve log repeatability in these regions.
- 10 -

SPWLA TWENTY-SEVENTH ANNUAL LOGGING SYMPOSIUM, JUNE g-13,1986
ACCURATE COMPUTATIONS FOR DSN-II MONITORING APPLICATIONS
The direct ratio computation method can provide accurate information about DSN-II response In formations with a wide range of minerals and fluids. The input does require some detailed information
about the chemical and physical properties of a formation, such as might be available in various monitoring operations. In some applications, laboratory modeling of actual reservoir thermodynamic behavior is not feasible, and theory must be used. Direct ratio computations provide an alternative to other methods that use total migration length, hydrogen index, or excavation effect mechanisms.
Shaly Sand Gas Reservoir with Saltwater Drive
Figure 11 presents an example of a shaly sand gas reservoir with a natural saltwater drive. In this example, sandstone of matrix density 2.65 g/cc and sigma matrix of 10 cu contains 20% pure kaolinite by volume of total matrix material. The natural gas contains these mole O/o components: 80% methane, 15% H&, and 5% nitrogen; gas density is 0.3 g/cc. The water salinity is 110 Kppm NaCI.
In Figure 11, the solid lines are the theoretically calculated DSN-II ratio versus porosity response
curves at various gas saturations, using only the sand, kaolinite, and fluid parameters above. The dashed line In Figure 11 illustrates the calculated DSN-II response with no kaolinite and no gas. The difference between this curve and the other 0% gas saturation line is caused by hydrogen within the kaolinite. The X-axis in Figure 11 is the total formation porosity. The specification of this problem uses only the four constituent descriptions, without any need for excavation volume or hydrogen index mechanisms. The exact chemical formula and density of kaolinite are used.
Prior treatment of this type of problem by the excavation effect technique is complicated because a portion of the material requiring excavation contains hydrogen. Direct ratio computations are straightforward. InformatIon such as that shown in Figure 11 would be very useful for monitoring this
reservoir as the natural gas is produced and the saltwater encroaches back into the reservoir.
Flooding a Hydrocarbon with CO2 Plus Contaminants
In this hypothetical example, the flooding of a 100% oil saturated sand by a contaminated COZ mixture IS considered. The sand has matrix density 2.65 g/cc and matrix cross section 10 cu. The hydrocarbon has density 0.90 g/cc and carbon weight fraction 0.87 g/g. The flood solvent has these mole O/O components: 75% C02, 10% methane, 7% ethane, and 2% each of propane, butane, nitrogen, and
H2S; the solvent density was 0.664 g/cc. Such a mixture could be found naturally or could develop as a result of reinjecting contaminated pure Cop. This information was used as input to the direct ratio computation program to generate the curves at various saturations shown in Figure 12.
Prior to flooding, suppose a particular interval has porosity 34%, with corresponding DSN-II ratio 9.2; these are the base values shown in Figure 12. At some later time during a monitor log of the flood, suppose a DSN-II ratio of 6.6 is recorded at this same interval. From Figure 12, since porosity is known to be 34%,
the predicted solvent saturation is about 27%. Information similar to that shown in Figure 12 can be used to account for changes in the properties of the solvent and the hydrocarbons as the flood progresses,
Notice that even at solvent saturations of 1 OO%, ratio values generally remain above those found near zero porosity. This is a direct consequence of the density of the solvent mixture and the hydrogen content of the contaminants in the solvent. Calculations for pure CO2 show that saturations In excess of about 80% can drive ratio values below those seen at zero porosity. The exact saturation at which this occurs depends on gas density. Excavation effect and hydrogen index techniques, along with simple thermal neutron migration length correlation, have been used in the past in an attempt to handle this situation, but it becomes necessary to make an arbitrary extrapolation of thermal neutron migration lengths to negative porosities.5 Such constructions are not needed using the direct ratio computation method.
YY
- 11 -

SPWLA TWENTY-SEVENTH ANNUAL LOGGING SYMPOSIUM, JUNE g-13.1986
Flood monitoring may be a good application for direct ratio computation methods because more
accurate information about formation properties is generally available and accurate calculations are more critical. Also, logging data obtained by repeat runs are more precise and accurate. Under favorable conditions, it may be possible to study flood solvent/hydrocarbon mixing at actual reservoir conditions. If
fluid saturation is known, composition changes caused by pressure, temperature, or other variations may be estimated from log response by using the direct ratio computation method. In this example, the density
of the contaminated CO2 flood solvent was given, as well as that for the hydrocarbons being flooded. It was assumed that the neutron scattering and absorption properties of the resulting mixture of flood agent and hydrocarbons could be determined solely from these densities and the stated chemical compositions of these components prior to mixing. This is not a limitation of the method. If the density and chemical formula of the solvent/hydrocarbon mixture (miscible or not) is known, accurate predicitions of DSN-II
response can be made.
NUCLEAR PROPERTIES OF SELECTED MINERALS
Table 5 shows neutron properties of a few selected minerals 18 as predicted by direct ratio computations, including DSN-II ratios and apparent limestone porosities. In keeping with development efforts aimed towards improved porosity measurement accuracy at high porosity values, Table 5 includes several minerals with apparent limestone porosities in excess of 100%. Borax has a predicted apparent porosity of (124%) with a hydrogen index of 0.803. Thus, although apparent limestone porosity and hydrogen index are strongly correlated, accurate porosity determination requires detailing the nuclear properties of all the elements in a mineral. Our calculations are not accurate below a porosity of (2%). Field data must be used to relate measured values of ratio and apparent limestone porosity in this
ultra-low porosity range.
The main limitation in determining the DSN-II ratio and apparent limestone porosity of a mineral is probably inaccuracy in the density and chemical formula for the mineral. The calculated data in Table 5 is accurate to about l-3%. A correct accounting of hydrogen within the chemical formula and the corresponding matrix density are critical in the calculation of neutron lengths, ratios, and apparent
limestone porosity values.
CONCLUSIONS
A new dual-spaced thermal neutron tool has been developed that offers significant improvements in
both statistical precision and porosity measurement accuracy, particularly at high and ultra-high porosity values. Statistical precision was improved by increasing far detector count rates without significantly increasing the corrections for borehole diameter, standoff, or lithology. Absolute calibration accuracy has been improved by combining limestone data, 100% freshwater data, and theory to determine the relationship between ratio and porosity. Precision and accuracy are maintained by improved design/manufacturing techniques, shop calibration procedures, and wellsite checks.
DSN-I I ratios and apparent limestone porosities can be accurately predicted for virtually any mixture of specific minerals and fluids, including saltwater, hydrocarbons, and gases. Significant improvement in the overall accuracy of formation porosity measurements is achieved because the basic relationship between ratio and porosity and all matrix/fluid corrections are computed simultaneously. The theory provides an improved method for calculating the response of dual-spaced neutron logs to gases in the presence of clay minerals and to gases with low hydrogen content. Neutron-density log crossplots for lithology with any combination of minerals and saturating liquids can be generated, as can crossplots to obtain gas saturations for various minerals and gas properties.
- 12 -

SPWLA TWENTY-SEVENTH ANNUAL LOGGING SYMPOSIUM, JUNE g-13.1986
ACKNOWLEDGMENTS
The author wishes to thank the Welex Research and Engineering Departments for support of this
work. In particular, Randy Gold and Axe1 Kirchgessner not only helped in the extensive data acquisition, but they also contributed to the high quality of that data. Dan Arnold, Ward Schultz, and Harry Smith, Jr. have made substantive suggestions and critical evaluations during DSN-II development.
REFERENCES
9
10
11
12
13
14.
1.5
16.
17
18
19 20
Valente, F.A., and Sullivan, R.E., Nuclear Science and Engineering, Vol. 6, p. 162, 1959. Amaldi, E., “The Production and Slowing Down of Neutrons, Handbuch der Physik, XXXVlll/2, Springer-Verlag, Berlin, 1959. Beckhurts, K.H., and Wirtz, K., Neutron Physics, Springer-Verlag, Berlin, 1964. Allen, L.S., Tittle, C.W., Mills, W.R., and Caldwell, R.L., “Dual-Spaced Neutron Logging for Porosity,” Geophysics, Vol. 32, No. 1, pp. 60-68, 1967. Segesman, F., and Liu, O., “The Excavation Effect,” SPWLA Twelfth Annual Logging Symposium, May, 1971. Alger, R.P., Locke, S., Nagel, W.A., and Sherman, H., “The Dual-Spacing Neutron Log - CNL,” Paper No. SPE 3565, 46th Annual Meeting of the Society of Petroleum Engineers, October, 1971. Allen, LS., Mills, W.R., Desai, K.P., and Caldwell, R.L., “Some Features of Dual-Spaced Neutron Porosity Logging,” SPWLA Thirteenth Annual Logging Symposium, May, 1972. Truman, R.B., Alger, R.P., Connell, J.G., and Smith R.L., “Progress Report on Interpretation of The Dual-Spacing Neutron Log (CNL) in the US.,” SPWLA Thirteenth Annual Logging Symposium, May, 1972. Kreft, A., “Calculation of the Neutron Slowing Down Length in Rocks and Soils,” Nukleonika, Vol. XIX, pp. 145-l 56, 1974. Allen, L.S., and Mills, W.R., Jr., “Measurement of the Thermal Neutron Absorption Cross Section of Rock Samples by a Pulsed Source Method,” SPWLA Fifteenth Annual Logging Symposium, June, 1974. Hurd, D.C., and Theyer, F., “Changes in the Physical and Chemical Properties of Biogenic Silica from the Central Equatorial Pacific: Part II. Refractive Index, Density, and Water Content of Acid-Cleaned Samples,” American Journal of Science, Vol. 277, November, 1977, pp. 1138-l 144. Edmudson, H., and Raymer, L.L., “Radioactive Logging Parameters for Common Minerals,” SPWLA Twentieth Annual Logging Symposium, June, 1979. Arnold, D.M., and Smith, H.D., Jr., “Experimental Determination of Environmental Corrections for a Dual-Spaced Neutron Porosity Log,” SPWLA Twenty-Second Annual Logging Symposium, June, 1981. Czubek, J.A., Drozdowicz, K., Krynicka-Drozdowicz, E., Igiclski, A., and Woznicka, U., “How to Measure the Neutron Absorption Cross Section of Rock Samples,” SPWLA Twenty-second Annual Logging Symposium, June, 1981. Scott, H.D., Flaum, C., and Sherman, H., “Dual Porosity CNL* Count Rate Processing,” SPE 11146, September, 1982. Sherman, H., Ullo, J., and Robinson, J.D., “Effect of Oil on the CNL*, SPWLA Twenty-Fourth Annual Logging Symposium, June, 1983. Schultz, W.E., Smith, H.D., Jr., Verbout, J.L., Bridges, J.R., Garcia, G.H., “Experimental Basis for a New Borehole Corrected Pulsed Neutron Capture Logging System (TMD’),” SPWLA Twenty-Fourth Logging Symposium, June, 1983. Klein, C., and Hurlbut, C.S., Jr., ManualofMineralogy(AfterJ.D. Dana), 20th Edition, John Wiley and Sons, New York, 1985. Welex Log Interpretation Charts, chart CP-2a, 1985. Isaacs, Caroline M., “Porosity Reduction During Diagenesis of the Monterey Formation, Santa Barbara Coastal Area, California,” The Monterey Formation and Related Silicieous Rocks of California Society of Economic Paleontologists and Mineralogists, pp. 247-271.
w
- 13 -

SPWLA TWENTY-SEVENTH ANNUAL LOGGING SYMPOSIUM,JUNE g-13.1986
A,
TABLE 1.
Basic test tank data with freshwater filled boreholes. The saltwater has salinity 150 Kppm NaCI. The oil has density 0.8072 g/cc and carbon weight fraction 0.8585 g/g.
DESCRIPTION BOREHOLE MATRIX DIAMETER DENSITY
(Inches) (g/cc)
MATRIX FORMATION ABSORPTION FLUID
CROSS SECTION (FW=freshwater)
(cu)
FLUID SATURATION
(%)
POROSll’f
(%)
DSN-II RATIO
Carthage Marble 6 268 96 FW 78 1.8+_0 4 171*01 10 268 FW 67 1.8fO 4 2.4OfO 1
lndlana LImestone 6 270 77 FW 88 13 0f0.5 3.56fO 1 10 2.68 FW 95 12.4+0.5 4.28fO 1
Austm Chalk 6 2.69 7.7 FW 996 26 2kO.8 6 22fO.l 10 2.69 FW 970 26.6&O 8 7 56f0.02
Freshwater - - - FW 100 100 15 82+_0.02 ------ -----------------__-
Dual Sand Pack 6 264 8.8 FW -80 18+3 3 2710 1 flne&coarse 8 FW -80 3 87’rO 1
10 FW -80 4 3310.1
Coarse Sand Pack 6 264 119 FW -99 40f2 8 23&O 1 8 FW -99 9 0310.1
10 FW -99 9 55fO 1
Berea Sand 8 266 103 FW -99 20 2kO.5 5 46kO 1
Kasota Dolomlie 8 2.76 96 FW -99 130+_05 5.11 *o 1
Coarse Sand Pack 6 2.64 8.1 OIL 99 36 6f2 8.07fO 1 10 OIL 9 35*0 1 14 OIL 9 94*0 1
Coarse Sand Pack 6 264 81 SALTWATER 99 35 4i2 7 66?0 1 10 SALTWATER 9.07+0 1 14 SALTWATER 9 73fO 1
- 14 -

SPWLA TWENTY-SEVENTH ANNUAL LOGGING SYMPOSIUM, JUNE g-13.1986
TABLE 2.
Direct ratio computation results for limestone and freshwater. The limestone has density 2.71 g/cc and sigma matrix 7.1 cu. The slowing down lengths correspond to the neutron energy interval 4.6 MeV to 1.46 eV.
H?OVOLUME
FRACTION
THERMAL SLOWING-
DIFFUSION DOWN
LENGTH(cm) LENGTH(cm)
TOTAL
MIGRATION
LENGTH(cm)
0%II
RATIO DSN-II
LIMESTONE
POROSIlY
000 117 233 280 1 31 0 004 001 114 209 249 1.58 0011 002 110 193 230 1 80 0018 005 101 165 197 2.41 0050 010 89 141 169 339 0101
015 79 127 151 443 0150
020 71 117 139 554 0199
025 65 110 129 669 0250
030 60 105 121 785 0301
035 55 100 115 898 0350
040 52 96 110 10.05 0399
050 45 91 102 11.91 0501
060 41 86 96 1333 0.601
0 70 37 83 91 1434 0697
080 33 81 88 1502 0.799
0 90 31 79 8.5 15.48 0.904
1 00 28 77 8.3 1577 0997
. .
TABLE 3
Venfication of direct ratio computation theory using laboratory sandstone data. The matrix volume fraction plus computed liquid and air volume fractions produce a calculated ratio equal to the measured DSN-II ratio.
YY
FORMATION
TESTTANKlNPUTlNFORMATlON CALCULATEDRESULTS
MATRIX MATRIX FLUID POROSITY MATRIXVOLUME MEASUREDAND LIQUID AIR MEASURED LIQUID DENSITY ABSORPTION FRACTION CALCULATED VOLUME VOLUME VOLUMEFRACTION
(g/ccl CROSS-SECTION (=1-PoRosln) DSN-IIRATIO FRACT'oN FRACTION -COMPUTEDLl(-JU,D 0) VOLUMEFRACTION
TennesseeC)uariz~le 265 8 FRESHWATER 00595 09405 2101 00587 00008 00002
Sano Pack 264 11 9 FRESHWATER 042 058 9034 0405 0.015 0011
Sano Pack 264 81 SALTWATER 0354 0646 8544 0342 0012 0009
Sane Pack 264 81 OIL 0366 0634 8821 0362 0004 00003
- 15 -

SPWLA TWENTY-SEVENTH ANNUAL LOGGING SYMPOSIUM,JUNE g-13,1986
TABLE 4. Test tank ratios for the first twelve manufactured DSN-II tools. Freshwater is in both the formations and the boreholes.
TOOL 100% GINCH DIAMETER GINCH DIAMETER GINCH DIAMETER CALIBRATOR FIELDCHECK # FRESHWATER CARTHAGEMARBLE INDIANALIMESTONE AUSTINCHALK TANK BLOCK
18%POROSITY l3O%POROSIrY 262%POROSlTY
6
9
IO 11 12
14982 1.684 3.414 5.920 6670 5.755 15046 1.667 3.414 5914 6.693 5.466 14998 1684 3413 5935 6671 5805 14968 1672 3423 5949 6.706 5805 15023 1633 3506 5846 6.884 5840 14960 1678 3572 6134 6565 5926 14989 1587 3569 6.096 6941 5832 15053 1576 3.520 6.012 6681 5919 15068 1.580 3503 6015 6690 5809 14921 1605 3.500 6084 6547 5.788 14767 1.590 3510 6006 6598 6317 15493 1652 3.634 6301 6802 5975
MEANilSTDDEV- 15022f0168 1634+0044 349El*o.o72 6018+0.123 6704+0119 5853kOl93
STD DEV -- MFAN
1 1% 2 7% 2 1% 2.0% I 8% 3.3%
TABLE 5. Results from direct ratio computation theory for a few selected minerals. See reference 18 for mineral properties.
MINERAL FORMULA DENSITY HYDROGEN ABSORPTION THERMAL SLOWING- TOTAL DSN-II DSN-II
(g/ccl INDEX CROSS- DIFFUSION DOWN MIGRATION RATIO APPARENT SECTION LENGTH LENGTH LENGTH LIMESTONE icu) (cm) icm) km) POROSITY
Anhydrrle CaSOa 2.94 00 125 97 301 343 1 01 -0002 (re -0.2%) Borax NazB405(OH)~8H20 1.7 a.803 8257 01 67 67 1629 1.241 Calcrle CaC03 271 00 71 117 233 28.0 1 31 0.004 Chlorite (Mg.Fe)~(Sr,Al)~Olo(OH12(Mg,Fe)3(0Hls 295 0.213 35.6 36 12.1 127 692 0.260 Dolomrte CaMW& 285 0.0 47 137 203 261 1.46 0080 Grbbsrle AI(OH)j 235 0814 22.3 2.9 68 74 16.41 1312 Gypsum CaS042Hz0 232 0486 186 39 90 9.9 1262 0.549 Halrle NaCl 2.16 00 7575 0.6 368 39.5 087 -0005 Kaolrnrle Al2Si20j(OH)d 26 0.363 130 5.2 96 110 1006 0.399 Montmorlllonite (AI,Mg]&O&(OH)~~12H20 25 0474 147 44 a.7 98 1278 0.560 Muscovrte KA12(AIS~30.,Z)(OH)2 282 0.128 169 61 14.4 158 3.94 0127 Polyhalite KZCa2Mg(SOI14 2Hz0 270 0166 23.8 48 135 145 4.94 0172 Quartz SlO1 265 0.0 46 162 28.7 35.4 098 -0003 Sylvtte KCI 199 0.0 572.3 0.9 54.7 591 063 -0.010 Talc Mg$Q@H)z 2.75 0.131 67 9.5 135 167 347 0.105
- 16 -

SPWLA TWENTY-SEVENTH ANNUAL LOGGING SYMPOSIUM, JUNE 9-13.1988
FORMATION
STANDARD CONDITIONS
. LIMESTONE + FRESHWATER
.8 INCH BOREHOLE DIAMETER WtTH FRESH WATER
. SONDE DECENTRALIZED
. 75O F / 1 ATMOSPHERE
k BOREHOLE FLUID
F FAR DETECTOR
NEUTRON SOURCE
FIGURE 1.
Schematic of dual-spaced neutron tool. Lrmestone at standard conditions has density 2.71 g/cc and matrix absorption cross
section 7 1 cu
w
,- FIGURE 2.
DSN ratro versus DSN-II ratro for a wade variety of lithologies, flurds, and borehole diameters
- 17 -

SPWLA TWENTY-SEVENTH ANNUAL LOGGING SYMPOSIUM, JUNE g-13.1986
A. n 20% BORATED SALTWATER SANDSTONE
-. -.
. 38% SALTWATER SANDSTONE
-. -. ‘A.
‘\ ‘.
‘. n -- ._ ‘\
--._ f ‘.
-. n . ‘\ -. ‘.
-. -. -.
-* Y
-. n -. --.. --._ ‘.
--._ -. .A
--._ -. -_ n -. n --__‘-_
l ____-----C---_____* ‘-_:-_
--__
-.==
--. I Y--.__
-- -.* ---._ -. ---__*
12 14 16 18 20 22
NEAR TO FAR DETECTOR SEPARATION (inches)
FIGURE 3.
Signal-to-noise ratlo versus near to far detector separation for selected test tanks.
I BOREHOLE DIAMETER
6 (mches,
-12 1 -10 0 10 20 30 40 50 60 10 *o 90
DSN-II APPARENT NEUTRON POROSITY (%)
FIGURE 4.
DSN-II borehole diameter correction versus porostty at various borehole diameters, with test tank data superimposed. Note that the porosity scales are In the ratlo 1:4.
- 18 -

SPWLA TWENTY-SEVENTH ANNUAL LOGGING SYMPOSIUM, JUNE g-13.1986
16
14
12
10 0 F
2 = 8
6
1
4
2
O-
FRESH WATER J
06
0 LIMESTONE 13 SANDSTONE
1
30 40 5u 60 70
TOTAL FORMATION POROSITY (%)
1 _I
60 90 100
FIGURE 5
DSN-II ratlo versus porosity, showing both test tank data and the ratio to porosity response curve
YY
/-
16
14 (DIATOMACEOUS)
12
COURSE SAND PACKS
6 FIELD SAND CURVE
TENNESSEE QUAPTZITE CLEAN SAND CURVE
4
0' 1
-10 0 10 20 30 40 50 60 70 80 90 100
TOTAL FORMATION POROSITY
FIGURE 6. DSN-II ratlo versus porosity showing sandstone data and theoretical curves at various matrix absorDtlon cross sections
- 19 -

SP
WL
A
TW
EN
TY
-SE
VE
NT
H
AN
NU
AL
L
OG
GIN
G
SY
MP
OS
IUM
, JU
NE
g
-13.1986
I , ,
- c
_‘ 9’ m
(33/c)
AllSN
3Cl
Y-In
8 IN
3klV
dd
tl
- 20
-
SPWLA TWENTY-SEVENTH ANNUAL LOGGING SYMPOSIUM,JUNE g-13.1986
DETECTOR AND INSTRUMENT
ASSEMBLY -j
TEST CABLE
FIGURE 8
DSN-11 shoD calbrator tank The honzontal water tank (HWT) has diameter 3 fi and length 5 ft. and is fllled with freshwater
w
r LOGGING SOURCE
s-9 DCB
BOTTOM
LOWER CAVIT
DUAL CAVITY BLOCK (
MAKE-UP POINT FOR DSN-II -,,,
\
POSITION 1
POSIT,ON * ~ ‘JJfMc;E
i
SOOMci SOURCE
I (OPTIONAL)
POSITION D (Inches) MEASUREMENT AT (sets)
1 15.25 NEAR RATE 30
2 28.5 LOW FAR RATE 60
3 35.0 HIGH FAR RATE 30
FIGURE 9.
Wellslte field check block (Dual Cavity Block) source and block placement
- 21 -

SPWLA TWENTY-SEVENTH ANNUAL LOGGING SYMPOSIUM, JUNE g-13.1986
s II 0
CALIPER ----_--------- 16
GAMMA RAY 150
0
i 0
x200
x250
NEUTRON POROSITY -1 ..3-
--_--_--_-----_------------- -.l
NEUTRON POROSITY -2 I.3 -1
--.-,_ 1
,I’
f
L c’
h7,
FIGURE 1 Oa
Typical repeatability in low porosity llmestones logged In open hole
GAMMA RAY
I
i
x900
NEUTRON POROSITY -1 55- .1t
NEUTRON POROSITY -2 75 .1:
I CL. ___.
FIGURE 1 Ob Typlcal repeatability In high porosity Gulf Coast shaly sands logged in cased hole
I I
- 22 -

SPWLA TWENTY-SEVENTH ANNUAL LOGGING SYMPOSIUM, JUNE g-13.1986
h
14
6
4
2
01 0 10 20 30 40 50 60 70 80 90 100
FORMATION POROSITY (%)
FIGURE 11
DSN-II ratto versus porosrty for a natural gas reservoir of sand and kaolinrte The gas IS 80% methane, 15% H2S, and 5%
nitrogen. at a densrty of 0 30 g/cc
YY
CO !NATURAL GAS
SATURATION ,%) 1
0 10 20 _t 30 40 50 60 70 80 J” IU”
MONITOR t BASE ~ FORMATION POROSITY (%)
FIGURE 12.
DSN-II ratio versus porosity for the flooding of a hydrocarbon by a CO2 based solvent. The solvent IS 75% Con, 10% methane;
7% ethane; and 2% each of propane, butane, nitrogen, and H& all at a density 0.664 g/cc. The hydrocarbon has density 0.90
g/cc and carbon wetght fraction 0.87 g/g
- 23 -

SPWLA TWENTY-SEVENTH ANNUAL LOGGING SYMPOSIUM, JUNE g-13,1986
BIOGRAPHY
MICHAEL P SMITH IS a Senior Research
Physicrst in the Research Department at Welex, a Halliburton Company. He received an AB in physics and mathematics from Rockhurst College in Kansas City and an MS in physics and mathematics from The Johns Hopkins University In Baltrmore. He worked brrefly for NASA at Greenbelt, Md. on ionospheric simulation and diagnostics. Mike worked for nine years at the Texaco Bellaire Research
Laboratory on nuclear well logging. He has worked as a Senior Software Engineer for Schlumberger Well Servrces. Mike also was pnncrpal architect and Manager of Computerized Surface Instrumentation for NL McCullough. He forned Welex in 1983 where he works on dual-spaced neutron tools and gamma ray spectroscopy. Mr. Smith is a member of SPWLA and has several articles and patents on nuclear well loggrng.
- 24 -