welding journal | may 2016
TRANSCRIPT
Introduction Gas metal arc welding (GMAW) ispredominantly employed in manufac-turing because of its advantages, suchas relatively lower cost, easier opera-tion, and better adaptability comparedto other welding processes (Ref. 1).Manufacturing productivity can be im-proved by simply increasing weldingspeed and current in GMAW. However,if the welding speed is beyond a cer-tain limit, undercutting defects will oc-cur (Ref. 2). Located in the weld metaladjacent to the weld toe, an undercut-
ting defect is a narrow groove left un-filled by the weld metal during solidifi-cation. Undercutting can also induceother defects, such as humping, stresscorrosion cracking, and so on, whichlimits improvement of manufacturingproductivity (Ref. 3). More severely,undercutting creates a mechanicalnotch at the weld interface that lowersthe static, fatigue, and fracturestrengths of the welded assembly (Ref.4). Therefore, understanding themechanism of undercutting formationis of great significance to suppressthese defects and to achieve higher
welding productivity. Various research has been carriedout to demonstrate the undercuttingformation mechanism qualitativelybased on experimental observations.Ishizaki found the degree of undercut-ting is much more pronounced inhigh-sulphur steels than in low-sulphur casts (Ref. 5). This phenome-non was explained by the change in di-rection of molten metal movementdue to variations in temperature coef-ficient of surface tension with differ-ent sulphur contents (Ref. 6). Howev-er, experiments conducted on low-sulphur steels showed the undercuttingdefect also appears if the welding speedis high (Ref. 7). Matsunawa studied un-dercutting defects by calculating thesurface profile of the weld bead basedon the Young-Laplace equation (Ref. 8);however, the effect of arc force was ig-nored. Nishi and Ohara found undercut-ting defects appear during submergedarc welding when the liquid metal is dis-placed more than the solidificationpoint (Refs. 9, 10). This distributionfeature of the liquid metal in the weldpool is caused by the arc force along thewelding direction. Mendez found thearc pressure pushes the molten metal tothe rear of the weld pool, creating a thinlayer of liquid metal under the arc. Thepremature solidification of this thin lay-er prevents wetting of the side of theweld bead and leads to undercutting de-fects (Ref. 11). Karlsson discussed theinfluence of surface oxides on the weldpool shape during laser-arc hybrid weld-ing. It is reported that different low-density and high-melting-point metallic
WELDING RESEARCH
Undercutting Formation Mechanismin Gas Metal Arc Welding
A visionbased sensing system was used to acquire 2D images of the weld pooland tracer particle movement, and help determine why undercutting occurs
during highspeed welding
BY R. ZONG, J. CHEN, C. S. WU, AND M. A. CHEN
ABSTRACT A visionbased sensing system was improved to acquire 2D images of weld pool shapeand tracer particle movement simultaneously. The improved algorithm that transforms2D image coordinates to 3D world coordinates was calibrated by laser lattice points andits errors were analyzed. Subsequently, the algorithm was used to calculate and analyzeflow velocities of tracer particles, which indicate flow patterns of weld pool on topsurface for different welding speeds. Based on analysis of tracer particle movement,roles of different associated forces, such as gravity, arc drag force, Maragoni force, magnetic force, droplet impact, and viscous force, were investigated. The results show thatliquid metal under the arc decreases to a thin liquid layer if the welding speed is morethan 1.0 m/min. This phenomenon makes viscous resistance increase in the thin liquidlayer, which impedes transverse spreading of liquid metal. Thus, it is difficult for the weldtoe to be filled by molten metal. Meanwhile, experiments revealed the amount offorward molten metal can be ignored in the front and middle of the weld pool.Therefore, it is difficult for the weld toe to be filled by the backward molten metal. As aresult, undercutting defects appear during highspeed welding. Governing equations ofthe undercutting width were deduced based on the arc and weld pool shapes. Furtherstudy has been carried out and the experimental results show that a lowcurrenttungsten argon arc can change molten metal flow and effectively suppress undercutting.
KEYWORDS • GMAW • Undercutting • Vision Inspection • Fluid Flow
R. ZONG, J. CHEN ([email protected]), C. S. WU, and M. A. CHEN are with MOE Key Laboratory for LiquidSolid Structural Evolution and Material Processing,and Institute of Material Joining, Shandong University, China.
WELDING JOURNAL / MAY 2016, VOL. 95174-s
Zong Paper 2015104 May 2016_Layout 1 4/14/16 4:20 PM Page 174

oxides, such as MnO and SiO2, gather atthe weld toe. These metallic oxides floattoward the edge of the weld pool andsolidify on the outer bank of the meltzone. This solidified oxide coating hin-ders the lateral spreading of liquid metal(Ref. 12). Several three-dimensional numeri-cal models have been developed to un-derstand the undercutting formation.Sudnik analyzed the main factors ofundercutting defects using a quasi-stable-state model in which the bal-ance between the distributed forcesand thermal conditions in the weldpool are taken into consideration(Refs. 13, 14). The results showed un-dercutting defects are caused by de-pression of the liquid metal level in theweld pool. However, the usable rangeof welding parameters in this model isrelatively narrow. Recently, Wu stud-ied the GMAW process by numericalsimulation and visual inspection. It
was foundthat high-speedbackward
fluid flow, caused by arc pressure anddroplet impact, is the main reason forundercutting formation (Ref. 15). Sev-eral techniques, such as magnetic con-trol welding and hybrid arc welding,have also been demonstrated to sup-press undercutting defects by slowingdown the backward flow of the liquid(Refs. 16, 17). However, the simulatedresults still lack experimental tests forthe speed of backward fluid flow toverify the undercutting formationmechanism. Based on the weld morphology inthe preparatory GMAW experiments,undercutting defects can be dividedinto two types. The first type is dis-continuous undercutting defects,which have an unstable profile anddiscontinuous distribution, as shownin Fig. 1A. The second type is continu-ous undercutting defects, which have astable profile and continuous distribu-tion, as illustrated in Fig. 1B. Discon-
tinuous undercutting defects usuallyappear in the short-circuit transfermode when an oxidizing shielding gasis used or when the welding current islower than 240 A (Refs. 18, 19). Thewelding process is unstable and causessevere welding spatter that deterio-rates the weld bead appearance (Ref.20). Continuous undercutting defectsusually appear in spray transfer mode.In this mode, the welding process isstable and the welding spatter is low(Ref. 21). However, undercutting de-fects still appear at higher weldingspeeds. Therefore, the formation andsuppression mechanisms of continu-ous undercutting defects were studiedin this work to achieve good-qualitywelds. In this study, a special filter was se-lected based on spectrographic obser-vation of the GMAW arc spectrum.The vision system consisted of a high-speed color camera fixed with the fil-ter to reduce arc light interference.Some particles come into the weldpool from the blind holes in the basemetal and other particles drop into the
WELDING RESEARCH
MAY 2016 / WELDING JOURNAL 175-s
Fig. 1 — Two types of undercutting defects in GMAW.
Fig. 2 — Schematic of visionbased sensing system.
Table 1 — Weld Pool Width and Reinforcement
Test Welding Width Width Error Reinforcement Reinforcement Error No. Speed (cross section) (image) (%) (cross section) (image) (%) (m/min) (mm) (mm) (mm) (mm)
1 0.5 11.01 11.06 0.5 3.18 3.21 0.9 2 0.5 11.03 11.04 0.1 3.16 3.19 0.9 3 0.5 11.04 11.08 0.4 3.16 3.18 0.6 4 1.0 6.27 6.32 0.8 2.23 2.25 0.9 5 1.0 6.25 6.30 0.8 2.24 2.25 0.4 6 1.0 6.23 6.26 0.5 2.21 2.23 0.9 7 1.5 5.40 5.46 1.1 1.79 1.80 0.6 8 1.5 5.42 5.44 0.4 1.78 1.81 1.7 9 1.5 5.40 5.42 0.4 1.76 1.79 1.7
A B
Zong Paper 2015104 May 2016_Layout 1 4/14/16 4:20 PM Page 175

weld pool from a rotating device. Thevisual sensing system was used to cap-ture particle trajectories in the weldpool. With illumination of a low-powerlaser, the fluid flow on the top surfaceof the weld pool was observed to de-tect undercutting formation by analyz-ing the particle trajectories. Three-dimensional data of the weld pool wasalso obtained by an adaptive algorithmand partially used to study the mainfactors influencing undercutting de-fects and to analyze the mechanism ofundercutting formation. Based on theanalysis of the experimental data, the
assistant gas tungsten arc with lowcurrent was used to change the fluidflow in the weld pool of GMAW. Theresults show it has great potential toimprove the GMAW process and thewelding productivity.
Experimentation
Visual Sensing System for FluidFlow of Weld Pool
In order to describe the fluid flowin the weld pool quantitatively (Ref.
22), an improved vision-based sensingsystem was set up, as illustrated in Fig.2. This system utilized a scanninglaser to recover the 3D weld pool sur-face. The GMAW gun and camera arestationary while the workpiece is mov-ing at a speed equal to the weldingspeed (vw). The origin of world coordi-nates (point O, shown in Fig. 2) is theintersection point between the work-piece surface and the extrapolated lineof welding wire. Its X axis is oppositeto the welding direction, Y axis is per-pendicular to the X axis on the work-piece surface, and its Z axis is vertical-ly upward. The first pixel of the imageat the top-left corner is defined as theorigin of image coordinates (pointO*, shown in Fig. 2). Its X* axis is op-posite to the welding direction, and Y*axis is perpendicular to the X* axisdownward. In this system, a DS-UN1401-USB3.0 high-speed color camera wasused to observe the weld pool surface inreal time. Its framing rate was 100 Hz.The principal optic axis of the camerawas fixed on the OYZ plane at a depres-sion angle of 45 deg, as depicted in Fig.2. A prime lens, which has a 35-mm fo-cal length and a 17.5-mm aperture, wasused to ensure that accurate imageswere recorded with little optical distor-tion. In order to observe the fluid flowon the weld pool surface, silicon carbide(SiC) particles were delivered into theweld metal through a special device. Sili-con carbide was selected as the tracerparticle because its melting point ishigher than 3000 K and its density islower than the liquid metal of the weldpool. In addition, SiC has little impacton the welding process compared withrefractory oxides (Ref. 22). Generally,
WELDING RESEARCH
WELDING JOURNAL / MAY 2016, VOL. 95176-s
Fig. 6 — Scanning traces of laser lattice points (I = 250 A, U = 30 V, vw = 1.0 m/min).
Table 2 — Chemical Compositions of Welding Wire and Base Metal (wt%)
Composition (%) C Si Mn P S
Wire (H08Mn2Si) 0.11 0.65 1.80 0.030 0.030 Q235 0.17 0.15 0.30 0.015 0.035
Fig. 4 — Response curve of the CMOS sensor.
Fig. 3 — GMAW arc spectrum.
Fig. 5 — Highresolution image of the weld pool (I = 250 A, U = 30 V, v = 1.0 m/min).
Zong Paper 2015104 May 2016_Layout 1 4/14/16 4:20 PM Page 176

SiC particles should have diameters be-tween 0.5 and 1-mm to avoid meltingby the arc and to ensure free flow. Inthis study, the tracer particles wereplaced in blind holes with dimensions of1 mm diameter and 0.5 mm depth todeliver them safely into the weld pool.Meanwhile, other tracer particles on therotating disk come into the tail of theweld pool through a pipeline, as demon-strated in Fig. 2. A laser generator wasused to provide a precise lattice pointmoving across the weld pool surface tohelp recover all three dimensions of theweld pool. All scanning traces are paral-lel to plane OXZ, and their internalspacing is constant (1 mm) in the Y di-rection. The trace of the laser point isalso demonstrated in Fig. 2. During the GMAW process, arc in-terference needs to be reduced to ob-tain a clear and precise image of theentire weld pool by the CMOS sensor.Figure 3 is the average GMAW arcspectrum, which was analyzed by anAvs desktop-USB2 optical fiber digitalspectrometer. The response curve ofthe CMOS sensor is shown in Fig. 4.Comparing Figs. 3 and 4, wavelengthsin the range 433–516 nm or 602–650nm can be selected as the observationwindow, where the arc interference isrelatively low. Based on the Planckprinciple, the radiation intensity ofthe weld pool becomes stronger as thewavelength increases from 400 to 650nm (Ref. 23). So the ideal range of theobservation window is 602–650 nm.In this study, a narrow-band pass filterwith central wavelength 630 nm andsemibandwidth of 20 nm was
equipped at the bottom of the opticallens. In this way, the weld pool radia-tion could pass through the lens, andarc radiation could be effectively low-ered by the lens. To further lower thearc radiation, a neutral filter was usedto cover part of the lens to suppressthe arc radiation, as shown in Fig. 2.As a narrow-band pass filter was used,RGB signal gain was set at 1:2:5 to im-prove the resolution of the images. This system could capture the wholeweld pool and arc in one image simulta-neously, as shown in Fig. 5. The bound-ary at the rear of the arc was caused bythe edge of a neutral filter, as illustratedin Fig. 2. The tracer particles and slagscan be classified clearly from the charac-teristics of their profiles and flow trajec-tories. For example, the slag seldom hasa sharp-edged corner and has a shapemuch smoother than that of a tracerparticle. So the boundary extraction al-gorithm can be applied to detect tracerparticles as well as the weld pool bound-ary. With the help of a reference sheet,the length, width, and reinforcement ofthe weld pool could be calculated, as il-lustrated in Fig. 5 (Ref. 24).
Restoration of ThreeDimensional Data of Weld Poolfrom TwoDimensional Images
To obtain the velocities of tracerparticles, the image coordinatesshould be transformed to the worldcoordinates. In the GMAW process,the weld pool surface is curved, so animproved stereo algorithm should be
deduced for the coordinate transfor-mation. Though a linear laser is anideal tool to recover the 3D weld poolsurface (Ref. 24), its reflecting lightcannot be identified under the arc asthe laser equipment used in this workdoes not have enough power. There-fore, a point laser moving at a highspeed had been assumed as a linearlaser and was employed in this study.To simplify data processing, the fluc-tuation of the weld pool surfacecaused by the droplet transfer wasneglected, and the variation of weldpool shape was also neglected. Figure 6 demonstrates a series ofcaptured laser points on the weld poolsurface, and their image coordinatescan be obtained conveniently usingdigital image process technology (Ref.25). Thus, the image coordinates oftracer particle P (xP , y*P) can be trans-formed to its world coordinates (xP , yP ,zP) by the following stereo algorithm:
( )( )( )( )
( )( )( )( )( )( )( )( )
( )
=− −
− −
⋅ +− −
− −
⋅ +− −
− −⋅
yy y y y
y y y y
yy y y y
y y y y
yy y y y
y y y yy
PP*
L*
P*
M*
N*
L*
N*
M*
NP*
L*
P*
N*
M*
L*
M*
N*
MP*
M*
P*
N*
L*
M*
L*
N* L 2
WELDING RESEARCH
MAY 2016 / WELDING JOURNAL 177-s
Fig. 7 — Flow trajectory of tracer particle (I = 250 A, U = 30 V).
Table 3 — GMAW Parameters
Welding Torch Electrode Shielding CTWD Welding Arc WeldingParameter Angle Connection Gas Ar (mm) Current Voltage Speed (L/min) (A) (V) (m/min)
GMAW 90 deg DCEP 20 20 240–280 30 0.4–1.5
Fig. 8 — Surface fluctuation and laserpoint deviation.
A
B
C
Zong Paper 2015104 May 2016_Layout 1 4/14/16 4:20 PM Page 177

The (x*O , y*O), (x*P ,y*P), (x*L, y*L),(x*M, y*M), and (x*N, y*N) are the imagecoordinates of points O, P, L, M, and N,respectively. The yM, yN, yL can be ob-tained from Fig. 6 directly. The coordi-nate transformation coefficients kx andky are calculated by putting a knownscale grid in front of the lens (Ref. 24).In the X* direction, 42 pixels in the im-age coordinate system correspond to 1mm in the world coordinate system,and in the Y* direction, 30 pixels corre-sponds to 1 mm. The Y* coordinate ofthe point L, located at the scanningtrace, can be calculated by linear inter-polation using Equation 4.
The (x*A, y*A) and (x*B, y*B) are the im-age coordinates of points A and B. TheY* coordinates of the points M and Ncan be obtained in the same way. Thenthe flow trajectory of the tracer particlecan be drawn out as shown in Fig. 7.
Calibration
The experimental errors can be di-vided into two types. The first type of
error was caused by the variation ofweld pool shape. Figure 8A, B illustratesthe surface fluctuation of the weld poolobserved by a high-speed (2000 Hz)CCD camera (Ref. 16) while the lasersystem was stable. Experimental resultsshow the fluctuation of the liquid metalwas smaller than 0.1 mm, thoughdroplets impact the weld pool periodi-cally. In addition, the weld pool widthsand reinforcements were measuredfrom the cross section of the weld beadand also from the image of the weldpool. Table 1 shows the relative errorsin both weld pool width and reinforce-ment were smaller than 2% when thewelding speed was between 0.5 and 1.5m/min. So, it is considerable to neglectthe errors caused by the variation ofweld pool shape in data processing. Thedata in Table 1 also show good experi-mental repeatability. The second type oferror was caused by mechanical vibra-tions of the laser moving system. Figure8C demonstrates that this type of errorwas smaller than 0.1 mm, even if thedevice moved at high speed. Therefore,the results of error analysis demon-strate that accuracy of these experi-ments is acceptable.
Materials and ProcessParameters Used
Bead-on-plate welding tests were
conducted on mild steel (Q235) platesto study the influences of weldingspeed and welding current on under-cutting defects. The dimensions of theworkpiece were 250 (length) × 70(width) × 5 (thickness) mm and the di-ameter of the welding wire was 1.2mm. The chemical compositions ofwelding wire and base metal are shownin Table 2. The main welding parame-ters used in this study are listed inTable 3.
Results and Discussion
Influence of Welding Speed andWelding Current onUndercutting Defects
In Fig. 9, the undercutting area S(the groove area of the cross section,such as S1 and S2) was selected as thequantitative index of undercutting de-fects. The value of the undercuttingarea was calculated by statistics of pix-els using the binary image of the weldcross section. The experimental re-sults show the undercutting defects al-ways appear when the welding speed ishigher than 0.6 m/min. The undercut-ting area decreased slowly as the weld-ing current increased from 240 to 280A. This is because the mass of wireconsumed per unit length of the weldincreased with increasing welding cur-rent and the grooves at the weld toescould be partly filled by the filler met-al. However, undercutting defects can-not be eliminated only by increasingthe welding current. On the otherhand, the undercutting area increasedvery quickly when the welding speedwas higher than 0.6 m/min andreached its peak value when the weld-ing speed was about 1 m/min. Thenthe undercutting area decreased slowlyas the welding speed increased from 1to 1.5 m/min. To explain this phenom-enon, it is necessary to study flow pat-terns of the weld pool at differentwelding speeds.
The Analyses of UndercuttingForming Mechanism throughthe Flow Patterns
Figure 10A–H shows the general-ized flow patterns of tracer particleson the top surface of the weld pool at
( )( )( ) ( )
= − −
− +
y x x y y
/ x x y
L*
L*
A*
B*
A*
B*
A*
A* 4
( ) ( )= − −z y k y yP P y P* * 30
WELDING RESEARCH
WELDING JOURNAL / MAY 2016, VOL. 95178-s
Fig. 9 — Influence of welding speed and welding current on undercutting area.
Table 4 — Parameters Used in Equations 5–11
Physical Quantities Value Other Parameters Value
Density (kg/m3) 7860 Welding current I (A) 250–280 Environment temperature T0 (K) 293 Arc voltage U (V) 30 Melting point Tl (K) 1789 Arc length L (m) 5 × 10³
Zong Paper 2015104 May 2016_Layout 1 4/14/16 4:20 PM Page 178

different welding speeds. The general-ized flow patterns were obtained byrepeating the experiments severaltimes. In these figures, the backwardflow velocities of tracer particles firstincreased in the front of the weld pooland then decreased slowly in the mid-dle of the weld pool. Unlike the nu-merical simulation results, no particlecirculation was observed on the weldpool surface by experimental tests(Refs. 26, 27). When the tracer parti-cles were located on the centerline ofthe weld pool, their starting flow di-rections were highly random and theparticles could flow in both directions,as illustrated in Fig. 10C. However,when the tracer particles deviatedfrom the centerline, most flowed inthe direction of deviation to theboundary of the weld pool, as shownin Fig. 10D. Figure 11 shows the variations in
averageflow veloci-ty of tracerparticles fortheir back-ward flow(i.e., in thefront andmiddle ofthe weld
pool, shown in Fig. 10E) at differentwelding speeds. In this figure, thetransverse flow velocities decreasedfrom 0.098 to 0.051 m/s when thewelding speed increased from 0.4 to1.0 m/min and only decreased from0.051 to 0.046 m/s when weldingspeed further increased from 1.0 to1.5 m/min. Furthermore, experimentsshow the average longitudinal flow ve-locities were between 0.16 and 0.18m/s when the welding speed increasedfrom 0.4 to 1.5 m/min. Therefore,when the welding speed is 0.4 m/min,the ratio of transverse flow velocitiesto longitudinal flow velocities is 0.63.And this ratio decreases to 0.30 if thewelding speed is higher than 1.0m/min. This change in ratio of flowvelocities leads the filler metal tomove to the tail of the weld pool (i.e.,when the ratio is 0.30) instead of theweld pool boundary (i.e., when the ra-
tio is 0.63). Thus, the grooves at theweld toes lack filler metal, and seriousundercutting defects appear with in-creasing welding speed. As illustrated in Fig. 10A, F and Fig.12, the variable Ls is defined as the dis-tance between the arc center andstarting position of the tracer parti-cles. From these figures, it is obviousthat Ls decreases with increasing weld-ing speed and the starting positions oftracer particles seem to be convergingtoward the arc center. When the weld-ing speed was 0.4 m/min, starting po-sitions were about 4.5 mm ahead ofthe arc; the tracer particles could reachthe widest boundary of the weld pool.Therefore, sufficient liquid metal wasbrought to the weld toe. When thewelding speed increased to 1.0 m/min,the Ls decreased to 0.3 mm, and thestarting positions almost converged atthe center of the arc. So there is notenough time for the tracer particlesand the molten metal to reach theweld pool edge before they flow to thetail of the weld pool, thereby leavingthe weld toe unfilled and ultimatelycausing undercutting defects. To explain the behaviors of moltenmetal in the weld pool and explore themechanism of undercutting defects, thevarious forces associated with the liquidmetal in the weld pool should be ana-lyzed. During the GMAW process, dif-ferent forces such as arc force, dropletimpact, viscous resistance, Maragoniforce, gravity, electromagnetic force,etc., may affect the movement of liquidmetal in the weld pool (Ref. 28). In or-der to analyze the effect of the aboveforces on behaviors of molten metal, theweld pool was divided into three regions
WELDING RESEARCH
MAY 2016 / WELDING JOURNAL 179-s
Fig. 10 — Flow patterns of tracer particles on the top surface of the weldpool at different welding speeds (I = 250 A, U = 30 V).
Fig. 11 — The flow velocity at different welding speeds(I = 250 A, U = 30 V).
Table 5 — GTA and GMA Hybrid Welding Parameters
Welding Torch Electrode Shielding CTWD Welding Arc Electrode Parameter Angle Connection Gas Ar (mm) Current Voltage Diameter (L/min) (A) (V) (mm)
GTAW 60 deg DCEN 20 5 50 7 2.4 GMAW 90 deg DCEP 20 20 250 30 1.2
A
C D
E
G
F
H
B
Zong Paper 2015104 May 2016_Layout 1 4/14/16 4:21 PM Page 179

based on the characteristics of flow ve-locities, as shown in Fig. 10H. In thisfigure, the three different regions are 1)the accelerating backward flow region inthe front of the weld pool, 2) the decel-erating backward flow region in themiddle of the weld pool, and 3) the for-ward flow region in the tail of the weldpool.
Behaviors of Liquid Metal in the Frontof the Weld Pool
Figure 13 demonstrates the liquidlayer of molten metal under the arc isvery thin in the front of the weld pool,so the effect of gravity on the fluidflow can be ignored in this area. Thedirection of the electromagnetic forceis always toward the center of the arcand, thus, the backward movement ofthe tracer particles is obstructed. Butits magnitude is relatively small com-pared to other forces (Ref. 29). Tostudy the effect of Maragoni force,contrast experiments were conductedusing argon and mixed shielding gases(argon+CO2), as shown in Fig. 14. It isknown that when the volume fractionof CO2 in the shielding gas is 10%, theoxygen content of the liquid metal inthe weld pool reaches 240 ppm (Ref.30). In this situation, the direction ofMaragoni force changes from the out-ward to the inward (Refs. 31, 32).However, there are no significant dif-ferences in the flow patterns and flowvelocities in contrast experiments,which indicate the effect of Maragoniforce is also relatively small. Hence,the arc force and droplet impact
should be themain drivingforces in thefront part of theweld pool, whichpush the moltenmetal to moveoutward andbackward (Ref.28). Figure15A–C showsthe change inarc shape wasnot too signifi-cant with an increase in the weldingspeed from 0.4 to 1.5 m/min. There-fore, the influence of arc force anddroplet impact on the flow speed oftracer particles remained stable (Ref.33). This indicated the movement ofmolten metal in the weld pool wouldnot vary significantly with weldingspeed if only arc force and droplet im-pact were considered. So there must besome other force that invokes under-cutting defects. Figure 13 depicts that the liquidmetal layer under the arc became thin-ner when the welding speed increasedfrom 0.4 to 1.0 m/min. Hence, the vis-cous resistance caused by this thin liq-uid layer increased. This viscous forceobstructed the transverse spreading ofthe liquid metal and converged start-ing positions of trace particles towardthe arc center (i.e., reduces Ls). Mean-while, the kinetic energy of the dropletwould be converted to kinetic energyof backward molten metal after it im-pacted the thin liquid layer under the
arc (Ref. 11). And this energy transfor-mation ratio increased with decreasingthickness of the liquid layer. There-fore, in the present scenario, first,there was a thin layer obstructing thebackward flow due to its higher vis-cous resistance and, second, the thinlayer also caused more energy trans-formation that promoted the back-ward flow. The net result was that thebackward velocities would experiencesmall variations under different weld-ing speeds. Finally, the liquid metaldid not have sufficient time to reach tothe widest boundary of the weld poolbefore its solidification, as illustratedin Fig. 10C–F. These changes of liquidmetal behaviors seem to be responsi-ble for the undercutting formationwhen the welding speed was higherthan 0.7 m/min. The thickness of theliquid metal layer changed only mar-ginally when the welding speed in-creased from 1.0 to 1.5 m/min, andthe viscous resistance caused by thisthin liquid layer almost remained con-stant. The transverse velocities de-
WELDING RESEARCH
WELDING JOURNAL / MAY 2016, VOL. 95180-s
Fig. 12 — Starting positions of tracer particles (I = 250 A, U = 30 V).
Fig. 13 — The shape of the weld pool under the arc (I = 250 A, U = 30 V).
Fig. 14 — Flow patterns of the weld pool using different shieldinggases (I = 250 A, U = 30 V).
A
A
C D
B
B
Zong Paper 2015104 May 2016_Layout 1 4/14/16 4:21 PM Page 180
creased slowly and the starting posi-tions of tracer particles remained un-changed (i.e., Ls remained almost con-stant), while the melted width of thebase metal still obviously decreased,i.e., melted width of base metal wasnarrow. So it became easier for the liq-uid metal to partly fill the grooves atthe weld toes. Therefore, one reasonfor the decrease in the undercuttingarea was the reduction of the meltedwidth of the base metal when thewelding speed increased from 1.0 to1.5 m/min.
Behaviors of Liquid Metalin the Middle of the Weld Pool
It can be seen from Fig. 10 andfrom an earlier discussion that whenthe tracer particles flowed backward,they were away from the effect of thearc force and droplet impact in themiddle of the weld pool. The effect ofthe electromagnetic force could be ig-nored because the electric current den-sity was very low (Ref. 34). As the fillermetal accumulated in the weld poolduring the course of welding, thethickness of the liquid metal in-creased. Hence, its viscous resistancebecame relatively smaller than that inthe thin layer (Ref. 35). However,there was a height gradient of the weldpool surface from the front to the mid-dle, i.e., the height of the middle sur-face was more than that of the frontsurface, which can be asserted from
Fig. 5. Thetracer particlesflowed back-
ward along the inclined surface of theweld pool, and they were deceleratedby the gravity along the welding direc-tion. As illustrated in Fig. 14, Marago-ni force drove the tracer particles flow-ing from the boundary to the center ofthe weld pool. The transverse veloci-ties of tracer particles when shieldedby mixed gases were about 0.05 m/s,and when shielded by argon wereabout 0.04 m/s. This means thatMaragoni force was the main drivingforce for the transverse velocities inthe middle of the weld pool. In the middle of the weld pool, thelongitudinal velocities decreased slow-ly. Meanwhile, the transverse flow wastoward the center of the weld pool.Therefore, the liquid metal could notreverse to fill the weld toe.
Behaviors of Liquid Metal in the Tail of the Weld Pool
The weld pool surface, enclosed be-tween the middle and tail of the weldpool, was almost horizontal and faraway from the arc, as can be seen inFig. 5. So, the influence of arc force,droplet impact, electromagnetic force,and gravity on the fluid flow was verysmall. As the temperature of the liquidmetal decreased in the tail of the weldpool, the viscous resistance increased(Ref. 36), but its influence on the met-al flow was still very small. The Marag-oni force always drove tracer particlesto flow from the low-temperature re-
gion to the high-temperature region(Ref. 31). The maximum flow velocityonly increased to 0.060 m/s eventhough CO2 was added into the argonshielding gas. These observationsdemonstrated that the Maragoni forcewas the main driving force of fluidflow in the tail of the weld pool, and itwas very small in this region. So theinfluence of the slower fluid flow inthe tail on undercutting was not sig-nificant. The analyses on the behavior fluidflow in the front, middle, and tail ofthe weld pool show the thin liquidmetal layer under the arc resulted inthe decrease of the transverse flow ve-locity and the retreat of the startingpositions. The transverse spreading ofthe liquid metal was suppressed. Atthe same time, the high-speed back-ward fluid flow decreased slowly andthe transverse velocities were inwardin the middle of the weld pool. Therewas no reverse metal to fill the weldtoe. All these phenomena obstructedthe liquid metal from filling thegrooves at the weld toes before solidi-fying, thus the undercutting defectsappeared under high welding speed.
Prediction of UndercuttingWidth
Undercutting width (Wu) was cho-sen as a predictive index of the size ofundercutting. It was defined as halfthe difference between the width ofmelted base metal (WM) and the widthof liquid metal spreading (WS), i.e.,
WELDING RESEARCH
MAY 2016 / WELDING JOURNAL 181-s
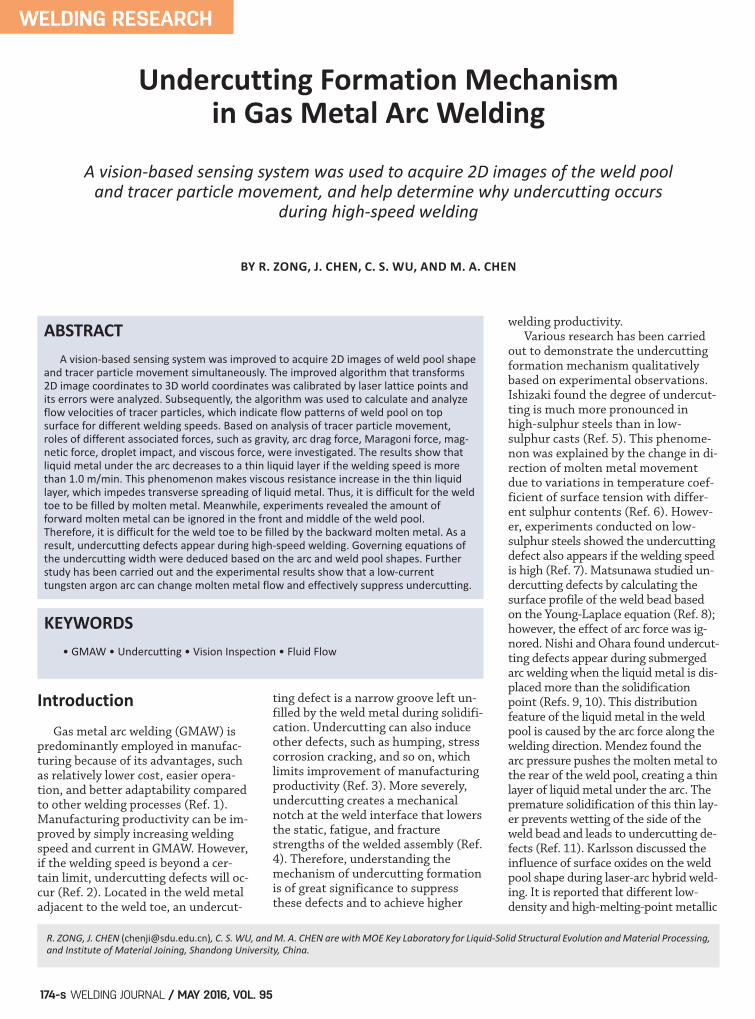
Fig. 15 — Arc shape and sketch of Gauss heat source model.
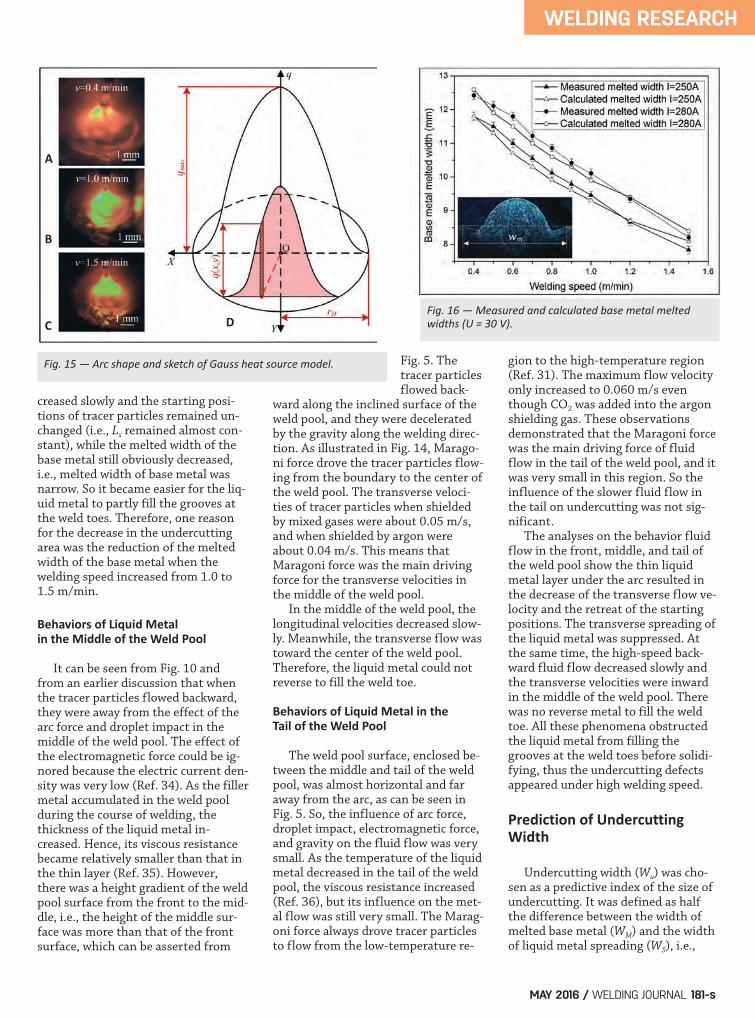
Fig. 16 — Measured and calculated base metal meltedwidths (U = 30 V).
A
C D
B
Zong Paper 2015104 May 2016_Layout 1 4/14/16 4:21 PM Page 181

2Wu = WM – WS, as illustrated in Figs.16–18. A simple model that can beused to predict the width of undercut-ting defect was proposed to optimizethe numerical simulation process. Figure 15A–C shows the arc shapescaptured using the color camera at dif-ferent welding speeds. From these fig-ures, it is clear the arc remained up-right when the welding speed was low-er than 1.0 m/min and leaned back byabout a mere 3 deg when the weldingspeed reached 1.5 m/min. Therefore,the influence of welding speed on arcshapes can be ignored and the heatdistribution in the arc can be assumedas Gaussian, described by Equations5–7 (Refs. 37, 38, 28),
Qarc = 0.75UI (6
where q(x, y) is the heat density ofpoint (x, y), Qarc is the heat power ofthe arc, and rH is the distribution di-ameter of the arc heat. All the otherparameters in Equations 5–7 are listedin Table 4. When using the previous Gaussheat source in calculation, the temper-ature of a point located at (x, y, z) attime t can be calculated by Equations 8and 9 (Ref. 39),
where vw is in the welding speed. Thespecific heat capacity cp and thermalconductivity are the functions oftemperature (Ref. 39). Then Wm can be calculated by Equa-tions 5–9 and Fig. 16 shows the calcu-lated data were in good agreementwith experimental results when thewelding speed was between 0.4 and1.5 m/min. To predict Wu, it was also necessaryto determine Ws precisely and quickly.Ws mainly depended on the thicknessof the liquid metal layer under the arc.Figures 13 and 17 show the variationsin the thickness of the liquid metallayer and Ws followed similar trendswhen the welding speed increasedfrom 0.4 to 1.5 m/min. In addition,Ws varied directly with the mass offiller metal or welding current. So thethickness of the liquid metal layer andthe welding current were used to pre-dict Ws using Equation 10,
where hs and hu are the depths of solid-liquid and gas-liquid interfaces, re-spectively, as illustrated in Fig. 13. Theunits of hs and hu are in millimeters. Asshown in Fig. 17, the calculated Ws
were in good agreement with the ex-perimental results within the weldingspeed range of 0.4–1.5 m/min. The measured and calculated un-
q x ,yQ
rexp
x yr
arc
H H
3 3 352
2 2( ) ( )=
π− +⎛
⎝⎜⎞
⎠⎟
r . I LH. .6 3 77 10 73 0 2645 0 3214 ( )= × × −
T x ,y,z,t( )= 2Qarc��cP 0
� 1
4�a�( )1/2�
� 1
4a�+2rH2 �exp �
x+ vw�( )2 + y2
4a�+2rH2 � z2
4a�
�
���
�
���d� 8( )
a= ��cP
9( )
Wf =0.024� I �hs0.65 hs�hu( ) 10( )
WELDING RESEARCH
WELDING JOURNAL / MAY 2016, VOL. 95182-s
Fig. 17 — Measured and calculated filler metal spreading widths (U =30 V).
Fig. 18 — Measured and calculated widths of undercutting defects (U = 30 V).
Fig. 19 — GTA and GMA hybrid welding.
A
C D D
B
Zong Paper 2015104 May 2016_Layout 1 4/14/16 4:21 PM Page 182

dercutting widths are shown in Fig.18. The variation trend of predictedWu was in good agreement with that ofthe measured, and the errors were ac-ceptable. Equation 11 can be used topredict the undercutting width, Wu:
Suppression of Undercutting byLowCurrent Gas Tungsten Arc
The above studies support the ideathat lack of liquid metal flow towardthe weld pool boundary induces for-mation of undercut. In this work, it isthought that a gas tungsten arc wouldadjust the fluid flow in the weld pooland suppress undercutting defects. InGTA and GMA hybrid welding process-es, the welding speed was set as 1.0m/min and the GMAW current was250 A, in which case serious undercut-ting defects occurred, as shown in Fig.9. The distance between wire andtungsten electrode was 5.0 mm, whichcan reduce the burning of the tung-sten electrode by the gas metal arc andutilize the synergic effect of two arcson the welding process. Experimentshave been done when the GTAW cur-rent was from 50 to 280 A, andshowed that 50 A was enough to sup-press the undercutting defects whenthe GMAW current was 250 A. The gastungsten arc was used either as theleading arc or as the trailing arc. Thewelding parameters used in theprocess are listed in Table 5. When the gas tungsten arc is usedas the leading arc, it is beneficial forthe stability of droplet transfer. Thehybrid welding process is extremelystable without welding spatters. Inthis case, tracer particles came into theweld pool near the front boundary, asillustrated in Fig. 19A. From Fig. 11, itis known that at welding speed 1.0m/min, the average longitudinal veloc-ity of the backward flow in GMAW was175 mm/s, which decreased in thiscase to 150 mm/s, calculated from ex-periments. On the other hand, the av-erage transverse velocity varied onlymarginally between the case in Fig. 11and the present case. So the flow ofliquid metal was extended wider to-
ward the weld pool boundary. Thissupplied a sufficient amount of fillermetal at the weld toe. Figure 19C, Dshows that Wm decreased obviouslyfrom 9.6 to 5.3 mm. The reduction ofWm facilitated the liquid metal to fillthe grooves at the weld toes. When the gas tungsten arc wasused as the trailing arc, it became un-stable due to the liquid metal fluctua-tion in the weld pool. The hybrid weld-ing process was affected by the unsta-ble gas tungsten arc, resulting in slightwelding spatter. The average longitudi-nal velocity of the backward flow atwelding speed 1.0 m/min in GMAWdecreased considerably from 175 to120 mm/s (for the present case) underthe action of forward drag force fromthe gas tunsten arc. Meanwhile, theaverage transverse velocity slightly in-creased from 50 to 68 mm/s. Asshown in Fig. 19B, tracer particlesflowed into the weld pool near thefront boundary, and their direction offlow was less deviated, i.e., toward theundercutting area (this direction is incontrast to the flow direction of tracerparticles in Fig. 10F where particleswere more deviated toward the poolboundary in the middle of the weldpool). Also, the flow covered a widerdistance on the weld pool side bound-aries on both sides. Wm decreased from9.6 to 7.7 mm, as shown in Fig. 19C, E.These changes promoted liquid metalto fill the grooves at the weld toes. These experiments demonstratedthat the gas tungsten arc with low cur-rent changes the behaviors of moltenmetal in such a way that the liquidmetal is directed toward the grooves atweld toes and fills them. This sup-presses or eliminates the undercuttingdefects. Further, it was found thewelding speed can be increased to 1.5m/min without undercutting defectsusing this hybrid welding process.
Conclusions 1. An improved vision-based sens-ing system and a laser-assisted coordi-nate transformation were used tostudy the behaviors of fluid flow onthe weld pool surface with the help ofthe flow of SiC tracer particles underhigh-speed arc welding. In the future,this sensing system can be developedto improve the welding process (e.g.,controlling the weld bead width,
depth, and avoiding undercutting de-fects) in cooperation with an expertwelding system. 2. In high-speed welding, a thin lay-er of liquid metal under the arc im-pedes the transverse spreading of liq-uid metal. The backward flow of liquidmetal decreases slowly in the middlepart of the weld pool and cannot flowback to fill the grooves at the weldtoes. Therefore, there is lack of moltenmetal at the weld toes resulting in un-dercutting defects. 3. The viscous force, drag force ofthe arc and droplet impacts in thefront of the weld pool, gravity andMaragoni force at the middle of theweld pool, and Maragoni force at thetail of the weld pool were responsiblefor the flow patterns of liquid metal inthe weld pool. 4. The predicted width of undercut-ting showed good agreement with themeasured data, but experimental evalu-ation of hs and hu was very complicated.These may be calculated with improvednumerical models in the future. 5. Either a leading or a trailing gastungsten arc with low current can im-prove the fluid flow of the weld pooland suppress the undercutting defect.With a low-current gas tungsten arc ina hybrid process, welding at speeds ashigh as 1.5 m/min did not result inany undercutting defect. This will in-crease productivity.
This work is sponsored by the Na-tional Natural Science Foundation ofChina under Grant No. 51305235, and Specialized Research Fund forthe Doctoral Program of Higher
Education of China under Grant No.20130131120013. The authors alsoacknowledge valuable technical discus-sions with Girish Kumar Padhy.
1. DebRoy, T., and David, S. A. 1995.Physical processes in fusion welding. Re-views of Modern Physics 67(1): 85–112. 2. Bradstreet, B. J. 1968. Effect of sur-face tension and metal flow on weld beadformation. Welding Journal 47(7): 314-s to322-s. 3. Cerit, M., Kokumer, O., and Genel, K.
Wu =12Wm �Wf( )= 1
2Wm
�0.012� I �hs0.65 hs�hu( ) 11( )
WELDING RESEARCH
MAY 2016 / WELDING JOURNAL 183-s
Acknowledgments
References
Zong Paper 2015104 May 2016_Layout 1 4/14/16 4:21 PM Page 183

2010. Stress concentration effects of un-dercutting defect and reinforcement metal.Engineering Failure Analysis 17(2):571–578. 4. Nguyen, T. C., Weckman, D. C., John-son, D. A., and Kerr, H. W. 2006. Highspeed fusion weld bead defects. Science andTechnology of Welding & Joining 11(6):618–633. 5. Ishizaki, K., Yokoya, S., and Okada, T.1988. Weldability of stainless steel. Japanto VAMAS meeting on Technical WorkingArea, Weld Characteristics. NPL, Tedding-ton. 6. Mills, K. C., and Keene, B. J. 1990.Factors affecting variable weld penetra-tion. International Material Review 35(1):185–216. 7. Savage, W. F., Nippes, E. F., andAgusa, K. 1979. Effect of arc force on de-fect formation in GTA welding. WeldingJournal 58(7): 212-s to 224-s 8. Matsunawa, A., and Ohji, T. 1982.Role of surface tension in fusion welding(Part 1): Hydrostatic effect. Transactions ofJWRI 11(2): 145–154. 9. Nishi, T., Fujita, H., Haseba, S., andOhara, M. 1982. Study on high speed sub-merged arc welding report 1. Japan WeldingSociety 30(8): 68–74. 10. Ohara, M., Fujita, H., Haseba, S.,and Nishi, T. 1983. Study on high speedsubmerged arc welding report 2. JapanWelding Society 31(2): 45–48. 11. Mendez, P. F., and Eagar, T. W.2003. Penetration and defect formation inhigh-current arc welding. Welding Journal82(10): 296-s to 306-s. 12. Karlsson, J., Norman, P., Kaplan, A.F. H., Rubin, P., Lamas. J., and Yanez, A.2011. Observation of the mechanismscausing two kinds of undercutting duringlaser hybrid arc welding. Applied SurfaceScience 257(17): 7501–7506. 13. Sudnik, H. W. 1991. Research intofusion welding technologies based onphysical mathematical models. Welding andCutting 43(10): 216-e to 219-e, 588-s to590-s. 14. Sudnik, V. A., Ivanov, A. V., Mokrov,O. A., Dilthey, W., Habedank, G., andRaichel, T. 1995. MAGSIM program soft-ware for analysis, optimization and diag-nostics of the process of consumable elec-trode welding thin-sheet joints in an activegas. Welding International 9(11): 891–896. 15. Chen, J., and Wu, C. S. 2009. Nu-
merical simulation of forming process ofhumping bead in high speed GMAW. ActaMetallurgica Sinica 45(9): 1070–1076. 16. Wang, L., Wu, C. S., and Gao, J. Q.2015. Suppression of humping bead inhigh speed GMAW with external magneticfield. Science and Technology of Welding andJoining. 17. Li, Y., Wu, C. S., Wang, L., and Gao,J. Q. 2015. Analysis of additional electro-magnetic force for mitigating the humpingbead in high-speed gas metal arc welding.Journal of Materials Processing Technology. 18. Pires, I., Quintino, L., and Miranda,R. M. 2007. Analysis of the influence ofshielding gas mixtures on the gas metal arcwelding metal transfer modes and fumeformation rate. Materials & Design 28(5):1623–1631. 19. Wang, G., Huang, P. G., and Zhang,Y. M. 2003. Numerical analysis of metaltransfer in gas metal arc welding. Metallur-gical and Materials Transactions B 34(3):345–353. 20. Hermans, M. J. M., and Ouden, G.D. 1999. Process behavior and stability inshort circuit gas metal arc welding. WeldingJournal 78(4): 137-s to 141-s. 21. Rhee, S., and Kannatey-Asibu, E.1992. Observation of metal transfer dur-ing gas metal arc welding. Welding Journal71(10): 381-s to 386-s. 22. Zhao, C. X., Steijn, V. V., Richardson,I. M., Kleijn, C. R., Kenjeres, S., and Saldi,Z. 2009. Unsteady interfacial phenomenaduring inward weld pool flow with an ac-tive surface oxide. Science and Technology ofWelding and Joining 14(2): 132–140. 23. Hull, D. L., Tessner, P. D., and Dia-mond, A. M. 1978. Planck’s principle. Sci-ence 202(4369): 717–723. 24. Liu, Y. K., Zhang, W. J., and Zhang,Y. M. 2013. Estimation of weld joint pene-tration under varying GTA pools. WeldingJournal 92(11): 313-s to 321-s. 25. Bhandarkar, S. M., Zhang, Y., andPotter, W. D. 1994. An edge detection tech-nique using genetic algorithm-based opti-mization. Pattern Recognition 27(9):1159–1180. 26. Oreper, G. M., and Szekely, J. 1984.Heat and fluid flow phenomena in weldpools. Journal of Fluid Mechanics 147:53–79. 27. Hu, J., Guo, H., and Tsai, H. L.2008. Weld pool dynamics and the forma-tion of ripples in 3D gas metal arc welding.
International Journal of Heat and MassTransfer 51(9–10): 2537–2552. 28. Mendez, P. F., and Eagar, T. W.1999. Estimation of the characteristicproperties of the weld pool during highproductivity arc welding. In Fifth Interna-tional Seminar on the Numerical Analysis ofWeldability pp. 67–94. 29. Tsao, K. C., and Wu, C. S. 1988. Flu-id flow and heat transfer in GMA weldpools. Welding Journal 67(3): 70-s to 75-s. 30. Lu, S., Fujii, H., and Nogi, K. 2004.Marangoni convection and weld shapevariations in Ar-O2 and Ar-CO2 shieldedGTA welding. Materials Science and Engi-neering A 380(1–2): 290–297. 31. Sahoo, P., DebRoy, T., and McNal-lan, M. J. 1998. Surface tension of binarymetal surface active solute systems underconditions relevant to welding metallurgy.Metallurgical Transactions B 19(3):483–491. 32. Kim, I. S., and Basu, A. 1998. Amathematical model of heat transfer andfluid flow in the gas metal arc weldingprocess. Journal of Materials ProcessingTechnology 77(1): 17–24. 33. Wang, Y., and Tsai, H. L. 2001. Im-pingement of filler droplets and weld pooldynamics during gas metal arc weldingprocess. International Journal of Heat andMass Transfer 44(11): 2067 –2080. 34. Tsai, N. S., and Eagar, T. W. 1985.Distribution of the heat and current fluxesin gas tungsten arcs. Metallurgical Transac-tions B 16(4): 841–846. 35. Cho, M. H., and Farson, D. F. 2007.Understanding bead hump formation ingas metal arc welding using a numericalsimulation. Metallurgical and MaterialsTransactions B 38(2): 305–319. 36. Morita, Z., and Iida, T. 1982. Vis-cosity of molten iron and steel. Iron andSteel (China) 2: 54–61. 37. Eagar, T. W., and Tsai, N. S. 1983.Temperature fields produced by travelingdistributed heat sources. Welding Journal62(12): 346-s to 355-s. 38. DuPont, J. N., and Marder, A. R.1995. Thermal efficiency of arc weldingprocesses. Welding Journal 74(12): 406-s to416-s. 39. Wu, C. S. 2008. Welding ThermalProcessed and Weld Pool Behaviors. pp. 87,198, 199. New York, N.Y.: CRC Press.
WELDING RESEARCH
WELDING JOURNAL / MAY 2016, VOL. 95184-s
Zong Paper 2015104 May 2016_Layout 1 4/14/16 4:21 PM Page 184