welcome to wipro ’s india analyst/investors’ meet 2007 · welcome to wipro ’s india...
TRANSCRIPT

Welcome to Wipro’s India Analyst/Investors’
Meet 2007
Feb 09, ’07 National Stock Exchange, Mumbai

2
Safe Harbor
This presentation may contain certain “forward looking” statements, which involve a number of risks, uncertainties and other factors that could cause actual results to differ materially from those that may be projected by these forward looking statements. These uncertainties have been detailed in the reports filed by Wipro with the Securities and Exchange Commission and these filings are available at www.sec.gov. This presentation also contains references to findings of various reports available in the public domain. Wipro makes no representation as to their accuracy or that the company subscribes to those findings.

Suresh Vaswani President- Global IT Services Lines, Wipro Technologies
President, Wipro Infotech
• Global IT Service Lines • Wipro Infotech

Technology Infrastructure Services (TIS)
Revenue ($ M)
YoY growth –81 %
43 73
60
Remote Management – driving next wave of Off shoring
Quarter ended
Dec-05 Sep-06 Dec-06
21%
•Pioneers in Global Delivery Model for Infrastructure Management •Comprehensive portfolio of services spanning the complete IT Infrastructure Life Cycle
•Largest Offshore IT Infrastructure Services player in terms of revenue, people and customers • 4396 consultants, net addition of 608 people during the quarter
•Global IT Outsourcing Practice offering integrated value proposition to customers • Next Generation Managed Services offering tool-agnostic, highly secure service based on business impact
What we do Our Leadership Position Our Differentiators
Manage
Enhance Plan
Architect
Deploy Consult
Data centers Networks
Web Infrastructure Desktops/Servers/Databases
IT Infrastructure security Application Security
Network Operations Center Storage Systems
Messaging Systems Mainframes IT Helpdesk
Infrastructure Consulting & Systems Integration
Technical Support Services
Managed Services
Telecom Infrastructure
Services
Partner for Complete Infrastructure Life Cycle
•Revenue for 9 Months ended Dec 2006 -183 Mn $ - YOY growth 74%

Business trends & Strategic Directions - TIS
§ Strengthen leadership position through Global IT Outsourcing § Portfolio expansion strategy § Strong alliance management § Enhancing Program Governance § People supply chain optimization and talent transformation initiatives
Business trends
Strategic Directions
§ Offshore players’ share in Global Infrastructure services projected to be $9 Bn by 2010, 2005-10 CAGR of 55%
§ Landscape change: Indian vendors already winning deals ranging from TCV of $50 Mn – $100 Mn , being considered for Deals with TCV $50 Mn to $250 Mn
§ Customers are increasingly looking for Business Service Management rather than only element management
§ Opportunities leveraging on Advanced Technologies like transformation of Telecom Networks, Network Optimization, Convergence, IPTV, IP Telephony, etc increasing in the market
§ Product vendors such as CISCO / HP / EMC moving from Products to Platform Solutions

Wipro Testing Services Revenue ($ M)
44.8 70.4
Dec-05 Sep -06
Quarter ending
YoY 57.%
Dec -06
65.2
•Quality assurance services ranging from Life cycle testing services to specialized testing services to our customers in the Enterprise as well as technology space
•Largest Offshore Testing Services Provider (AMR research, 2005) • Over 5900 Employees. • Pioneers in Product Engineering Testing space
•Test Productivity - Investments in Test frameworks, tools and point solutions, deliver productivity and time to market advantages to our customers. •Testing as Managed Services - End-to- End Test Ownership to ensure customer delight •Domain Centric Offerings leveraging Industry COEs and Labs
What we do Our Leadership Position Our Differentiators
Life Cycle Testing
Test Automation
Specialized Testing
Test Process Consulting
Embedded Mfg Energy
Retail. HLS, TMTS
BFSI
GLOBAL DELIVERY M
ODEL
Project-based
On-Demand
Consulting
Testing as Managed Services (TMS)
Service Portfolio & Engagement Models
Telecom Eqpt TSP
Alliances with leading Tools vendors like Mercury, IBM-Rational, Compuware, etc.
•Revenue for 9 Months ended Dec 2006 -193 Mn $ - YOY growth 71%
8%

Business Trends & Strategic directions - Testing
Business Trends
1. Market opportunity for Offshore Testing companies likely to be $11 Bn by 2010
2. Test Automation & Specialization ( Performance, Security testing ) becoming the norm
3. Testing opportunities in Localization, Package Applications, IP migration & SOA hold promise
4. Customers demanding Domain knowledge, Test Consultancy capabilities.
Strategic Directions
1. Differentiation through Test Consultancy, Domain Test frameworks & Specialized Testing services
2. Extend Product Engineering leadership by investing in automation frameworks, tools , Domain specific labs like Wi-Fi labs, 3G labs
3. Build on success in Enterprise, BFSI & Telecom Service provider customers – Enhance the Vertical Domain specific Testing competencies and Test Frameworks
4. Focus on Emerging areas - IP Migration, Package Application & SOA Testing

Wipro Enterprise Application Services (EAS) Revenue ($ M)
52.5 63.7
Dec-05 Sep-06
Quarter ending
Business process
CONSULT
MANAGE Business application
IMPLEMENT
CRM SCM Finance HRM
SAP Oracle Siebel / Clarify
JD Edwards PeopleSoft I2/Ariba/
Manugistics Microsoft
YoY -38.5%
72
•We provide Process Consulting , Package Implementation and Application Management Services for CRM, SCM, ERP as well as Vertical specific processes
•Wipro is Best Suited for Large-Scale, Global SAP Projects Implementation: Forrester • Best Positioned among Indian Companies in Gartner Magic Quadrant for CRM and SCM Service Providers in North America
•Recognized capabilities for large end to end package implementations, global rollouts •Leadership in Next Generation Solutions – SCM, CRM §Domain Competency in focus industries like Energy, Retail, Utilities
What we do Analyst View Our Differentiators
Dec-06
•Revenue for 9 Months ended Dec 2006 194 Mn $ - YOY growth 35%
13%

Business Trends & Strategic directions - EAS
Business Trends
1. By 2009-10, Market Size for ERP applications (globally) to be $40 B (AMR research)
2. SAP & ORACLE dominate the market; Focusing on Domain solutions & Services Oriented Architecture (SOA) based platforms. Microsoft making investments in ERP space
3. End Users looking at Globalization, Business Intelligence, Shared services, and Redesign of process areas
4. Traditional BPO players getting into Surround Application Enhancement and Support business
Strategic Directions
1. Transformational capabilities through Consulting & Program management expertise
2. Platform SOA technologies & Industry solutions
3. Non-linear approach to traditional Application Maintenance & Support Services
4. Capitalise on opportunity areas - Microsoft ERP solutions ; Integrated Services ( Applications + BPO )

Wipro Infotech – An Overview Comprehensive Services Lines
Wipro Infotech – Highlights of 200607
1. Partner of Choice for Customers in India 1. Leading IT solutions company in India 2. Largest Technology Products player 4. # 1 in Network Integration & Security
2. Partner of Choice for Principals in India 1. Largest SI partner for Cisco, Sun, Nortel 2. Best SAP partner across APAC 3. Largest Enterprise partner – Microsoft 4. Largest SI for Symantec / RSA / Checkpoint 5. Largest partner for HP Openview
3. Domain centricity 1. BFSI – HDFC Bank, LIC, GIC, BSE… 2. Telecom – Bharti Airtel, Maxis… 3. Government CRIS, 15 State Govt’s, BEL.. 4. Mfg. Maruti, Hyundai, AV Birla, Sanmar…
4. Innovation in Service Delivery 1. Integrated Remote Service Delivery Platform
– GSMC, 50+ customers 2. Software templates SAP in CPG / Auto;
Oracle in Real Estate; – 30+ customers
5. Strategic Investments 1. 3D Networks / Planet PSG acquisition 2. Joint Venture in KSA
Number of employees = 6424
Revenue (Rs. Mn.)
3,992 7,008
11,354
16,998
Quarter ended
9 Months ended
Dec - 05 Dec - 06
Dec-05 Dec-06
Rev -YoY – 76% PBIT – YoY – 56%
Rev -YoY – 50% PBIT – YoY – 58%

IT Trends in India
1. Indian IT Market $ 12 Bn (2006), Products:Services = 65:35, will grow @ 22% in 2007, 17% CAGR thru
2010 (Source: IDC)
2. Sunrise sectors Retail, SEZ, Infrastructure, Defense.
3. All verticals to grow – Banking, Manufacturing, Telecom, ITeS, Government.
4. Large integrated IT solutions opportunities on the rise
5. Greenfield IT projects to drive growth across all IT segments
6. Emerging technologies to drive new investments
7. Progressive Mid market
8. Heavy focus of Technology owners on mid market / emerging technologies
India to remain the fastest growing IT market in the Asia Pacific region

Wipro Infotech – Directions
1. Stratified account management
2. Domain competencies
3. Emerging technologies thrust – Unified Communications, SOA, Security…
4. Stronger thrust in Middle East with Infrastructure
5. Non linearity and operational efficiencies in Services – GSMC, templates, integrated service delivery
6. Strategic alliances with partners placing big bets on India
7. Invest in people
8. Transform customer experience
9. Inorganic initiatives to build new competencies and service lines
Thank You

Enterprise Solutions
Sudip Banerjee President- Enterprise Solutions, Wipro Technologies
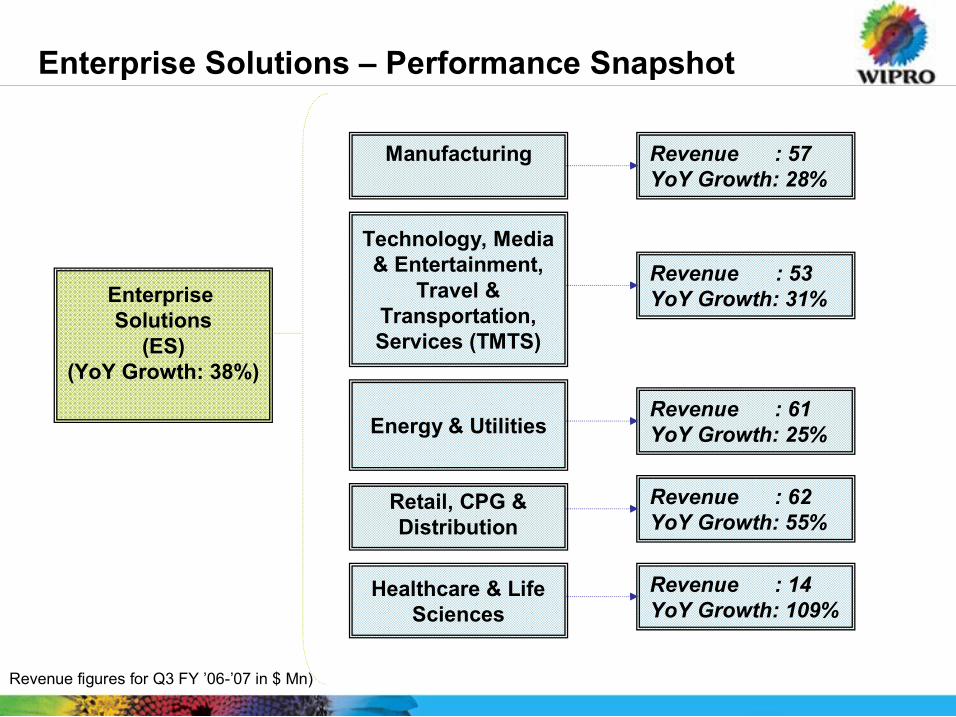
Enterprise Solutions – Performance Snapshot
Enterprise Solutions
(ES) (YoY Growth: 38%)
Retail, CPG & Distribution
Manufacturing
Energy & Utilities
Technology, Media & Entertainment,
Travel & Transportation, Services (TMTS)
Revenue figures for Q3 FY ’06’07 in $ Mn)
Healthcare & Life Sciences
Revenue : 57 YoY Growth: 28%
Revenue : 61 YoY Growth: 25%
Revenue : 62 YoY Growth: 55%
Revenue : 14 YoY Growth: 109%
Revenue : 53 YoY Growth: 31%

ES Priorities going forward
Strategic resource management: building domain
competency, global delivery model
Increased account penetration: across multiple divisions and across service lines within same
division
Consulting practice development and
expansion
Growth focus: Organic and inorganic
Value Creation: External & Internal

Manufacturing
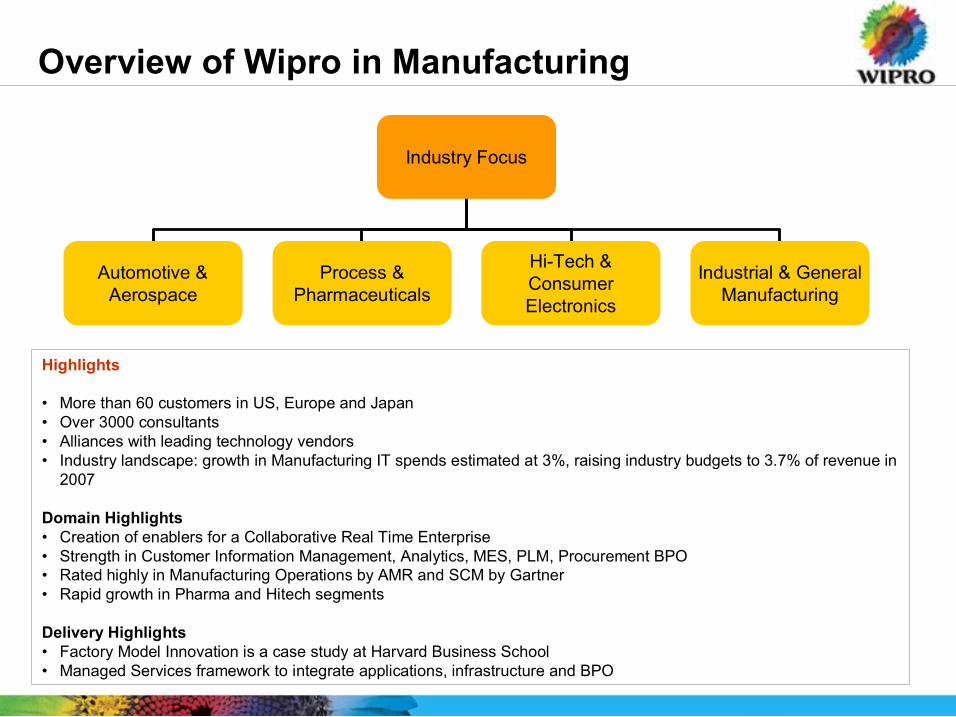
Overview of Wipro in Manufacturing
Highlights
• More than 60 customers in US, Europe and Japan • Over 3000 consultants • Alliances with leading technology vendors • Industry landscape: growth in Manufacturing IT spends estimated at 3%, raising industry budgets to 3.7% of revenue in 2007
Domain Highlights • Creation of enablers for a Collaborative Real Time Enterprise • Strength in Customer Information Management, Analytics, MES, PLM, Procurement BPO • Rated highly in Manufacturing Operations by AMR and SCM by Gartner • Rapid growth in Pharma and Hitech segments
Delivery Highlights • Factory Model Innovation is a case study at Harvard Business School • Managed Services framework to integrate applications, infrastructure and BPO
Industry Focus
Automotive & Aerospace
Process & Pharmaceuticals
Industrial & General Manufacturing
HiTech & Consumer Electronics

Going Forward: Investments in Domain & Service offerings
§ Building Leadership in Key Client Investment Areas Manufacturing Execution Systems [ MES ]
Supply Chain Consulting [ SCM ]
Integration of MES to ERP Systems
§ Strategic Alliances in key focus areas SCM
MES
§ Industry solutions developed through Domain Center of Excellences [CoE’s] and Alliance partners Automotive, Pharma CoE’s
‘Freeway’, a branded solution for the Automotive Industry has been rolled out
§ Service Delivery Excellence Factory Model for Application Development
w Featured as a case study in Harvard Business School
Managed Services for Application Maintenance

TMTS

Highlights • Over 60 customers across geographies • Skilled employee base of about 3500 • Working with Industry leaders across above sub verticals • Industry landscape: Airlines & Media key growth areas going forward
Domain Highlights • BPO/IT integrated services offering • Best in Class Production support services • Global account management
Delivery Highlights • Business Focused Solutions : IBEX (Internet booking engine for travel industry), IPP (Integrated publishing platform for publishing
industry), Pricing optimization & Enforcement engine for HiTech industry, eFreight for Air Cargo Industry • Very large to medium size engagements with focus on Multi year outsourcing deals * NASSCOM, ** Independent Surveys
Overview of Wipro in TMTS Industry Focus
Technology Media & Entertainment Services Travel & Transportation
Computer Equipment
manufactures
Media Entertainment & Broadcasting
Publishing
Information services
Transportation & Logistics
Hospitality & Leisure
Airline & Travel Intermediaries/ Tour operators
Legal Consulting
Education
Construction
Telecom Equipment
manufacturers
S/w product Co.s

Going Forward: Investments in Domain & Service offerings
§ Growth: Penetration within existing large accounts and acquiring new must have accounts Service line penetration through Alignment Account level Partnering and acquisition Global penetration and account management Promote new engagement models
§ Solutions/ Services focus: Building new solutions through: Industry specific package solutions Leveraging innovation E.g.. Ibex, ISBN Focusing on Content BPO in media and Transaction BPO in Airlines/travel
§ Evaluation of Inorganic Growth opportunities: Strengthen presence in transportation and media space

Energy & Utilities

Overview of Wipro in Energy & Utilities
Highlights • Largest player among the Indian IT Services Provider • Strategic relationships with some of the bestknown technology companies • Employee base of over 3200 • Dedicated group of domain specialists • Industry Landscape: U.S utility market opening up to outsourcing
Domain Highlights • Focused Practise Groups to drive business growth and focus on building domain and delivery capabilities • Centre of Excellence for specific skills and products
Delivery Highlights • ERP, Managed services, Consulting, BPO
Industry Focus
Energy Utilities
Water Power Oil Gas

Going Forward: Investments in Domain & Service offerings
§ Growth Strengthen global presence: focus on new geographies and integration Focus on new account penetration
§ Build capabilities for emerging industries/ across emerging industry needs Focus on Mining and Energy trading Building ERP, EAM and BPO capabilities • Establish CoE to build competency & skill around specific products Establish focused and dedicated practice groups for
w Electricity w Gas w Water

Retail, CPG and Distribution

Highlights • Acquired in 2006 • Base of approx 3300 specialists • Part of SAP IVN for consumer goods • Focus on multi year multi service deals • Deep presence in Grocery • Strategic Partnership with the customers • Industry landscape: Growth of emerging markets like India, China, Middle East
Domain Highlights • Collaborative Commerce, GDS, Supply Chain, Category Management, Point of Sales, Warehouse Management systems • Dedicated CoE for deepening domain knowledge and developing focus across industries • Acknowledged by customers and leading analysts as a thought leader in CPG domain
Delivery Highlights • Supply Chain, In Store, RFID, EIM, Retail Pharmacy and Merchandising and Pricing • Point solutions offerings (kiosk based consumer care solutions / microsite)
Consumer Packaged Goods Retail Wholesale Distribution
Pharma Retailing
Specialty Retailing
Grocery Retailing
Food and
Beverage
Apparel and
Footwear Food NonFood
Home and
Personal Care Tobacco
Wipro’s Retail CPG and Distribution Practice
Industry Focus

§ Multi Channel Offering: Develop future state architecture based on point solution needs and overall strategy
§ Digital Supply Chain – transforming supply chain into digital value networks by Integrating, Optimizing, Collaborating, Synchronizing, Supporting & Linking
§ Real Enterprise Information Management – to improve efficiency, scalability, time to market and secure data integrity of master enterprise data. This is obtained through: Cross functional business processes to manage enterprise master data Logical data model for enterprise master information Complete EIM solution framework Data Governance framework
§ Business Analytics Model: Combining domain knowledge with business intelligence and market insights
§ Point of Sale CoE Labs for error free processing and reduced time to market
§ RFID: Store Stock management for a Leading UK apparel retailer Factory/Warehouse automation for a Leading Indian apparel retailer RFID data analytics and infrastructure support for a Leading American discount retailer Building business case and Assessing ROI for a Leading American grocery retailer Work in process tracking for a leading American hightech maker Yard management solution for a leading American Automotive maker
Going Forward: Investments in Domain & Service offerings

Healthcare & Life Sciences

Overview of Wipro in HLS
Highlights • Resource base of approx. 1000 • Industry Landscape: Clinical trials and Disease Management emerging as growth areas going forward
Domain Highlights • Clinical Trial Management • Healthcare Application Services (HAS) • IT/nonIT Managed Services, HCTOS • System Integration
Delivery Highlights: • Biosurveillance solution for public health departments and center for disease control • Implementation and integration of HIPAA transaction compliance system. • Therapy management portal • Providing voice & non voice processing
Going Forward: • Investments in Domain & Service offerings • Differentiating solutions – Disease management, HC Intelligence etc. • Build domain competency by leveraging existing customer accounts & through alliances • Broaden key customer base • Establish strategic partnerships on GTM • Process Excellence Initiative
Industry Focus
Healthcare Pharma & Life Sciences

Wipro Consultancy Services

Wipro Consulting Services – Key to further growth
Leveraging WCS going forward: § Leverage Consulting as a Deal Winner in Game Changing Deals § Deploy Consulting as an “Account Penetrator” § Project the power of consulting as a “capability integrator” across Wipro § Orient Consulting as a “Talent Attractor” § Drive Consulting as a Growth Business § Integrate Transformational Consulting § Incubate, acquire Functional Consulting § Collaborate with Verticals in Industry Consulting § Strengthen IT Consulting
Focus Areas
Business Consulting: §Process improvement and implementation §Change management §Managing operation risk §Outsourcing consulting
Process consulting: §Business Process Improvement §Enterprise Application Package Selection §IT Strategy
Quality Consulting: §Point Solutions §SCRM Consulting §Metrics Consulting
Technology Consulting: §Enterprise Architecture Consulting §SOA and web services consulting

Enterprise Solutions: Poised for Growth
Organic Growth
Penetration in multiple Geographies
Inorganic Growth
Strategic Entry
Transforming relationships and scaling by investing in strategic accounts
Deeper penetration in multiple divisions of customer
Deeper Service lines penetration in same division
Alliance (teaming with niche players – for specific markets)
Mergers & Acquisitions Domain Capability
Customer Access
Buying out Maintenance Contracts
Penetration into JV partners of key customers
Specific focus on Large Deals
Growth
Focus on BPO services

Talent Management
Pratik Kumar Executive Vice President – Human Resources

34
Growing talent base
Offer
Evaluation
199900
6700
199899 5400
199798 3441
199697 3176
2002 11300
66100 *
Dec 06
The year 2006 Number of campus recruits : 6500 Number of lateral recruits: 9150
The growth engine :
66,100 employees, ~11,000 employees onsite across Geos, 23 nationalities, Avg age of 26
§ One of the top 3 recruiters in India § Application to Offer ratio of 0.8% § One of the most preferred
employers for the top class talent in India. § International Campus hiring
initiated across US, Europe and Asia

35
§ Dynamic Recruitment Database of 600,000+ profiles (200,000+ active and 400,000+ passive candidates). § Growing at the rate of 8000 per month § End‐2‐end Automation & Integration with all sourcing partners. § Highly automated recruitment process – ‘Synergy’
Managing the Talent Pipeline
Consultants – 15%
Database/Direct – 42% Career Site – 09%
Employee Referrals – 18%
Job Sites – 16%
SOURCE

36
Talent Pool Availability § India has only 7% of the total graduates with Engineering background § India will face a shortage of 500,000 knowledge workers by 2010
***NASSCOM-McKinsey Report
Pool of talent:

37
Mitigating Supply chain constrains
Other Sources
• Increasing the employability of engineering graduates (i2Connect, FDP, Fast Forward)
• Geo Campus hiring
• Centers outside India with cost advantage
• Leveraging acquisitions
Non engineering graduates
• Higher intake of WASE proportion (30004000 in 0708 against 1324 in 06 07)
•BSc graduates for TIS and Testing Services
• Movement from WBPO to WT in a planned way

38
Hiring patterns : overall composition trend
5361 5929
8542 9148
2501 3160 4742 5181
270 708 680 1324 2771
3868 5422
6505
0
2500
5000
7500
10000
200304 200405 200506 200607*
Laterals Engg Campus Non Engg Campus All Campuses
Bulge Mix Trend: Percentage of 03 years
37%
42%
46%
25%
35%
45%
55%
Mar'2004 05 Mar'2005 06 Dec 2006 07
Hiring Trend

39
Scalability Enablers – Systems and Processes
Shared Services 1.13 Million HR
transactions processed last yr
Processes 1127 employee queries per day
Web‐Based Resume Database
Synergy & Offer Generation
System
Employee Self Help
Portal Holds 98
applications
579 No. Of Lean Projects
520 Six Sigma Projects in 06‐
07 YTD
Services 66,000 Employees across The globe
Efficiency in Recruitment
One stop shop For all Employee
Needs
Making Processes Productive

40
Sculpting World Class “ Wipro Leaders”
EARLY OPPORTUNITIES
EARLY OPPORTUNITIES
360 degree Feedback (WLQ)
360 degree Feedback (WLQ)
TRAINING TRAINING
Cross Functional Exposure
Cross Functional Exposure
WINGS WITHIN WINGS WITHIN
Succession Planning Succession Planning
20 plus CXOs 75 plus Vice Presidents
Groomed in Wipro
Leadership Pipeline ü5000 Plus managers With Wipro for 5 – 10 yrs ü600 Plus managers with Wipro for 10 – 25 yrs
Winner of Dale Carnegie Leadership Award 2007

41
Learning and Development
5% Billable time spent on training
. 102 Full Time Faculty
50% hold Masters Degree 10 PhDs
5000 Learners per day
.
In the last 9 months 3800 person days of behavioral training across US, Europe Japan and China.
.
. 20,000 E Learners with access to 2200 titles of Learning
. Satellite Based Management Program with IIMC Covering 200 Managers
ASTD Award Winner for
3 consecutive Years
Training in 200506 : 3,80,000 person days..30% thru Tech Enabled Learning

42
Transforming Talent
Strategic Leadership Programs
Field Capability
Enhancement: Sales School
PM Academy: Managing
Talent Supply
Stanford Advanced Program
Management
Consulting Certifications
Lifecycle Leadership programs
In the last three years , 5000 plus employees have gone thru Lifecycle Leadership Training in our Corporate Leadership Centre @ Bangalore

Enabling Global Process Leadership The Wipro Q-cult Journey
Sambuddha Deb Chief Quality Officer

100 115 130
160 178
224 242
258 267 275
0
50
100
150
200
250
300
1995 1997 1998 1999 2000 2001 2002 2003 2004 200506
Time
Productivity
Defects
Customers view of quality AD engagements
Field Error Rate (Defects / Kloc)
Lower maintenance cost
Lower schedule overrun cost Schedule Adherence
Wipro Average: 91%
Lower development cost
Productivity Indexed to 1995 value
06
60%
68% 65%
80% 83% 91% 91% 91%
91% 91%
0%
20%
40%
60%
80%
100%
1995 1997 1998 1999 2000 2001 2002 2003 2004 200506

Regular development process
Maintenance costs
100
Wipro development process OTIS
Post delivery defect rate
120 defects/MLOC 55% lower than industry*
Assured quality
Schedule adherence
91 % projects completed on time, industry average of 76%*
On time delivery
Higher productivity
37 % higher productivity than industry ratio*
Lower costs
Development costs Schedule overrun
100
§ Rework effort reduced from 14% to 7%
81% of errors found in CUT* phase
Maintenance costs
Lower TCO:30–40%
Zero schedule overrun Greater productivity
*CUT Coding & Unit Testing
Taking your offshore engagement to another level
0
0
Quality processes that ensure lower TCO
* Worldwide IT Benchmark report 2004 – META Group and Bangalore SPIN

Pioneering Quality Standards
§ 15,000+ employees trained in Six Sigma methodologies § 204 certified black belts and 10 master black belts § Over 700 PMI certified consultants, highest in India § Lean techniques applied to software § Pioneers among Tier 1 Indian companies in establishing Agile capability
CMM Level - 3
CMM Level - 5
6 Sigma Methodologies for software
TL- 9000 PCMM Level 5
CMMI ISO 27001
ISO 9000
1997 On the road to
continuous improvement
1998
World’s fist software services company to be assessed at SEI
CMM Level 5
2000
Strengthening upstream processes
2001
The best in people processes World’s first PCMM Level 5 company
Industry- specific quality standards
2003
Infused Statistical Rigor into Management Software process achievement Award from IEEE USA Orthogonal Arrays DMAIC/ DSSS+ frameworks launched
SPA Award Statistical Rigor
Lean
2005
Studied Toyota Manufact uring System ) Lean Pilots
Agile
2006
CMMI 1.2 Global Assessment at Level 5
Domain specific standards •World’s first Automotive SPICE •AS9100 •SW68
CMMI 1.2 Level 5
2002
World’s first at Level 5 of CMMI ver 1.1
BS 7799
Among the first few organizations in the world, to be globally certified at Level 5 of SEI’s CMMI V 1.2 model released in Sep 06

Integrating six sigma in software development
Rigorous inprocess metrics and cause analysis
Software development life cycle
Preproject phase &
project initiation
Requirement study &
project plan
High level design
Low level design
Test design
Implementation
Test case development
System testing
Release &
acceptance testing
Customer interaction Rigorous design & implementation
§ VOC § Kano model § QFD § Benchmarking
§ Concept generation § Pugh matrix § FMEA
§ Design FMEA § Correlation § Regression § Hypothesis
testing
§ DOE § Orthogonal arrays
T O O L S

OA Test result summary
32
32
32
32
180
144
48
48
Total runs
4,2,4
4,2,4
4,2,4
4,2,4
9,4,5
9,4,4
6,4, 2
6, 4, 2
Levels
23 3 Process Hierarchy Control
23 3 Process Hierarchy Risk
23 3 Process Hierarchy Activity
23 3 Process Hierarchy Process
45 3 Hierarchy Library – Control
43 3 Hierarchy Library – Risk
28 3 Hierarchy Library – Activity
28 3 Hierarchy Library – Process
Actual runs by OA tool
Factors Business Function
236 test runs against 548 – more than 50% savings in testing

Next S Curve in Operational Excellence
Context
§ Omnipresence of CMMI & 6S § Customer preference of risk sharing contracts § Shift from technical to business metrics § Need to improve/sustain margins
Applying ‘Lean’ to move up the
next SCurve in Ops Excellence
Lean in ‘Wipro’
§ Focuses on cycle time & throughput improvement without compromising quality § Key principles:
§ Pull – Deliver customer value earlier § Flow – Wait states reductions, reducing handoffs, quick feedback § In station Quality – to improve defect resolutions upstream §500 projects till date
Req Design Coding Testing
§Concurrent Engineering §Early Feedback §Pull
§Load Balancing (TAKT) §In station Quality §Continuous Integration §Standardization §Automation §Test Setup Reduction §Test optimization
Harvard Case Study on Lean Application in Software

Large Banking Organization
Large Banking Organization
• New Technology • High application complexity, long review cycles, wait times • Project already over run during High Level Design
• New Technology • High application complexity, long review cycles, wait times • Project already over run during High Level Design
Lean Tenets • Value Stream • Information Spaghetti • Concurrent Engineering • Resource Balancing
Platform migration: Legacy to J2EE Platform migration: Legacy to J2EE
Overall Effort Slippage
13.79%
1.57%
8.61% 10.00%
5.00%
0.00%
5.00%
10.00%
15.00%
April May June
PDMR Month
Effort Slippage
Overall Effort Slippage
LEAN SAVINGS
Effort Reduction: The project was in 15% effort
over run Lean application helped in
getting an underrun

Customer satisfaction – We are not the only ones saying it
4.10
3.11
4.10
3.11
4.00
3.12
0.00
1.00
2.00
3.00
4.00
5.00
Choose Wipro Choose Competition
Ave
rage
Rat
ing
200304 200405 200506
0
20
40
60
80
100
% of Responses with Rating >= 4
20002001 78 68 55 79 20012002 88 77 76 89 20022003 90.4 82.3 82.9 89.5 20032004 81 74 72 82 20042005 90.3 70.8 73.7 85.0 20052006 80 70 70 85
Delivery Quality Service Overall
Satisfied Customers
Average Ratings
0.00
1.00
2.00
3.00
4.00
5.00
Average Rating
20002001 3.95 3.86 3.91 3.85 20012002 4.27 4.13 4.20 4.27 20022003 4.35 4.21 4.38 4.31 20032004 4.05 3.88 3.88 4.10 20042005 4.16 3.88 3.97 4.18 20052006 4.09 3.88 3.91 4.18
Delivery Quality Service Overall
Loyalty Scores
Gap between Wipro and Competition sustains

Future The Wipro Way
Process Excellence
People Management
Customer Centricity
Personal Change
The Wipro Way
Adaptability
Agility Alignment
Customer
•Delivery engine •Experimentati on culture •KM •Lean •6σ
•Unified solutions •Relations hip mgmt •After sales support •Partnering for success
•Customer focus •Experimentati on •Skill upgrade
•Right skill mix •High retention •High morale •PCMM

Wipro BPO Action Replay-Fast Forward
T K Kurien President, Wipro BPO

BPO: Where is the market headed?
Market segment by Service type 2006
Transformational services 20%
Vanilla of fshoring 70%
Boutique shops 1%
Platform 9%
Trends
• End to End/Transformational and Platform based services are expected to constitute 60% of the pie by 2010 (up from the current 29%)
• Customers demand a Global delivery model with a “follow the sun “ approach.
• BFSI and Telecom followed by manufacturing and travel are projected to be the growth drivers for the future.
• F&A market projections upto 2010 has been revised upwards by 100% from the previous year .
• Outcome based pricing will become a key reality
BPO Growth will be driven Increasingly by the need for Process efficiency and Reengineering capabilities. Transaction based model will become reality.
2006 2010
25
43
37
45 32 34 35 33
38 Horizontals (1.17)
Others (.78)
Pharma (0.26)
Telecom (0.52)
Manufacturing (0.65)
Travel and Hospitality (0.26)
Banking (2.08)
Insurance (1.04)
7.6
4.8
1.3 2.0
0.9 2.5
4.5
1.7
6.7
Market Realities Market is sharply consolidating in 4 specific segments.
• Global Providers with business transformation capabilities who go after Bespoke solutions
• Industry platform players who combine both platform as well as processing capabilities
• Offshore shops with focus around volume • Boutique players
US$ billion Offshore

BPO: Strategic Implications
Focused servicing of value chain with integrated solutions, scalable operations and Global footprint to drive growth
Strategic Implication Strategic Implication
Go to Market
Competencies & Delivery
Globalization of Delivery
§ Integrated Solution Capability –Customer sees a solution not a wedge § Current WT Sales force became the GTM arm. Wipro BPO Sales force restructured to provide Process Solutions
§ Product approach to Industry Solutions Creating Depth and Scale in few rather than many § SLA linked to final out put move from FTE based numbers to outcome based events § Follow the Sun Approach to Deliver services and building a globally scalable delivery model
§ Romania is the first Global Site. Baby steps taken to Globalizing not only the Romanian workforce but also the Wipro BPO workforce § Plan to have one more site by March 08 in the US time zone

Financial Snapshot Revenue
Revenue back on growth trajectory while Operating margin stabilizing at healthy numbers after significant/consistent growth
Revenue
• Revenue back on growth trajectory. • YOY revenue growth increased from 7% in Q1 to 19% in Q2 and 23% in Q3.
• Change in mix of business from several small processes to lesser number of processes but more strategic.
• Pipeline indicates a future growth in non voice business.
45.6
49.5
53
40
45
50
55
Q10607 Q20607 Q30607
Reven
ue $Mn
5% 8% 11% 14% 17% 20% 23%
YOY Growth %
Operating Margin
• Quality initiatives, productivity improvement and better utilisation of resources leading to consistent profit improvement.
• YTD Q3’ 06 07 margins 200% of YTD Q3 ’0506 margins.
• Operating margin as a percentage of revenue stabilized at healthy number of 23%.
Operating Margin
9.1
11.1 12.1
6 8 10 12
Q10607 Q20607 Q30607
OM $Mn
18%
21%
24%
OM %
OF REV
ENUE

57
Thank you
Information contained and transmitted by this presentation is proprietary to Wipro Limited and is intended for use only by the individual or entity to which it is addressed, and contains information that is privileged, confidential or exempt from disclosure under applicable law.