welcome to the gse multifamily forum session · welcome to the gse multifamily forum session ....
TRANSCRIPT

Welcome to the GSE Multifamily Forum Session Monday, June 8, 2015 11:00am – 12:30pm
Astor Ballroom – 7th Floor, Marriott Marquis Incoming Chair: Eric Draeger, Berkshire Property Advisors Incoming Chair-Elect: Mitchell Kiffe, CBRE Outgoing Chair: Mitch Resnick, Freddie Mac

GSE Multifamily Forum Agenda I. Welcome and Introductions II. Chair-Elect Affirmation III. GSE Reform & Legislative Update
• Marty Schuh, CREFC IV. CRE Outlook, Multifamily Fundamentals, & Economic Overview
• Richard Hill, Morgan Stanley V. Market Panel Roundtable Discussion
• Moderator: Chris Callahan, Credit Suisse • Eric Draeger, Berkshire Property Advisors • Mitchell Kiffe, CBRE • Mitch Resnick, Freddie Mac • Joshua Seiff, Fannie Mae
VI. Adjourn
A Golden Age for Multifamily M O R G A N S T A N L E Y R E S E A R C H North America Morgan Stanley & Co. LLC Richard Hill [email protected] +1 212 761 9840 Jerry Chen [email protected] +1 212 761 8591
Global Securitized Products Strategy
Due to the nature of the fixed income market, the issuers or bonds of the issuers recommended or discussed in this report may not be continuously followed. Accordingly, investors must regard this report as providing stand-alone analysis and should not expect continuing analysis or additional reports relating to such issuers or bonds of the issuers. Morgan Stanley does and seeks to do business with companies covered in Morgan Stanley Research. As a result, investors should be aware that the firm may have a conflict of interest that could affect the objectivity of Morgan Stanley Research. Investors should consider Morgan Stanley Research as only a single factor in making their investment decision.
For analyst certification and other important disclosures, refer to the Disclosure Section, located at the end of this report.
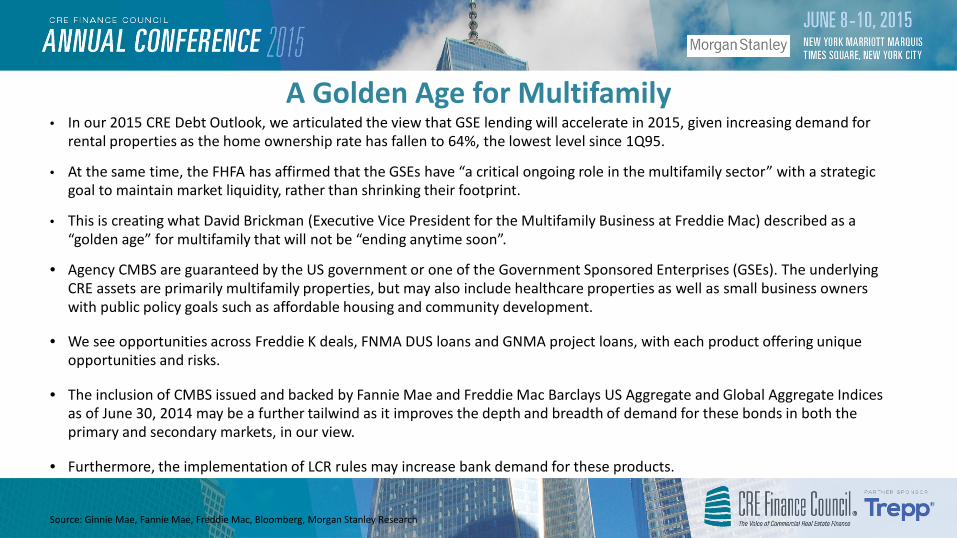
• In our 2015 CRE Debt Outlook, we articulated the view that GSE lending will accelerate in 2015, given increasing demand for rental properties as the home ownership rate has fallen to 64%, the lowest level since 1Q95.
• At the same time, the FHFA has affirmed that the GSEs have “a critical ongoing role in the multifamily sector” with a strategic goal to maintain market liquidity, rather than shrinking their footprint.
• This is creating what David Brickman (Executive Vice President for the Multifamily Business at Freddie Mac) described as a “golden age” for multifamily that will not be “ending anytime soon”.
• Agency CMBS are guaranteed by the US government or one of the Government Sponsored Enterprises (GSEs). The underlying CRE assets are primarily multifamily properties, but may also include healthcare properties as well as small business owners with public policy goals such as affordable housing and community development.
• We see opportunities across Freddie K deals, FNMA DUS loans and GNMA project loans, with each product offering unique opportunities and risks.
• The inclusion of CMBS issued and backed by Fannie Mae and Freddie Mac Barclays US Aggregate and Global Aggregate Indices as of June 30, 2014 may be a further tailwind as it improves the depth and breadth of demand for these bonds in both the primary and secondary markets, in our view.
• Furthermore, the implementation of LCR rules may increase bank demand for these products.
A Golden Age for Multifamily
Source: Ginnie Mae, Fannie Mae, Freddie Mac, Bloomberg, Morgan Stanley Research

Agency CMBS Overview
Source: Ginnie Mae, Fannie Mae, Freddie Mac, Bloomberg, Morgan Stanley Research
Freddie Mac K Deals
Fannie Mae DUS Megas
Fannie Mae DUS REMICs (ACES)
Ginnie Mae Project Loan REMICs
Bloomberg FREMF FN FNA GNR
Structure
Multi-tranche Single-tranche Multi-tranche Multi-tranche Sequential (Fixed) / Pro-Rata (Floating) Pass-Through Sequential Sequential
Credit Enhancement No Credit Enhancement No Credit Enhancement No Credit Enhancement
Loan Origination Process
Freddie Mac Multifamily sources its loans from a select group of experienced multifamily
lenders. Underwriting and credit reviews are completed by Freddie Mac, and CME loans are underwritten to the same standards as loans
held in Freddie Mac’s portfolio.
Approved lenders may underwrite, close and sell loans on multifamily properties to Fannie Mae without prior Fannie Mae review. DUS stands for ‘Delegated Underwriting Servicing’, which are
the origination and servicing guidelines for Fannie Mae’s multifamily lending program. There are currently 24 DUS lenders that usually retain a risk position in the loans.
The loans are underwritten by FHA-approved lenders, subject to minimum guidelines
including LTV and DSCR
Guarantor Freddie Mac guarantee (senior classes)
Fannie Mae guarantee
Full faith and credit of U.S. government
Guarantee Freddie Ks guarantee the timely payment of
interest and ultimately payment of principal on the guaranteed certificates.
Full recovery and timely payment of principal and interest. Yield maintenance payments are not guaranteed
The FHA guarantees ultimate payment of interest and principal on the loans while GNMA makes up for the inadequacies by guaranteeing
both the timeliness of principal and interest payments and by paying the 1% assignment fee
in the event of a default.
Pricing Assumptions 0% CPR 0% CPY: zero defaults and no prepayments after lockout
15% CPJ: 15% CPR after lockout and standard project loan default (PLD)
curve.

Apartments Lead the Rebound in CRE Fundamentals
Rental Demand Increases as Homeownership Rates Fall
Source: Mortgage Bankers Association, Trepp, Morgan Stanley Research
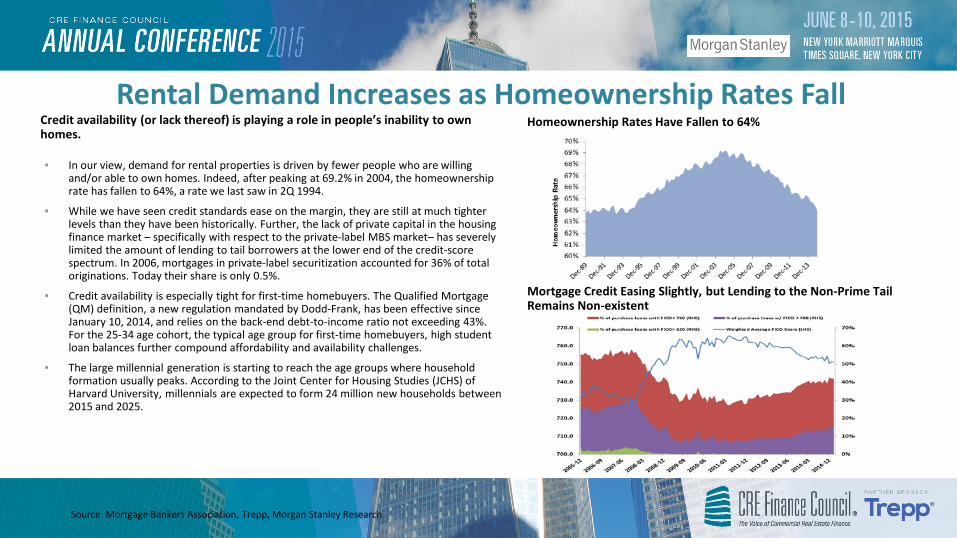
Credit availability (or lack thereof) is playing a role in people’s inability to own homes.
• In our view, demand for rental properties is driven by fewer people who are willing and/or able to own homes. Indeed, after peaking at 69.2% in 2004, the homeownership rate has fallen to 64%, a rate we last saw in 2Q 1994.
• While we have seen credit standards ease on the margin, they are still at much tighter levels than they have been historically. Further, the lack of private capital in the housing finance market – specifically with respect to the private-label MBS market– has severely limited the amount of lending to tail borrowers at the lower end of the credit-score spectrum. In 2006, mortgages in private-label securitization accounted for 36% of total originations. Today their share is only 0.5%.
• Credit availability is especially tight for first-time homebuyers. The Qualified Mortgage (QM) definition, a new regulation mandated by Dodd-Frank, has been effective since January 10, 2014, and relies on the back-end debt-to-income ratio not exceeding 43%. For the 25-34 age cohort, the typical age group for first-time homebuyers, high student loan balances further compound affordability and availability challenges.
• The large millennial generation is starting to reach the age groups where household formation usually peaks. According to the Joint Center for Housing Studies (JCHS) of Harvard University, millennials are expected to form 24 million new households between 2015 and 2025.
Mortgage Credit Easing Slightly, but Lending to the Non-Prime Tail Remains Non-existent
Homeownership Rates Have Fallen to 64%
Multifamily & GSE Lending Volumes Remain High
Source: MBA Survey of Commercial / Multifamily Originations, Morgan Stanley Research
Change in Year-over-Year Originations
0
100
200
300
400
500
600
700
1Q02
4Q02
3Q03
2Q04
1Q05
4Q05
3Q06
2Q07
1Q08
4Q08
3Q09
2Q10
1Q11
4Q11
3Q12
2Q13
1Q14
4Q14
CMBS/Conduits Commercial Banks
Life Insurance Fannie/Freddie
Origination Volume Index
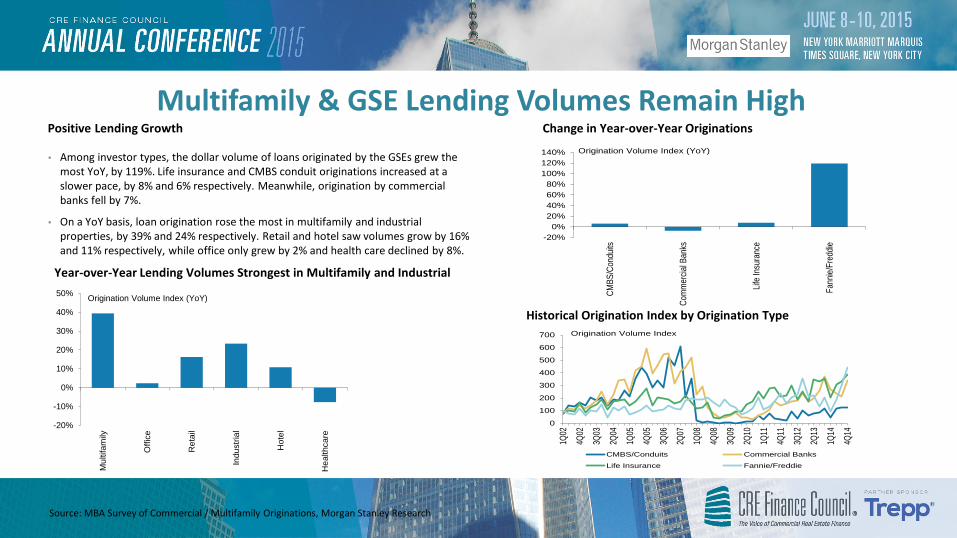
• Among investor types, the dollar volume of loans originated by the GSEs grew the most YoY, by 119%. Life insurance and CMBS conduit originations increased at a slower pace, by 8% and 6% respectively. Meanwhile, origination by commercial banks fell by 7%.
• On a YoY basis, loan origination rose the most in multifamily and industrial properties, by 39% and 24% respectively. Retail and hotel saw volumes grow by 16% and 11% respectively, while office only grew by 2% and health care declined by 8%.
Positive Lending Growth
-20%0%
20%40%60%80%
100%120%140%
CMBS
/Con
duits
Com
mer
cial B
anks
Life
Insu
ranc
e
Fann
ie/Fr
eddie
Origination Volume Index (YoY)
Historical Origination Index by Origination Type
Year-over-Year Lending Volumes Strongest in Multifamily and Industrial
-20%
-10%
0%
10%
20%
30%
40%
50%
Mul
tifam
ily
Offi
ce
Ret
ail
Indu
stria
l
Hot
el
Hea
lthca
re
Origination Volume Index (YoY)
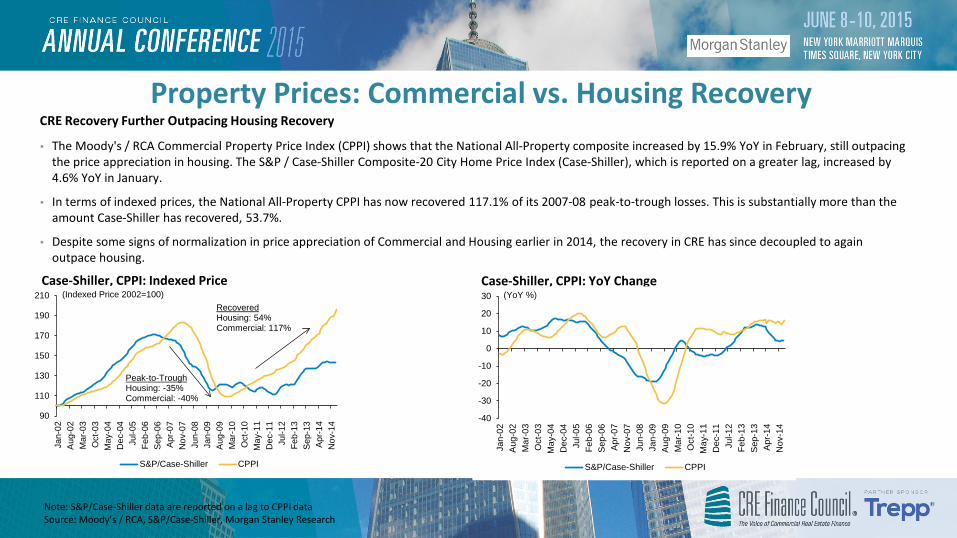
• The Moody's / RCA Commercial Property Price Index (CPPI) shows that the National All-Property composite increased by 15.9% YoY in February, still outpacing the price appreciation in housing. The S&P / Case-Shiller Composite-20 City Home Price Index (Case-Shiller), which is reported on a greater lag, increased by 4.6% YoY in January.
• In terms of indexed prices, the National All-Property CPPI has now recovered 117.1% of its 2007-08 peak-to-trough losses. This is substantially more than the amount Case-Shiller has recovered, 53.7%.
• Despite some signs of normalization in price appreciation of Commercial and Housing earlier in 2014, the recovery in CRE has since decoupled to again outpace housing.
Property Prices: Commercial vs. Housing Recovery
Note: S&P/Case-Shiller data are reported on a lag to CPPI data Source: Moody’s / RCA, S&P/Case-Shiller, Morgan Stanley Research
CRE Recovery Further Outpacing Housing Recovery
Case-Shiller, CPPI: Indexed Price Case-Shiller, CPPI: YoY Change
90
110
130
150
170
190
210
Jan-
02A
ug-0
2M
ar-0
3O
ct-0
3M
ay-0
4D
ec-0
4Ju
l-05
Feb-
06S
ep-0
6A
pr-0
7N
ov-0
7Ju
n-08
Jan-
09A
ug-0
9M
ar-1
0O
ct-1
0M
ay-1
1D
ec-1
1Ju
l-12
Feb-
13S
ep-1
3A
pr-1
4N
ov-1
4
S&P/Case-Shiller CPPI
(Indexed Price 2002=100)
Peak-to-TroughHousing: -35%Commercial: -40%
RecoveredHousing: 54%Commercial: 117%
-40
-30
-20
-10
0
10
20
30
Jan-
02A
ug-0
2M
ar-0
3O
ct-0
3M
ay-0
4D
ec-0
4Ju
l-05
Feb-
06S
ep-0
6A
pr-0
7N
ov-0
7Ju
n-08
Jan-
09A
ug-0
9M
ar-1
0O
ct-1
0M
ay-1
1D
ec-1
1Ju
l-12
Feb-
13S
ep-1
3A
pr-1
4N
ov-1
4
S&P/Case-Shiller CPPI
(YoY %)

• Major markets have recovered 155.7% of their peak-to-trough losses, while non-major markets have recovered only 88.2% of theirs. Major market prices grew 16.7% in February YoY, 0.4 percentage points faster than the prior month. Meanwhile non-major market prices increased by 15.2% YoY, 0.8 percentage points faster than the previous month.
• Out of the main property types, apartment prices have recovered the most since the crisis, recouping 167.7% of peak-to-trough losses, while retail and industrial have recouped the least (78.9% and 94.8%, respectively).
• The subsectors with the fastest YoY price growth are major market industrial and non-major market suburban office, 24.0% and 18.6% respectively. This contrasts with major-market retail, which saw prices grow by only 3.0% YoY.
Apartment Leading the Recovery in Prices
Note: Major and Non-Major market breakouts of each property sector are quarterly data, all else is monthly. Peaks are pre-crisis (2007-08), troughs are post-crisis (2009-10). Hotel indices less comparable to other sectors due to data differences. Source: Moody’s / RCA, Morgan Stanley Research
Major Markets’ Price Appreciation Continue to Outpace Non-Major Markets
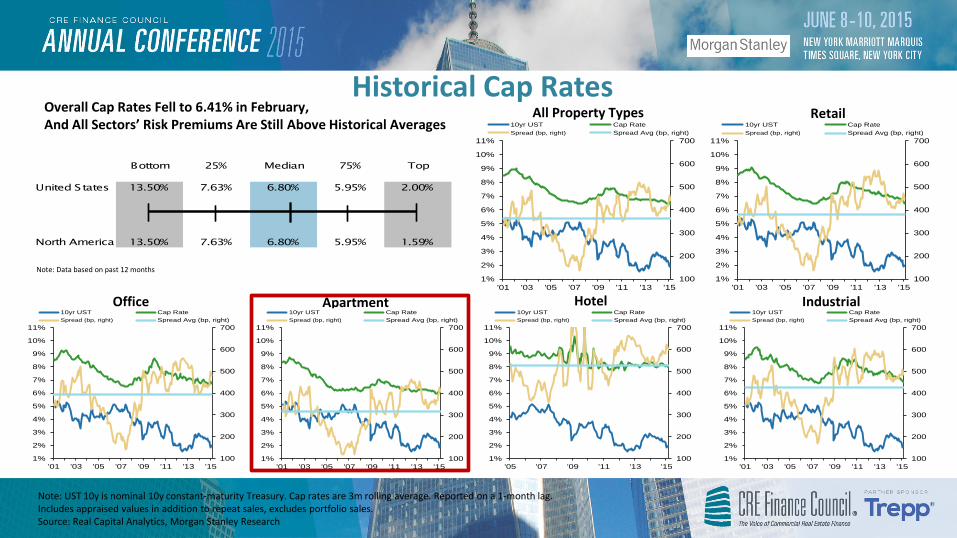
Historical Cap Rates
Note: UST 10y is nominal 10y constant-maturity Treasury. Cap rates are 3m rolling average. Reported on a 1-month lag. Includes appraised values in addition to repeat sales, excludes portfolio sales. Source: Real Capital Analytics, Morgan Stanley Research
Overall Cap Rates Fell to 6.41% in February, And All Sectors’ Risk Premiums Are Still Above Historical Averages
Retail
100
200
300
400
500
600
700
1%
2%
3%
4%
5%
6%
7%
8%
9%
10%
11%
'01 '03 '05 '07 '09 '11 '13 '15
10yr UST Cap RateSpread (bp, right) Spread Avg (bp, right)
All Property Types
Office Apartment Hotel Industrial
100
200
300
400
500
600
700
1%
2%
3%
4%
5%
6%
7%
8%
9%
10%
11%
'01 '03 '05 '07 '09 '11 '13 '15
10yr UST Cap RateSpread (bp, right) Spread Avg (bp, right)
100
200
300
400
500
600
700
1%
2%
3%
4%
5%
6%
7%
8%
9%
10%
11%
'01 '03 '05 '07 '09 '11 '13 '15
10yr UST Cap RateSpread (bp, right) Spread Avg (bp, right)
100
200
300
400
500
600
700
1%
2%
3%
4%
5%
6%
7%
8%
9%
10%
11%
'01 '03 '05 '07 '09 '11 '13 '15
10yr UST Cap RateSpread (bp, right) Spread Avg (bp, right)
100
200
300
400
500
600
700
1%
2%
3%
4%
5%
6%
7%
8%
9%
10%
11%
'05 '07 '09 '11 '13 '15
10yr UST Cap RateSpread (bp, right) Spread Avg (bp, right)
100
200
300
400
500
600
700
1%
2%
3%
4%
5%
6%
7%
8%
9%
10%
11%
'01 '03 '05 '07 '09 '11 '13 '15
10yr UST Cap RateSpread (bp, right) Spread Avg (bp, right)
Bottom 25% Median 75% Top
United States 13.50% 7.63% 6.80% 5.95% 2.00%
North America 13.50% 7.63% 6.80% 5.95% 1.59%
Note: Data based on past 12 months
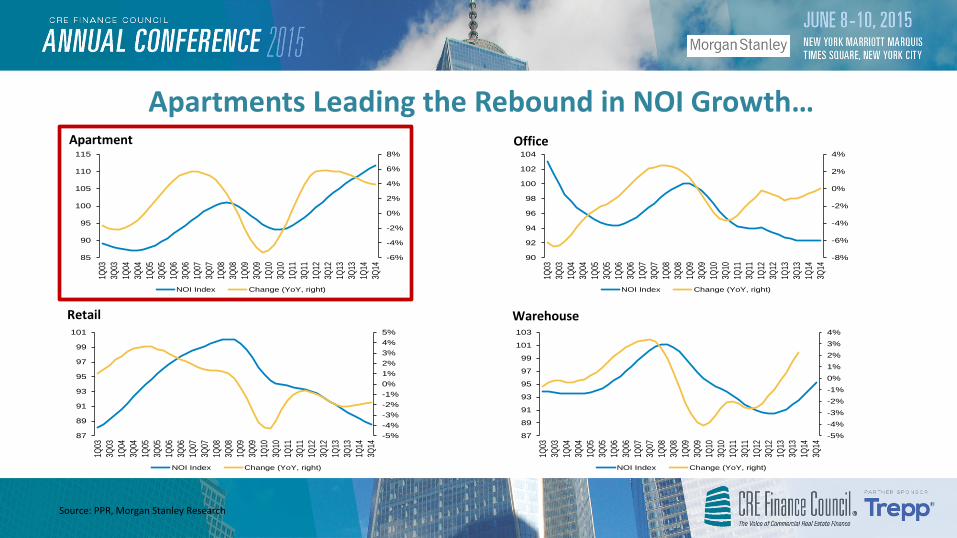
Apartments Leading the Rebound in NOI Growth…
Source: PPR, Morgan Stanley Research
-6%
-4%
-2%
0%
2%
4%
6%
8%
85
90
95
100
105
110
115
1Q03
3Q03
1Q04
3Q04
1Q05
3Q05
1Q06
3Q06
1Q07
3Q07
1Q08
3Q08
1Q09
3Q09
1Q10
3Q10
1Q11
3Q11
1Q12
3Q12
1Q13
3Q13
1Q14
3Q14
NOI Index Change (YoY, right)
-8%
-6%
-4%
-2%
0%
2%
4%
90
92
94
96
98
100
102
104
1Q03
3Q03
1Q04
3Q04
1Q05
3Q05
1Q06
3Q06
1Q07
3Q07
1Q08
3Q08
1Q09
3Q09
1Q10
3Q10
1Q11
3Q11
1Q12
3Q12
1Q13
3Q13
1Q14
3Q14
NOI Index Change (YoY, right)
Apartment Office
Retail Warehouse
-5%-4%-3%-2%-1%0%1%2%3%4%5%
87
89
91
93
95
97
99
101
1Q03
3Q03
1Q04
3Q04
1Q05
3Q05
1Q06
3Q06
1Q07
3Q07
1Q08
3Q08
1Q09
3Q09
1Q10
3Q10
1Q11
3Q11
1Q12
3Q12
1Q13
3Q13
1Q14
3Q14
NOI Index Change (YoY, right)
-5%-4%-3%-2%-1%0%1%2%3%4%
87
89
91
93
95
97
99
101
103
1Q03
3Q03
1Q04
3Q04
1Q05
3Q05
1Q06
3Q06
1Q07
3Q07
1Q08
3Q08
1Q09
3Q09
1Q10
3Q10
1Q11
3Q11
1Q12
3Q12
1Q13
3Q13
1Q14
3Q14
NOI Index Change (YoY, right)
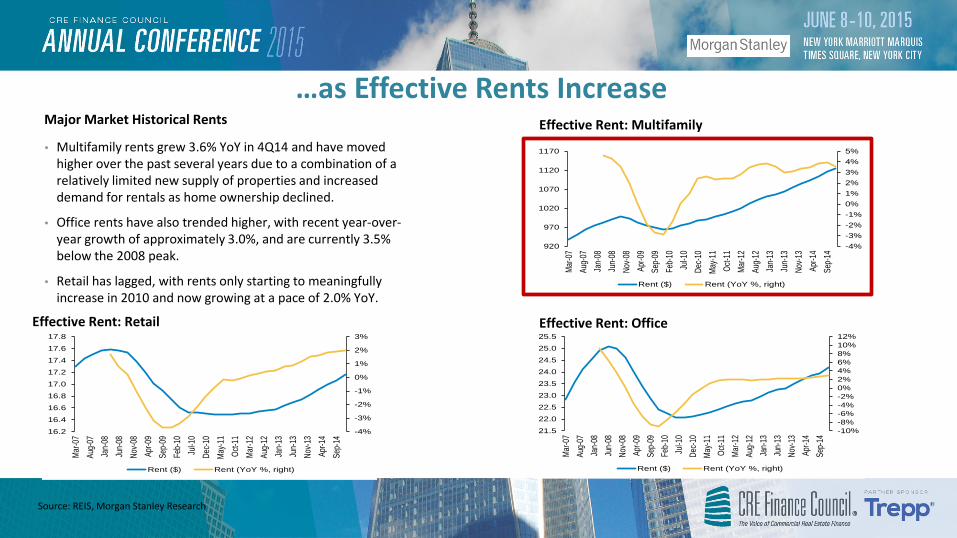
…as Effective Rents Increase
Source: REIS, Morgan Stanley Research
Effective Rent: Multifamily
-4%
-3%
-2%
-1%
0%
1%
2%
3%
16.2
16.4
16.6
16.8
17.0
17.2
17.4
17.6
17.8
Mar-0
7Au
g-07
Jan-
08Ju
n-08
Nov-0
8Ap
r-09
Sep-
09Fe
b-10
Jul-1
0De
c-10
May-1
1Oc
t-11
Mar-1
2Au
g-12
Jan-
13Ju
n-13
Nov-1
3Ap
r-14
Sep-
14
Rent ($) Rent (YoY %, right)
• Multifamily rents grew 3.6% YoY in 4Q14 and have moved higher over the past several years due to a combination of a relatively limited new supply of properties and increased demand for rentals as home ownership declined.
• Office rents have also trended higher, with recent year-over-year growth of approximately 3.0%, and are currently 3.5% below the 2008 peak.
• Retail has lagged, with rents only starting to meaningfully increase in 2010 and now growing at a pace of 2.0% YoY.
Major Market Historical Rents
-4%-3%-2%-1%0%1%2%3%4%5%
920
970
1020
1070
1120
1170
Mar-0
7Au
g-07
Jan-
08Ju
n-08
Nov-0
8Ap
r-09
Sep-
09Fe
b-10
Jul-1
0De
c-10
May-1
1Oc
t-11
Mar-1
2Au
g-12
Jan-
13Ju
n-13
Nov-1
3Ap
r-14
Sep-
14
Rent ($) Rent (YoY %, right)
-10%-8%-6%-4%-2%0%2%4%6%8%10%12%
21.5
22.0
22.5
23.0
23.5
24.0
24.5
25.0
25.5
Mar-0
7Au
g-07
Jan-
08Ju
n-08
Nov-0
8Ap
r-09
Sep-
09Fe
b-10
Jul-1
0De
c-10
May-1
1Oc
t-11
Mar-1
2Au
g-12
Jan-
13Ju
n-13
Nov-1
3Ap
r-14
Sep-
14
Rent ($) Rent (YoY %, right)
Effective Rent: Office Effective Rent: Retail
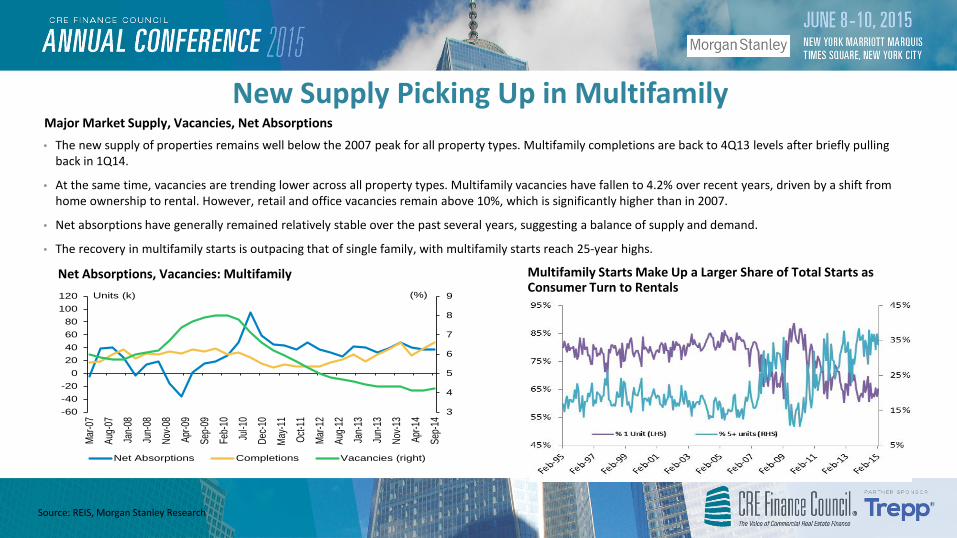
New Supply Picking Up in Multifamily
Source: REIS, Morgan Stanley Research
• The new supply of properties remains well below the 2007 peak for all property types. Multifamily completions are back to 4Q13 levels after briefly pulling back in 1Q14.
• At the same time, vacancies are trending lower across all property types. Multifamily vacancies have fallen to 4.2% over recent years, driven by a shift from home ownership to rental. However, retail and office vacancies remain above 10%, which is significantly higher than in 2007.
• Net absorptions have generally remained relatively stable over the past several years, suggesting a balance of supply and demand.
• The recovery in multifamily starts is outpacing that of single family, with multifamily starts reach 25-year highs.
Major Market Supply, Vacancies, Net Absorptions
Multifamily Starts Make Up a Larger Share of Total Starts as Consumer Turn to Rentals
Net Absorptions, Vacancies: Multifamily
3
4
5
6
7
8
9
-60-40-20
020406080
100120
Mar-0
7
Aug-
07
Jan-
08
Jun-
08
Nov-0
8
Apr-0
9
Sep-
09
Feb-
10
Jul-1
0
Dec-1
0
May-1
1
Oct-1
1
Mar-1
2
Aug-
12
Jan-
13
Jun-
13
Nov-1
3
Apr-1
4
Sep-
14
Net Absorptions Completions Vacancies (right)
(%)Units (k)
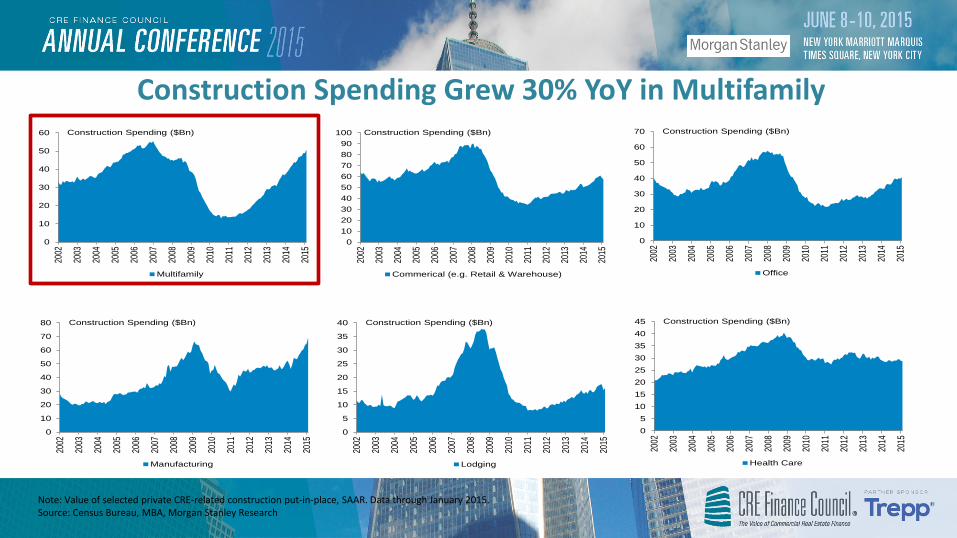
Construction Spending Grew 30% YoY in Multifamily
Note: Value of selected private CRE-related construction put-in-place, SAAR. Data through January 2015. Source: Census Bureau, MBA, Morgan Stanley Research
0
10
20
30
40
50
60
2002
2003
2004
2005
2006
2007
2008
2009
2010
2011
2012
2013
2014
2015
Multifamily
Construction Spending ($Bn)
0102030405060708090
100
2002
2003
2004
2005
2006
2007
2008
2009
2010
2011
2012
2013
2014
2015
Commerical (e.g. Retail & Warehouse)
Construction Spending ($Bn)
0
10
20
30
40
50
60
70
2002
2003
2004
2005
2006
2007
2008
2009
2010
2011
2012
2013
2014
2015
Office
Construction Spending ($Bn)
0
10
20
30
40
50
60
70
80
2002
2003
2004
2005
2006
2007
2008
2009
2010
2011
2012
2013
2014
2015
Manufacturing
Construction Spending ($Bn)
0
5
10
15
20
25
30
35
40
2002
2003
2004
2005
2006
2007
2008
2009
2010
2011
2012
2013
2014
2015
Lodging
Construction Spending ($Bn)
05
1015202530354045
2002
2003
2004
2005
2006
2007
2008
2009
2010
2011
2012
2013
2014
2015
Health Care
Construction Spending ($Bn)

5
10
15
20
25
30
35
40
45
'09 '10 '11 '12 '13 '14
Individual Portfolio Entity($bn)
5
10
15
20
25
30
'09 '10 '11 '12 '13 '14
Individual Portfolio Entity($bn)
5
10
15
20
25
30
35
40
'09 '10 '11 '12 '13 '14
Individual Portfolio Entity($bn)
2
4
6
8
10
12
14
16
18
'09 '10 '11 '12 '13 '14
Individual Portfolio Entity($bn)
123456789
10
'09 '10 '11 '12 '13 '14
Individual Portfolio Entity($bn)
20
40
60
80
100
120
140
'09 '10 '11 '12 '13 '14
Individual Portfolio Entity($bn)
Apartment Sales Volumes Among Highest
Source: Real Capital Analytics, Morgan Stanley Research
Retail Volume Apartment Volume
Office Volume Hotel Volume
Total Volume
Industrial Volume
