welcome to the first jmeter meetupfiles.meetup.com/3349022/jmeter meetup 090512.pdf · what is...
TRANSCRIPT
WELCOME TO THE FIRST JMETER MEETUP MAY 9TH, 2012
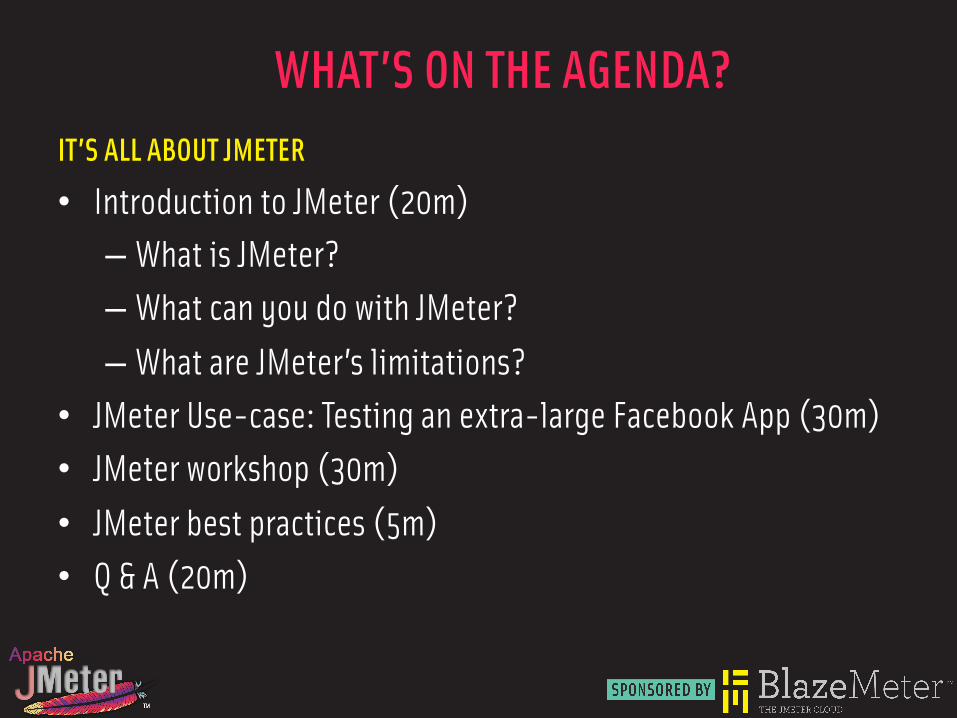
WHAT’S ON THE AGENDA? IT’S ALL ABOUT JMETER
• Introduction to JMeter (20m) – What is JMeter? – What can you do with JMeter? – What are JMeter’s limitations?
• JMeter Use-case: Testing an extra-large Facebook App (30m) • JMeter workshop (30m) • JMeter best practices (5m) • Q & A (20m)
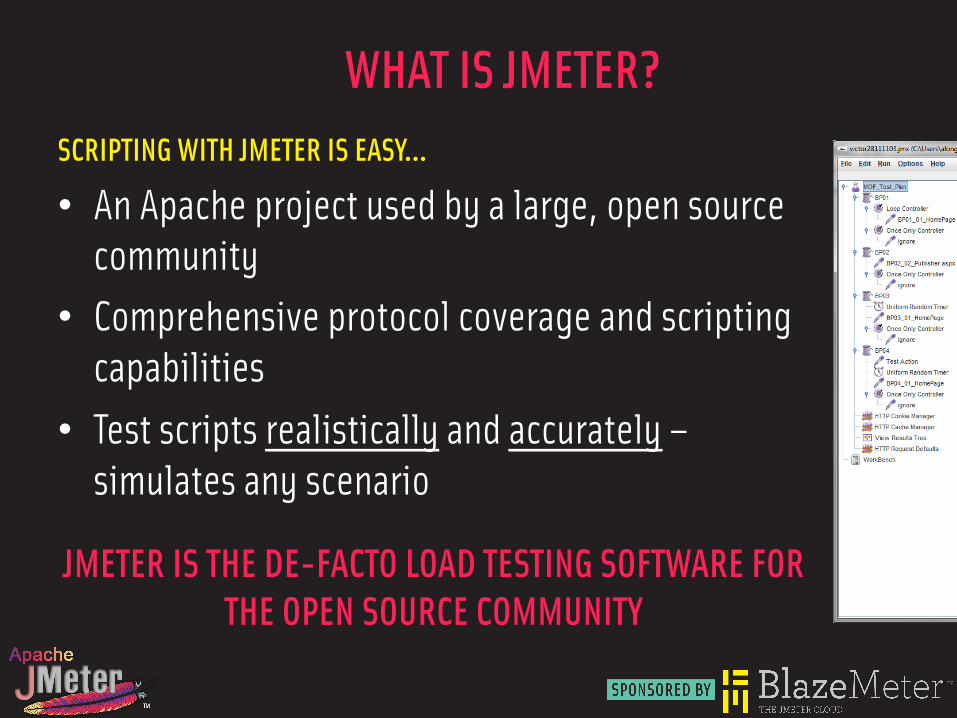
WHAT IS JMETER? SCRIPTING WITH JMETER IS EASY…
• An Apache project used by a large, open source community
• Comprehensive protocol coverage and scripting capabilities
• Test scripts realistically and accurately – simulates any scenario
JMETER IS THE DE-FACTO LOAD TESTING SOFTWARE FOR THE OPEN SOURCE COMMUNITY
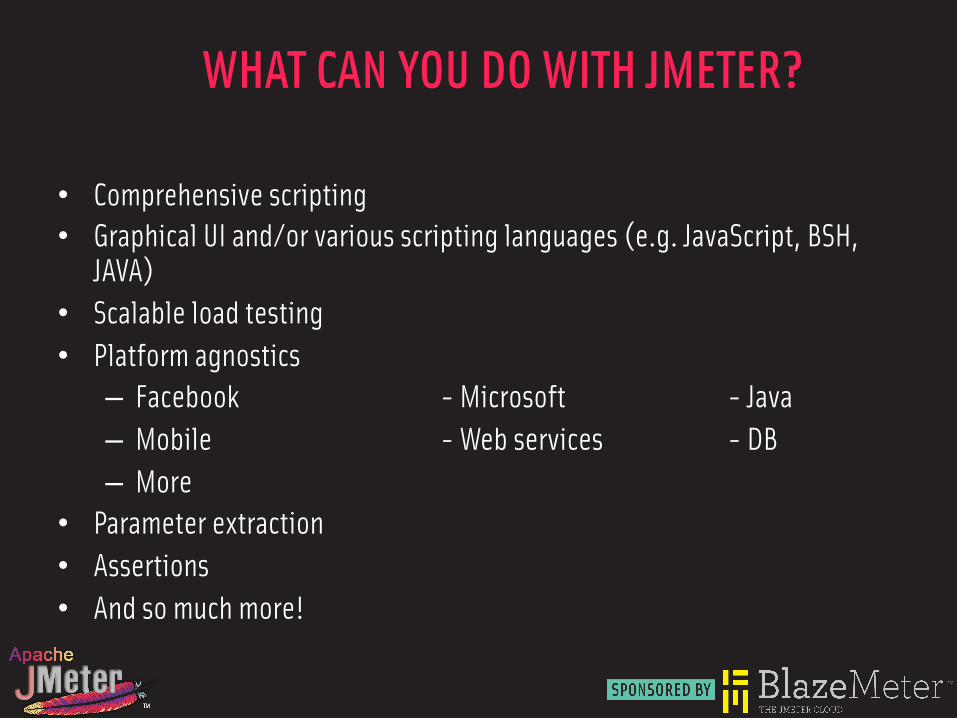
WHAT CAN YOU DO WITH JMETER?
• Comprehensive scripting • Graphical UI and/or various scripting languages (e.g. JavaScript, BSH,
JAVA) • Scalable load testing • Platform agnostics – Facebook - Microsoft - Java – Mobile - Web services - DB – More
• Parameter extraction • Assertions • And so much more!
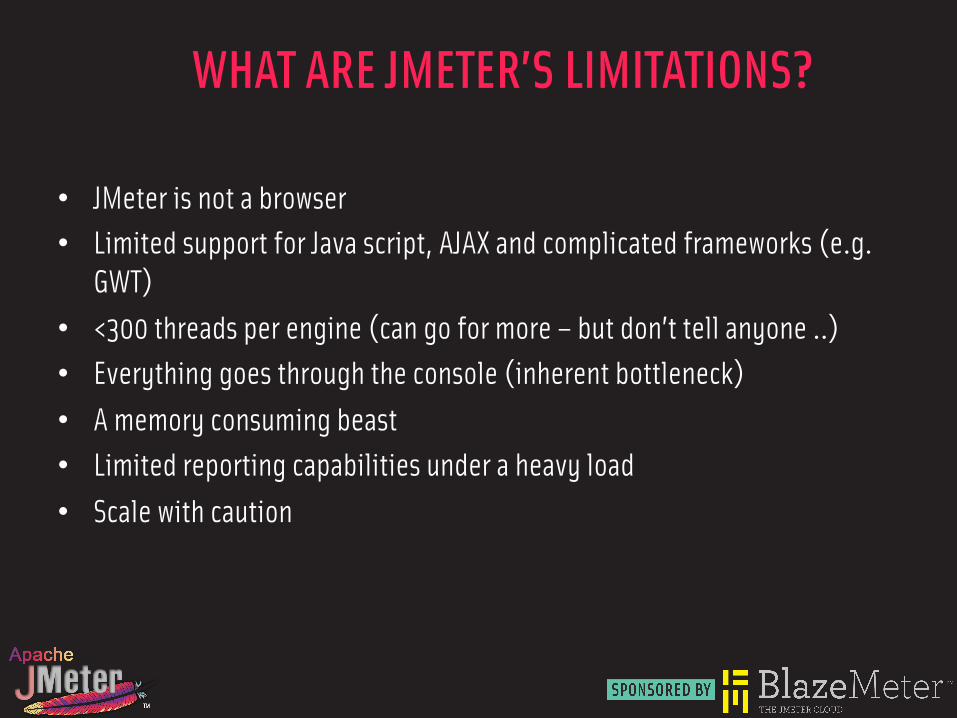
WHAT ARE JMETER’S LIMITATIONS?
• JMeter is not a browser • Limited support for Java script, AJAX and complicated frameworks (e.g.
GWT) • <300 threads per engine (can go for more – but don’t tell anyone ..) • Everything goes through the console (inherent bottleneck) • A memory consuming beast • Limited reporting capabilities under a heavy load • Scale with caution
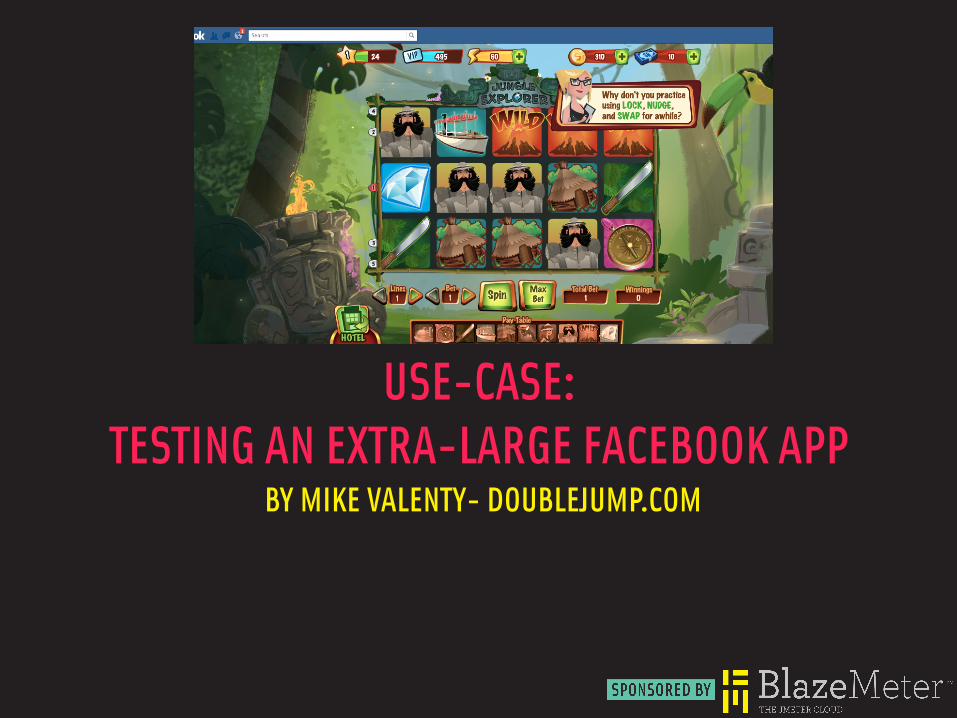
USE-CASE: TESTING AN EXTRA-LARGE FACEBOOK APP
BY MIKE VALENTY- DOUBLEJUMP.COM
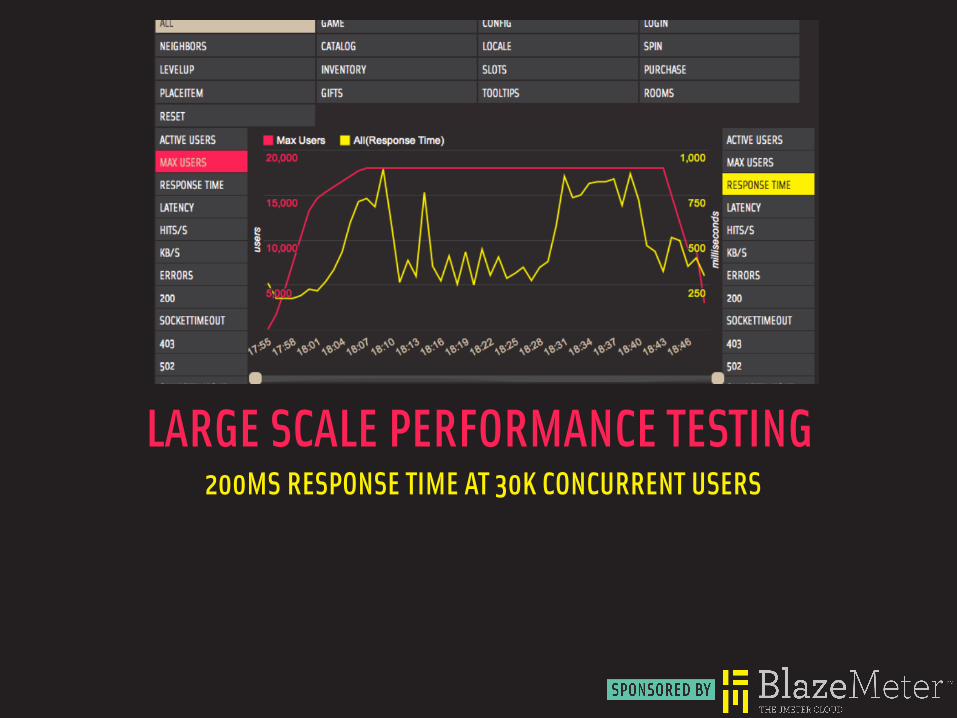
LARGE SCALE PERFORMANCE TESTING 200MS RESPONSE TIME AT 30K CONCURRENT USERS
GOALS OF LARGE SCALE TESTING
• Software architecture • Physical architecture – Disk IO – Connections – Bandwidth – Locking
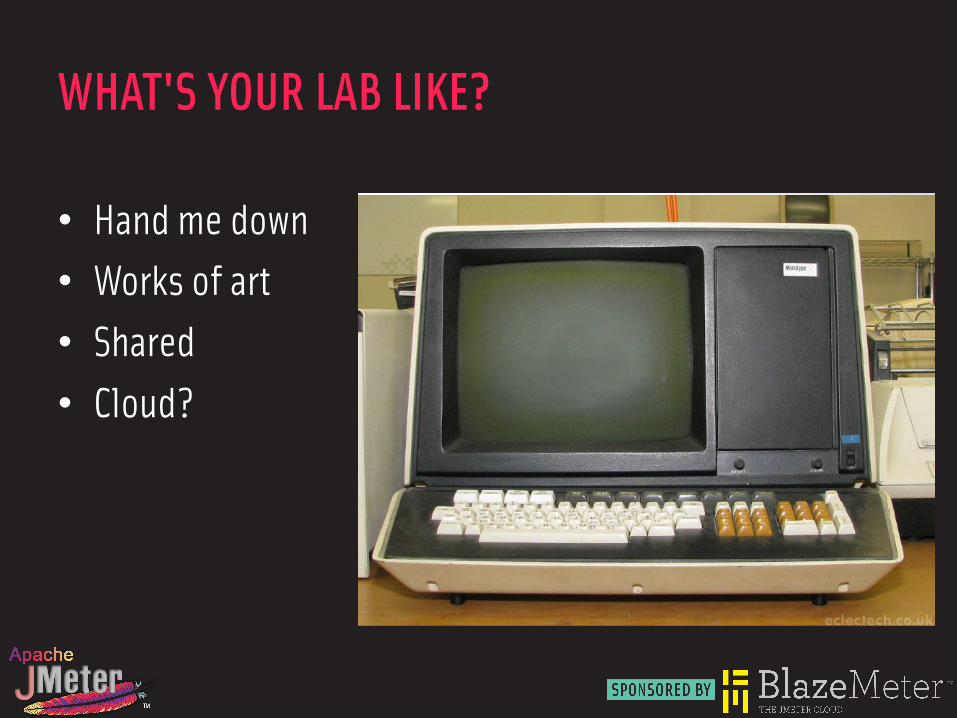
WHAT'S YOUR LAB LIKE?
• Hand me down • Works of art • Shared • Cloud?
:KDWV�\RXU�ODE�OLNH"
Ɣ +DQG�PH�GRZQ�Ɣ :RUNV�RI�DUW�Ɣ 6KDUHG�Ɣ &ORXG"
AMAZON ELASTIC BEANSTALK
• Auto scaling layer on top of EC2 • Deployment pipeline * • Zero downtime deployments • CloudFront, ElastiCache, Route 53
• Runs in Tomcat * • Lightweight • RESTful-ish
Ɣ 5XQV�LQ�7RPFDW�Ɣ /LJKWZHLJKW�Ɣ 5(67IXO�LVK
��
0RQJR'%�LV�ZHE�VFDOH
MongoDB is Web Scale
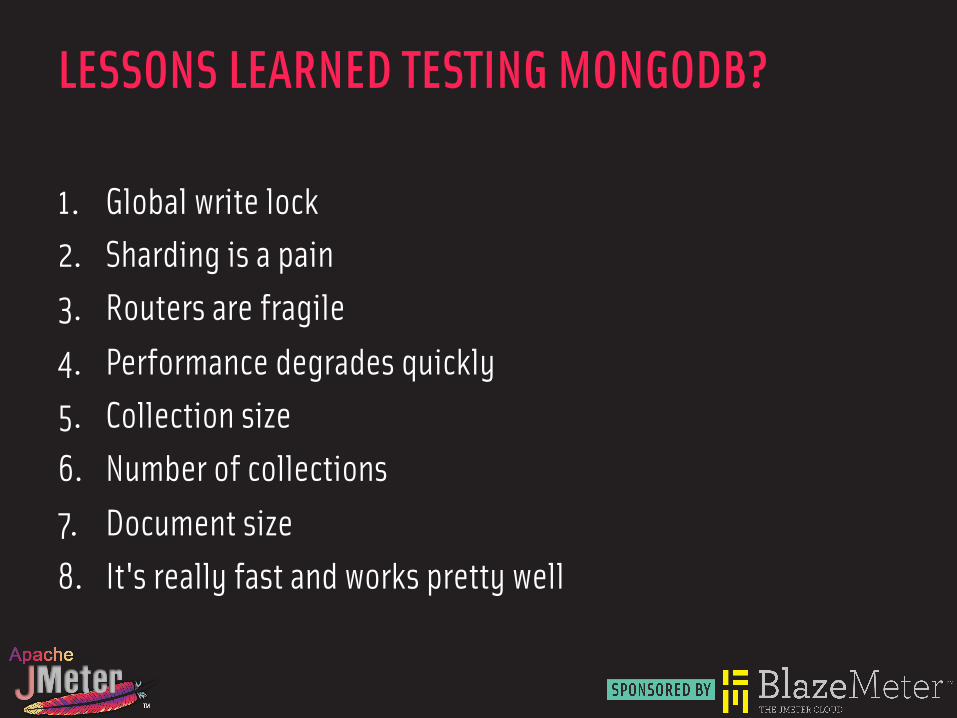
LESSONS LEARNED TESTING MONGODB?
1. Global write lock 2. Sharding is a pain 3. Routers are fragile 4. Performance degrades quickly 5. Collection size 6. Number of collections 7. Document size 8. It's really fast and works pretty well
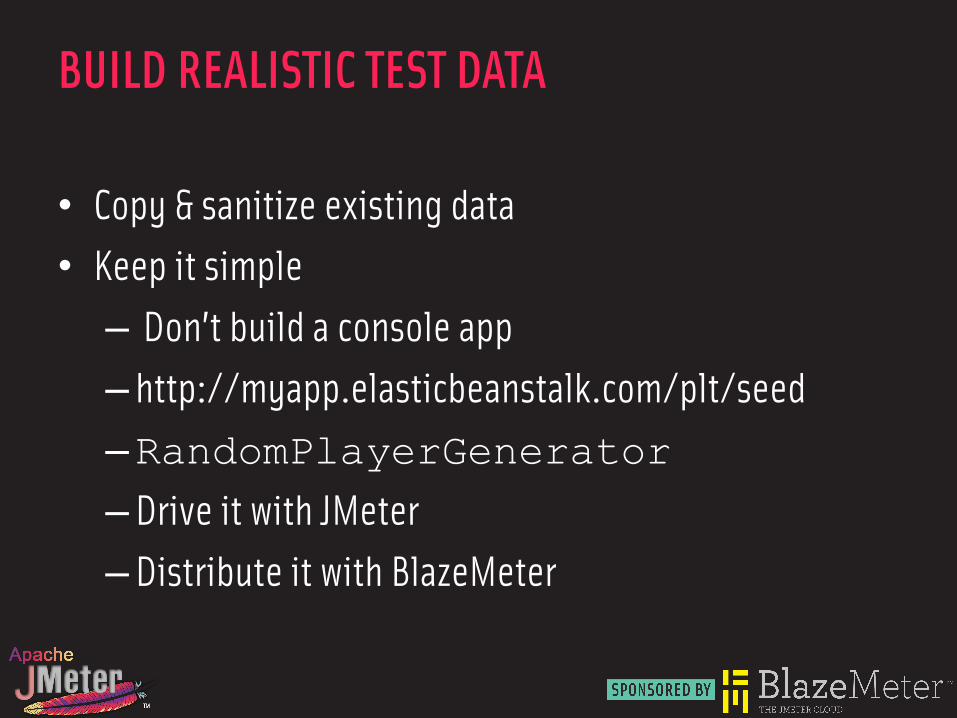
BUILD REALISTIC TEST DATA
• Copy & sanitize existing data • Keep it simple – Don’t build a console app – http://myapp.elasticbeanstalk.com/plt/seed – RandomPlayerGenerator – Drive it with JMeter – Distribute it with BlazeMeter
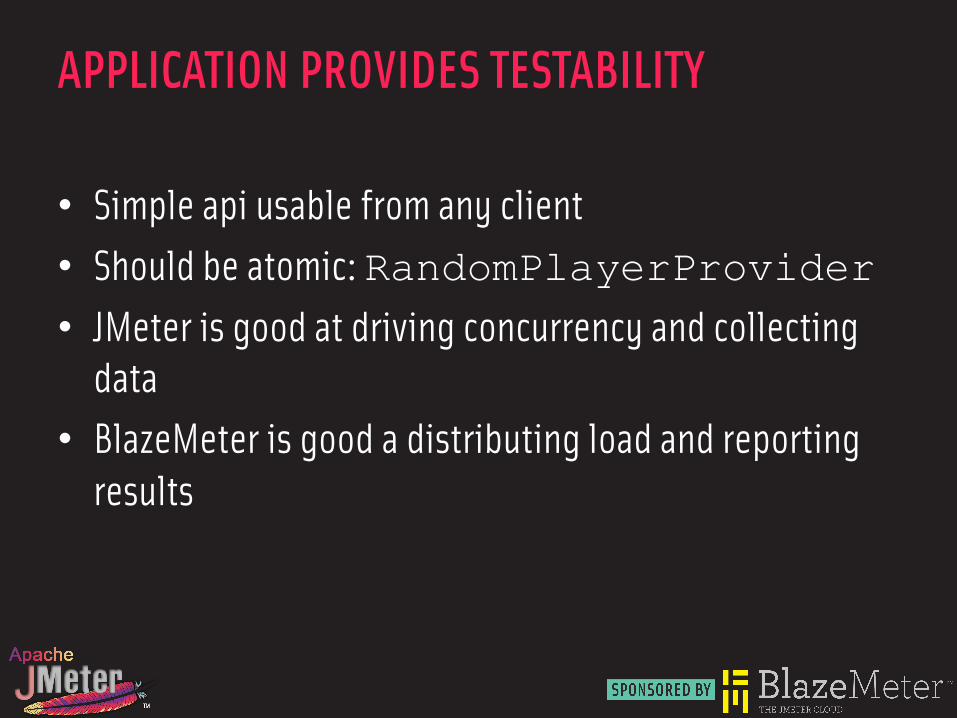
APPLICATION PROVIDES TESTABILITY
• Simple api usable from any client • Should be atomic: RandomPlayerProvider • JMeter is good at driving concurrency and collecting
data • BlazeMeter is good a distributing load and reporting
results
JMETER WORKSHOP BY ALON GIRMONSKY - BLAZEMETER
THE JMETER WORKSHOP LOGIN AND POST A REQUEST • Record • Clean • Parameterize • Debug • Test • Analyze report
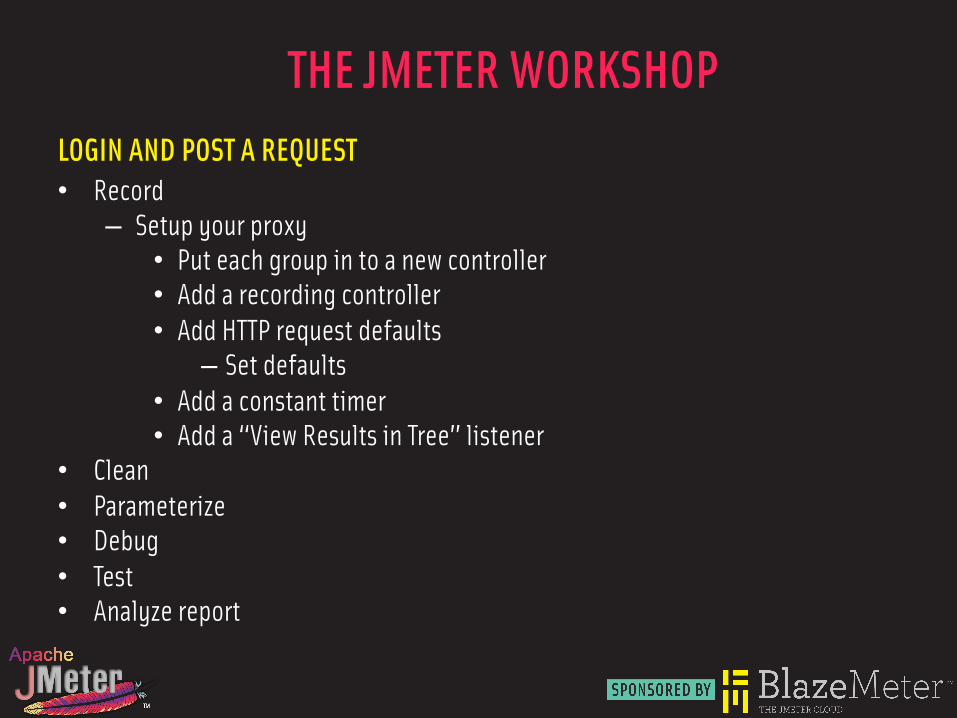
THE JMETER WORKSHOP LOGIN AND POST A REQUEST • Record
– Setup your proxy • Put each group in to a new controller • Add a recording controller • Add HTTP request defaults
– Set defaults • Add a constant timer • Add a “View Results in Tree” listener
• Clean • Parameterize • Debug • Test • Analyze report
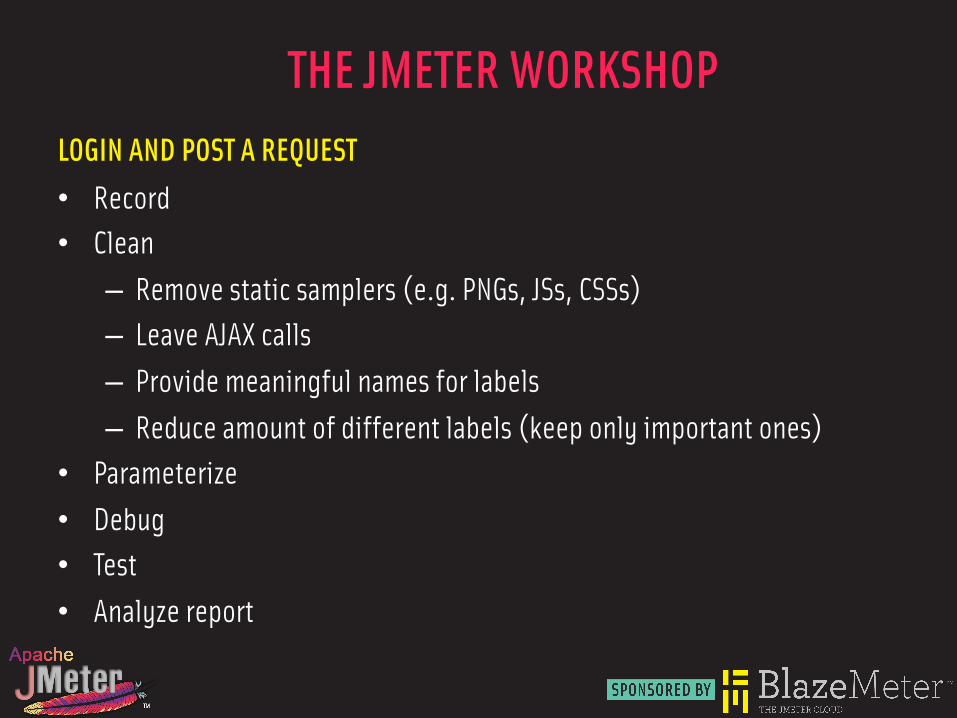
THE JMETER WORKSHOP LOGIN AND POST A REQUEST • Record • Clean – Remove static samplers (e.g. PNGs, JSs, CSSs) – Leave AJAX calls – Provide meaningful names for labels – Reduce amount of different labels (keep only important ones)
• Parameterize • Debug • Test • Analyze report
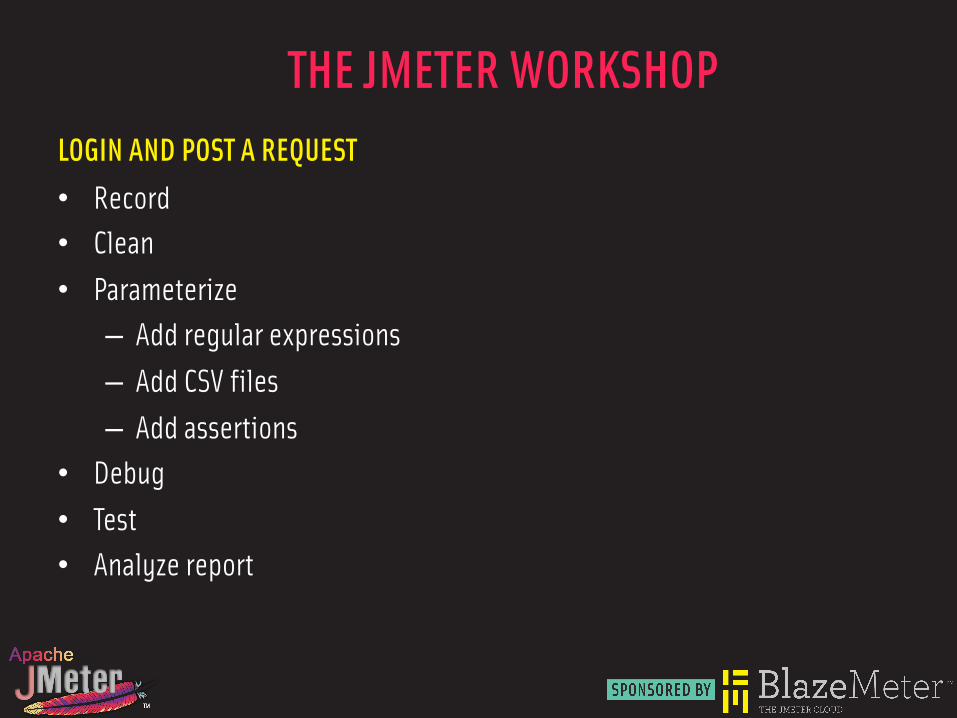
THE JMETER WORKSHOP LOGIN AND POST A REQUEST • Record • Clean • Parameterize – Add regular expressions – Add CSV files – Add assertions
• Debug • Test • Analyze report
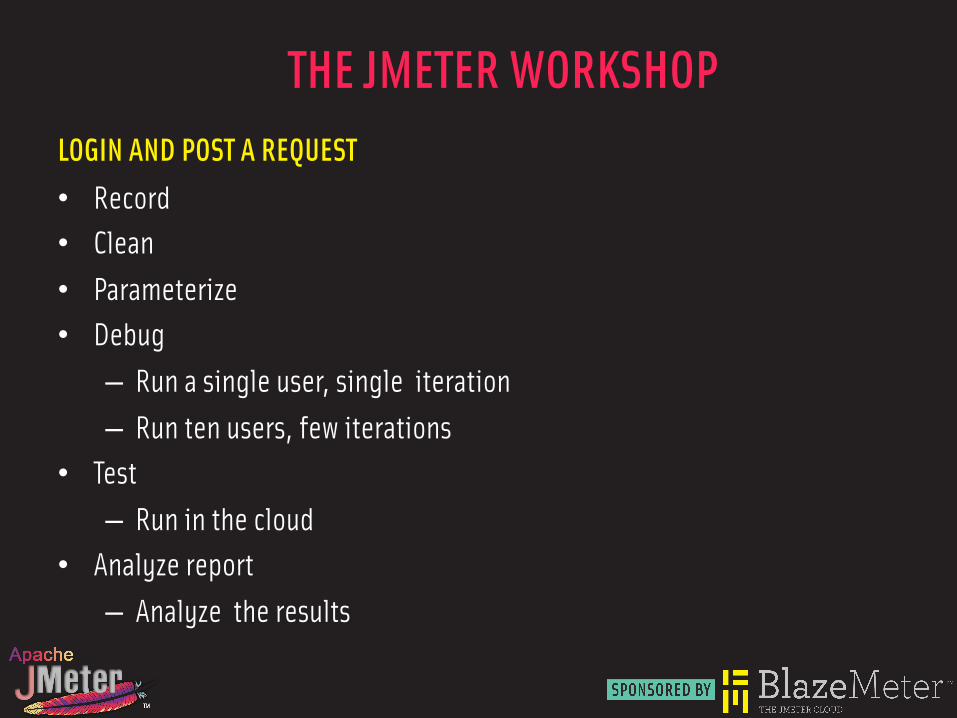
THE JMETER WORKSHOP LOGIN AND POST A REQUEST • Record • Clean • Parameterize • Debug – Run a single user, single iteration – Run ten users, few iterations
• Test – Run in the cloud
• Analyze report – Analyze the results
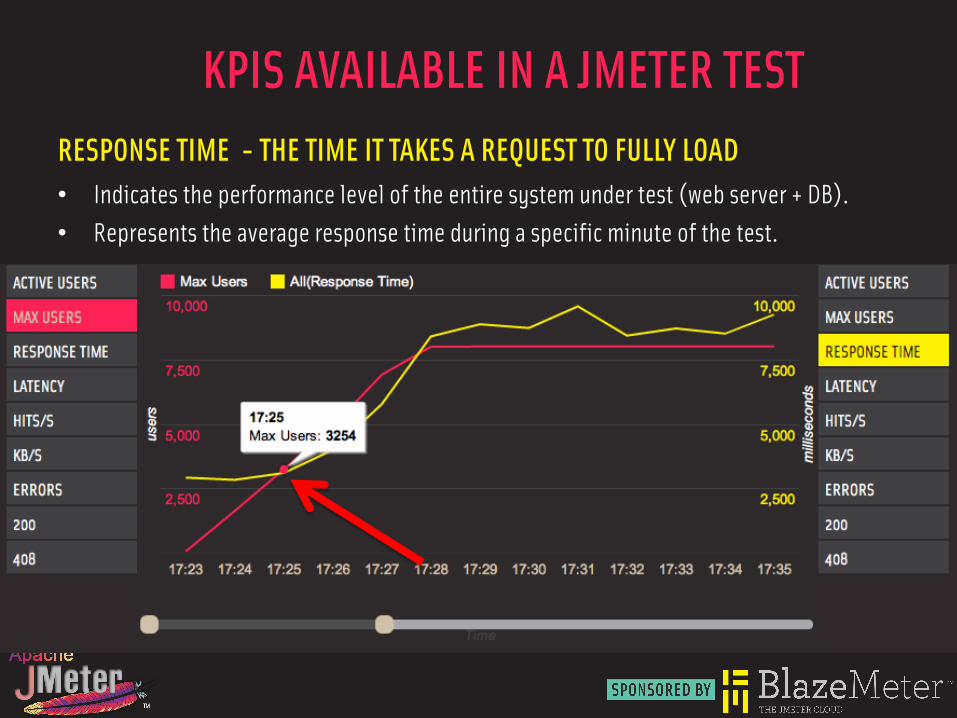
KPIS AVAILABLE IN A JMETER TEST RESPONSE TIME - THE TIME IT TAKES A REQUEST TO FULLY LOAD • Indicates the performance level of the entire system under test (web server + DB). • Represents the average response time during a specific minute of the test.
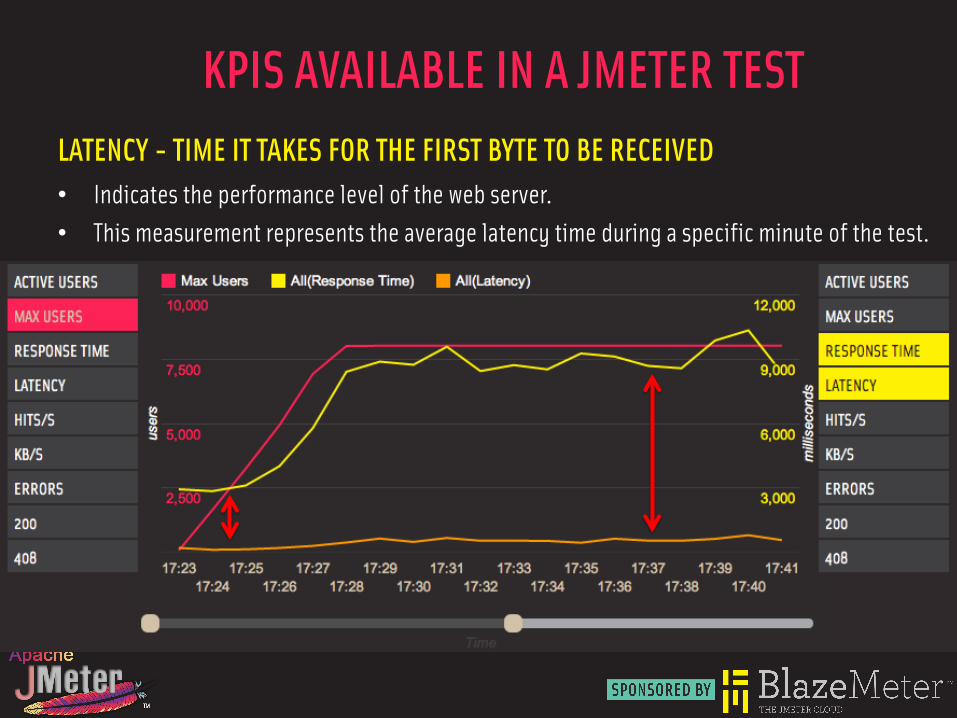
KPIS AVAILABLE IN A JMETER TEST LATENCY - TIME IT TAKES FOR THE FIRST BYTE TO BE RECEIVED • Indicates the performance level of the web server. • This measurement represents the average latency time during a specific minute of the test.
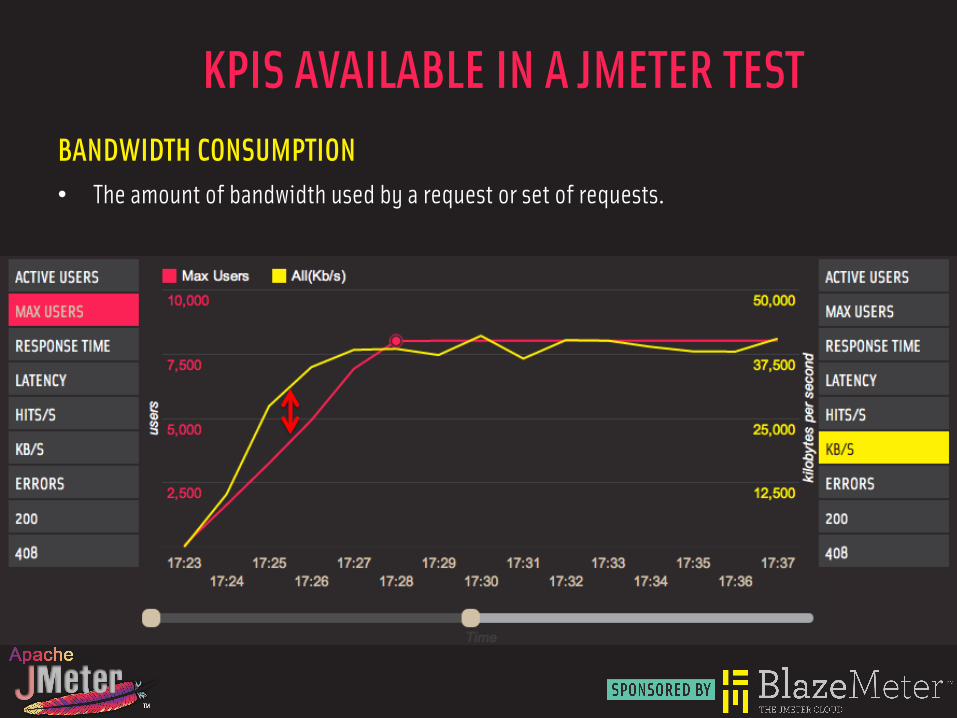
KPIS AVAILABLE IN A JMETER TEST BANDWIDTH CONSUMPTION • The amount of bandwidth used by a request or set of requests.
JMETER BEST PRACTICES AVOID INTERNAL BOTTLENECKS – ACCEPT JMETER LIMITATIONS • The number of threads depends on script intensity and complexity. – Usually less than 300
• A test always needs a tune-up. – Don’t expect to script and run on the first try
• Don’t hit your website with everything you’ve got. • Scale slowly and find bottlenecks and sensitivity points. • Remember that the console is a bottleneck. • Record, clean, parameterize and debug. • It’s hard to debug large scale tests. Debug locally.
Q & A OPEN DISCUSSION