welcome to the arthur j. gallagher & co. - iis windows...
TRANSCRIPT

Welcome to the Arthur J. Gallagher & Co.
Welcome to the Arthur J. Gallagher & Co.
2008 Annual Stockholders’ MeetingTuesday, May 13, 2008

2
Please turn off all cell phones and PDAs at this time.
Thank you for your cooperation.
Please turn off all cell phones and PDAs at this time.
Thank you for your cooperation.

3
Stockholders’ MeetingStockholders’ Meeting
•Formal Annual Meeting
•Financial Results – 2007
•10-Year Review
•Financial Results – 1st Quarter 2008
•Segment Highlights
•Questions & Answers
May 13, 2008

4
New FacesNew Faces
2007• Walter D. Bay hired as Corporate Vice President,
General Counsel and Secretary• April Hanes-Dowd hired as Assistant Vice President
and Assistant Secretary
2008• Norman L. Rosenthal, Ph.D., elected to
Board of Directors

5
Board of DirectorsBoard of Directors
• William L. Bax• T. Kimball Brooker, Ph.D.• Ilene S. Gordon• Elbert O. Hand• David S. Johnson • Kay W. McCurdy• Norman L. Rosenthal, Ph.D.• James R. Wimmer
Past CEO A. James Gallagher, Jr.

6
Board of DirectorsBoard of Directors
2008
•Gary P. Coughlan– Appointed September 2000– Chaired Audit Committee
Retiring

7
Formal Annual Meeting

8
Stockholders’ MeetingStockholders’ Meeting
•Formal Annual Meeting
•Financial Results – 2007
May 13, 2008
9
Safe Harbor Statement Under thePrivate Securities Litigation Reform Act of 1995
Safe Harbor Statement Under thePrivate Securities Litigation Reform Act of 1995
Except for the historical information and discussions, certain statements contained herein relating to future results may constitute “forward-looking statements” within the meaning of the Private Securities Litigation Reform Act of 1995. These statements involve a number of risks, uncertainties and other factors that could cause actual results to differ materially from those expected, as discussed in Gallagher’s filings with the U.S. Securities and Exchange Commission, including but not limited to the following: Gallagher’s commission revenues are highly dependent on premiums charged by insurers, which are subject to fluctuation; lower interest rates reduce Gallagher’s income earned on invested funds; alternative insurance markets continue to grow which could unfavorably impact commission and favorably impact fee revenue, though not necessarily to the same extent; Gallagher’s revenues vary significantly from period-to-period as a result of the timing of policy inception dates and the net effect of new and lost business production; the insurance brokerage industry is subject to a great deal of uncertainty due to investigations into its business practices by various governmental authorities and related private litigation; the general level of economic activity can have a substantial impact on Gallagher’s renewal business; Gallagher’s operating results, returns on investments and financial position may be adversely impacted by exposure to various market risks such as interest rates, equity pricing, foreign exchange rates and the competitive environment; Gallagher’s revenues and net earnings will continue to be subject to reduction due to the elimination of certain contingent commission arrangements on January 1, 2005 and related developments in the insurance industry; and Gallagher’s effective income tax rate may be subject to increase as a result of changes in income tax laws, unfavorable interpretations of past, current or future tax laws or developments resulting in the loss or unavailability of IRC Section 29-related Syn/Coal tax credits. Gallagher’s ability to grow has been enhanced through acquisitions, which may or may not be available on acceptable terms in the future and which, if consummated, may or may not be advantageous to Gallagher. Accordingly, actual results may differ materially from those set forth in the forward-looking statements. For a further discussion of certain of the matters described above see Item 1A, “Risk Factors” in Gallagher’s Annual Report on Form 10K for the year ended December 31, 2007.

10
Certain Non-GAAP Financial MeasuresCertain Non-GAAP Financial MeasuresThis presentation includes certain information that may be considered “non-GAAP financial measures” within the meaning of SEC regulations because it is derived from Gallagher’s consolidated financial information but is not required to be presented in financial statements that are prepared in conformity with U.S. generally accepted accounting principles (GAAP). Consistent with SEC regulations, a description of such information is provided below and a reconciliation of certain of such items to GAAP is provided on our web-site at www.ajg.com.
Pretax earnings from continuing operations for 2006 and 2005 were adjusted in this presentation to add back charges related to litigation and contingent commission matters and claims handling obligations and to eliminate the impact of medical and pension plan changes. Charges in 2006 related to retail contingent commission related matters and medical plan changes totaled $9.0 million (or $5.4 million after tax) and $7.5 million (or $4.5 million after tax), respectively. Charges in 2005 related to retail contingent commission matters and claims handling obligations totaled $73.6 million (or $44.2 million after tax) and $5.2 million (or $3.6 million after tax), respectively. In addition, Gallagher recognized a pension curtailment gain of $10.0 million (or $6.0 million after tax) in 2005. There were no such charges or gains in 2001 to 2004. These adjustments, which Gallagher believes are for non-recurring items, were made to GAAP earnings from continuing operations in 2006 and 2005 in order to calculate earnings from continuing operations before litigation and contingent commission related matters, claims handling obligations and medical and pension plan changes. In addition, total revenues and pretax earnings from continuing operations exclude retail contingent commissions and are on an as originally reported basis for all periods presented in this presentation. The term EBITDA used herein represents pretax earnings from continuing operations (excluding the impact of the non-recurring items discussed above and retail contingent commissions) before interest, depreciation and amortization expenses.
Gallagher believes the “non-GAAP financial measures” included in this presentation provide meaningful additional information, which may be helpful to investors in assessing certain aspects of Gallagher's operating performance and financial condition that may not be otherwise apparent from GAAP. Industry peers provide similar supplemental information, although they may not use the same or comparable terminology and may not make identical adjustments. This non-GAAP information should be used in addition to, but not as a substitute for, the GAAP information.
11
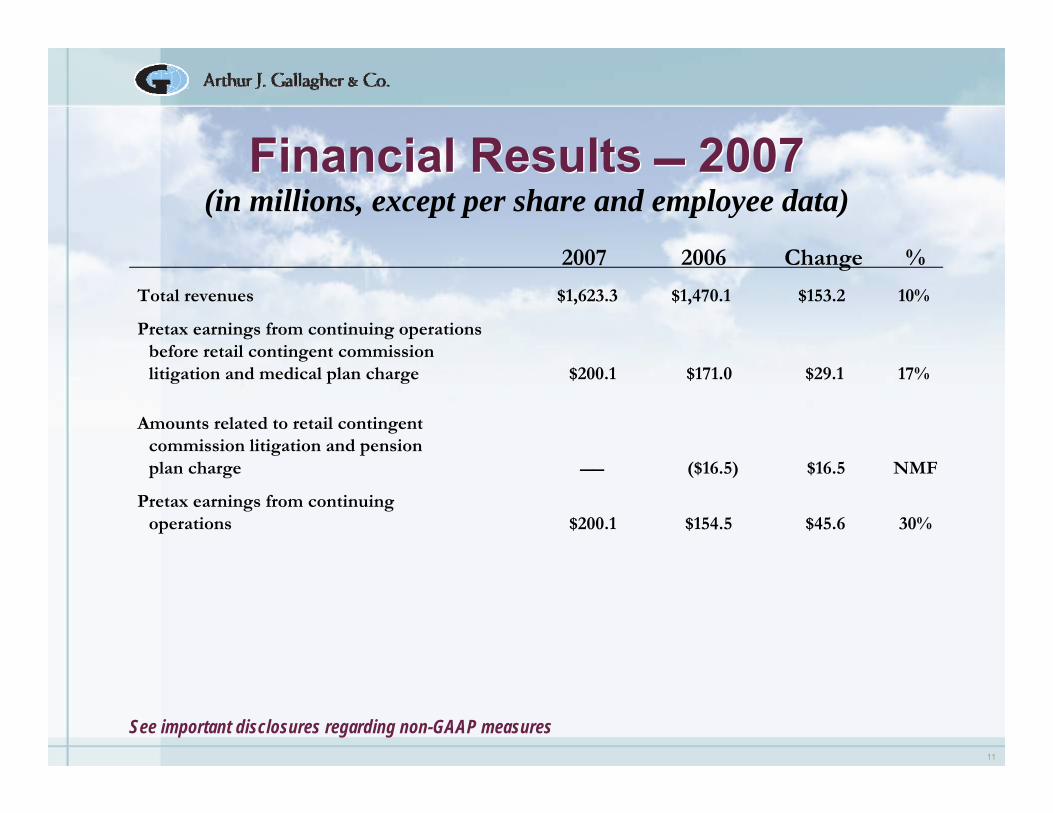
Financial Results 2007Financial Results 2007(in millions, except per share and employee data)
See important disclosures regarding non-GAAP measures
Total revenues $1,623.3 $1,470.1 $153.2 10%
Pretax earnings from continuing operations before retail contingent commission litigation and medical plan charge $200.1 $171.0 $29.1 17%
2007 2006 Change %
Amounts related to retail contingent commission litigation and pension plan charge ($16.5) $16.5 NMF
Pretax earnings from continuing operations $200.1 $154.5 $45.6 30%

12
Financial Results 2007Financial Results 2007(in millions, except per share and employee data)
2007 2006 Change %
Earnings from continuing operations $154.6 $128.4 $26.2 20%
Earnings (loss) from discontinued operations ($15.8) $0.1 ($15.9) NMF
Net earnings $138.8 $128.5 $10.3 8%
Diluted earnings from continuing operations per share $1.59 $1.31 $.28 21%
Diluted net earnings per share $1.43 $1.31 $.12 9%
Dividends per share $1.24 $1.20 $.04 3%
Number of employees from continuing operations at year-end 9,102 8,533 569 7%
Total revenues per employee $178,000 $172,000 $6,000 3%
Return on beginning stockholders’ equity 16% 17% (1%) NMF
See important disclosures regarding non-GAAP measures

13
Financial Results 2007Brokerage & Risk ManagementFinancial Results 2007Brokerage & Risk Management
(in millions, except per share and employee data)
*Before retail contingent commission litigation and medical plan chargeSee important disclosures regarding non-GAAP measures
Total revenues $1,557.7 $1,408.1 $149.6 11%
Pretax earnings from continuing operations $247.5 $228.5 $19.0 8%
2007 2006* Change %
Earnings from continuing operations $151.9 $134.6 $17.3 13%
Diluted earnings from continuing operations per share $1.56 $1.37 $.19 14%
Number of employees from continuing operations at year-end 9,102 8,533 569 7%
Total revenues per employee $171,000 $165,000 $6,000 4%
14
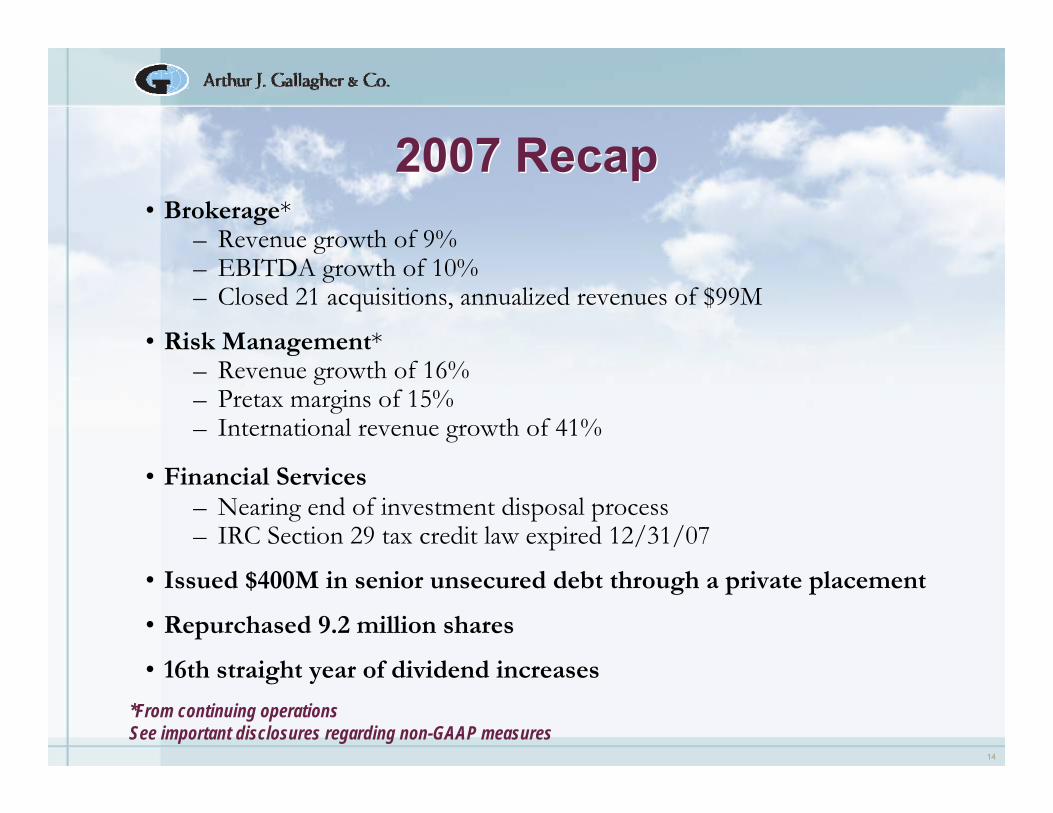
2007 Recap2007 Recap• Brokerage*
– Revenue growth of 9% – EBITDA growth of 10%– Closed 21 acquisitions, annualized revenues of $99M
• Risk Management*– Revenue growth of 16% – Pretax margins of 15%– International revenue growth of 41%
• Financial Services– Nearing end of investment disposal process– IRC Section 29 tax credit law expired 12/31/07
• Issued $400M in senior unsecured debt through a private placement
• Repurchased 9.2 million shares
• 16th straight year of dividend increases
*From continuing operationsSee important disclosures regarding non-GAAP measures

15
Companywide, we produced approximately $208 million,
excluding acquisitions, in new business in 2007!
Companywide, we produced approximately $208 million,
excluding acquisitions, in new business in 2007!

16
Our Five Dominant PrioritiesOur Five Dominant Priorities
• Increase our organic growth rate
•Align sales and service deliverables with pay
•Increase productivity/increase margins
•Hire and retain the right people
•Continue to acquire the best businesses in our industry
17
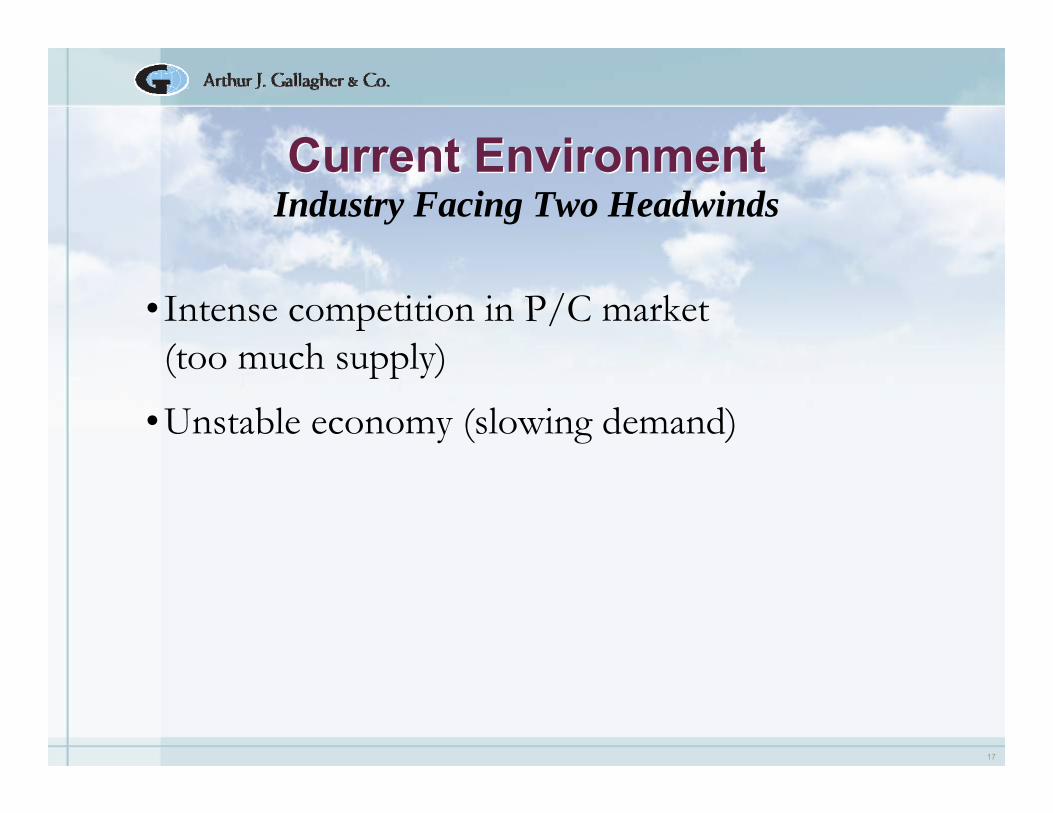
Current EnvironmentCurrent Environment
• Intense competition in P/C market (too much supply)
•Unstable economy (slowing demand)
Industry Facing Two Headwinds
18
Intense Competition in P/C MarketIntense Competition in P/C Market• In 2007, U.S. P/C industry experienced its first decline
in net premiums written since 1943A.M. Best Co., April 2008
• Average commercial premium down 13.5% in 1st Quarter 2008CIAB Quarterly Market Report, April 2008

19
Unstable EconomyUnstable Economy
• Recession Is Here, Economist Declares Boston Globe, March 15• Chaos on Wall Street CNNMoney.com, March 31• The Last Days of Bear Stearns Fortune, April 14• Delta, Northwest Lose Combined $10.5B on High Fuel, Charges
AP, April 24• S&P Sees Increased Chance of U.S. Bank Downgrades
Financial Week, April 28• Consumer Confidence Drops in April on Inflation, Job Worries
AP, April 29• GM Loses $3.3 Billion in 1st Quarter, Lowers Sales Outlook
AP, April 30
Recent Headlines
We have faced challenging times before and grown through them.
20
Corporate Growth InitiativeCorporate Growth Initiative
•Hire
•Develop
•Acquire
Result: Sales Growth
21
Corporate Growth InitiativesCorporate Growth Initiatives
• New employee performance appraisal/goal-setting process• Aligns individual/team performance with Gallagher’s
Dominant Priorities• Launched in February, rolling out companywide in 2008• Classroom and/or online training for all
managers/employees• Gives employees greater voice in their career development
Performance-Driven Culture (PDC)

22
Corporate Growth InitiativesCorporate Growth Initiatives
•College Internship Program– 146 participants in 2007– Expect 160 in 2008
•Corporate Training– Classroom and online, instructor-led programs – Learning Management System: dramatically
expands employee training options and tracks programs completed
Training and Development
23
Corporate Growth InitiativesCorporate Growth Initiatives
•Completed a record 21 acquisitions in 2007, annualized revenues of $99M
•Completed 11 acquisitions in 1st Quarter 2008, annualized revenues of $31M
•Completed 3 acquisitions to-date in 2nd Quarter 2008
•Pipeline is at record levels
Acquisitions

24
Corporate Infrastructure InitiativesCorporate Infrastructure Initiatives
•Targeted headcount reduction of 400 support positions companywide through attrition by year-end 2008
•Centralized Systems– General ledger/accounts payable– Travel and expense program– Technology– HR– Real estate and planning
•Offshoring initiatives
Expense-saving Actions

25
Corporate Infrastructure InitiativesCorporate Infrastructure Initiatives
•Replatforming of data center, global network and corporate IT infrastructure nearing completion
•Enhances operating efficiencies, streamlines processes, and improves expense and human resource management worldwide
•Supports fast and stable workloads with offshore service centers
IT Platform Overhaul
26
Stockholders’ MeetingStockholders’ Meeting
•Formal Annual Meeting
•Financial Results – 2007
•10-Year Review
May 13, 2008

27
Total RevenuesTotal Revenues(in millions)
$603.3$603.3
1998 2007
$1,619.2UP 168%UP 168%
See important disclosures regarding non-GAAP measures

28
Pretax Earnings from Continuing OperationsPretax Earnings from Continuing OperationsBefore Retail Contingent Commission Matters (in millions)
$62.6$62.6
1998 2007
$204.2UP 226%UP 226%
See important disclosures regarding non-GAAP measures

29
Earnings from Continuing OperationsEarnings from Continuing OperationsBefore Retail Contingent Commission Matters (in millions)
$54.6$54.6
1998 2007
$152.1UP 179%UP 179%
See important disclosures regarding non-GAAP measures

30
Total Revenues Per EmployeeTotal Revenues Per Employee
$123,000$123,000
1998See important disclosures regarding non-GAAP measures
2007
$178,000UP 45%UP 45%

31
Annual Dividends Per ShareAnnual Dividends Per Share
$.35$.35
1998 2007
$1.24UP 254%UP 254%
32
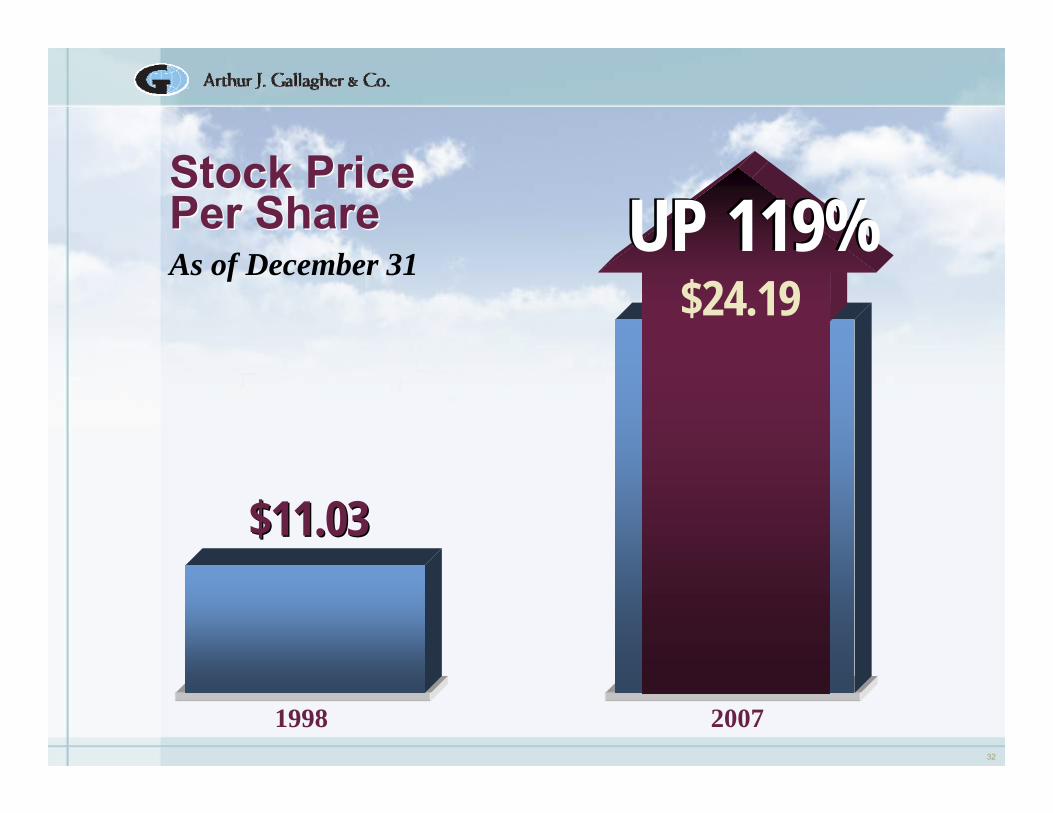
Stock Price Per ShareStock Price Per ShareAs of December 31
$11.03$11.03
1998 2007
$24.19UP 119%UP 119%

33
Total Returns with Dividends ReinvestedTotal Returns with Dividends ReinvestedAs of December 31
• CAGR of 14%
$1,000$1,000
1998 2007
$3,806UP 281%UP 281%

34
Company CapitalizationCompany CapitalizationAs of December 31
$779M$779M
1998 2007
$2.6BUP 234%UP 234%

35
Cash Flows from OperationsCash Flows from Operations• Cash flows from operations in 2007 exceeded $250M• “Free” cash flows used for acquisitions, stock repurchases
and dividends
$0
$50
$100
$150
$200
$250
$300
2004 2005 2006 2007
Cash Flow from Operations Summary(In millions)
Operating Cash Flows Dividends
See important disclosures regarding non-GAAP measures
Cash Flows from Operations Summary(in millions)

36
Uses of Cash – 2002 through 2007Uses of Cash – 2002 through 2007Uses of Cash as Reported (in millions)
$0
$50
$100
$150
$200
$250
$300
2002 2003 2004 2005 2006 2007
Cash Paid for Acquisitions (net of cash acquired) Dividends Paid Stock Repurchases

37
•Debt offering in 2007 changed the capital structure– Debt remains at a conservative level– Flexibility remains with $450M line of credit capacity
1.5 NADebt to EBITDA*
36%4%Debt to total capital (Debt/[Debt + Equity])92 98 Shares outstanding
716 864 Stockholders' equity
400 35 Total debt
20072006(in millions)December 31,
Capital StructureCapital Structure
See important disclosures regarding non-GAAP measures
38
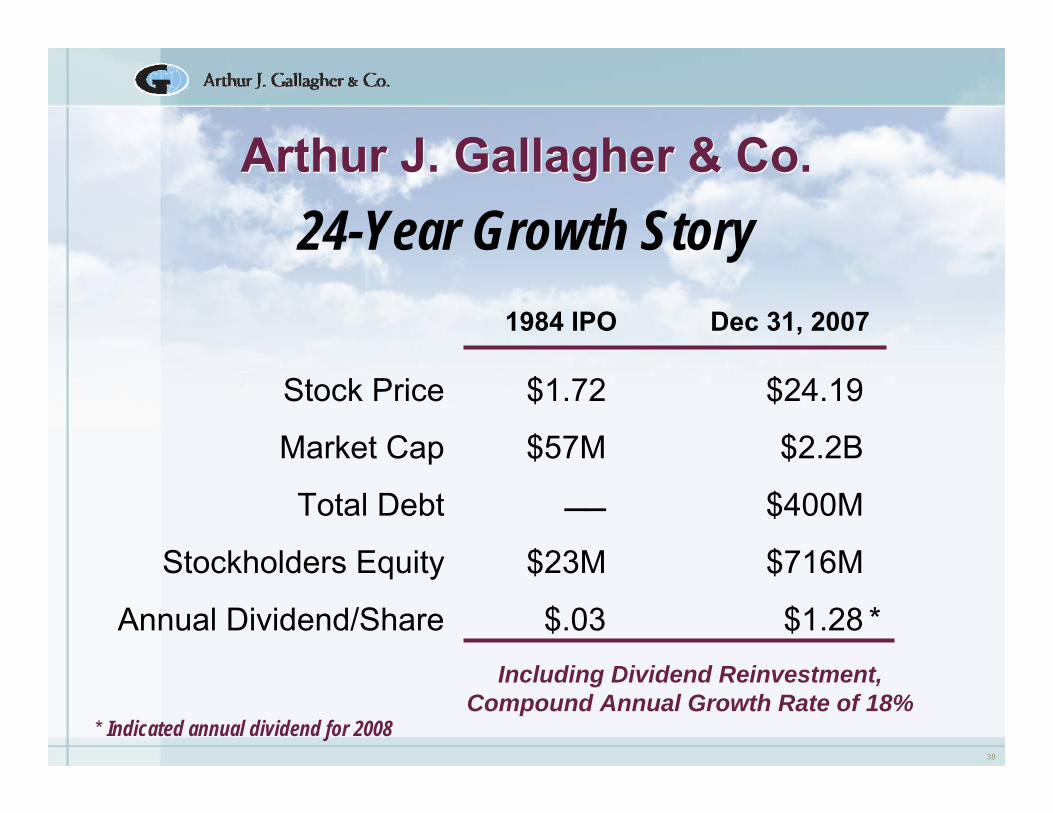
Stock Price $1.72 $24.19
Market Cap $57M $2.2B
Total Debt $400M
Stockholders Equity $23M $716M
Annual Dividend/Share $.03 $1.28 *Including Dividend Reinvestment,
Compound Annual Growth Rate of 18%
Dec 31, 20071984 IPO
Arthur J. Gallagher & Co.Arthur J. Gallagher & Co.
* Indicated annual dividend for 2008
24-Year Growth Story

39
Stockholders’ MeetingStockholders’ Meeting
•Formal Annual Meeting
•Financial Results – 2007
•10-Year Review
•Financial Results – 1st Quarter 2008
May 13, 2008

40
Financial Results 1st Quarter 2008Financial Results 1st Quarter 2008
Total revenues $375.8 $375.0 $0.8
(in millions, except per share data)
2008 2007 Change %
See important disclosures regarding non-GAAP measures
Earnings from continuing operations $16.3 $21.3 ($5.0) NMF
Diluted earnings from continuing operations per share $.18 $.21 ($.03) NMF
Diluted net earnings (loss) per share ($.07) $.20 ($.27) NMF
Dividends per share $.32 $.31 $.01 3%
Pretax earnings from continuing operations $26.9 $23.8 $3.1 13%
Provision for income taxes $10.6 $2.5 $8.1 NMF

41
Segment Results 1st Quarter 2008Segment Results 1st Quarter 2008
8%8%Pretax margin
12%12%EBITDA margin
13%$3.7 $28.5$32.2EBITDA
24%$.03 $.10$.13Earnings per share
10%$1.7$17.8$19.5Pretax earnings
11%$25.2$232.8$258.0Total revenues
%Change20072008
(17%)(3%)18%15%EBITDA margin
NMF(4%)16%12%Pretax margin
(14%)($2.7)$19.6$16.9EBITDA
NMF($.01)$.10$.09Earnings per share
(17%)($2.9)$16.7$13.8Pretax earnings
9%$9.4 $106.8$116.2Total revenues
%Change20072008
Brokerage Segment*
Risk Management Segment*
*From continuing operationsSee important disclosures regarding non-GAAP measures
(in millions, except per share data)

42
1st Quarter 2008 Overview1st Quarter 2008 Overview• Brokerage
– 1% organic revenue growth in a very soft market– Closed 11 acquisitions, annualized revenues of $31M– Revenue growth of 11% – EBITDA growth of 13%– EBITDA margin of 12%
• Risk Management – Revenue growth of 9%– International revenue growth of 24%– Pretax margin of 12%
• Overall effective tax rate of 39.4% for 1st Quarter 2008 vs 10.5% in 1st Quarter 2007
• January 2008 – increased dividend 3%

43
Discontinued OperationsDiscontinued Operations
•Decision made in December 2007
•Announced in January 2008
•Reclassified as discontinued operations in 4th Quarter 2007 earnings release
•All Gallagher Re sales are completed
Strategic Exit from Gallagher Re
44
Stockholders’ MeetingStockholders’ Meeting
•Formal Annual Meeting
•Financial Results – 2007
•10-Year Review
•Financial Results – 1st Quarter 2008
•Segment Highlights
May 13, 2008

45
Arthur J. Gallagher & Co.Arthur J. Gallagher & Co.
2007 Pretax Earnings*2007 Total Revenues*
*See important disclosures regarding non-GAAP measures
Brokerage 69%
Risk Management 27%Financial Services
4%
Risk Management 26%FinancialServices
Brokerage 74%
Two Core Businesses

46
Brokerage Segment Business Mix Brokerage Segment Business Mix 2007 Revenues
Retail 80% Mostly North America
Wholesale 20%Mostly U.S. and U.K.
See important disclosures regarding non-GAAP measures

47
$753
$1,110
0200400600800
1,0001,2001,400
2003 2007
$154
$224
0
50
100
150
200
250
2003 2007
Brokerage SegmentBrokerage Segment
•2007 EBITDA margin of 20%
Total Revenues* EBITDA*
*See important disclosures regarding non-GAAP measures
11% CAGR12% CAGR
(in millions)
48
Brokerage SegmentBrokerage Segment
• Rapidly Expand – Domestic– Geographical– Expertise
• Selectively Expand – International– Broaden Network Partners– Targeted Acquisitions
• Profitability – Stay in Our Sweet Spot– Middle to Upper Commercial Market
Strategy
49
Retail P/C AcquisitionsRetail P/C Acquisitions2007• InterNational Insurance Group, Ltd.• Fishermans Insurance Services, Inc.• Lowndes Lambert Group Canada, Ltd. • Melton Insurance Associates, Inc.• Tropp & Company• Woods & Grooms, Inc.• Carpenter, Cammack & Associates, Inc.• Spanjers Insurance Agency, Inc.• Cedar Hill Insurance Agency, Inc.• Powell Insurance Agency, Inc.• Koster Insurance Agency, Inc.
2008• Crist Elliott Machette Insurance Services, Inc.• Petty Burton Associates, Inc.• The Splinter Group, Inc.• Healthcare Risk Solutions, LLC• Specialty Risk, Inc.
50
Retail Employee BenefitsRetail Employee Benefits
• Employee Benefits Brokerage/Consulting• Actuarial Services/Predictive Modeling• Healthcare Data Analysis and Claims Benchmarking• Pharmacy/Rx Consulting Services• Legislative Compliance Support• Employee Communications Tools/Resources• Executive Benefits/Financial Planning• Human Resources Consulting Services• Compensation Program Design/Analysis• Retirement Plan Services• International Benefits Resources
Capabilities

51
2007• Financial Profiles, Inc.• Elite Benefits Insurance Marketing Services, Inc.• The Producer’s Choice, Inc.• Strategic Health Plans Corporation• BIS Insurance Services, Inc.• C&B Consulting Group, Inc.• Intermountain Financial Benefits
Retail Employee Benefits AcquisitionsRetail Employee Benefits Acquisitions
2008• Yanni Partners, Inc.• The Commonwealth Consulting Group, Inc.• Doeren Mayhew Risk Management, LLC• Taylor Benefits• Bankers Financial Benefits• Providium Consulting Group, LLC• Life Insurance Strategies• RSI

52
WholesaleWholesale
•U.S. wholesale operation 5th-largest wholesale insurance broker in 2007, according to Business Insurance magazine
•Fastest-growing Lloyd’s of London wholesaler (5 years)

53
Wholesale AcquisitionsWholesale Acquisitions
2007• ISG International, Inc.• Robert A. Schneider Agency, Inc.• AVRECO
2008• Leicht General Agency

54
International Strategic Alliance NetworkInternational Strategic Alliance Network
• Non-owned network of leading independent brokers– Offers flexibility in choosing best broker for client– Account can be moved if not handled properly
• More than 100 countries around the world
• Combined with Gallagher offices, provides comprehensive, worldwide sales and service network

55
Risk Management SegmentRisk Management Segment
• Revenue growth is all organic
• Targeting Fortune 1000 companies; standard platform also enables profitable service to much smaller accounts
• Differentiate through client intimacy, commitment to quality and technology
• International presence largely public entity; leveraging U.S. expertise to penetrate commercial clients
World’s Largest P/C Claims Administrator*
*In 2007, according to Business Insurance magazine
56
Risk Management SegmentRisk Management Segment
• A growing company has needs that can often best be met in alternative markets
• We can tailor service to clients’ needs
• Include on-site when appropriate
• Hard markets accelerate the drive to alternative markets
• Soft market has slowed pace, but opportunities still exist
Unbundling Trend

57
Risk Management SegmentRisk Management Segment
• Real-Time Claims Reporting
• Recoveries (subrogation, salvage, etc.)
• Appraisal Services
• Litigation Management
• Information Management
• Managed Care Services
• Loss Control Services
• Safety Programs
• Settlement Management
• Education and Training
Capabilities

58
Risk Management SegmentRisk Management Segment
$292
$444
$0
$100
$200
$300
$400
$500
2003 2007Total Revenues*
*See important disclosures regarding non-GAAP measures
12% CAGR
(in millions)
$49
$76
$0
$20
$40
$60
$80
$100
2003 2007EBITDA*
15% CAGR
•2007 EBITDA margin of 17%

59
Arthur J. Gallagher & Co.Arthur J. Gallagher & Co.
A Growth Company

60
Brokerage & Risk Management Brokerage & Risk Management
$1,045$1,175
$1,288$1,406
$1,554
$400
$600
$800
$1,000
$1,200
$1,400
$1,600
2003 2004 2005 2006 2007
11% CAGR(in millions)
* See important disclosures regarding non-GAAP measures
Total Revenues from Continuing Operations*

61
$175
$208 $199$226
$244
$50
$100
$150
$200
$250
$300
2003 2004 2005 2006 2007
12% CAGR
Brokerage & Risk Management Brokerage & Risk Management
* See important disclosures regarding non-GAAP measures
Pretax Earnings from Continuing Operations*
(in millions)

62
$203
$244 $237$271
$300
$50
$100
$150
$200
$250
$300
$350
2003 2004 2005 2006 2007
13% CAGR
* See important disclosures regarding non-GAAP measures
Brokerage & Risk Management Brokerage & Risk Management EBITDA*
(in millions)

63
$0.00
$0.20
$0.40
$0.60
$0.80
$1.00
$1.20
$1.40
Dividends Per ShareDividends Per Share(restated for stock splits)
* Indicated annual dividend for 2008
18% Average Annual Increase
1986 2008
$1.28*

64
Our Goals Are SimpleOur Goals Are Simple
•Target revenue and EBITDA growth of 15%/YR
•Push Brokerage and Risk Management margins to 20%
•Control share count growth
•Return cash to shareholders

65
Here’s How We Are Going to WinHere’s How We Are Going to Win
• Increase our organic growth rate
•Align sales and service deliverables with pay
•Increase productivity/increase margins
•Hire and retain the right people
•Continue to acquire the best businesses in our industry
Our Five Dominant Priorities
Result: Stock Price Growth
66
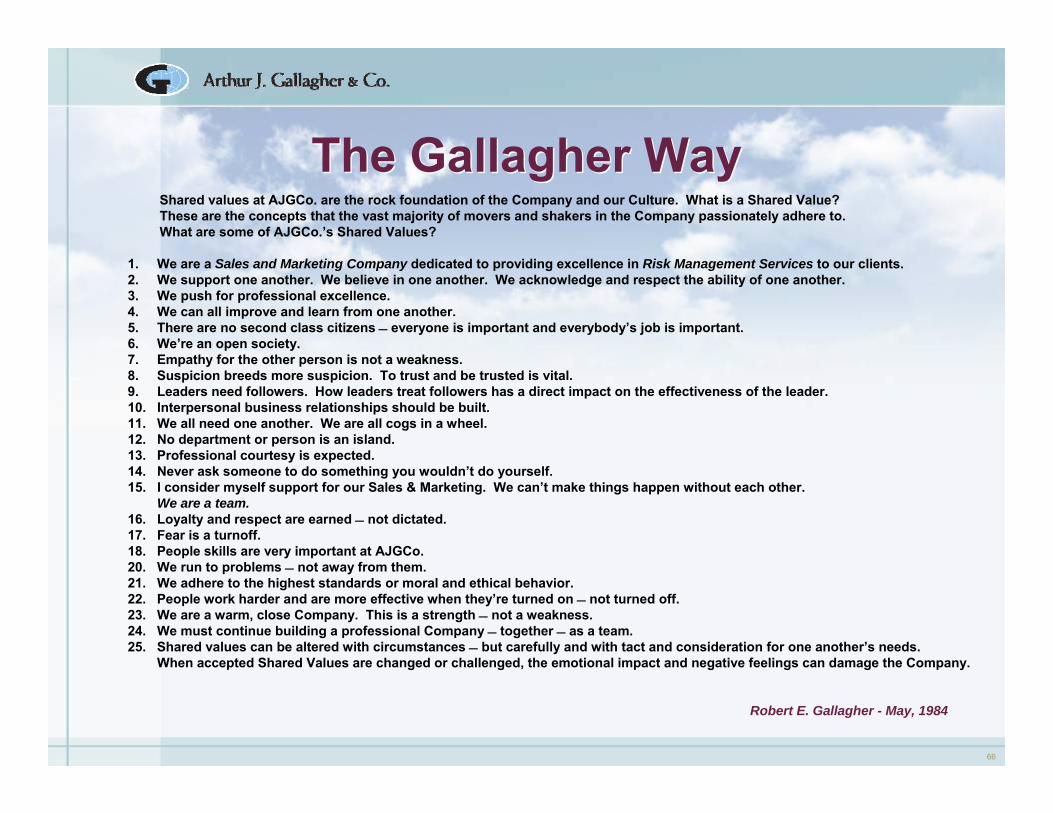
The Gallagher WayThe Gallagher Way
1. We are a Sales and Marketing Company dedicated to providing excellence in Risk Management Services to our clients.2. We support one another. We believe in one another. We acknowledge and respect the ability of one another.3. We push for professional excellence.4. We can all improve and learn from one another.5. There are no second class citizens everyone is important and everybody’s job is important.6. We’re an open society.7. Empathy for the other person is not a weakness.8. Suspicion breeds more suspicion. To trust and be trusted is vital.9. Leaders need followers. How leaders treat followers has a direct impact on the effectiveness of the leader.10. Interpersonal business relationships should be built.11. We all need one another. We are all cogs in a wheel.12. No department or person is an island.13. Professional courtesy is expected.14. Never ask someone to do something you wouldn’t do yourself.15. I consider myself support for our Sales & Marketing. We can’t make things happen without each other.
We are a team.16. Loyalty and respect are earned not dictated.17. Fear is a turnoff.18. People skills are very important at AJGCo.20. We run to problems not away from them.21. We adhere to the highest standards or moral and ethical behavior.22. People work harder and are more effective when they’re turned on not turned off.23. We are a warm, close Company. This is a strength not a weakness.24. We must continue building a professional Company together as a team.25. Shared values can be altered with circumstances but carefully and with tact and consideration for one another’s needs.
When accepted Shared Values are changed or challenged, the emotional impact and negative feelings can damage the Company.
Shared values at AJGCo. are the rock foundation of the Company and our Culture. What is a Shared Value?These are the concepts that the vast majority of movers and shakers in the Company passionately adhere to.What are some of AJGCo.’s Shared Values?
Robert E. Gallagher - May, 1984

67
Questions & AnswersQuestions & Answers
2008 Annual Stockholders’ MeetingTuesday, May 13, 2008