welcome to northwest! your state arboretum
DESCRIPTION
Welcome to Northwest! Your State Arboretum. Missouri Comprehensive State Energy Plan, Public Meeting #5 Student Union Ballroom October 23, 2014. Northwest, Big Picture. Performance Key metrics/comparatives Progress Deep and significant partnerships Overall improvements Plans - PowerPoint PPT PresentationTRANSCRIPT

Welcome to Northwest!
Your State Arboretum
Missouri Comprehensive State Energy Plan, Public Meeting #5 Student Union Ballroom
October 23, 2014
Northwest, Big Picture Performance
Key metrics/comparatives
Progress Deep and significant
partnerships Overall improvements
Plans Strategic Plan implementation Comprehensive Campaign

Northwest Missouri State University’s
Approach to Energy and Sustainability

Overview Missouri’s unique position
Demand side management opportunities
Utilizing alternative energy at Northwest
Energy conservation at Northwest

National Energy Trend
1980 1985 1990 1995 2000 2005 2010 20150
2000
4000
6000
8000
10000
12000
14000
16000
United States Energy Intensity - Total Primary Energy Consumption per Dollar of GDP
Btu per Year 2005 U.S. Dollars (Market Exchange Rates)
Year Energy Intensity
1980 13,381 Btu/$
2011 7,328 Btu/$
• Energy prices
• Technology Generation Distribution End Use

Missouri’s Energy Profile
Missouri electricity rates have increased 31% vs. 3.5% for USA (2008-2013)
Missouri electricity expense has increased $1.5B or 28% vs. 2.5% for USA
(2008-2013)
879,3771,064,503
USA coal consumption has decreased 17.4% vs. 1.5% increase
for Missouri (2008-2013)

Missouri’s Energy Profile

Costs: New Capacity vs. Conservation

Costs: New Capacity vs. ConservationIf our current level of DSM is less than ideal, what are the obstacles to optimization?
i) Lack of incentives for operational changes
(1)Temperature and pressure resets. Reviewing sequences, schedules, economizer operation, sensor calibration.
(2)Cost-effective measures with low capital costs and fast ROIs overlooked.
ii) Products
(1)Magic power factor correctors, “efficient” resistant heaters / extraordinary claims muddy the waters for facility operators.
(2) What are the new products? Cutting edge? Tried and true?
iii) Incentives
(1)MEEIA (Missouri Energy Efficiency Investment Act) provides the mechanism for recovery but fails to ensure the most cost-effective level of investment.
(2)Align programs to utilities’ and users’ interests.
(3)Expanded incentives for custom and prescriptive measures but sparse for energy management / energy audits.
iv) Project financing
(1) Cost of capital difference
(2) Lease arrangements
(3) Building turnover

DSM Program Spending
Per capita spending on energy efficiency programs by state

Northwest Fast Facts Student population: ~ 6,800 Gross square feet: ~ 2.2 million Total utility spend: ~ $3.5 million EUI (kBTU/ft2) ~ 132 Campus electricity: ~ 7 MW peak
~28,000 MWh/year Distribution: Most buildings on central
chilled water/steam plant

Northwest’s Alt Energy History
Wood Chips Brought Online 1981

Northwest’s Alt Energy History
Wood Boiler

Northwest’s Alt Energy History
Paper Pellets Brought Online 1992

Northwest’s Alt Energy History
Paper Pellets Brought Online 1992

Northwest’s Alt Energy History
Waste to Energy, 1998 and Process Patent, 2000

Northwest’s Alt Energy History
Pyrolysis Oil, 2010 and High Efficiency Burner, 2014

Northwest’s Alternative Energy Savings
96/9
797
/98
98/9
999
/00
00/0
1
01
/ 02
02/0
303
/04
04/0
5
05 /0
6$0
$200,000
$400,000
$600,000
$800,000
$1,000,000
$1,200,000
$1,400,000
$1,600,000
$1,800,000
0%
10%
20%
30%
40%
50%
60%
70%
SAVINGS PERCENTAGE SAVINGS
PREVENTED COSTS FROM USE OF ALTERNATIVE FUEL

Northwest’s Alternative Energy Savings
2008
-200
9
2009
-201
0
2010
-201
1
2011
-201
2
2012
-201
3
2013
-201
4
2014
-201
5( y
td)
$0
$100,000
$200,000
$300,000
$400,000
$500,000
$600,000
$700,000
0%
5%
10%
15%
20%
25%
30%
35%
40%
45%
PREVENTED COSTS FROM USE OF ALTERNATIVE FUEL (con-tinued)
PREVENTED COST
PERCENTAGE SAVINGS

Northwest’s Alt Energy Program
100 year-old building 50 year-old boiler(s) Power Plant = same location as
1905 Campus expansion Campus changes Location, location, location
Significant need for re-investment
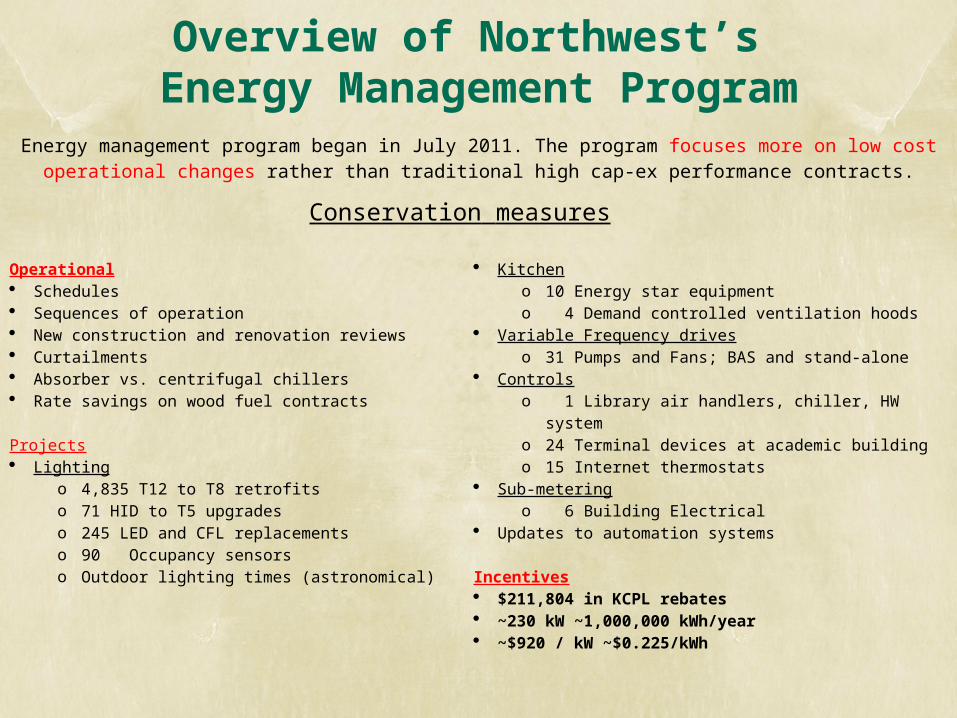
Overview of Northwest’s Energy Management Program
Energy management program began in July 2011. The program focuses more on low cost operational changes rather than traditional high cap-ex performance contracts.
Conservation measures
Operational Schedules Sequences of operation New construction and renovation reviews Curtailments Absorber vs. centrifugal chillers Rate savings on wood fuel contracts
Projects Lighting
o 4,835 T12 to T8 retrofitso 71 HID to T5 upgradeso 245 LED and CFL replacementso 90 Occupancy sensorso Outdoor lighting times (astronomical)
Kitchen
o 10 Energy star equipmento 4 Demand controlled ventilation hoods
Variable Frequency driveso 31 Pumps and Fans; BAS and stand-alone
Controlso 1 Library air handlers, chiller, HW systemo 24 Terminal devices at academic buildingo 15 Internet thermostats
Sub-meteringo 6 Building Electrical
Updates to automation systems
Incentives $211,804 in KCPL rebates ~230 kW ~1,000,000 kWh/year ~$920 / kW ~$0.225/kWh

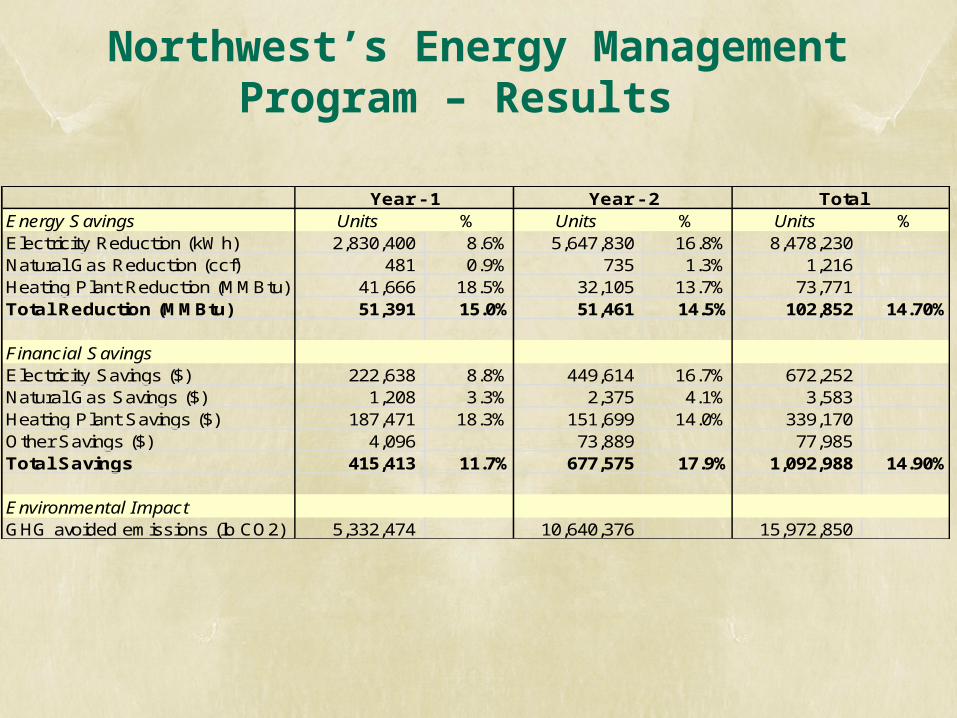
Northwest’s Energy Management Program – Results

Northwest’s Energy Management Program – Results
2011 2012 2013 2014 20150
1000
2000
3000
4000
5000
6000
5085 50514736
45404328
Main Meter Peak Summer Demand
Fiscal Year
kilo
watt
s
Northwest’s Energy Management Program – Results
Energy Savings Units % Units % Units %Electricity Reduction (kWh) 2,830,400 8.6% 5,647,830 16.8% 8,478,230 Natural Gas Reduction (ccf) 481 0.9% 735 1.3% 1,216 Heating Plant Reduction (MMBtu) 41,666 18.5% 32,105 13.7% 73,771 Total Reduction (MMBtu) 51,391 15.0% 51,461 14.5% 102,852 14.70%
Financial SavingsElectricity Savings ($) 222,638 8.8% 449,614 16.7% 672,252 Natural Gas Savings ($) 1,208 3.3% 2,375 4.1% 3,583 Heating Plant Savings ($) 187,471 18.3% 151,699 14.0% 339,170 Other Savings ($) 4,096 73,889 77,985 Total Savings 415,413 11.7% 677,575 17.9% 1,092,988 14.90%
Environmental ImpactGHG avoided emissions (lb CO2) 5,332,474 10,640,376 15,972,850
Year - 1 TotalYear - 2

Northwest’s Energy Management Program – Results
July Aug Sept Oct Nov Dec Jan Feb Mar April May June
-5.0%
0.0%
5.0%
10.0%
15.0%
20.0%
25.0%
30.0%
35.0%
-1.8
%
15.1
%
9.3%
-0.5
%
9.8%
22.3
%
13.8
%
6.3%
5.3%
13.3
%
27.2
%
19.7
%
27.0
%
24.8
%
16.0
%
8.3%
14.4
%
17.3
%
11.7
%
7.5% 10
.3%
25.5
%
33.7
%
21.1
%
Financial Savings
FY 2013 FY 2014

Northwest’s Energy Management Program – Results

Northwest’s Energy Management Program – Results
Electricity; 95639.604776;
27%
Gas - Other; 5620.584552; 2%
Gas - Main; 26353.93; 7%
Pellet; 13370.705; 4%
Wood; 162961.708; 46%
Reduction; 51455.255381198
5; 14%
FY14 Performance (303,950 MMBtu)

Takeaways
Northwest: High-performing Significant progress Executing plans
Long history and savings from alternative energy approach
Significant performance in energy conservation
Northwest is and can serve as a role model across the state

Thank You!
Dr. John Jasinski
President
660-562-1110
Dan Boyt
Energy Manager
660-562-1182
James Teaney
Power Plant & Transportation Manager
660-562-1186