welcome to journal of theoretical and applied information … · 2015-02-24 · dr. muhammad umer...
TRANSCRIPT
Home
Volumes
Submit Paper
ManuscriptStatusAuthorGuidelinesEditorial Board
TechnicalBoardIndexing andAbstractingSubscribe toJATITContact Us
FeedBack | Links | Contact Us | Site Map
Welcome to Journal of Theoretical and Applied Information Technology
Editorial Board
EDITOR IN CHIEFProf. Niaz AhmadFCE, MOE, Islamabad, PAKISTAN
EDITORIAL BOARD
Dr. CHRISTEL BAIER Faculty of Computer Science, Institute for Theoretical ComputerScience, Technical University Dresden, GERMANY.
Dr. YUSUF PISAN Department of Software Engineering, Faculty of InformationTechnology, University of Technology, Sydney, AUSTRALIA.
Dr. YUXIN MAOSchool Of Computer & Information Engineering Zhejiang GongshangUniversity, CHINA
Dr. MUHAMMAD SHERFaculty of Basic and Applied Sciences, Department of ComputerScience, International Islamic University, Islamabad. PAKISTAN.
Dr. ZARINA SHUKUR Computer Science Dept., Fakulti Teknologi dan Sains Maklumat,University Kebangsaan Malaysia, 43600 Bangi, MALAYSIA.
Dr. NOR AZAN MAT ZIN Department of Information Science, Faculty of Information Science &Technology, National University of Malaysia (UKM) 43600 UKM BANGI,MALAYSIA.
Dr. KHAIRUDDIN BIN OMAR Faculty of Information Science and Technology, Universiti KebangsaanMalysia, 43600 Bangi Selangor Darul-Ehsan, MALYSIA.
Dr. TENGKU MOHD. BIN TENGKU SEMBOKFaculty of Information Science and Technology Universiti Kebangsaan,Malaysia, 43600 Bangi Selangor Darul-Ehsan, MALYSIA.
Dr PRABHAT K. MAHANTIDepartment of Computer Science and Applied Statistics (CSAS), HazenHall Room 311, University of New Brunswick, Saint John, NewBrunswick, CANADA.
Dr. R. PONALAGUSAMYDepartment of Mathematics, National Institute of Technology,Tiruchirappalli, Tamil Nadu, INDIA.

Dr. NITIN UPADHYAYComputer Science & Information Systems Group, Birla Institute ofTechnology and Science (BITS), Pilani-Goa Campus, NH-17B BypassRoad, ZuariNagar, Goa, INDIA.
Dr. A. SERMET ANAGNEskisehir Osmangazi University, Industrial Engineering Department,Bademlik Campus, 26030 Eskisehir, TURKEY.
Dr. YACINE LAFIFIDepartment of Computer Science, University of Guelma, BP 401,Guelma 24000, ALGERIA.
Dr. CHRISTOS GRECOSSchool of Computing, Engineering and Physical Sciences, University ofCentral Lancashire, Preston PR1 2E, UNITED KINGDOM.
Dr. JAYANTHI RANJANInstitute of Management Technology, Raj Nagar, Ghaziabad, UttarPradesh, INDIA
Dr. ADEL M. ALIMINational Engineering School of Sfax (ENIS), University of SFAX,TUNISIA
Dr. SIKANDAR HAYAT KHIYALDepartment of Computer Science, Fatima Jinnah Women University,Rawalpindi, PAKISTAN
Dr. ADEL MERABETDepartment of Electrical & Computer Engineering, DalhousieUniversity, Halifax, CANADA
DR. HEMRAJ SAINICE&IT Department, Higher Institute of Electronics, Bani Walid. LIBYA
Dr. MAUMITA BHATTACHARYASOBIT, Charles Sturt University, Albury - 2640, NSW, AUSTRALIA
Dr. SEIFEDINE KADRYLebanese International University, LEBONON
Dr. AIJUAN DONGDepartment of Computer Science, Hood College Frederick, MD 21701.USA
Dr. S.S.RIAZ AHAMEDMohamed Sathak Engineering College, Kilakarai, & Sathak Institute ofTechnology, Ramanathapuram , Tamilnadu, INDIA
Dr. ZURIATI AHMAD ZUKARNAINUniversity Putra Malaysia, MALAYSIA
Dr. CHELLALI BENACHAIBAUniversity of Bechar, ALGERIA
Dr. MOHD NAZRI ISMAILUniversity of Kuala Lumpur (UniKL) MALYSIA
Dr. VITUS SAI WA LAMThe University of Hong Kong, CHINA
Dr. WITCHA CHIMPHLEESuan Dusit Rajabhat University, Bangkok, THAILAND
Dr. SIDDHIVINAYAK KULKARNIUniversity of Ballarat, Ballarat, AUSTRALIA
Dr. S. KARTHIKEYANCaledonian College of Engineering, OMAN
Dr. DRAGAN R. MILIVOJEVIĆMining and Metallurgy Institute Bor Zeleni bulevar 35, 19210 Bor,SERBIA
Dr. ABDUL AZIZProfessor of Computer Science, University of Central Punjab,PAKISTAN
Dr.P.DANANJAYANProfessor, Department of ECE, PEC, Puducherry, INDIA.
Dr. E. SREENIVASA REDDYPrincipal - Vasireddy Venkatadri Institute of Technology, Guntur, A.P.,INDIA
Dr. SANTOSH DHONDOPANT KHAMITKARRamanand Teerth Marathwada University, Nanded. Maharashtra431605, INDIA
Dr. M. IQBAL SARIPAN(MIEEE, MInstP, Member IAENG, GradBEM)Dept. of Computer and Communication Systems Engineering, Facultyof Engineering, Universiti Putra MALAYSIA
Dr. E. SREENIVASA REDDYPrincipal - Vasireddy Venkatadri Institute of Technology, Guntur, A.P.,INDIA
SHAHBAZ GHAYYURFaculty of Basic and Applied Sciences, Department of ComputerScience and Software Engineering, International Islamic University,Islamabad. PAKISTAN.
Dr. T.C.MANJUNATH,Professor & Head of the Dept.,Electronicis & Communication Engg.Dept,New Horizon College of Engg.,Bangalore-560087, Karnataka, INDIA.
Dr. Nacer eddine ZAROUR LIRE Laboratory, Computer Science Departement, University Mentouriof Constantine (UMC)
Dr. RIKTESH SRIVASTAVAAssistant Professor, Information Systems, Skyline University College P O Box 1797, Sharjah, UAE
Dr. Mohd ZAINAL ABIDIN AB KADIR, PhD, MIEEECentre of Excellence on Lightning Protection (CELP)Dept. of Electrical and Electronics Engineering, Faculty of Engineering,UPM, Selangor, MALAYSIA
Dr. OUSMANE THIAREGaston Berger University, Department of Computer Science, UFR S.A.TBP 234 Saint-Louis, SENEGAL
Dr. SIDDHIVINAYAK KULKARNI

Graduate School of Information Technology and MathematicsUniversity of Ballart AUSTRALIA
Dr. BONNY BANERJEESenior Scientist Audigence, FL, USA, The Ohio State University,Columbus, OH, USA
Dr. NICKOLAS S. SAPIDISDepartment of Mechanical Engineering, University of WesternMacedoniaKozani GR-50100, GREECE.
Dr. NAZRI BIN MOHD NAWISoftware Engineering Department, Faculty of Science ComputerInformation Technology, Universiti Tun Hussein Onn MALAYSIA
Dr. JOHN BABALOLA OLADOSULadoke Akintola University of Technology, Ogbomoso, NIGERIA
Dr. ABDELLAH IDRISSIDepartment of Computer Science, Faculty of Science, Mohammed VUniversity - Agdal, Rabat, MOROCCO
Dr. AMIT CHAUDHRYUniversity Institute of Engineering and Technology, Panjab University,Sector-25, Chandigarh, INDIA
Dr. ASHRAF IMAMAligarh Muslim University, Aligarh-INDIA
Dr. MUHAMMAD UMER KHANDepartment of Mechatronics, Faculty of Engineering, Air University,Islamabad. PAKISTAN
Dr. MOHAMMED ALI HUSSAINDept. of Computer Science & Engineering, Sri Sai Madhavi Institute ofScience & Technology, Mallampudi, Rajahmundry, A.P, INDIA
Dr. KHALID USMANIDepartment of Computer Science, Arid Agriculture University,Rawalpindi, PAKISTAN.
Dr. GUFRAN AHAMD ANSARIQassim University, College of Computer Science, Ministry of HigherEducation, Qassim University, KINGDOM OF SAUDI ARABIA
Dr. Defa HuSchool of Information, Hunan University of Commerce, Changsha410205, Hunan, P. R. of CHINA
MANAGING EDITORSSaleha Samar (managing_editor at jatit.org )Journal of Theoretical and Applied Information Technology
Shahzad A. Khan ( publisher at jatit.org )Lecturer IMCB, FDE Islamabad.(Managing Editor/Linguist & In-charge Publishing)Journal of Theoretical and Applied Information Technology

jatit.org Publishing Policy Review Process Code of Ethics
**You can join the elite panel of JATIT as member technical editorialboard if you hold a PhD in computing and have at-least 10 publicationsin International Journals/Conferences. Please drop your CV atmanaging_editor at jatit.org. Members lists and requests are reviewedat the end of every year in regional advisory panel meeting.
Home
Volumes
Submit Paper
ManuscriptStatusAuthorGuidelinesEditorial Board
Indexing andAbstractingSubscribe toJATITContact Us
Frequency :MONTHLY
FeedBack | Contact Us | Links | Site Map
Welcome to Journal of Theoretical and Applied Information Technology
Submit Paper /Call for Papers
Journal receivespapers incontinuous flowand we willconsider articlesfrom a wide rangeof InformationTechnologydisciplinesencompassing themost basicresearch to themost innovativetechnologies.Please submityour paperselectronically toour submissionsystem athttp://jatit.org/submit_paper.phpin an MSWord, Pdfor compatibleformat so thatthey may beevaluated forpublication in theupcoming issue.This journal uses ablinded reviewprocess; please
Journal of Theoretical and Applied Information Technology May 2014 | Vol. 63 No.1
Title: AN EFFICIENT INFORMATION RETRIEVAL SYSTEM USING QUERY EXPANSION ANDDOCUMENT RANKING
Author: P.JANARTHANAN, A. KAVITHA, N.RAJKUMAR,4S.P.VICTOR
Abstract: Information retrieval is the process of searching and retrieval of information from documents that matchesuser query. The user information requirement is represented by a query or profile that contains one or moresearch terms. Indexing plays important role to retrieve the information. Researchers have been usedindexing techniques only for document indexing and not focused on the speed up the search and retrievaltime. In this paper, an enhanced inverted indexing technique is proposed to index all root terms of thedocuments. This approach maintains the weight of each term connected to the document in index structure.Multiple query terms are easy to handle using inverted index. After indexing, the searching and retrievalprocess is made by matching the query with the indexed terms. In order to solve the problem of false andnull information retrieval, the proposed system includes query expansion and document ranking whichimproves retrieval accuracy.
Keywords: Inverted index, Similarity Measure, Query Expansion, Document Ranking.
Source: Journal of Theoretical and Applied Information Technology10 May 2014 -- Vol. 63. No. 1 -- 2014
Full Text
Title: SCHEDULING TECHNIQUES IN ON-DEMAND GRID AS A SERVICE CLOUD: A REVIEW
Author: SHAFI’I MUHAMMAD ABDULHAMID, MUHAMMAD SHAFIE ABD LATIFF,MOHAMMED BAKRIBASHIR
Abstract: The Infrastructure as a service (IaaS) Cloud is a customer oriented cloud environment that offers user withcomputing infrastructures on-demand to be used based on the Cloud computing paradigm of pay-per-use.When the IaaS is now utilized to build a traditional Grid network within the cloud environment, it is nowcalled an on-demand Grid as a service (GaaS) Cloud. In the on-demand GaaS Cloud, a user may usehundred of thousand of Grid nodes to implement a job, therefore manual scheduling is not a feasiblescheduling solution. The main objective of this review is to study the various concepts and schedulingalgorithms used for the on-demand GaaS Cloud in relation to the scheduling parameters used by existingresearches. We also survey the Cloud infrastructures, Grid middlewares and the issues addressed bydifferent researchers in the past within this domain of research. Our contribution will thus be of assistancein understanding the key scheduling algorithms and parameters for potential future enhancements in thisevolving area of research.
Keywords: Cloud Computing, GaaS Cloud, On-Demand Grid, On-Demand GaaS Cloud, IaaS Cloud, Virtualization
Source: Journal of Theoretical and Applied Information Technology10 May 2014 -- Vol. 63. No. 1 -- 2014
Full Text
Title: ARTIFICIAL COOPERATIVE SEARCH ALGORITHM BASED LOAD FREQUENCY CONTROL OFDEREGULATED POWER SYSTEM WITH SMES UNIT
Author: S.RAMESH KUMAR, S.GANAPATHY
Abstract: In this paper, the optimal gain tuning of an Integral controller for the solution of Load Frequency Control(LFC) problem in a Deregulated power system is proposed using Artificial Cooperative Search algorithm.Fast acting energy storage devices can effectively damp the oscillations due to sudden load changes in thepower system. Hence, Superconducting Magnetic Energy Storage (SMES) units are connected in both
Journal of Theoretical and Applied Information Technology - May 2014 V... http://www.jatit.org/volumes/Vol63No1/sixtythird_1_2014.php
1 of 9 9/9/2014 4:42 PM
remember toinclude all yourpersonalidentifiableinformation in themanuscript beforesubmitting it forreview, we willedit the necessaryinformation at ourside. Submissionsto JATIT should befull research /review papers(properlyindicated belowmain title).
areas of the thermal power system for optimal transient performance in deregulated environment. TheArtificial Cooperative Search algorithm is a new two-population based search optimization algorithm foroptimizing numerical optimization problems. The effectiveness of the proposed Artificial cooperativesearch algorithm is demonstrated on a two area deregulated thermal power system under differentcontracted scenarios and load changes. The effect of SMES on LFC operation of deregulated system isalso analyzed. The results of the proposed algorithm are shown for different contract scenarios anddisturbances.
Keywords: Artificial Cooperative Search Algorithm, Deregulated power system, DISCO Participation Matrix, LoadFrequency Control, Superconducting Magnetic Energy Storage
Source: Journal of Theoretical and Applied Information Technology10 May 2014 -- Vol. 63. No. 1 -- 2014
Full Text
Title: FAST FIR ALGORITHM BASED AREA-EFFICIENT PARALLEL FIR DIGITAL FILTERSTRUCTURES
Author: R.P.MEENAAKSHI SUNDHARI, Dr.R.ANITA
Abstract: In digital systems, the filters occupy a major role. This work describes the design of parallel FIR filterstructures using poly-phase decomposition technique that requires minimum number of multipliers and lowpower adders. Normally multipliers consume more power and large area than the adders. For reducing thearea, this filter structure uses adders instead of multipliers since the adder requires low power and lessarea than the multipliers. Moreover, number of adders does not increase along with the length of parallelFIR filter. Finally the proposed parallel FIR filter structures are beneficial in terms of hardware cost andpower when compared to the existing parallel FIR filter structure.
Keywords: Digital Signal Processing (DSP), Fast Finite-Impulse Response (FIR) Algorithms (FFAs), SymmetricConvolution
Source: Journal of Theoretical and Applied Information Technology10 May 2014 -- Vol. 63. No. 1 -- 2014
Full Text
Title: MINING FAQ FROM FORUM THREADS: THEORETICAL FRAMEWORK
Author: ADEKUNLE ISIAKA OBASA, NAOMIE SALIM
Abstract: Frequently Asked Questions (FAQ)’s tag is becoming more popular on websites. Research activities havebeen concentrated on its retrieval rather than construction. FAQ construction can be achieved using anumber of sources. Presently, it is mostly done manually by help desk staff and this tends to make it staticin nature. In this paper, a comprehensive review of various components that can guarantee effective miningof FAQ from forum threads is presented. The components encompass pre-processing, mining of questions,mining of answers and mining of the FAQ. Besides the general idea and concept, we discuss the strengthsand limitations of the various techniques used in these components. In fact, the following questions areaddressed in the review. What kind of pre-processing technique is needed for mining FAQ from forum?What are the recent techniques for mining questions from forum threads? What approaches are currentlydominating answer retrieval from forum threads? How can we cluster out FAQ from question and answerdatabase?
Keywords: FAQ, Forum thread, Question answering, mining FAQ, Internet forum
Source: Journal of Theoretical and Applied Information Technology10 May 2014 -- Vol. 63. No. 1 -- 2014
Full Text
Title: A NEW SCHEDULING BASED ENERGY EFFICIENT SCHEME FOR WSNS
Author: S.SAIRA BANU , DR.R.DHANASEKARAN
Abstract: In recent years, Wireless Sensor Networks are the most popular networks among the other networks. It is acollection of sensor nodes where it contains infrastructure or no infrastructure. It is widely used inmilitary, search and rescue operations etc. Due to the mobility of nodes, packets are dropped withoutorganizing scheduling priority. So, the performance of the networks is totally degraded. To overcome this
Journal of Theoretical and Applied Information Technology - May 2014 V... http://www.jatit.org/volumes/Vol63No1/sixtythird_1_2014.php
2 of 9 9/9/2014 4:42 PM

issue, we proposed New Scheduling based Energy Efficient Scheme (NSEES). It attains both throughputand network connectivity while keeping the nodes moving in dynamic manner. The scheme consists of 4phases. In first phase, we propose the mobility model where the nodes are moving in a rectangular lattice.In second phase, the multipath routing is used to provide load balancing to improve the throughput. In thirdphase, the scheduling algorithm was proposed. Here the sensor nodes are assigned with the constantcodewords and different time slots. In fourth phase, we proposed new packet format. It consists ofscheduling status and connectivity status. We also introduced the energy conservation model to attainminimum energy level to the sensor nodes. By using the extensive simulation results using the discreteevent simulator, the proposed NSEES achieves higher packet delivery ratio, connectivity ratio, lessoverhead and delay than the existing scheme like NMRA, SBYaoGG and AFTMR.
Keywords: Wireless Sensor Networks)WSN, New Scheduling based Energy Efficient Scheme (NSEES), SmartBoundary Yao Gabriel Graph(SBYaoGG), Adaptive Fault Tolerant Multipath Routing (AFTMR),Scheduling priority, , end to end delay, and mobility model.
Source: Journal of Theoretical and Applied Information Technology10 May 2014 -- Vol. 63. No. 1 -- 2014
Full Text
Title: AUTOMATIC MUSIC GENRE CLASSIFICATION USING DUAL TREE COMPLEX WAVELETTRANSFORM AND SUPPORT VECTOR MACHINE
Author: RINI WONGSO, DIAZ D. SANTIKA
Abstract: A fast and accurate automatic method for music genre classification is needed to manage a huge number ofdigital music currently available. However this is a non-trivial task because musical genres remain poorlydefined concepts due to subjective human perception. In this experimental study, an attempt to combineDual Tree Complex Wavelet Transform (DTCWT) based feature and Support Vector Machine (SVM) asclassifier is proposed. The study focused on classifying four genres of music i.e. pop, classical, jazz, androck by using strong features such as mean, standard deviation, variance, and entropy. Data used in thestudy is obtained from GTZAN Collection Data Sets. Based on the experimental results, the proposedapproach produces 88.33% accuracy, which is higher than several previous methods that could only obtainaccuracy up to 86.4%.
Keywords: Music Genre, Classification, DTCWT, Dual Tree, Wavelet, Support Vector Machine
Source: Journal of Theoretical and Applied Information Technology10 May 2014 -- Vol. 63. No. 1 -- 2014
Full Text
Title: MARKER TEXTBOOKS FOR AUGMENTED REALITY ON MOBILE LEARNING
Author: TOUFAN D TAMBUNAN, HERU NUGROHO
Abstract: Variations learning media in school is to help students understand the material & content being studied.Media like simulation reality can be used as a learning tool to provide learning experiences for students inunderstanding something that is being studied. In this paper, a design proposed technique will be madelearning simulation using mobile augmented reality. The research conducted on learning materials physicsand motion at high school. Aims to facilitate students understanding of physics concepts of motion bygiving an example of a virtual simulation on mobile applications. Augmented Reality technology usedcombines a virtual object or 2D and 3D into a real object environment and projecting the virtual objects inreal time. We propose the design of an augmented reality system using the student textbook for detectingmarker-less augmented. Technique marker-less can simplify the implementation of Augmented Realityapplications on textbooks student and implemented in mobile devices. The proposal is expected to learningsimulations to help students understand the concept physics and motion through a technology that is easy touse.
Keywords: Augmented Reality, Marker, Mobile Learning, and Simulation.
Source: Journal of Theoretical and Applied Information Technology10 May 2014 -- Vol. 63. No. 1 -- 2014
Full Text
Title: A REFERENCE MODEL OF SECURITY REQUIREMENTS FOR EARLY IDENTIFICATION ANDMEASUREMENT OF SECURITY AWARENESS PROGRAM
Journal of Theoretical and Applied Information Technology - May 2014 V... http://www.jatit.org/volumes/Vol63No1/sixtythird_1_2014.php
3 of 9 9/9/2014 4:42 PM

Author: Ali Maqousi , Tatiana Balikhina, Kenza Meridji , Khalid T. Al-Sarayreh
Abstract: In practice, at software/system requirements assembly stages, the focus is regularly on the softwaresecurity requirements as usually described at the system level this may lead to explicit security-relatedproduct which may be implemented as both in system and software. According to the ECSS standardsinternal security awareness is restricted to avoid illegal access to the software system and confidentialdata while the external security requirements related awareness is failing to put off the leak of secureoutput data awareness and illegal processes. In European, ISO 25021 a amount of terms are afforded todescribe many types of aspirant security awareness requirements. This paper accumulates and systematizesthese security awareness-related requirements into a standards-based reference model of the softwaresecurity awareness; In the absence of such a model, such security awareness requirements are definitivelyassigned at software system testing time, stakeholders find out that a number of Security awarenessrequirements are neglected and additional efforts should be added to implement such awareness’s.Moreover, the proposed model may also be used for identify the functional size of security awarenessprograms using the ISO 19761 standard. This size may be used for estimation purposes.
Keywords: Security Requirements, Security Awareness Program, ISO 25021, IEEE-830.
Source: Journal of Theoretical and Applied Information Technology10 May 2014 -- Vol. 63. No. 1 -- 2014
Full Text
Title: TRANSIENT STABILITY ENHANCEMENT OF TNEB 400 kV TRANSMISSION NETWORK WITHSVC
Author: Er.S.SUJATHA, Dr.R.ANITHA, Dr.P.SELVAN, Er.S.SELVAKUMAR
Abstract: Modeling of the TNEB 400 kV transmission network with SVC using ETAP simulation software ispresented in this paper. The system is analyzed under severe disturbance to study the transient behavior bysimulating three phase to ground fault at various buses. To enhance the transient stability of the system,SVC are inserted and tested to show the effect of the same on the transient stability under severedisturbances. The study compares the results and effectiveness of SVC for enhancing the transient stabilityof the system through the critical clearing time using ETAP software. The fault clearing time is increasedup to the critical clearing time to test the robustness of the system and the effectiveness of the SVC.Simulation is performed to study the transient behavior of the system. Results show that coordinatedmodification of exciters, installation of FACTS devices to enhances the stability of the grid to great extent
Keywords: Power Quality, SVC, Exciter, FACTS, TNEB 400 Kv Transmission Network, Transient Stability
Source: Journal of Theoretical and Applied Information Technology10 May 2014 -- Vol. 63. No. 1 -- 2014
Full Text
Title: PATTERN BASED CLASSIFICATION FOR TEXT MINING USING FUZZY SIMILARITYALGORITHM
Author: V.SHARMILA, I.VASUDEVAN, Dr.G.THOLKAPPIA ARASU
Abstract: Pattern mining is an important research issues in data mining with few kinds of applications. Many textmining methods have been proposed for mining useful pattern in text documents. It is mainly focuses toapproximately identify the different entities such as terms, phrases and pattern. We use the featureevaluation to reduce the dimensionality of high dimensional text vector. Then the system assigns thefrequency to each word, all the weight of the document is used for pattern clustering. Pattern clustering isone of the favorable methods for feature extraction in text classification. In this paper we propose a fuzzyestimated and similarity - based self generating algorithm for text classification. It overcomes the lowfrequency problem, and also calculates the similarity between the different pattern and word in effectivemanner. Experimental on RCV1 data collection and TREC topics implement that the proposed resultachieves better performance
Keywords: Text Mining, Feature Clustering, Text Classification, Feature Extraction, Pattern.
Source: Journal of Theoretical and Applied Information Technology10 May 2014 -- Vol. 63. No. 1 -- 2014
Full Text
Title: NONRETINOTOPIC PARTICLE FILTER FOR VISUAL TRACKING
Journal of Theoretical and Applied Information Technology - May 2014 V... http://www.jatit.org/volumes/Vol63No1/sixtythird_1_2014.php
4 of 9 9/9/2014 4:42 PM
Author: ALEXANDER A S GUNAWAN, ITO WASITO
Abstract: Visual tracking is the problem of using visual sensor measurements to determine location and path of targetobject. One of big challenges for visual tracking is full occlusion. When full occlusions are present, imagedata alone can be unreliable, and is not sufficient to detect the target object. The developed trackingalgorithm is based on bootstrap particle filter and using color feature target. Furthermore the algorithm ismodified using nonretinotopic concept, inspired from the way of human visual cortex handles occlusion byconstructing nonretinotopic layers. We interpreted the concept by using past tracking memory about motiondynamics rather than current measurement when quality level of tracking reliability below a threshold.Using experiments, we found (i) the performance of the object tracking algorithm in handling occlusion canbe improved using nonretinotopic concept, (ii) dynamic model is crucial for object tracking, especiallywhen the target object experienced occlusion and maneuver motions, (iii) the dependency of the trackerperformance on the accuracy of tracking quality threshold when facing illumination challenge. Preliminaryexperimental results are provided.
Keywords: Visual Tracking, Full Occlusion, Bootstrap Particle Filter, Color, Nonretinotopic, Tracking QualityThreshold
Source: Journal of Theoretical and Applied Information Technology10 May 2014 -- Vol. 63. No. 1 -- 2014
Full Text
Title: KEYLESS CRYPTOGRAPHY IN GRID COMPUTING USING CYCLIC SHIFT TRANSPOSITIONALGORITHM
Author: S. GOMATHI, DR.D.MANIMEGALAI
Abstract: Grid computing involves in the process of forming dynamic virtual organizations and associated resourcesin which the security is an important factor.Grid computing, is a distributed computing model in which newkind of systems are combined to form a heterogeneous computational resources such as computers, storagespace, sensors, and experimental data. The grid can seamlessly, transparently and dynamically supply thecomputing and data resources when a user wants to request them. In recent years, security issues hasbecome an important concern for grid computing. A strong mutually encrypted and decrypted methodologyis needed for user and to prevent the grid resources from being illegally visited. Many cryptographicschemes have been proposed in recent periods for solving the security issues.However, most of them arenot ideal for the grid computing technologydue to its computational overhead and the standard ofencryption. In this paper, we proposed a keyless Cyclic Shift Transposition Algorithm(CSTA) which usesa combination of shifting and transposition without public or private key to secure the data in the gridcomputing system. Experimental results shows that the proposed algorithm prevents not only known attacksbut also maintains the integrity of data.
Keywords: Grid Computing, Authentication, Encryption, Decryption, Cipher Text, CSTA.
Source: Journal of Theoretical and Applied Information Technology10 May 2014 -- Vol. 63. No. 1 -- 2014
Full Text
Title: RECONSTRUCTION 4D OF BLOOD FLOW MR IMAGING ON ABDOMINAL AORTICANEURYSMS WITH THROMBUS SIGNAL
Author: C. M. KARYATI1, S. WIDIYANTO1, S. MADENDA2, J. HARLAN3, A. B. MUTIARA4
Abstract: Cine MRI (amplitude image and phase contrast image) has been used to represent the blood flow velocityon the aortic aneurysm. Acquisition of images taken perpendicular to the abdominal aorta is done in freebreathing and breath hold at the specified location as needed. Active Contour method or Snake(Deformable Model) has been used to perform automatic contour on amplitude image to detect the surfaceof the aorta and obtain the required parameter values. Furthermore, image reconstruction is performed onthe object's surface from several slices of image segmentation that results with Scalar Volume Datatechnique (isosurface) in order to obtain the value of blood flow volume. The method has been developedand can represent animation of aortic aneurysm with blood flow velocity on each category of thrombus.
Keywords: Abdominal Aortic Aneurysm, Deformable Models, Scalar Volume Data, Blood Flow Velocity, Blood FlowVolume
Source: Journal of Theoretical and Applied Information Technology10 May 2014 -- Vol. 63. No. 1 -- 2014
Full Text
Journal of Theoretical and Applied Information Technology - May 2014 V... http://www.jatit.org/volumes/Vol63No1/sixtythird_1_2014.php
5 of 9 9/9/2014 4:42 PM

Title: SEVERITY SCORING OF SYMPTOMS ASSOCIATED WITH CARPAL TUNNEL SYNDROMEBASED ON RECALL OF COMPUTER GAME PLAYING EXPERIENCES
Author: NURUL HIDAYAH MAT ZAIN, AZIZAH JAAFAR, FARIZA HANIS ABDUL RAZAK
Abstract: The purpose of the present study was to investigate the severity scoring of symptoms that are oftenassociated with carpal tunnel syndrome (CTS). The symptoms were identified based on participants’recalled experiences of computer game playing, specifically on desktop computer platforms. We conductedthe assessment among Malaysian university students by using the Boston Carpal Tunnel Questionnaire. Thedata were collected from 120 students in the age range of 18-25 years. The results indicated that the meanscore for symptom severity was 1.59, the standard deviation was 0.49 and most of the cases were mild (N= 88, 73.3%). Meanwhile, the mean score for functional severity was 1.33, the standard deviation was0.52 and half of the participants described having hand functions affected (N = 62, 51.7%). The sameparticipants were also required to answer questions pertaining to their perceptions of desktop computergaming. The results showed the participants’ agreement with the proposition that a user interface forspecial needs, such as the needs of hand-impaired users, should be designed (75.0%). There was asignificant association between students who were less interested in computer game playing and a feelingof hand discomfort (p < 0.001). This study shows that even though the incidence of symptoms associatedwith CTS among students is predominant, the symptom severity is in the mild category.
Keywords: Carpal Tunnel Syndrome (CTS), Boston Carpal Tunnel Questionnaire (BCTQ), Computer-Game Playing,Computer Game, University Students
Source: Journal of Theoretical and Applied Information Technology10 May 2014 -- Vol. 63. No. 1 -- 2014
Full Text
Title: SURVEY ON GAP FILLING ALGORITHMS IN LANDSAT 7 ETM+ IMAGES
Author: ASMAA SADIQ ABDUL JABAR, GHAZALI SULONG, LOAY EDWAR GEORGE
Abstract: In remote sensing images the gapping is a known phenomenon. There are several reasons for image gaps,e.g. shadowed area for SAR data sets, cloud coverage for optical imagery and instrument errors such asSLC-off failure. On May 13, 2003 the Scan Line Corrector (SLC) of Landsat 7 Enhanced Thematic MapperPlus (ETM+) sensor failed permanently causing around 20% of pixels per scene not scanned whichbecome an obstacle and limitation for scientific applications of Landsat ETM+ data. Therefore,reconstruction of gap regions is an important issue in remote sensing image processing. This paperpresents an inclusive review of methodologies that have been used to recover the gaps in Landsat7 ETMSLC-off images and the studies have been performed in this area. Then, the paper presents the derivedconclusions and the directional to more efficiently researchs on Landsat7 SLC-off reconstruction.
Keywords: Satellite Image, Gap Filling, Landsat7 SLC-Off, Image Reconstruction.
Source: Journal of Theoretical and Applied Information Technology10 May 2014 -- Vol. 63. No. 1 -- 2014
Full Text
Title: IAPI QUAD-FILTER: AN INTERACTIVE AND ADAPTIVE PARTITIONED APPROACH FORINCREMENTAL FREQUENT PATTERN MINING
Author: SHERLY K.K, Dr. R. NEDUNCHEZHIAN, Dr. M. RAJALAKSHMI
Abstract: Association rule mining has been proposed for market basket analysis and to predict customerpurchasing/spending behaviour by analyzing the frequent itemsets in a large pool of transactions. Findingfrequent itemsets from a very large and dynamic dataset is a time consuming process. Several sequentialalgorithms have contributed to frequent pattern generation. Most of them face problems of time and spacecomplexities and do not support incremental mining to accommodate change in customer purchasebehaviour. To reduce these complexities researchers propose partitioned and parallel approaches; but theyare compromising on anyone of these. An interactive and adaptive partitioned incremental miningalgorithm with four level filtering approaches for frequent pattern mining is proposed here. It preparesincremental frequent patterns, without generating local frequent itemsets in less time and spacecomplexities and is efficiently applicable to both sequential and parallel mining.
Keywords: Frequent Pattern Mining; Association Rule; Partitioned Database; Parallel Mining; Interactive Mining;Incremental Mining
Journal of Theoretical and Applied Information Technology - May 2014 V... http://www.jatit.org/volumes/Vol63No1/sixtythird_1_2014.php
6 of 9 9/9/2014 4:42 PM
Source: Journal of Theoretical and Applied Information Technology10 May 2014 -- Vol. 63. No. 1 -- 2014
Full Text
Title: A SKETCH BASED IMAGE RETRIEVAL : A REVIEW OF LITERATURE
Author: HUDA ABDULAALI ABDULBAQI , GHAZALI SULONG , SOUKAENA HASSAN HASHEM
Abstract: This survey paper reviews the development of Content Based Image Retrieval (CBIR) field and especiallythe sketch based image retrieval (SBIR) as a core issue. An image is retrieved from the database in severalways in user queries. SBIR is one of the efficient and important methods which are not necessary to have ahigh skill to draw the query sketch. First, we review the feature extraction, features based matching, andindexing which represents the base of recall images. We also present in the concluding section generallimitations of how the methods deal with the image retrieval and our views in image retrieval based onsketch query, which is also the future direction.
Keywords: SQbs, Content Analysis And Indexing, Indexing methods, Image Descriptors, Sketch Based Retrieval
Source: Journal of Theoretical and Applied Information Technology10 May 2014 -- Vol. 63. No. 1 -- 2014
Full Text
Title: PLAGIARISM DETECTION ALGORITHM USING NATURAL LANGUAGE PROCESSING BASEDON GRAMMAR ANALYZING
Author: ANGRY RONALD ADAM, SUHARJITO
Abstract: Plagiarism has become one of the most concerned problems since there are several kinds of plagiarism thatare hard to detect. Extrinsic plagiarism is now being handled well, but intrinsic plagiarism is not. Intrinsicplagiarism detection is being distracted by the mixed up structure and the using of another word whichhave the same meaning. Several methods have been research to handle this problem, not only using thepattern reading but also parsing the sentences, but still couldn’t give one more accurate way to detect it. Inthis research, we propose to use Natural Language Processing (NLP) to create the new way to detectplagiarism. Begin with using syntactic parsing method to parse the suspicious document and find the list ofwords which have the same meaning with it while considering the Part-Of-Speech (POS) element of thatword (semantic parsing). This algorithm also includes creating the new structure of the object beforecomparing them. The result of this research presents the accuracy comparison between Ferret,WCopyFind, and this algorithm. This algorithm gives the significant way to detect the plagiarism which isproven by T-Test.
Keywords: Plagiarism Detection, Natural Language Processing, Intrinsic Plagiarism, Syntactic Parsing, SemanticParsing, Ferret, WCopyFind, Part-Of-Speech.
Source: Journal of Theoretical and Applied Information Technology10 May 2014 -- Vol. 63. No. 1 -- 2014
Full Text
Title: SCHEDULING CASE SIMULATION TO PERFORMANCE EVALUATION OF HOSPITALPRODUCTIVITY
Author: FIRDAOUS BENNIS, MUSTAPHA AMGHAR, NAWAL SBITI, ABDELMAJID ELOUADI
Abstract: The block is a strategic and complicated system in the hospital. It uses diversified and expensive humanresources, material and information flow. In this field which investments are very expensive, simulation isa tool for decision-making to analyze the operation and detect malfunctions for dimensioning the systemand obtaining the performance. We develop in this article a C++ simulation with a theory of queues basedon the optimum of the proposed scheduling model. This model consists of a new approach. For schedulingmodel, we propose a new production model related to the hybrid flow shop hierarchy manufacturer. Wesolve the scheduling problem using the discrete particle swarm optimization with travelling salesmanproblem approach. The case study of our approach applied to the national Institute of Oncology in RABAT,Morocco, allowed us to measure the maximum of patients that can be accepted in a day and the allocationof the three machines queues stretchers, Operating rooms and beds among the scheduled elementsinvolved.
Keywords: Case Simulation, Hospital, Scheduling, Production Model, Hybrid Flow Shop Hierarchy Manufacturer
Journal of Theoretical and Applied Information Technology - May 2014 V... http://www.jatit.org/volumes/Vol63No1/sixtythird_1_2014.php
7 of 9 9/9/2014 4:42 PM
Source: Journal of Theoretical and Applied Information Technology10 May 2014 -- Vol. 63. No. 1 -- 2014
Full Text
Title: HYBRID OPTIMIZATION MODEL OF VIDEO STEGANOGRAPHY TECHNIQUE WITH THE AID OFBIORTHOGONAL WAVELET TRANSFORM
Author: Dr.M. MARSALINE BENO, Dr.ALOYSIUS GEORGE, VALARMATHI I.R, SWAMY S. M
Abstract: In this contemporary world of ours, a lot of people have tried to store their multimedia datasets as acontour of binary waves. During transmission, if a prohibited course of action occurs during an intermittentstage of transmission it could lead to delay in accessing data for individuals who have been providedauthorization. In order to eliminate this undesired course of action, an efficient method has been adopted.Steganography is an efficient technique that can eliminate this undesired course of action and can beutilized for writing an eclipse missive. In this paper we have proposed an efficient optimal robust videosteganography technique using the Biorthogonal Wavelet Transform (BWT) that has been incorporated witha hybrid model of the Artificial Bee Colony (ABC) with Genetic Algorithm (GA).The BWT is utilized tosplit the image into Low-Low (LL), Low-High (LH), High-Low (HL) and High-High (HH). Theoptimization technique ABC and GA are then utilized to attain best fitness values in the embedding andextraction processes. Analysis on the proposed technique is carried out with respect to the Peak signal toNoise ratio (PSNR) and the Normalized Correlation (NC). Experimental results show that the proposedtechnique can achieve good imperceptibility and robustness for an image.
Keywords: Steganography, Biorthogonal Wavelet Transform, Artificial Bee Colony, Genetic Algorithm, Peak SignalTo Noise Ratio, Normalized Correlation.
Source: Journal of Theoretical and Applied Information Technology10 May 2014 -- Vol. 63. No. 1 -- 2014
Full Text
Title: SERVICE DIFFERENTIATED CALL ADMISSION CONTROL IN NEXT GENERATION WIRELESSNETWORKS
Author: CH. SREENIVASA RAO, K.CHENNA KESHAVA REDDY AND D. SRINIVASA RAO
Abstract: In wireless network, real time flows are prioritized over non-real time flows. Because of thisprioritization, non-real time flows endures starvation. Furthermore, real time flows are handled quitegenerally as no specification is given to emergency flows. To consider all these difficulties, we propose aservice differentiated call admission control mechanism for next generation wireless networks. Initially,flows are classified into Transmission Priority flow (TP) and Bandwidth Priority flow (BP) usingDiffServ model. TP flows denote real time flows and BP belongs to non-real time flows. Further, both TPand BP flows are again categorized into sub flows based on delay and bandwidth constraints respectively.TP flows are controlled by RIO-C queuing mechanism and BP flows are handled by Time Sliding Window(TSW) algorithm. RIO-C assigns different dropping level for each sub flows and operates independently.On the other hand, TSW manage the BP flows by controlling their packet-sending rate. Thus, ourmechanism lessens the starvation of non real time flows and handles emergency calls effectively. Bysimulation, we prove the efficiency of our mechanism.
Keywords: Wireless Network, Transmission Priority flow (TP), Call Admission Control (CAC), Quality of Service(QoS).
Source: Journal of Theoretical and Applied Information Technology10 May 2014 -- Vol. 63. No. 1 -- 2014
Full Text
Title: EFFORT RATE ON USE CASE POINT METHOD FOR EFFORT ESTIMATION OF WEBSITEDEVELOPMENT
Author: SHOLIQ , TEGUH SUTANTO , ARIFIN PUJI WIDODO3 , WAHYU KURNIAWAN
Abstract: The purpose of this research is to gain Effort Rate (ER) on the Use Case Point method (UCP) forestimating effort of the website development. The Effort estimation is an activity that is carried out topredict how amount of effort required to complete a software development project. Effort estimation isvery important be know before the project is executed to determine how resources should be spent tocomplete the project. In this context, resources include the work hours and expenses. Commonly UCP wasone of method used to estimate software development effort.
Journal of Theoretical and Applied Information Technology - May 2014 V... http://www.jatit.org/volumes/Vol63No1/sixtythird_1_2014.php
8 of 9 9/9/2014 4:42 PM

The studies that have been conducted by several researchers carried out to estimate the regular softwaredevelopment. Until now, it is not found research using UCP to estimate effort for the website developmentproject. The UCP that is used to estimate the effort of website development projects requires different ERfrom the ER for regular software project. Effort is obtained by multiplying the value of UCP and ER. TheER value proposed by some researchers varies between 18 to 36 staff-hours per UCP, while ER proposedby Karner was 20 staff-hours per UCP.The final results of this study obtain ER value of 4.41. This value is smaller than the value proposedearlier researchers. Decline of the ER values can decrease value of effort estimation, furthermore declineof value effort estimation will decrease resources that it will be required for software development. Thismay be due to the website development project which can use Content Management System (CMS) ascomponent or framework that facilitate the development of a website project easier.
Keywords: Effort Rate, Use Case Points, Website Development Effort
Source: Journal of Theoretical and Applied Information Technology10 May 2014 -- Vol. 63. No. 1 -- 2014
Full Text
Title: PRINCIPAL COMPONENT ANALYSIS COMBINED WITH SECOND ORDER STATISTICALFEATURE METHOD FOR MALARIA PARASITES CLASSIFICATION
Author: IIS HAMSIR AYUB WAHAB, ADHI SUSANTO, P. INSAP SANTOSA, MAESADJI TJOKRONEGORO
Abstract: The main challenge in detecting malaria parasites is how to identify the subset of relevant features. Theobjective of this study was to identify a subset of features that are most predictive of malaria parasitesusing second-order statistical features and principal component analysis methods. Relevant features willprovide the successful implementation of the overall detection modeling, which will reduce thecomputational and analytical efforts. The results showed that the combination of the principal componentsof the feature value the correlation to the ASM, and the contrast to the correlation can separate classes ofmalaria parasites.
Keywords: Features, PCA, Identify, Classification, Malaria
Source: Journal of Theoretical and Applied Information Technology10 May 2014 -- Vol. 63. No. 1 -- 2014
Full Text
Title: PERFORMANCE ANALYSIS OF HARMONIC REDUCTION BY SHUNT ACTIVE POWER FILTERUSING DIFFERENT CONTROL TECHNIQUES
Author: R. VENKATESH, S.DINESH KUMAR, R.SRIRANJANI, S.JAYALALITHA
Abstract: In modern day power systems the introduction of harmonics due to the presence of non-linear load such asinverters, rectifiers, saturation transformer, electromagnetic interference etc., affects the power quality indistribution systems. This paper is aimed at improving the power quality using shunt active power filter(SAPF). Active filters implemented with the different control techniques under different load conditionsare simulated by MATLAB-SIMULINK and their performances are compared.
Keywords: Harmonics, Power Quality, Active Filter, Non-Linear, Matlab-Simulink.
Source: Journal of Theoretical and Applied Information Technology10 May 2014 -- Vol. 63. No. 1 -- 2014
Full Text
Journal of Theoretical and Applied Information Technology - May 2014 V... http://www.jatit.org/volumes/Vol63No1/sixtythird_1_2014.php
9 of 9 9/9/2014 4:42 PM
Journal of Theoretical and Applied Information Technology 10th May 2014. Vol. 63 No.1
© 2005 - 2012 JATIT & LLS. All rights reserved.
ISSN: 1992-8645 www.jatit.org E-ISSN: 1817-3195
219
PRINCIPAL COMPONENT ANALYSIS COMBINED WITH SECOND ORDER STATISTICAL FEATURE METHOD
FOR MALARIA PARASITES CLASSIFICATION
1,3IIS HAMSIR AYUB WAHAB, 1ADHI SUSANTO, 1P. INSAP SANTOSA, 2MAESADJI TJOKRONEGORO
1Department of Electrical Engineering and Information Technology, Universitas Gadjah Mada, Yogyakarta
2Faculty of Medicine, Universitas Gadjah Mada, Yogyakarta, Indonesia 3Department of Electrical Engineering, Universitas Khairun, Ternate, Indonesia
E-mail: [email protected]
ABSTRACT
The main challenge in detecting malaria parasites is how to identify the subset of relevant features. The objective of this study was to identify a subset of features that are most predictive of malaria parasites using second-order statistical features and principal component analysis methods. Relevant features will provide the successful implementation of the overall detection modeling, which will reduce the computational and analytical efforts. The results showed that the combination of the principal components of the feature value the correlation to the ASM, and the contrast to the correlation can separate classes of malaria parasites.
Keywords: Features, PCA, Identify, Classification, Malaria 1. INTRODUCTION
Classification is the process of grouping objects into classes according to their respective characteristics. Classifiers’ using the feature vector has been extracted in the previous stage. The degree of difficulty in classification depends on the value of diversity characteristics for objects the same class, relative to the difference between the values characteristic for objects in a different class. Diversity characteristic value for objects in the same class can be caused by the level of complexity and can also be caused by noise. Noise can be defined as a trait that is not caused by the pattern of that class but due to randomness or because of the nature of the sensor.
In a broad sense, any method that involves information from samples in designing classifier training is learning by doing. Classifiers can be created by using common models and classifiers using training patterns to learn or estimate the parameters of the model are unknown. Learning refers to some form of algorithm to reduce the error on the training data set. .
The main aim of the research is to analyze the types of malaria parasite by applying the measurement of second–order statistical features
from images, and principal component analysis method.
2. PREVIOUS WORK
Automatic detection of malaria parasites has been conducted by several researchers in which the number of malaria parasites in the blood can be calculated based on the results of blood sample acquisition is converted into a digital image [3-19]. Detection systems are generally constructed through several stages of processing, i.e. image acquisition, image pre-processing, image segmentation, feature extraction and classification. Selena, et al. [3], developed an automated system to calculate the malaria parasite to quickly and accurately based image analysis. There are four stages that can be done to calculate the number of parasetimia, namely: edge detection, edge linking, splitting the clump and parasite detection.
Parasites can be identified by their characteristic properties from the edge of the red blood cells using Sobel operator and the Hough Transform [4][6]. This is also done by Diaz et al. [5], but on a system built using a low pass filter on the image preprocessing, then extract the image pre-processing to obtain information on where blood cells are infected with malaria parasites.
Journal of Theoretical and Applied Information Technology 10th May 2014. Vol. 63 No.1
© 2005 - 2012 JATIT & LLS. All rights reserved.
ISSN: 1992-8645 www.jatit.org E-ISSN: 1817-3195
220
In addition, another way to detect malaria parasites from red blood cells in the image is to make the process of segmentation. Segmentation is intended to be split among red blood cells and the parasite itself. Wahab et al. [7] make the process of segmentation using k-mean method. While Makkapati and Rao [13] perform color segmentation based on HSV color space. The image will be segmented first filtered using a median filter with window size 3 x 3 to eliminate the noise. Another segmentation method that is used to detect malaria parasites in the image are normalized cut method (NCut) [12]. As with other methods, the method NCut is not unsupervised segmentation method based on global criteria. In this method, the color space used is RGB, HSV, YCbCr and NTSC.
Detection of malaria parasites can be improved performance-works when using the strategy machine learning [14]. The system built is a classifier system based on the input characteristics of each type of parasite. Feature of that has been extracted from previous experiments is a histogram feature [5-11, 14, 19], morphological [10-13], texture [15, 18]. The classifier system used is a neural network multilayer perceptron [5], support vector mechine [5, 19], k-nn [14], Bayesian pixel [8], learning vector quantization [7-9], fuzzy learning vector quantization [10,11] and back propagation [18, 19]. 3. MATERIALS AND METHODS 3.1 Materials
In this research, the data samples used were obtained from blood samples of patients on glass microscope slides. Then preparations in the form of a digital image file format *. Jpg. The files have 24-bit color depth and size of 256x256 pixels. The number of data is 96 with the number of class 4, according to the type of variation in the condition of Plasmodium. 3.2 Second-Order Statistical Feature Extraction
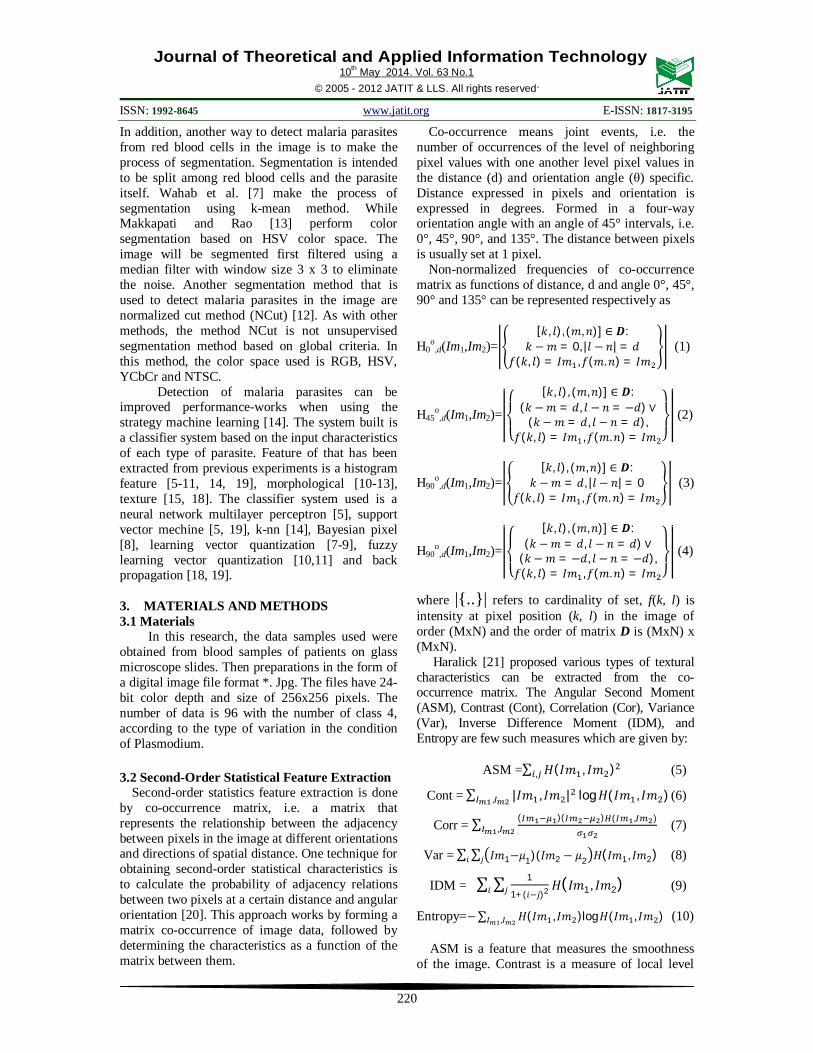
Second-order statistics feature extraction is done by co-occurrence matrix, i.e. a matrix that represents the relationship between the adjacency between pixels in the image at different orientations and directions of spatial distance. One technique for obtaining second-order statistical characteristics is to calculate the probability of adjacency relations between two pixels at a certain distance and angular orientation [20]. This approach works by forming a matrix co-occurrence of image data, followed by determining the characteristics as a function of the matrix between them.
Co-occurrence means joint events, i.e. the number of occurrences of the level of neighboring pixel values with one another level pixel values in the distance (d) and orientation angle (θ) specific. Distance expressed in pixels and orientation is expressed in degrees. Formed in a four-way orientation angle with an angle of 45° intervals, i.e. 0°, 45°, 90°, and 135°. The distance between pixels is usually set at 1 pixel.
Non-normalized frequencies of co-occurrence matrix as functions of distance, d and angle 0°, 45°, 90° and 135° can be represented respectively as
H0o
,d(Im1,Im2)=[푘, 푙), (푚,푛)] ∈ 푫:
푘 − 푚 = 0, |푙 − 푛| = 푑푓(푘, 푙) = 퐼푚 ,푓(푚.푛) = 퐼푚
(1)
H45o
,d(Im1,Im2)=
⎩⎨
⎧[푘, 푙), (푚,푛)] ∈ 푫:
(푘 −푚 = 푑, 푙 − 푛 = −푑) ∨(푘 − 푚 = 푑, 푙 − 푛 = 푑),
푓(푘, 푙) = 퐼푚 ,푓(푚.푛) = 퐼푚 ⎭⎬
⎫ (2)
H90o
,d(Im1,Im2)=[푘, 푙), (푚,푛)] ∈ 푫:
푘 −푚 = 푑, |푙 − 푛| = 0푓(푘, 푙) = 퐼푚 ,푓(푚.푛) = 퐼푚
(3)
H90o
,d(Im1,Im2)=
⎩⎨
⎧[푘, 푙), (푚,푛)] ∈ 푫:
(푘 −푚 = 푑, 푙 − 푛 = 푑) ∨(푘 − 푚 = −푑, 푙 − 푛 = −푑),푓(푘, 푙) = 퐼푚 ,푓(푚.푛) = 퐼푚 ⎭
⎬
⎫ (4)
where |{..}| refers to cardinality of set, f(k, l) is intensity at pixel position (k, l) in the image of order (MxN) and the order of matrix D is (MxN) x (MxN).
Haralick [21] proposed various types of textural characteristics can be extracted from the co-occurrence matrix. The Angular Second Moment (ASM), Contrast (Cont), Correlation (Cor), Variance (Var), Inverse Difference Moment (IDM), and Entropy are few such measures which are given by:
ASM =∑ 퐻(퐼푚 , 퐼푚 ), (5)
Cont = ∑ |퐼푚 , 퐼푚 | log퐻(퐼푚 , 퐼푚 ), (6)
Corr = ∑ ( )( ) ( , ), (7)
Var = ∑ ∑ 퐼푚1−휇1)(퐼푚2 − 휇2 퐻(퐼푚1, 퐼푚2)푗푖 (8)
IDM = ∑ ∑ 1
1+(푖−푗)2 퐻(퐼푚1, 퐼푚2)푗푖 (9)
Entropy=−∑ 퐻(퐼푚 , 퐼푚 )log퐻(퐼푚 , 퐼푚 ), (10)
ASM is a feature that measures the smoothness of the image. Contrast is a measure of local level

Journal of Theoretical and Applied Information Technology 10th May 2014. Vol. 63 No.1
© 2005 - 2012 JATIT & LLS. All rights reserved.
ISSN: 1992-8645 www.jatit.org E-ISSN: 1817-3195
221
variations which takes high values for image of high contrast. Correlation is a measure of correlation between pixels in two different directions. IDM is a measure that takes high values for low-contrast images. Entropy is a measure of randomness and takes low values for smooth images. Together all these features provide high discriminative power to distinguish two different kind of images.
All features are functions of the distance d and the orientation θ. Thus, if an image is rotated, the values of the features will be different. In practice, for each d the resulting values for the four directions are averaged out. This will generate features that will be rotations invariant. 3.2 Principal Component Analysis Principal Component Analysis (PCA) is a well-known multivariate statistical technique, that converts a larger number of observed variables into a smaller number of variable (called principal components), that will take in account most of the variance in the observed variables[22]. Number of original variables is more than or equal to the number of principal components. In this technique, the first principal component has the highest variance; the second principal component has the second highest variance and so on. But each principal component should be orthogonal to the one before that. PCA can helps to identify pattern in data and emphasize on the similarities and differences of the dataset. When the data had a large number of variables, patterns in the dataset are difficult to be recognized. So PCA is a useful tool for analyzing large dimensional data[23]. In this study, PCA is used to process the raw data the 2nd-order statistical characteristics of the malaria parasite. Data Normalization aims to see whether the object of plasmodium falciparum, vivax, ovale and malariae may be separate groups. The variable dataset as 6, it is derived from a second order statistical feature. So the data has 6 dimensions. So it is difficult to visualize and classify the data. Applying PCA score plot will provide primary, which will be two-dimensional. Clusters in the Principal scores plot will show spectral similarities and will allow us to classify the type of plasmodium falciparum, vivax, ovale or malariae. Steps of the PCA process are: Step 1: Getting some data. In this research, four commands (load falciparum.dat, vivax.dat, ovale.dat and malariae.dat) were applied. When using these sorts of matrix techniques in computer vision, representation of image must be well
considered. A square, N by N image can be expressed as an. N2 dimensional vector:
X = (x1, x2,… xn) (11) where the rows of pixels in the image are placed one after the other to form a one-dimensional image. Step 2: Subtracting the raw data with mean of the all data. The equation of the mean data was used as follows: 푥̅ =
∑ (12)
Step 3: Calculating the covariance matrix Covariance is such a measure and always be measured between 2 dimensions. The formula for covariance is quite similar to the formula for variance. The formula for covariance could also be written like this: 푐표푣(푥, 푦) =
∑ ( ̅)( )( )
(13) Step 4: Calculating the eigenvectors and eigenvalues of the covariance matrix. Let P has coordinates (x, y) relative to the x, y axes and coordinates (x1, y1) relative to the x1, y1 axes.
Figure 1: Rotating the axes
x = OQ = OP cos (+ ) = OP (cos cos − sin sin ) = (OP cos ) cos − (OP sin ) sin = OR cos − PR sin = x1 cos − y1 sin (14)Similarly y = x1 sin + y1 cos (15)These transformation equations could be combined into a single matrix equation:
푥푦 = cos∅
sin∅ −sin∅ cos∅
푥푦 (16)
or X = PY (17)
where X = 푥푦 , Y =
푥푦 and P = cos∅
sin∅ −sin∅ cos∅
A matrix of the type P is called a rotation matrix. It will be shown soon that any 2×2 real orthogonal matrixes with determinant equal to 1 is a rotation matrix.

Journal of Theoretical and Applied Information Technology 10th May 2014. Vol. 63 No.1
© 2005 - 2012 JATIT & LLS. All rights reserved.
ISSN: 1992-8645 www.jatit.org E-ISSN: 1817-3195
222
4. RESULTS The data in this study using two data samples,
i.e. samples derived from data bank of parasitic image[2] and immediate retrieval of samples. The process of collecting samples of blood preparations directly assisted by paramedics and laboratory staff of health centers. Figure 2 is an image containing blood samples for malaria parasites and converted to gray scale image. From each image of the parasites obtained values of second-order statistical feature such as Angular Second Moment (ASM), Contrast, Correlation, Variance, Inverse Difference Moment (IDM), and Entropy. Table 1 show of the average values of it.
Figure 2: Image of Malaria Parasites[1][2]
Tabel 1: The Average Values of Second Order Statistical
Feature of Malaria Parasite
Figure 3 show plots of raw data in six dimensions which is measured from second order statistical features. This Figure show the randomized input of four kinds of malaria parasite. So very difficult to classified.
To make PCA works properly, the mean must be subtracted from each of the data dimensions. The mean subtracted is the average across each dimension. Hence, all of the values have x (the mean of the x values of all the data points) subtracted, and all the y values have y subtracted from them. This produces a data set whose mean is zero.
The data have been normalized to zero and then do the calculations to obtain the value of its covariance matrix that would be obtained eigenvalues and eigenvector. Eigenvector calculation results are then used as a multiplier to determine the direction and the axis of the main components of the new data obtained from the 2x2 transformation matrix angle order for the two inputs that produce the characteristic two-dimensional plot. Plots of the PCA result showed in Figure 4.
Figure 3: Plots of Raw Data in Six Dimensions
Figure 4 (a) show plot of the results of the principal component (PC) ASM on raw data value of contrast throughout the plasmodium falciparum, plasmodium vivax, plasmodium ovale and plasmodium malaria have not been able to provide significant separation for each class in the malaria parasite. It is also the case for the value of PC of the ASM to the variance (figure 4 (c)), the ASM to the IDM (Figure 4 (d)), the entropy to the ASM (Figure 4 (e)) and the contrast to the variance (Figure 4 (g)). The separations for each class of decoupling results were also not significant.
Gametosit Ring Schizonts Trophozoite
(a) Plasmodium falciparum
(b) Plasmodium Vivax
(c) Plasmodium Ovale
(d) Plasmodium Malariae
0 0.1 0.20
0.1
0.2
AS
M
0 100 2000
0.1
0.2
0.70.80.90
0.1
0.2
0 100020000
0.1
0.2
0 0.5 10
0.1
0.2
5 10 150
0.1
0.2
0 0.1 0.20
100
200
cont
ras
0 100 2000
100
200
0.70.80.90
100
200
0 100020000
100
200
0 0.5 10
100
200
5 10 150
100
200
0 0.1 0.2
0.70.80.9
corre
latio
n
0 100 200
0.70.80.9
0.70.80.9
0.70.80.9
0 10002000
0.70.80.9
0 0.5 1
0.70.80.9
5 10 15
0.70.80.9
0 0.1 0.20
1000
2000
varia
ns
0 100 2000
1000
2000
0.70.80.90
1000
2000
0 100020000
1000
2000
0 0.5 10
1000
2000
5 10 150
1000
2000
0 0.1 0.20
0.5
1
IDM
0 100 2000
0.5
1
0.70.80.90
0.5
1
0 100020000
0.5
1
0 0.5 10
0.5
1
5 10 150
0.5
1
0 0.1 0.25
10
15
entro
py
ASM0 100 200
5
10
15
contras0.70.80.9
5
10
15
correlation0 10002000
5
10
15
varians0 0.5 1
5
10
15
IDM5 10 15
5
10
15
entropy
Journal of Theoretical and Applied Information Technology 10th May 2014. Vol. 63 No.1
© 2005 - 2012 JATIT & LLS. All rights reserved.
ISSN: 1992-8645 www.jatit.org E-ISSN: 1817-3195
223
(a) (b) (c)
(d) (e) (f)
(g) (h) (i)
(j) (k) (l)
(m) (n) (o)
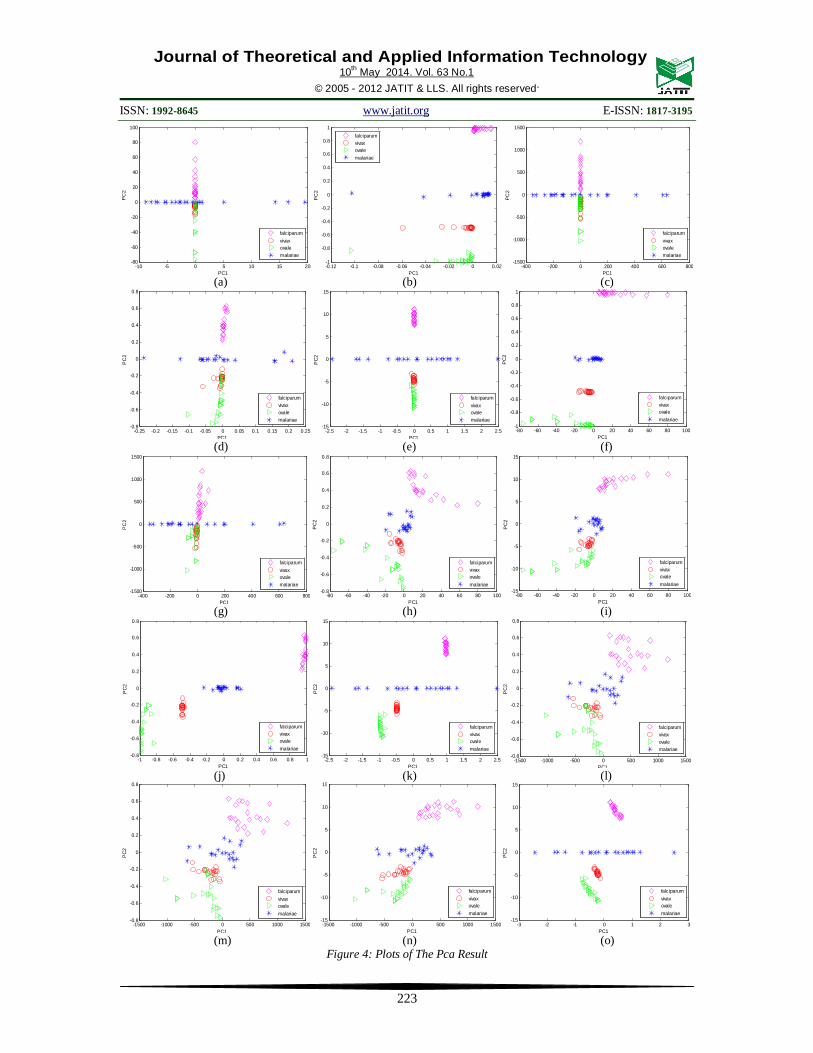
Figure 4: Plots of The Pca Result
-10 -5 0 5 10 15 20-80
-60
-40
-20
0
20
40
60
80
100
PC1
PC
2
falciparumvivaxovalemalariae
-0.12 -0.1 -0.08 -0.06 -0.04 -0.02 0 0.02-1
-0.8
-0.6
-0.4
-0.2
0
0.2
0.4
0.6
0.8
1
PC1
PC
2
falciparumvivaxovalemalariae
-400 -200 0 200 400 600 800-1500
-1000
-500
0
500
1000
1500
PC1
PC
2
falciparumvivaxovalemalariae
-0.25 -0.2 -0.15 -0.1 -0.05 0 0.05 0.1 0.15 0.2 0.25-0.8
-0.6
-0.4
-0.2
0
0.2
0.4
0.6
0.8
PC1
PC
2
falciparumvivaxovalemalariae
-2.5 -2 -1.5 -1 -0.5 0 0.5 1 1.5 2 2.5-15
-10
-5
0
5
10
15
PC1
PC
2
falciparumvivaxovalemalariae
-80 -60 -40 -20 0 20 40 60 80 100-1
-0.8
-0.6
-0.4
-0.2
0
0.2
0.4
0.6
0.8
1
PC1
PC
2
falciparumvivaxovalemalariae
-400 -200 0 200 400 600 800-1500
-1000
-500
0
500
1000
1500
PC1
PC
2
falciparumvivaxovalemalariae
-80 -60 -40 -20 0 20 40 60 80 100-0.8
-0.6
-0.4
-0.2
0
0.2
0.4
0.6
0.8
PC1
PC
2
falciparumvivaxovalemalariae
-80 -60 -40 -20 0 20 40 60 80 100-15
-10
-5
0
5
10
15
PC1
PC
2
falciparumvivaxovalemalariae
-1 -0.8 -0.6 -0.4 -0.2 0 0.2 0.4 0.6 0.8 1-0.8
-0.6
-0.4
-0.2
0
0.2
0.4
0.6
0.8
PC1
PC
2
falciparumvivaxovalemalariae
-2.5 -2 -1.5 -1 -0.5 0 0.5 1 1.5 2 2.5-15
-10
-5
0
5
10
15
PC1
PC
2
falciparumvivaxovalemalariae
-1500 -1000 -500 0 500 1000 1500-0.8
-0.6
-0.4
-0.2
0
0.2
0.4
0.6
0.8
PC1
PC
2
falciparumvivaxovalemalariae
-1500 -1000 -500 0 500 1000 1500-0.8
-0.6
-0.4
-0.2
0
0.2
0.4
0.6
0.8
PC1
PC
2
falciparumvivaxovalemalariae
-1500 -1000 -500 0 500 1000 1500-15
-10
-5
0
5
10
15
PC1
PC
2
falciparumvivaxovalemalariae
-3 -2 -1 0 1 2 3-15
-10
-5
0
5
10
15
PC1
PC
2
falciparumvivaxovalemalariae
Journal of Theoretical and Applied Information Technology 10th May 2014. Vol. 63 No.1
© 2005 - 2012 JATIT & LLS. All rights reserved.
ISSN: 1992-8645 www.jatit.org E-ISSN: 1817-3195
224
Grouping of class better than the results of the plot happens to characterize the PC value of the contras to the IDM (Figure 4 (h)). This result also was synonymous with the entropy feature to the contras (Figure 4 (i)), the correlation to the entropy (Figure 4 (l)), the variant to the IDM (Figure 4 (m)) and the variance to the entropy (Figure 4 (n)). In this grouping, class plasmodium falciparum, plasmodium malariae already well separated, but the plasmodium vivax and plasmodium class ovale overlap still occurs. So when do further training will possibly lead to errors in classification.
Figure 4 (j), (k) and (o) show the results of the classification are relatively more assertive in classifying the class of the malaria parasite. However, the PC value of the correlation of the variance, the correlation to the IDM, and the IDM to the entropy still allows the occurrence of errors in classification. This is due to plasmodium falciparum class members tending to put a zero in his class at the axis y axis. Thus there will be a cross member of the class.
The best results of classification using PCA is to a major component of the feature of the correlation to the ASM (Figure 4 (b)) and the contras to the correlation (Figure 4 (f)). From the graph it was clear that each class of malaria parasites can be grouped on the x axis. Thus there will be no class member malaria parasite mutually disjoint or overlapping.
5. CONCLUSION
The experimental results show that second order statistical measurement combined with principal component analysis method is promising to distinguish the types of malaria parasite images. The best combination of the principal components of the feature value the correlation to the ASM, and the contrast to the correlation can separate classes of malaria parasites. Further experiments should be coupled with spectral and structural methods for analysis. REFRENCES: [1] http://www.rph.wa.gov.au/labs/haem/malaria [2] http://www.dpd.cdc.gov [3] Sio, Selena W.S., Weiling Sun, Saravana
Kumar, Wong Zeng Bin, Soon Shan Tan, Sim Heng Ong, Haruhisa Kikuchi, Yoshiteru Oshima, Kevin S.W. Tan. “MalariaCount: An image analysis-based program for the accurate determination of parasitemia”. Elsevier. 2006
[4] Minh-Tam Le, Timo R Bretschneider, Claudia Kuss and Peter R Preiser. “A novel semi-
automatic image processing approach to determine Plasmodium falciparum parasitemia in Giemsa-stained thin blood smears”. BMC Cell Biology 2008, 9:15 doi:10.1186/1471-2121-9-15. 2008.
[5] Gloria Díaz, Fabio A. González, Eduardo Romero. “A semi-automatic method for quantification and classification of erythrocytes infected with malaria parasites in microscopic images”. Journal of Biomedical Informatics 42 (2009) 296–307. 2009.
[6] Charles Ma, Paul Harrison, Lina Wang, Ross L Coppel. “Automated estimation of parasitaemia of Plasmodium yoelii-infected mice by digital image analysis of Giemsa-stained thin blood smears”. Malaria Journal, 9:348. 2010.
[7] Wahab, Iis H A., Adhi Susanto and Litasari. “Classification of Plasmodium falciparum Using Learning vector quantization Neural Network”. Proceeding of International Conference on Biomedical Engineering, pp 17. Surabaya, Indonesia. 2008.
[8] Wahab, Iis H A., Adhi Susanto dan Litasari. “Pengaruh Penggunaan Tapis Bilateral Terhadap Akurasi Identifikasi Plasmodium falciparum Pada Jaringan Syaraf Tiruan Learning vector quantization”. Prosiding pada Seminar Ilmiah Ilmu Komputer Nasional, halaman E21-27. Karawaci, Tanggerang, Indonesia. 2008.
[9] Wahab, Iis H A, Adhi Susanto, P. Insap Santosa, dan Maesadji.T. “Comparison of Cross Entropy Method, Optimize Learning Vector Quantization and Fuzzy Learning Vector Quantization for Classification of Plasmodium Falciparum”. Proceeding SITIA 2011. Institut Teknologi Sepuluh November. Surabaya. 2011.
[10] Subhamoy Mandal, Amit Kumar, J Chatterjee, Manjunatha and Ajoy K. “Segmentation of Blood Smear Images using Normalized Cuts for Detection of Malarial Parasites”. Annual IEEE India Conference (INDICON) 978-1-4244-9073-8/10. 2011.
[11] Vishnu V. Makkapati, Reghuveer M. Rao. “Segmentation of Malaria Parasites in Pheriperal Blood Smear Images”. ICASSP 2009. 978-1-4244-2354-5/09. 2009.
[12] F Boray Tek, Andrew G Dempster and Izzet Kale. “Computer vision for microscopy diagnosis of malaria”. Malaria Journal. 2009
[13] Mohammad Imroze Khan, Bhibhudendra Acharya, Bikesh Kumar Singh & Jigyasa Soni. ‘Content Based Image Retrieval

Journal of Theoretical and Applied Information Technology 10th May 2014. Vol. 63 No.1
© 2005 - 2012 JATIT & LLS. All rights reserved.
ISSN: 1992-8645 www.jatit.org E-ISSN: 1817-3195
225
Approaches for Detection of Malarial Parasite in Blood Images. International” Journal of Biometrics and Bioinformatics (IJBB), Volume (5) : Issue (2) : 2011 97.2011.
[14] J.SOMASEKAR. “Computer Vision for Malaria Parasite Classification in Erythrocytes”. International Journal on Computer Science and Engineering (IJCSE), ISSN : 0975-3397 Vol. 3 No. 6 June 2011
[15] Dian Anggraini, Anto Satriyo Nugroho, Christian Pratama, Ismail Ekoprayitno Rozi, Aulia Arif Iskandar, Reggio Nurtanio Hartono. “Automated Status Identification of Microscopic Images Obtained from Malaria Thin Blood Smears”. International Conference on Electrical Engineering and Informatics. Bandung, Indonesia. 2011.
[16] Maombi Edison, J.B Jeeva and Megha Singh. “Digital Analysis of Changes by Plasmodium Vivax Malaria in Erythrocytes”. Indian Journal of Experimental Biology. Vol. 49, January 2011. pp. 11 – 15. 2011.
[17] S. S. Savkare, S. P. Narote. “Automatic Classification of Normal and Infected Blood Cells for Parasitemia Detection”. International Journal of Computer Science and Network Security, VOL.11 No.2, February 2011
[18] Jigyasha Soni. “Advanced Image Analysis Based System for Automatic Detection of Malaria Parasite in Blood Images Using SUSAN Approach”. International Journal of Engineering Science and Technology. Vol. 3 No. 6 June 2011.
[19] Premaratne, S P., Nadira Dharshani Karunaweera., Shyam Fernando., W Supun R Perera., and R P Asanga S Rajapaksha. “A Neural Network Architecture for Automated Recognition of Intracellular Malaria Parasites in Stained Blood Films”. 2006.
[20] Gonzalez, R.C., Richard E. Woods, "Digital Image Processing", Prentice-Hall, Inc., Upper Saddle River, New Jersey, 2008.
[21] Haralick, R. M., Shanmugam, K., Dinstein, I., "Textural features for image classification", IEEE Trans. Syst., Man, Cybern., SMC, 1973.
[22] K. Z. Mao,. “Identifying Critical Variables of Principal Components for Unsupervised Feature Selection”. IEEE Transactions On Systems, Man, And Cybernetics—Part B: Cybernetics, Vol. 35, No. 2, April 2005
[23] Nurhayati, O.D, Th.Sri W, A.Susanto, Maesadji T., Principal Component Analysis for Thermal Images Classification, International Journal of Electronics Engineering Research (IJEER), December, New Delhi, India. 2010.
.