welcome to chevron lubricant lanka plc. - keeping our · 2017-03-28 · we have always counted on...
TRANSCRIPT

Chevron Lubricants Lanka PLCAnnual Report 2016www. chevron.lk
1
Keeping our
Chevron Lubricants Lanka PLCAnnual Report 2016

Chevron Lubricants Lanka PLCAnnual Report 2016www. chevron.lk
2

Annual Report 2016
Chevron Lanka has delivered yet another year of outstanding results. Your company stood strong, engaging with the issues, working on intelligent solutions and increasing our focus on stakeholder value creation.
We have always counted on our strong local and global synergies and the unmatched expertise in technology and industry innovation we own. Over the years we have shared this knowledge, continuing our vision to bring a positive impact to the people and communities we serve, while significantly contributing to the economy of Sri Lanka.
FocusKeeping our

2
Contents
Annual Report Onlinewww.chevron.lk/reports
4 Our Vision5 Financial Highlights 6 Chairman’s Review8 Managing Director’s Review
12 Board of Directors16 Management Team18 Management Discussion & Analysis27 Financial Review31 Corporate Social Responsibility33 Corporate Governance39 Risk Management
42 Financial Calender43 Annual Report of the Directors46 Statement of Directors’ Responsibilities47 Audit Committee Report48 Related Party Transactions Review Committee
Report 49 Certificate of the Director on Transfer Pricing50 Remuneration Committee Report51 Independent Auditor’s Report52 Income Statement 53 Statement of Comprehensive Income54 Statement of Financial Position55 Statement of Changes in Equity56 Cash Flow Statement57 Notes to the Financial Statements84 Ten Year Financial Summary85 Statement of Value Added 86 Shareholder Information 89 Notice of Annual General Meeting90 Corporate Information91 Form of Proxy

3
Chevron Lubricants Lanka PLC engages in blending, manufacturing, importing, distributing and marketing lubricants oils, greases, brake fluids and specialty products in Sri Lanka. The Company offers its products for industrial, commercial and consumer applications. Chevron Lubricants PLC markets its products under Chevron, Caltex and Texaco brands. The Company was incorporated in 1992 and is based in Colombo, Sri Lanka.
Our Family of Brands

Chevron Lubricants Lanka PLC
4
VisionTo be the pre-eminent marketer of lubricants in Sri Lanka differentiated by its people, partnerships and performance.
Our ValuesOur company’s foundation is built on our values, which distinguish us and guide our actions to deliver results. We conduct our business in a socially and environmentally responsible manner, respecting the law and universal human rights to benefit the communities where we work.
Diversity and inclusion
We learn from and respect the cultures in which we operate. We have an inclusive work environment that values the uniqueness and diversity of individual talents, experiences and ideas.
High performance
We are passionate about delivering results, and strive to continually improve. We hold ourselves accountable for our actions and outcomes. We apply proven processes in a fit-for-purpose manner and always look for innovative and agile solutions.
Integrity and trust
We are honest with ourselves and others, and honor our commitments. We trust, respect and support each other. We earn the trust of our colleagues and partners by operating with the highest ethical standards in all we do.
Partnership
We build trusting and mutually beneficial relationships by collaborating with our communities, governments, customers, suppliers and other business partners. We are most successful when our partners succeed with us.
Protect people and the environment
We place the highest priority on the health and safety of our workforce and protection of our assets, communities and the environment. We deliver world-class performance with a focus on preventing high-consequence incidents.

Annual Report 2016
5
FinancialHighlights
2016Rs. 000’
2015Rs. 000’
%
Turnover 12,089,111 11,563,854 5%Profit Before Tax & OCI 4,702,671 4,318,544 9%Taxation 1,222,261 1,226,709 0%Profit After Tax 3,480,410 3,091,835 13%Shareholders Funds 3,860,623 4,687,029 -18%Property, Plant & Equipment 2,132,858 2,195,826 -3%
Gross Dividends Rs. 000' 4,320,000 2,760,000 57%Dividend per Share Rupees 18.00 11.50 57%Earnings per Share Rupees 14.50 12.88 13%Dividend Payout Ratio % 124 89 35%Price Earnings Ratio Times 10.83 13.35 -19%Market Value per Share as at 31st December Rupees 157.10 344.00 -9%Return on Equity % 81 63 18%Net Assets per Share Rupees 16.09 19.53 -18%Net Income to Turnover % 29 27 2%
(Note: Dividend per share, Earnings per share and Net Assets per share for 2015 has been restated for comparative purposes, following the share sub
division in 2016.)
Gross Dividends
2012 2013 2014 2015 2016
Rs. Mn.
0500
1,0001,500
2,0002,5003,0003,5004,0004,5005,000
1,320 1,8
00
2,40
0
2,76
0
4,32
0
Profit After Tax & ROE
2012 2013 2014 2015 2016
PAT: Rs. Mn. ROE : %
0
500
1,000
1,500
2,000
2,500
3,000
3,500
4,000
0102030405060708090
Profit After Tax ROE
2,26
662
%
56% 55
% 63%
81%
2,53
2
2,76
5
3,09
3 3,48
0

6
Chevron Lubricants Lanka PLC
Chairman’sReview
Backed by strong earnings and cash flows, the Company declared dividends amounting to Rs. 18.00 per share compared to Rs. 11.50 last year.
in all three markets we operate in, even stepping up marine oil supplies to ships with our strong and strategic customer focus coupled with advanced lubricants technology. We must not forget that an important contributor to our strong performance is our highly motivated workforce which we have equipped with the right tools, knowledge and technology. They have been instrumental in delivering these results. We continue to invest in developing our workforce further while simultaneously upholding our reputation as a responsible corporate citizen.
QHow do you perceive the future outlook for the company?
The Company is engaged in a vital segment of the downstream petroleum industry, providing lubrication products from basic to most demanding and extreme applications. Keeping in mind the expected growth in Sri Lanka’s economy, the realization of the GSP+ status, bilateral agreements, establishment of industrial zones, large
infrastructure projects and the growth in the tourism industry, the demand for high quality lubricants for both automotive and industrial applications should grow proportionately. Our journey so far and the strength we derive from access to advances in technology would help us benefit from increased consumption. On the other hand, the depreciation of the rupee and increase in base oil prices will affect the margins. However, we are optimistic that the company would be able to deliver sustainable value to our shareholders.
I wish to thank my fellow Board members for their counsel and also extend my gratitude to our business partners, local and overseas distributors, channel partners, customers and shareholders for their continued support and confidence in the Company. We remain committed to delivering value to our shareholders by strengthening our performance with each passing year.
FaRRukh SaeedChairman
QHow do you view the company’s performance in FY 2016?
I am proud to report that the Company has once again delivered exceptional results not only in terms of the bottom line, but in the volumes and revenues achieved in its domestic and export sectors. Export sales recorded an increase of 20% compared to the previous year. Backed by strong earnings and cash flows, the Company declared dividends amounting to Rs. 18.00 per share compared to Rs. 11.50 last year. The Company also carried out a subdivision of shares during the year, thus increasing the number of shares from 120 million to 240 million shares with a view of increasing liquidity in the market.
QWhat would you say were the key drivers of your strong performance?
The key performance driver during the year was improved margins as a result of favourable base oil prices during the first two quarters of the year. Although base oil prices displayed an upward trend during the last two quarters, the Company was able minimize its impact by importing higher parcel sizes. This was possible due to the increased storage capacity at the new plant. We were able to grow the volumes

7
Annual Report 2016
Farrukh SaeedChairman
FaRRukh SaeedChairman

8
Chevron Lubricants Lanka PLC
Managing Director’sReviewQGrowing the company by 13% despite low growth in the industry has been a phenomenal achievement …
Our ability to adapt to daunting industry conditions and yet deliver strong earnings reflects our competitive spirit which is fuelled by best-in-class systems and processes and a proactive approach to management. If any proof of our razor-sharp focus is needed, it is evident in this year’s best-ever financial performance by the Company, which recorded earnings of Rs. 3,480 million. This growth reflects an increase of 13% over the previous year, while underscoring the fact that we succeeded in growing volumes consecutively for the last two years, despite the prevalence of challenging macroeconomic and industry conditions. The company also recorded volume growth in its export markets in Bangladesh and Maldives.
QWhat went well during the year?
The impeding factors of the overall macro-economic environment remained less volatile, although the sharp decline in motor vehicle imports due to higher tariffs was an impediment to growth in demand. The average
base oil prices softened during the year, although prices started moving up during the third and fourth quarter. The increased demand for thermal energy due to the lack of rains resulted in higher demand for lubricants from the power plants. We were able to secure as well as win back some of the government customers based on competitive bidding. Our strong product and service propositions, supply chain capabilities and long track record of reliability also helped in securing these customers. Favourable conditions in rubber manufacturing sectors also led to higher demand. We were able to grow export volumes particularly in Bangladesh. Export sales helped in reducing our income tax as income tax for exports is lower. Further, we passed on the benefit of lower raw material prices realized through sourcing efficiencies with a number of promotional offers including free offers to our customers both in local and export markets.
If any proof of our razor-sharp focus is needed, it is evident in this year’s best-ever financial performance by the Company, which recorded earnings of Rs. 3,480 million.
QHow did you strengthen the Company’s Brands equity?
The setting up of retail lube shops continued during the year. We launched marketing campaigns in the digital space during the year and the response has been extremely good. The transition of our flag ship service channel branding from STAR LUBE to STAR CARE is now almost completed for the existing sites. The service value proposition was further strengthened with channel partner education. The value selling based on the principles of ‘Reliability Based Lubrication’ for industrial customers really differentiates us from our competition.
QAny other milestones achieved during the year?
I am proud to say that we completed 15 years of incident-free operations, without a single day away from work due to injury in the workplace. This is perhaps a record in Sri Lanka’s

9
Annual Report 2016
deShamanya dR. kiShu GomeSManaging Director

10
Chevron Lubricants Lanka PLC
Managing Director’s Review
industrial sector and a direct contribution to enhancing national productivity levels. Safety is our No. 1 priority and this flawless safety record reflects the seriousness with which we pursue worker safety at Chevron Lanka.
QHow do you see your team’s achievements?
Our human capital continues to be the driving force behind our success. Chevron Lanka enjoys a low attrition rate as a result of our empowering work culture, further reinforced by a culture of learning and development. In fact, our training and development policy ensures that skills are constantly refreshed and upgraded and that we add value to the careers of our employees, giving them room to grow both personally and professionally. At the end of the day, business is about people, which makes a knowledgeable and committed team - such as the one we have - an asset. We never fail to recognize achievements through annual awards functions for staff, distributors and other partners. These events enable us to share our success in their achievements and our mutual pride for the company.
QYou have been outspoken about the challenges facing the lubricants industry in the past…Do the same concerns linger on today?
Many of the challenges of the past are now being addressed by the authorities concerned which is a heartening development for the future well-being of the industry. For instance, the HS code for the import of synthetic finished lubricants was not subject to duties. It has recently been re-classified and is now subject to duties similar to mineral based finished lubricants. Moving ahead, the biggest challenge to the industry will come from unlicensed players operating in the market, whose activities are likely to cause a revenue loss to the state by way of reduced duties and license fees and put consumers at risk as there is little quality control over the products sold by unlicensed players. However, the industry on the whole is hopeful of the outcomes of the actions taken by the ministry of petroleum resources development by way of appointment of a committee to look into these illegal activities and instructing the Police to apprehend and prosecute the illegal operators.
QWhat would your wish-list for the industry consist of?
The Public Utilities Commission should be given the powers to regulate the industry. The necessary legislation has to be passed for this purpose. The industry needs to be regulated more strictly to eliminate unethical practices by some players. Meanwhile strict action should be taken under existing regulations. An independent lab capable of testing lubricant properties should be established in order to monitor imports.
QChevron Lanka has continued to add value to its reputation as a responsible corporate citizen. How was the year 2016 in this regard?
I would characterize our CSR projects during the year as being highly impactful! Enhancing road safety remained a key focus and we carried several campaigns and activities, as described in the CSR section in this annual report. By reinforcing positive behaviour of drivers and conducting seminars on road safety, we were able to make people stop and think of the importance of road safety and to become conscious of it. Our close interaction with the Traffic Police to disseminate safety awareness has

11
Annual Report 2016
helped us reach a wider audience. As a Company, we spend a lot of time and resources educating all our relevant stakeholders by sharing our knowledge with many training institutes. For example, we have a longstanding relationship with the German Technical Training Institute, a premier automobile institute, dating back 17 years. We have also continued our efforts on raising awareness about HIV and AIDS.
QHow does Chevron Lanka plan to chart its future course?
We would continue to leverage on our brand strength, operational excellence and customer focus. Our focus on building brand equity will remain unswerving as we execute our plans to take the brands closer to consumers and achieve greater market penetration. We look forward to strengthening our footprint in our two export markets through increased market penetration. We will continue to look for opportunities to increase capacity utilization. We will continue to grow shareholder value while endeavoring to maintain our position as the pre-eminent marketer of lubricants in Sri Lanka.
deShamanya dR. kiShu GomeSManaging Director

Chevron Lubricants Lanka PLC
12
Board of Directors
Farrukh SaeedChairmanMr. Farrukh Saeed currently functions as the Vice President - Lubricants Asia Pacific. His previous assignments include General Manager Lubricants, Europe, Africa and Middle East; several positions in fuels (marketing and operations) and lubricants including governance and P&L responsibilities in Joint Ventures. He also served at the Head Quarters in the support role as advisor for Asia and Africa markets. He counts over 30 years’ experience across a variety of business disciplines at Chevron.
Mr. Saeed has a Bachelor of Science degree in Chemical Engineering and Masters in Business Administration.
Deshamanya Dr. Kishu GomesManaging Director / Chief Executive OfficerMr. Kishu Gomes was appointed to the Board in 2000. Fellow member of the Chartered Institute of Marketing, UK, he holds an MBA from the University of Leicester, UK.
He joined Caltex in 1997 and rose steadily to become the first Sri Lankan Managing Director / CEO of Caltex Lubricants Lanka Limited and Caltex Ceylon Limited in 2001.
He was a Past President of the American Chamber of Commerce and held the position of Senior Vice-Chairman of the Chartered Institute of Marketing, UK local branch.
Amongst many awards won by Kishu are the 2 Inaugural Awards; Marketer of the Year awarded in 2001 and Best Young Director of the Year Award in 2003. He was also winner of the prestigious TOYP Award; Most Outstanding Young Persons in Sri Lanka in 2003 for Business Leadership and won the Pinnacle Award as the best Business Leader in the large category in Sri Lanka in 2004 from Chartered Institute of Management Accountants, UK, Sri Lanka branch. He was a Vice Patron of the Institute of Automotive Engineers, Sri Lanka. Kishu was a past President of Lanka Business Coalition on HIV and AIDS and sits on the Board of Sri-Lanka AIDS Foundation too.
He counts over 30 years of experience working for US multinationals having started his career at Coke in 1984.

Annual Report 2016
13
Anura PereraDirector / Chief Financial OfficerAppointed to the Board in 2002, Mr. Anura Perera holds a B. Com Honours Degree from the University of Kelaniya and Post Graduate certificates in Human Resources Management and Management from PIM Sri Lanka and University of Leicester, UK respectively. He is a Fellow member of the Institute of Chartered Accountants of Sri Lanka and a member of the Chartered Institute of Management Accountants, (UK), (ACMA/CGMA). He is the Alternate chairman of the Conference Technical Committee and Alternate Chairman of the Business School Committee of CA Sri Lanka. He joined the Company in 1996 as Deputy Manager Finance and Administration and was promoted as Manager Finance and Administration in 1997 and as General Manager in 2000. He counts more than 25 years’ of senior managerial experience in Accounting and Finance. He also functions as a Director of Chevron Ceylon Limited.
Richard BrownNon Executive DirectorMr. Richard Brown has over 35 years of both Upstream and Downstream oil industry experience with Chevron and substantial financial and management expertise. His current role is Regional Finance Officer - Asia Pacific, based in Singapore, a position he took up in September 2012. Previously, he was based in London working as Chevron’s General Manager, Finance for the Europe, Eurasia and Middle East Operating Company. In his career, Mr. Brown has worked in many overseas locations including the UK, Norway, Kazakhstan and Angola and visited many others.
Mr. Brown holds a Bachelor of Arts (Economics) from the University of Warwick (UK).

Chevron Lubricants Lanka PLC
14
Board of Directors
Desamanya Deva RodrigoNon Executive DirectorMr. Deva Rodrigo FCA, former Territory Senior Partner of PricewaterhouseCoopers, Sri Lanka and Maldives, and past Chairman of the Ceylon Chamber of Commerce has served as an Independent Non- Executive Director of Chevron Lubricants Lanka PLC since 2009.
He is also a Non-Executive Director of Taprobane Holdings PLC and Cargills Ceylon PLC.
He has held public sector appointments as a member of the Monetary Board of the Central Bank of Sri Lanka, the Administrative Reforms Committee, National Council for Administration, Presidential Commission on Trade and Tariffs, Telecom Regulatory Commission and Director of Peoples Bank.
Mr. Rodrigo qualified as a Chartered Accountant in 1972. He is a product of Ananda College, Colombo.

Annual Report 2016
15
S. H. Amarasekera P.C.Non Executive DirectorMr. Amarasekera, President’s Counsel is a leading Lawyer in Sri Lanka having a wide practice in the Original Courts as well as in the Appellate Courts, specializing in Commercial Law, Business Law, Securities Law, Banking Law and Intellectual Property Law.
He also serves as an Independent Director in several leading listed companies in the Colombo Stock Exchange including CIC Holdings PLC (Chairman), Chemanex PLC (Chairman), Vallibel One PLC, Royal Ceramics Lanka PLC, Expo Lanka Holdings PLC, Amana Bank PLC, Vallibel Power Erathna PLC & Amaya Leisure PLC. He is also the Chairman of CIC Agri Business (Private) Limited.
Chevron Lubricants Lanka PLC
16
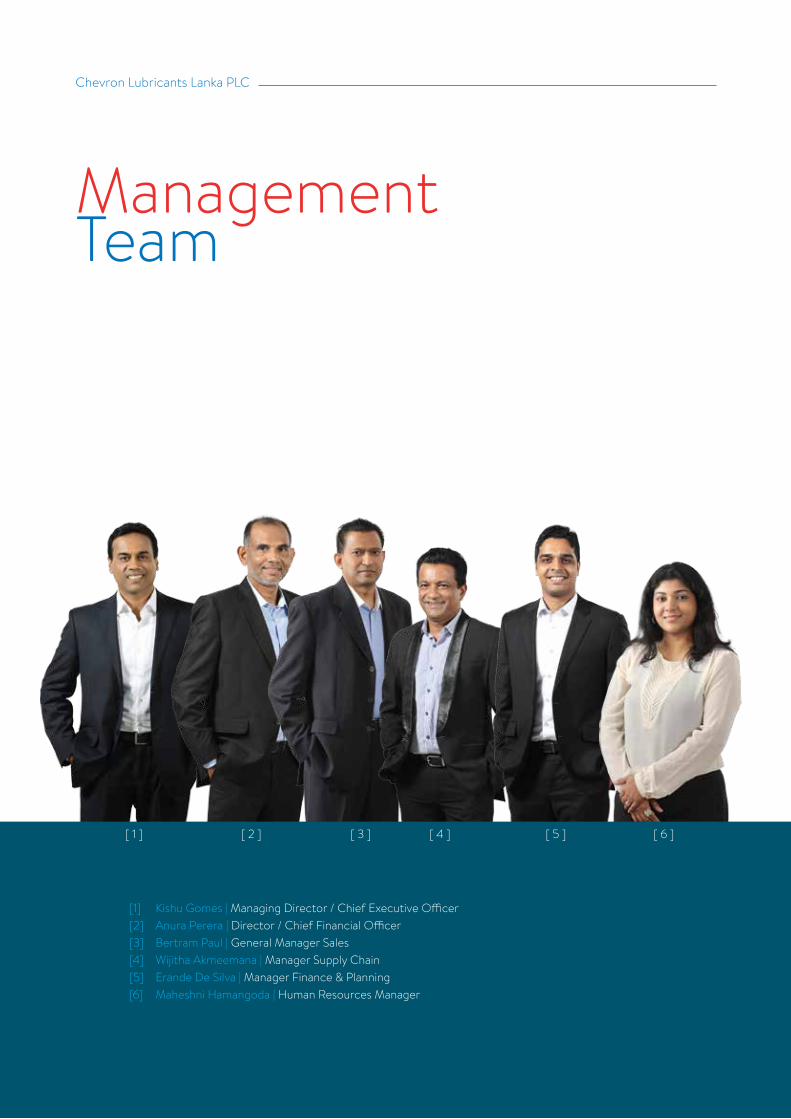
ManagementTeam
[1] Kishu Gomes | Managing Director / Chief Executive Officer[2] Anura Perera | Director / Chief Financial Officer[3] Bertram Paul | General Manager Sales[4] Wijitha Akmeemana | Manager Supply Chain[5] Erande De Silva | Manager Finance & Planning[6] Maheshni Hamangoda | Human Resources Manager
[ 1 ] [ 2 ] [ 3 ] [ 4 ] [ 5 ] [ 6 ]

Annual Report 2016
17
[7] Sumith Hewavitharana | Indirect Sales Manager[8] Hilary Fernando | Lead Technical Manager [9] Thushari Weragoda | Laboratory & Quality Assurance Lead[10] Upali Wijesinghe | Logistics Manager[11] Thusitha De Silva | Direct Sales Manager[12] Eenaz Salie | Marketing Manager
[ 7 ] [ 8 ] [ 9 ] [ 10 ] [ 11 ] [ 12 ]

18
Chevron Lubricants Lanka PLC
> Economic Overview> Lubricant Industry> Sales> Export Markets> Marketing> Product Technology> Supply Chain> Protecting people
Management Discussion & Analysis

19
Annual Report 2016
The government adopted several measures to curb the widening fiscal deficit, foremost being the increase in indirect taxes.
second and third quarter of the year and lackluster demand from major export destinations. Out of the key sub-segments which indicated growth during the period; construction, manufacturing of the industrial sector, wholesale and retail trade activities and financial services of the service sector were prominent contributors.
The annual average inflation was estimated at 4.0% (3.8% in 2015), whilst core inflation increased to 5.9% (4.6% in 2015) based on the National Consumer Price Index (2013=100).
Based on the Central Bank of Sri Lanka data, the external sector recorded a balance of payments deficit during the ten months to October 2016. This is a consequence of the widening trade deficit despite a growth in earnings from tourism and worker’s remittances. Export earnings were adversely affected by the decline in industrial exports and agricultural exports. Although textile and garment exports recorded a growth in both traditional and non-traditional markets, industrial exports were set
economic overviewThe economic climate was overshadowed by inconsistencies in tax policy implementation vis-à-vis the 2016 national budget proposals. The government adopted several measures to curb the widening fiscal deficit, foremost being the increase in indirect taxes. However, the revisions that ensued at various intervals during the year led to a “stop-start” business sentiment which partly constrained the smooth flow of business activities. Additionally, the increase in indirect tax had a cascading effect on disposable income, inflation and consumption, particularly towards the latter months of the year.
The GDP was estimated to have grown by 4% during the first nine months of 2016 compared to the 4.8% growth recorded during the same period in 2015 (as per Central Bank of Sri Lanka data). The Industrial and Service sectors primarily accounted for the growth estimated during the period, whilst the agricultural sector remained subdued due to the adverse weather conditions that prevailed during the

20
Chevron Lubricants Lanka PLC
Management Discussion & Analysis
back due to the decline in exports of petroleum products and transport equipment, whilst the decline in tea exports plagued the performance of agricultural exports. Import expenditure recorded a growth during the parallel period as expenditure on investment goods vis-à-vis the machinery and equipment, building material increased. However, certain positive strides were made in curtailing import expenditure on consumer goods and intermediate goods. The decline in vehicle imports during the year was directly influenced by the higher import tariffs levied on motor vehicles which helped curb expenditure on consumer goods, whilst the relatively lower prices obtained on fuel imports helped curtail expenditure on intermediate goods.
The financial flows through the capital account were starved by the lower proportion of foreign direct investments to the country, net outflows recorded in foreign investments vis-a-vis the Colombo Stock Exchange and government securities. However, the government managed to secure a higher proportion of term loans during the period compared to 2015. Though an overall BOP Deficit was recorded during the ten months to October 2016, the deficit narrowed compared to the parallel period in 2015.
As per Central Bank of Sri Lanka the LKR depreciated by 3.8% during 2016, whilst the gross official reserves were
estimated at USD 6.1 billion and total foreign assets were estimated at USD 8.5 billion as at end October 2016 which equated 3.8 and 5.3 months of imports respectively.
Lubricant industryAgainst the backdrop of a 7% market volume growth recorded during 2015 (Source; PUCSL), we believe the lubricant industry was influenced by an array of factors during the year in review.
Amongst the factors that contributed towards growth, the following were noteworthy:
• Theincreaseinlubricantconsumption due to the variation in the source of energy mix to the national energy grid provided an impetus during the year. The lubricant intensive thermal power contribution to the energy grid increased significantly in 2016 as a substitute to hydro power, due to adverse weather conditions that prevailed and low rainfall in the hydro catchment areas during most part of the year. As a result, the government was also compelled to reactivate certain thermal power plants (IPPs) that were already phased out and decommissioned due to maturity of tenures in 2015.
• Wealsobelievedemandforlubricants was strengthened through growth realized in the
manufacturing sector of the country’s economy.
The growth in the registration of motor vehicles declined during 2016 to 8% compared to the 12% recorded during the previous year. This drop correlates directly to the reduction in vehicle imports. The sharp increase in import tariffs on motor vehicles as a measure to curb the widening trade deficit deterred vehicle imports to the country. Government also maneuvered the imposed rules on loan-to-value (LTV) ratio to curtail credit expansion and vehicle imports. These measures together with the depreciation of the LKR led to the decline of vehicle imports. Amongst some of the factors that stifled vehicles usage during the year, the decline in disposable income due to increase in indirect taxes and the rise in consumer inflation were prominent.
As per statistics of the Department of Motor Traffic, the registration of motor cycles continued to dominate with 69% of the composition of new motor vehicle registrations (55% in 2015), followed by three wheelers 11% (19% in 2015) and motor cars of 9% (16% in 2015). The overall vehicle population increased to 6.76 million in 2016 from 6.27 million recorded in 2015.

21
Annual Report 2016
The Company recorded an overall volume growth of 7%, which included a 20% growth in export volumes compared to 2015.
Total Motor Vehicle Registrations
2010 2011 2012 2013 2014 2015 2016
000’s 000’s
0
100
200
300
400
500
600
700
800
0
1,000
2,000
3,000
4,000
5,000
6,000
7,000
8,000
Total Motor Vehicle Registrations Motor Cycle RegistrationsVehicle Population
359
525
397
327
430
669
493
205
253
192
169
371
273
340
(Source: Department of Motor Traffic of Sri
Lanka)
Demand for lubricants from the agriculture and fisheries sector were disrupted by the adverse weather patterns. The adverse patterns of weather in the form of torrential rains and floods during May and droughts that persisted during most part of the year curtailed primary sectoral activities especially in the north and eastern provinces. Although the construction sector of the economy was estimated to have grown compared to the parallel period in 2015, the growth was skewed towards less lubricant intensive construction activities.
The gradual migration in consumer demand from lower-tier lubricants to higher-tier lubricants to reap the technological benefits continued
during the year. This entails the functional benefit of longer oil drain intervals, which consequentially compresses lubricant volumes in the industry due to less frequent oil fills. With the continuous upgrade of lubrication technology to meet the low emission standards and new engine designs, this phenomenon will continue in the lubricants industry.
The composition of the local lubricant industry remained unchanged with 13 players during the year, although the Government has proposed to issue new lubricant licenses, which is likely to take effect during 2017.
Sales2016 proved to be a successful year with overall Company volumes reaching a five year high, led by the Direct Channel (B2B Sector) and Exports to Bangladesh; while all sectors of the Company recorded growth over the prior year. It is certainly commendable that this level of performance was
achieved despite some of the natural disasters across the country, increased instances of product adulteration in the market, intense competition and aggressive price competition especially those playing in the lower tier segment of the market. The Company recorded an overall volume growth of 7%, which included a 20% growth in export volumes compared to 2015.
indirect Channel
The Indirect Channel had gathered a strong growth momentum during the first 4 months of the year and tracked above the parallel period in 2015. The positive strides made were temporarily halted by a major setback during the month of May due to strong winds and heavy rains that inundated 22 out of 25 districts with a record rainfall, causing floods and landslides displacing half a million people across the country. This natural disaster dented our growth in indirect channel volumes in a single month which took several months thereafter to recoup. However, we

22
Chevron Lubricants Lanka PLC
Management Discussion & Analysis
were able to ultimately record higher volumes during the year compared to 2015.
We leveraged on the success of the Consumer Promotion launched during the previous year and continued the scheme to drive volumes in the channel, offering one liter of engine oil free with consumer packs of 4 liter petrol engine oil and 5 liter diesel engine oil. This promotion proved to be quite popular with consumers and trade alike and resulted in several competitors aping same in less sophisticated ways.
Selective trade promotions were also run across different product categories, specifically targeted at outlets selling competitor products, which enabled us to gain significant volumes from competition during the year. Leveraging on brand equity of our products, we were able to secure these gains from competitors without matching the increasingly unsustainable trade terms offered by them, which aligned well with our overall strategy of profitable growth.
An attractive promotion themed “Lakshapathi Waram” offering One Hundred Thousand Rupees as prize money to each salesperson and support staff of Distributors for achieving set targets was also run during the latter part of the year, which contributed to the performance in the Indirect Channel.
However, the threat from product adulterators continued to intensify during the year, adversely affecting those channel partners who operate within the confines of ethics and the law of the land. While it is heartening to note recent initiatives formulated by the Petroleum Ministry in conjunction with the Police Department to crack down upon this menace, we are yet to see tangible results on ground from these efforts. However, based on complaints made by us, the Police were able to arrest and prosecute some perpetrators in some key areas.
direct Channel
The Direct Channel spearheaded growth in volumes for the Company over 2015. This was made possible by a series of wins in key tenders as well as the consumption increase in the Power Generation sector.
The most significant accomplishment was wining some of the governments tenders and particularly the Sri Lanka Transport Board Tender after a 3-year hiatus during which it was not opened to competitive bidding.
The power crisis which stemmed from the significant decline in the
During the year under review, we also undertook a concerted effort to improve distribution penetration in rural areas and focused upon increasing availability of recently launched products. Several initiatives were also undertaken to enhance skills and competencies of sales persons during the year, enabling us to focus on value selling in a market dominated by price based competition.
Another focus area in the year under review was in expanding our network of “Caltex Star-Care” branded service stations where several new outlets were added to the network along with conversions of the previous Star Lube and Delo Lube branded outlets, offering a superior customer value proposition in terms of service standards. A consumer promotion to draw customers into the revamped branded Service Station network was also carried out during the latter part of the year.

23
Annual Report 2016
contribution of hydro-power due to adverse weather conditions, benefited the lubricant industry due to the power generation mix changing in favour of more lubricant intensive thermal power generation. The recommissioning of plants of some Independent Power Producers (IPPs) whose contracts had been terminated in previous years led to increased volume contribution from this sector. This included an IPP whose operations were taken over by the CEB, which again was opened to competitive tender and won by the Company.
In a highly competitive environment characterized by aggressive price competition, our continued focus and emphasis on the total lubrication package, through our service offer of “Reliability Based Lubrication (RBL)” helped to sustain a segment of business with our key customers during the year. Strategic pricing on a selective basis, coupled with our RBL offering helped secure new customers and also increase sales to sectors such as railways and rubber processing. Our Sales and Service Engineers supported by our technology function continued to work on enhancing the knowledge base of our key customers through customer specific technical seminars. We were also able to leverage our newly built manufacturing facility to showcase our world class blending and testing capabilities through organized plant visits to key customers.
export marketsBangladesh
The Exports to Bangladesh grew steadily over 2015. The growth came from a mix of Consumer and Industrial channels with the latter being the key driver.
With strong support from the local Distributor, we were able to increase penetration levels beyond the capital city of Dhaka and the port city of Chittagong into new areas in South Bengal such as Khulna, Bogra, Rajshahi, Tangail and Sylhet through the appointment of sub distributors. In addition, various trade and consumer promotions were run which provided a boost in volumes of the Indirect Channel.
The Industrial sector also performed well with new business wins during the year in some high volume key customer accounts especially in the thermal power generation (heavy fuel and gas) industry segments. We also achieved another milestone in bulk supplies by shipping to key power generation customers in “flexi tanks” which was a first not only for Sri Lanka but for the Asia Pacific region of Chevron. This was achieved through strong collaboration between the local Sales and Supply Chain teams.
With market education being a constant focus in Bangladesh, a series of targeted key customer seminars and market visits were conducted to support the market and our distributor partner in Bangladesh.

24
Chevron Lubricants Lanka PLC
Management Discussion & Analysis
maldives
We recorded the highest ever volume sold in Maldives in the year 2016 surpassing 2015, despite the uncertainties that prevailed in the country.
The main contributor to volume growth was the construction industry with various ongoing infrastructure projects and private sector building projects. In addition, were able to gain share from competitors in the resort power generation segment through a series of focused activities carried out by our Distributors in the Maldives.
The more collaborative approach between the two distributors through whom we operate in the Maldives continued to help in optimizing the use of their resources and effort to focus on competitor accounts. This also helped to further strengthen the existing customer relationships through enhanced levels of service and support to current customers. The selective use of in-service oil monitoring programs has also helped both distributors to establish and build product confidence while expanding the volume base.
marketingSeveral key marketing initiatives were undertaken during 2016 to bolster the Company’s positioning within important segments.
The B2C communication activities included, increasing awareness, brand positioning and use of new media.
Given the fierce competition in the low tier engine oil segment a campaign was executed to help re-position “Lanka” brand as a premium offering within this segment. A new tagline “Engimata Hari Oil” was promoted through a media campaign using TV and radio commercials produced in both Sinhala and Tamil. We leveraged on social media through the launch of our Facebook page which garnered a significant interest and following amongst public. We also invested in internet advertising (Google Ad Words) to support consumer promotions and product launches. An overhaul of our outdoor presence was undertaken and revamped through new creatives and visuals. In addition to static hoardings we also advertised on digital signage for the first time in Colombo and in certain strategic locations.
We strengthened our product portfolio through the launch of two key products in 2016. “Supermatic Scooter Oil” was introduced to capture the growing demand for scooters in Sri Lanka, which saw a significant increase during the year. A large proportion of new motorcycle registration in the country were scooters. The product was one of the first to meet JASO MB standards in the Island which is developed specifically for scooters. We also introduced a high quality complete fuel system cleaner called “Techron”. The launch was with an awareness campaign aimed at educating traders about the product and its benefits.
End customer marketing was focused towards creating awareness and was delivered through radio and digital marketing including YouTube. Our channel presence was broadened to include the growing e-commerce channel, as we tied up with wow.lk to make our products available on their platform.
During the year in review we actively promoted Star Care, the branded service channel, in a bid to increase traffic to these dealerships, whilst emphasizing the “26 point” service check as the key element of the value proposition. Loyal customers to the channel were rewarded with the provision of gifts to encourage further affinity.

25
Annual Report 2016
Product TechnologyKeeping with industry trends of new technology, we leveraged on our global product technology capabilities to introduce dedicated oils. Havoline Supermatic 10W-30 and 20W-40 were introduced to the fast growing scooter users, Caltex 1000 THF tractor hydraulic fluid was launched to provide an effective lubrication solution to tractor users and farmers, whilst also co-branding a derivative of the tractor hydraulic fluid product with Browns Company.
Several initiatives were taken to disseminate the technical knowledge to the market through our sales force and channel partners. We carried out focused programs for the distributor field sales staff to enhance their product and application knowledge,
and through market communications to educate channel partners and consumers. We continued our efforts to educate the channels on low viscosity products Havoline ECO5 SAE 0W-20, Havoline Formula SAE 10W-30 and Delo Sports Synthetic Blend 10W-30, and Techron concentrate Plus fuel system cleaner to provide a solution to customers who are in pursuit of greater fuel economy, improved emission, and those who drive under severe conditions.
Channel partner education programs were continued across various sales regions during the year, whilst focused technical programs were conducted for larger direct customers. We also increased the capabilities and flexibility of in-service oil monitoring programs by signing contracts with two large
independent testing laboratories located overseas. These contracts helped us to offer a more focused series of testing packages to our industrial and commercial customers. Technical support was also extended to export markets in Bangladesh and Maldives.
We continue to review emerging trends and opportunities to expand our product portfolio to deliver the latest technology to our consumers.
Supply ChainDuring the year in review, supply chain activities synchronized well and remained agile to accommodate varied patterns of demand and promotional initiatives executed by the Company to grow volumes. The operations remained fluid, to ensure uninterrupted product supply to meet customer demand. The team relied on meticulous planning and execution, whilst collaborating cross functionally to deliver results the right way. We were able achieve 95% “On Time in Full” in 2016, a key performance indicator which indicates timely supply of customer requirements on spec in full. The blended and filled volumes locally exceeded 95% of products that were sold during the year. The growth in blended volumes backed by growth in demand, helped improve capacity utilization of the plant.
We continued to ensure a 100% blend conformance rate during the year. Certain plant improvement projects

26
Chevron Lubricants Lanka PLC
Management Discussion & Analysis
to increase supply chain reliability and efficiency were undertaken, which included the increase in coolant blending and filling capacity.
The continued commitment towards inculcating a safe work culture throughout supply chain and warehouse operations were pivotal in retaining our overall safety record of zero “recordable incidents” and “days away from work”. The use of Loss Prevention System (LPS) tools, safe work practices, operational excellence audits and more importantly loss-prevention-self-assessment (LPSA) during routine operations were foundation to this achievement.
Our key business partners that support us with certain supply chain activities, continue to be a pillar of strength and enable us to deliver superior business performance, whilst retaining operational excellence.
Protecting people‘Protecting people and the environment’ is a value deeply embedded in the “Chevron Way” culture. We continued to reinforce our safety track record by completing 15 consecutive years of injury-free operations. During this period, we operated safely without a single Day Away from Work (DAFW) being recorded among our employees and contractors, raising the bar for safe operations among manufacturing entities in Sri Lanka.
Effective use of LPS tools for incident reporting and investigation, 5 WHY based root cause analysis, behaviour based observations, hazard identification through LPSA and frequent use of Stop Work Authority are some of the safeguards in place to deter unsafe behaviours. The Management of Change (MOC) process helps manage the risk associated with changes in work environment, equipment or processes in order to identify risks and eliminate hazards. Under Safe Work Practices (SWP), a permit is required before embarking on any high risk activities and employees are trained to use JLAs (Job Loss Analysis) prior to task commencement to prevent workplace incidents. We have also ensured that the contracted staff from third parties engaged in operations, have aligned well with our safe work culture.
Our high exposure drivers undergo Motor Vehicle Safety (MVS) training, while all computer users are regularly monitored under the Repetitive Stress Injury Prevention Program (RSIP) where repetitive usage of computers including, mouse and keyboard usage are tracked and recorded to enable employees to develop healthy computer habits. The ‘Work-pace’ system enables and encourages employees to take natural breaks away from the computers.
27
Annual Report 2016
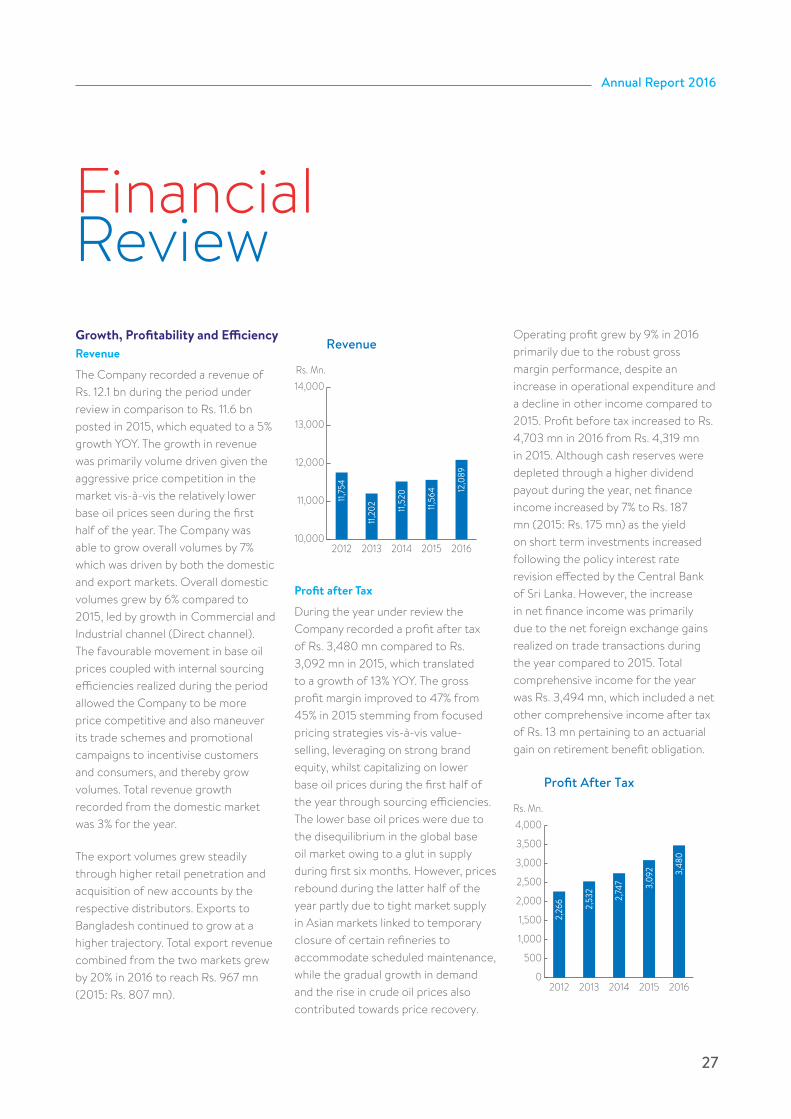
FinancialReviewGrowth, Profitability and efficiencyRevenue
The Company recorded a revenue of Rs. 12.1 bn during the period under review in comparison to Rs. 11.6 bn posted in 2015, which equated to a 5% growth YOY. The growth in revenue was primarily volume driven given the aggressive price competition in the market vis-à-vis the relatively lower base oil prices seen during the first half of the year. The Company was able to grow overall volumes by 7% which was driven by both the domestic and export markets. Overall domestic volumes grew by 6% compared to 2015, led by growth in Commercial and Industrial channel (Direct channel). The favourable movement in base oil prices coupled with internal sourcing efficiencies realized during the period allowed the Company to be more price competitive and also maneuver its trade schemes and promotional campaigns to incentivise customers and consumers, and thereby grow volumes. Total revenue growth recorded from the domestic market was 3% for the year.
The export volumes grew steadily through higher retail penetration and acquisition of new accounts by the respective distributors. Exports to Bangladesh continued to grow at a higher trajectory. Total export revenue combined from the two markets grew by 20% in 2016 to reach Rs. 967 mn (2015: Rs. 807 mn).
Revenue
2012 2013 2014 2015 2016
Rs. Mn.
10,000
11,000
12,000
13,000
14,000
11,75
4
11,20
2 11,52
0
11,56
4 12,0
89
Profit after Tax
During the year under review the Company recorded a profit after tax of Rs. 3,480 mn compared to Rs. 3,092 mn in 2015, which translated to a growth of 13% YOY. The gross profit margin improved to 47% from 45% in 2015 stemming from focused pricing strategies vis-à-vis value-selling, leveraging on strong brand equity, whilst capitalizing on lower base oil prices during the first half of the year through sourcing efficiencies. The lower base oil prices were due to the disequilibrium in the global base oil market owing to a glut in supply during first six months. However, prices rebound during the latter half of the year partly due to tight market supply in Asian markets linked to temporary closure of certain refineries to accommodate scheduled maintenance, while the gradual growth in demand and the rise in crude oil prices also contributed towards price recovery.
Operating profit grew by 9% in 2016 primarily due to the robust gross margin performance, despite an increase in operational expenditure and a decline in other income compared to 2015. Profit before tax increased to Rs. 4,703 mn in 2016 from Rs. 4,319 mn in 2015. Although cash reserves were depleted through a higher dividend payout during the year, net finance income increased by 7% to Rs. 187 mn (2015: Rs. 175 mn) as the yield on short term investments increased following the policy interest rate revision effected by the Central Bank of Sri Lanka. However, the increase in net finance income was primarily due to the net foreign exchange gains realized on trade transactions during the year compared to 2015. Total comprehensive income for the year was Rs. 3,494 mn, which included a net other comprehensive income after tax of Rs. 13 mn pertaining to an actuarial gain on retirement benefit obligation.
Profit After Tax
2012 2013 2014 2015 2016
Rs. Mn.
0
500
1,000
1,500
2,000
2,500
3,000
3,500
4,000
2,26
6 2,53
2
2,74
7 3,09
2 3,48
0

28
Chevron Lubricants Lanka PLC
income Tax
Income Tax expense for the year was Rs. 1,222 mn, which translates to an effective tax rate of 26%. The relatively lower effective tax rate compared with the statutory tax rate of 28% was primarily due to the lower tax burden on export income and the balance investment relief claimed on investments on the blending plant. The said investment relief was claimed over a period of 4 years from 2013-2016. The tax charge for 2015 included an incremental provision for prior years of assessment, which resulted in an effective tax rate of 28%. This was the main reason for the 2% variation in effective tax rate recorded in 2016.
Total Income Tax expense amounted to Rs. 1,227 mn, which included tax on other comprehensive income for the year.
distribution and administration expenses
Distribution expenses increased by 7% to Rs. 538 mn from Rs. 502 mn recorded in 2015. The rise in distribution expenses was mainly due to the increased expenditure on advertising and sales promotion, incremental freight charges arising from higher export volumes The incremental cost on advertising and sales promotions were channelled towards brand building, marketing communication initiatives and promotional activities to drive volume growth. Administration expenses
amounted to Rs. 621 mn, a 11% increase compared to Rs. 562 mn recorded in 2015. The increase largely stemmed from inter-company service charges which were also affected by the ruppee depreciation.
Administration & Distribution Expenses
2012 2013 2014 2015 2016
Rs. Mn.
0
100
200
300
400
500
600
700
Distribution costs Administrative expenses
425 47
4
443
510 53
451
1
502 56
2
538
621
LiquidityWorking Capital
Total inventory increased by Rs. 481 mn, due to increases in both raw material and finished goods inventory. The raw material inventory increased by Rs. 435 mn due to timing effects of imports and larger parcel size of base oil imports to capitalize on procurement efficiencies, while minimizing exposure to demurrage cost at the Colombo Port. Finished goods inventory increased by Rs. 46 mn to Rs. 388 mn compared to the Rs. 342 mn recorded in 2015 reflecting a relatively weak demand experienced during December 2016. However, concentrated efforts were made during
the year to manage inventory keeping with lean management practices and related inventory KPIs.
Trade Receivables remained parallel with 2015, whilst the number of “days sales outstanding” (DSO) remained at 33 days in 2016 (33 days in 2015). The control portrays the tight credit controls adopted by the Company and collection efficiency and the unswerving commitment towards efficiency in managing its working capital cycle despite the relentless efforts to drive sales in a highly competitive environment.
The company maintained a healthy liquidity position by recording a current ratio of 1.7 (2015: 2.3) and a quick asset ratio of 1.1 in 2016 (2015: 1.7) to meet working capital requirements. The decline in current ratio and quick asset ratio over 2015 stemmed from a higher trade and other payable liability and lower cash reserves at year end.
Cash Flow
Cash generated from operating activities increased to Rs. 4.9 bn compared to Rs. 4.7 bn in 2015, whilst the net cash flow from operating activities increased to Rs. 3.7 bn from Rs. 3.0 bn recorded during 2015. The Company generated a free cash flow of Rs. 3.8 bn (2015: Rs. 3.1 bn), while net cash generated from investing activities remained almost parallel between the periods. The comparatively lower free cash flow generated in 2015 was primarily due
Financial Review

29
Annual Report 2016
to the higher tax burden owing to the one-off Super Gain Tax imposed by the Government in retrospect for the year of assessment 2013/14.
Five interim dividends totalling to Rs. 4,320 mn were declared during the year, which also included a portion of dividend paid out from brought forward retained earnings. The cash payout of Rs. 4,200 mn, consisted of Rs. 3480 mn dividends declared during the year and last interim dividend of Rs. 720 mn for the year 2015. The last interim dividend of Rs. 840 mn pertaining to 2016 was paid during January 2017. Cash and cash equivalents were compressed relative to 2015 as a result of the higher dividend payout during the year.
Net Cash Flow from Operating Activities
2012 2013 2014 2015 2016
Rs. Mn.
0400800
1,2001,600
2,0002,4002,8003,2003,6004,000
2,78
8
2,48
0
2,63
8 3,02
4
3,71
3
Stability and investor ReturnFinancial Stability
The return on equity grew to 81% in 2016 (from 63% in 2015) due to growth in profits and a decline in capital employed. The capital employed vis-à-vis to retained earnings was compressed by the higher dividend payout, which also led to a higher return on equity. Earnings per share grew steadily by 13% to record Rs. 14.50 in 2016 compared to Rs. 12.88 in 2015. The earnings per share for 2015 was restated following the share split effected during June 2016. The Company has recorded compounded annual growth in earnings of 11.71% for the last 5 years.
EPS & PE
2012 2013 2014 2015 2016
EPS: Rs. PE: Times
02468
1012141618
20
02468101214161820
Earnings per Share Price Earnings Ratio
9.44 10
.55 12.8
8
11.45 14
.50
10.70
12.6
9
17.4
6
13.3
510
.83
(Note: EPS for 2012 -2015 has been restated
following the share split effected in June 2016)
investor Return
Dividend per share amounted to Rs. 18 which translates to a dividend yield of 11.5% based on the share price recorded as at end December 2016 (2015: 6.7%), whilst capital growth contracted via fall in market share price (2016 share price adjusted for comparative purpose) amounted to -8.7% (2015: -13.9%) resulting in a Total Shareholder Return of 2.8% in 2016 (2015: -7.2%).
Total Shareholder Return (TSR)
2012 2013 2014 2015 2016
MSPA% DY%
-20
-10
0
10
20
30
40
50
-6
-3
0
3
6
9
12
15
Market Share Price Appreciation Dividend Yield
5.4%
5.6%
5.0% 6.
7%
11.5%
18.8
%
32.6
%
49.2
%
-13.9
%
-8.7%
(Note: Market Share Price at year end 2016
has been adjusted following the share split
effected in June 2016, to gauge relative
movement for comparative purpose only.)

30
Chevron Lubricants Lanka PLC
Financial Review
Quarterly Results
A summary of the quarterly results for 2016 and 2015 based on the quarterly financial statements submitted to the Colombo Stock Exchange are tabulated below.
Quarterly financial statements submitted to the Colombo Stock exchange
No of shares held 20161Q
Rs. mn.
20162Q
Rs. mn.
20163Q
Rs. mn.
20164Q
Rs. mn.
20151Q
Rs. Mn.
20152Q
Rs. Mn.
20153Q
Rs. Mn.
20154Q
Rs. Mn.
Turnover 3,120 2,799 3,225 2,946 2,811 2,797 2,998 2,958
Gross Profit 1,520 1,303 1,576 1,273 1,196 1,278 1,376 1,346
Operating Profit 1,299 1,025 1,311 881 999 1,022 1,090 1,032
Finance income 44 67 37 39 29 42 48 56
Profit Before Tax 1,343 1,091 1,348 919 1,027 1,065 1,139 1,087
Profit after Tax 986 802 1,001 693 743 797 835 713
Note: These results may not add up to the final results disclosed in the Audited Accounts due to changes in presentation, classification, other adjustments and rounding-off.

31
Annual Report 2016
CorporateSocial ResponsibilityRoad SafetyAs in the previous years, we continued to focus our efforts in raising awareness, educating and changing the behaviours of drivers and pedestrians on road safety as the rate of accidents and the resultant deaths in the country have not shown any sign of abating.
‘Caltex drive wise, embrace life’ Road accidents in Sri Lanka are not only taking lives, but also have an adverse effect on national productivity. Chevron Lubricants Lanka PLC has been at the forefront of promoting road safety through many awareness generating initiatives over the past 12 years. Having identified and understood the dire need to address the urgency for effective road safety awareness, the company re-launched the ‘Caltex Drive wise, Embrace life’ campaign in the year under review, in partnership with the Sri Lanka Police department. This year the Company also partnered with St. Thomas’ College Batch of ’82, EBC Radio Network (Pvt) Ltd and the Derana Media Network in taking the message to the stakeholders.
‘Caltex Drive wise, Embrace life - 2016 cycle ride’ was one of the key activities of the campaign to create awareness on road safety. The cycle ride was flagged off on 23rd October 2016 as participants embarked on a 12-day cycling tour, travelling 1,500 kms around the coast of Sri Lanka. The cycle ride concluded on 5th November 2016 at St. Thomas’ College, Mount Lavinia, in a grand parade. The parade featured students, well-wishers and many key stakeholders who displayed their solidarity with the company’s efforts.
Another objective of this campaign was to educate children and adults in order to cultivate short and long term safe road habits. Special seminars were conducted for students in over 25 schools in the districts of Gampaha,
Jaffna, Anuradhapura, Batticaloa and Matara, with the support of the Ministry of Education and the Sri Lanka Police Department. Extending the campaign further, road safety related essay and art competitions were held for the students in these towns.
In a bid to raise awareness further, seminars were conducted in Negombo, Jaffna, Madawatchiya, Trincomalee and Matara for the general public on responsible road behaviour. Reinforcing the message further, participants were quizzed on what they learnt at the session and subsequently rewarded for their understanding of the knowledge shared during the seminars. In order to attract more people, carnivals were organized in the above locations to promote road safety in a fun and friendly manner.
Further, Chevron Lubricants Lanka PLC deployed a mass communication campaign during the Christmas season on road safety. This mass media campaign communicated hard-hitting road safety messages via advertisements scheduled on radio and TV in Sinhala, Tamil & English languages.

32
Chevron Lubricants Lanka PLC
Supporting hiV/aidS PreventionChevron Lubricants Lanka PLC plays an active role in HIV and AIDS prevention. Corporate responsibility is embodied in the organization’s values and the way it operates
According to the National STD/AIDS control programme, which is part of Sri Lanka Department of Health Services, the cumulative number of HIV cases reported at the end of the 4th quarter of 2016 was 2,557. School children today are more at risk of becoming victims of HIV/AIDS than was the case for previous generations. The epidemic of HIV/AIDS is now progressing at a rapid pace among the youth.
Chevron Lubricants Lanka PLC stepped forward to support the Sri Lanka Girl Guides Association to organize a poster competition and exhibition in commemoration of HIV & AIDs day, which fell on 1st December 2016. The objective was to increase awareness and vigilance pertaining to the causes and prevalence of HIV and AIDS, mainly targeting the school children, adolescents, vulnerable young mothers and females in the North Western Province of Sri Lanka.
Specialists on HIV & AIDS shared relevant information on the topic with students and other participants on 29th November 2016 at Sri Nissanka Maha Vidyalaya in Kurunegala. The theme for the art competition was related to the subject of HIV/AIDS and contestants submitted posters for the competition
depicting their understanding of the issue.
The poster competition was held from 1st December 2016 until the 3rd of December 2016 at the Red Cross Hall in Kurunegala, with the participation of distinguished guests and well-wishers. An exhibition was held thereafter and winners were recognized with prizes. Awards were given out to 5 winners in 6 categories. Each winning piece was used to educate the public about HIV and AIDS and its implications, including issues related to stigma, sexual harassment, preventive measures, getting tested for HIV and discrimination.
Extending Technical Training at Ceylon-German Technical Training Institute (CGTTI)
Chevron Lubricants Lanka PLC is always ready to share industry knowledge and as has been evident from our
partnership with the Ceylon-German Technical Training Institute (CGTTI) for the past 15 years.
The company conducted a training programme for the final year students of the institute during the year under review. The technical knowledge experts of Chevron shared their knowledge with the CGTTI students, driven by the objective of gearing the future generation of automobile engineers with the latest and the most advanced knowledge on automotive lubrication technology. The programme was designed to enhance students’ knowledge with a practical and insightful understanding of the lubricant technology and industry dynamics, both locally and globally.
We also continued to empower and develop the skills of the future workforce through training programmes for the lubricant retail partners, vehicle service station owners and staff island-wide.
Corporate Social Responsibility
(Priyanthi Hemamali Rajapaksa, Projects Executive of SLGGA being presented the sponsorship cheque by Mr. Kishu Gomes Managing Director / Chief Executive Officer together with Mr. Eenaz Salie – Marketing Manager of Chevron Lubricants Lanka PLC)

33
Annual Report 2016
CorporateGovernanceThe Board of Directors of Chevron directs the affairs of the Company and is committed to sound principles of corporate governance.
Board of directorsThe Board consists of 6 Directors, including 2 Independent Directors. As per the Board charter, the Board is responsible for setting the overall direction, financial objectives and operational goals, reviewing and approving the annual plan, monitoring of performance against the objectives and goals, approval of quarterly and annual financial statements and major transactions. It monitors overall performance, risk management systems, the integrity of the Company’s financial controls and the effectiveness of compliance program.
Two Non –Executive Directors out of the four Non-Executive Directors are considered independent in terms of the guidelines issued by the Securities and Exchange Commission of Sri Lanka.
Appointment of Non-Executive Directors is based on the collective decision of the Board.
As per Article 84 of the Articles of Association, one third of the directors of the Board have to retire by rotation at every Annual General Meeting. The Chairman and Executive Directors are excluded in determining the Directors to retire. The person who has served for the longest period has to retire but is eligible for re-appointment.
The Board met 4 times during 2016 and the attendance is given below;
Attended
Farrukh Saeed NED 4/4Kishu Gomes ED 4/4Anura Perera ED 4/4Richard Brown NED 4/4Deva Rodrigo NED/IND 4/4Harsha Amarasekera NED/IND 4/4
NED= Non-Executive Director, ED=Executive Director, IND= Independent Director
Board audit committee.This Committee functions under a written charter, and consists of two Non-Executive Directors namely Mr. Deva Rodrigo, (Chairman) and Mr. Harsha Amarasekera. Managing Director and Finance Director attend the meeting by invitation.
The primary function as per the charter is to assist the Board in fulfilling its responsibilities by reviewing the financial information which is provided to shareholders, the systems of internal
controls which management and Board of Directors have established, compliance with laws, regulations and ethics, risk management, performance, qualifications and independence of the external auditors and the performance of the internal audit. Both the internal auditors and external auditors have direct access to the Audit Committee.
The Board Audit Committee met 4 times during 2016 and the attendance is given below
Attended
Deva Rodrigo* 4/4Harsha Amarasekera 4/4
*Chairman of Audit Committee
Audit Committee report is given in page 47.
34
Chevron Lubricants Lanka PLC
Remuneration CommitteeRemuneration committee consists of three Non-Executive Directors. This Committee reviews the salary and benefits programs of executive employees, including the executive directors.
Attended
Deva Rodrigo 1/1Harsha Amarasekera* 1/1Richard Brown 1/1
* Chairman of the Committee
directors RemunerationTotal remuneration paid to Executive and Non-Executive Directors are given in page 67 and the report of the Remuneration Committee is given in page 50.
Related Party Transactions Review CommitteeThe above committee was established in December 2015 and the composition is as follows.
Deva Rodrigo - Chairman
Richard Brown - Non Executive Director
The scope of the committee would be to provide independent review, approval and oversight of related party transactions on the terms set forth in greater detail in the Committee Charter.
The Committee met 4 times during the year;
Attended
Deva Rodrigo* 4/4Richard Brown 4/4
management StructureThe Leadership Team consists of the Managing Director and the Heads of Functions of Finance, Supply Chain, and Sales. Under the functionalized structure of the Chevron Corporation, Local General Managers, in addition to their reporting line to the Managing Director report to their functional heads in the Asia Pacific region. Functional Heads are fully accountable for the respective performance agreements under the business and strategic plan. Clearly defined limits of authority have been delegated to the Managing Director and the General Managers
Chevron Business Conduct and ethics Code Our corporate values outlined in the Chevron Way serve as the foundation of the Business Conduct and Ethics Code (BCEC). It is about ‘getting the results the right way’.
Integrity, Trust, Diversity, Ingenuity, Partnership, Protecting People and the Environment and high performance are all core values of the Chevron Way that underpin our business conduct.
The BCEC includes the following topics;
• Company records and internal controls
• Avoiding conflicts of interests which also covers accepting or giving gifts, fees, favours or other advantages.
Corporate Governance

35
Annual Report 2016
• Use of material non-public information of any kind for personal gain including insider trading.
• Complying with Anti-bribery and international trade laws
• Anti-trust and completion laws
• Data Privacy
• Protection of information and intellectual property
• Operational excellence.
Employees at all levels are required to undergo mandatory training of the code and there is a robust compliance monitoring and reporting process in place.
The Chevron Business Conduct and Ethics code encourage any employee having information or knowledge of any violation of the Code to promptly report it to his or her management, the Corporation’s Auditing Department, Corporate Security, or the employee may call the toll-free 24 hour compliance hot line. Names and contact telephone numbers of subject matter experts under each compliance subject and hot line numbers have been widely displayed within the Company.
Name of Director Directorship status at CLLP
Board seats held in other Sri Lankan CompaniesExecutive Capacity Non-Executive capacity
Farrukh Saeed Chairman Nil Chevron Ceylon LtdKishu Gomes Managing
Director/CEOChevron Ceylon Ltd Nil
Richard Brown Non- Executive Director
Nil Nil
Deva Rodrigo Non- Executive Director
Nil Taprobane Holdings PLCCargills Ceylon PLC
Anura Perera Executive Director/Company Secretary
Chevron Ceylon Ltd Nil
Harsha Amarasekera Non- Executive Director
Nil CIC Holdings Plc (Chairman) Chemanex Plc (Chairman)CIC Agri Business (Pvt) Ltd (Chairman)Vallibel One PlcExpo Lanka Holdings PlcRoyal Ceramic PlcAmana Bank LimitedVallibel Power Erathna PlcAmaya Leisure Plc
investor RelationsAnnual Report of the Company, quarterly reports and the Annual General Meetings are the principal means of communications with the shareholders. The Board is ready to answer any questions raised at the Annual General Meetings. Shareholders may direct any questions or seek clarifications request for publicly available information by contacting the Company Secretary.
Protection of People and the environmentWe strive for world –class performance by implementing a rigorous system (Operational Excellence Management System) for managing risks to our employees, contractors, the public and the environment from our operations and products. Under the product stewardship, we manage risks of our products with everyone involved throughout the products’ life cycle.

36
Chevron Lubricants Lanka PLC
Corporate Governance
Rule no Subject Criteria Compliance Status
details
7.10.1. (a) Non-Executive Directors
At least one third of the total number of Directors should be Non-Executive Directors
Compliant As at the conclusion of the last AGM and throughout the financial year, there were 4 Non-Executive Directors.
7.10.2. (a) Independent Directors
Two or one third of the Non- Executive Directors , whichever is higher should be independent
Compliant As at the conclusion of the last AGM and throughout the financial year there were 2 Independent Directors.
7.10.2. (b) Independent Directors
Non Executive Directors should submit an annual declaration of his/her independence/non independence against specified criteria
Compliant Please refer to page 33 of the Corporate Governance Report.
7.10.3. (a) Disclosure relating to Directors
The Board shall make a determination annually as to the independence or non-independence of each non-executive director.
Compliant The Board made a determination against the criteria given in rule 7.10.4
7.10.3. (b) Disclosure relating to Directors
In the event a Director does not qualify as “independent” but if the Board is of the opinion that the Director is “Independent”, the Board shall specify the criteria not met and the basis for its determination.
Not Applicable No such determination was required as both Independent Directors met the criteria
7.10.3. (c) Disclosure relating to Directors
Company shall publish a brief resume of each Director
Compliant Please refer to pages 12 to 15
7.10.3. (d) Disclosure relating to Directors
Upon appointment of a new director , a brief resume of such Director should be provided to CSE
Not applicable during the period

37
Annual Report 2016
Rule no Subject Criteria Compliance Status
details
7.10.4 Criteria for defining independence
As per defined criteria of the CSE listing rules
Compliant Both Independent Directors met the criteria
7.10.5 Remuneration Committee
A listed entity shall have a Remuneration Committee
Compliant Please refer to the Remuneration Committee report on page 50
7.10.5. (a) Composition of Remuneration Committee
Remuneration Committee (RC) shall comprise a minimum of two independent non executive directors or majority of independent non executive Directors.
Compliant Out of the three members of the remuneration committee two are Independent Non-Executive Directors.
7.10.5. (b) Functions of the Remuneration Committee
The RC shall recommend the remuneration payable to the Executive Directors/and Chief Executive Officer to the Board which will make the final determination .
Compliant Please refer to the report of the Remuneration Committee appearing on page 50
7.10.5. (C) Disclosure relating to Remuneration Committee
Annual report shall set out the names of Directors in the RC, contain a statement of the remuneration policy and set out the aggregate remuneration paid to executive and non-executive directors
Compliant Please refer to the report of the Remuneration Committee appearing on page 50
7.10.6 Audit Committee
The Company shall have an Audit Committee
Compliant Please refer to the Audit Committee Report given on page 47
7.10.6. (a) Composition of the Audit Committee
Composition of the Audit Committee
Compliant Audit Committee comprised of two Non-Executive Independent Directors and headed by an Independent Director.

38
Chevron Lubricants Lanka PLC
Corporate Governance
Rule no Subject Criteria Compliance Status
details
CEO and CFO shall attend all Audit Committee Meetings
Compliant Chief Executive Officer and Chief Financial Officer attended Audit Committee meetings by invitation.
Chairman or one member of the Audit Committee shall be a member of a recognized professional body.
Compliant The Chairman of the Audit Committee is a Fellow member of the Institute of Chartered Accountants of Sri Lanka
7.10.6 (b) Functions of the Audit Committee
Should be as outlined in the 7.10 of the listing rules.
Compliant Please refer to the Audit Committee report given on page 47 and the Corporate Governance Report
7.10.6.(c) Disclosures in the Annual Report relating to Audit Committee.
a. Names of the Directors comprising the Audit Committee
Compliant Please refer to the Audit Committee report on page 47
b. The Audit Committee shall make determination of the independence of the Auditors and disclose the basis for such determination
Compliant Please refer to the Audit Committee report on page 47
c. The Annual Report shall contain a report of the Audit Committee setting out the manner of compliance of the functions
Compliant Please refer to the Audit Committee report on page 47
Compliance with section 9.3.2 (b) of listing rules of the Colombo Stock exchange
name of the Related Party
Relationship nature of the Transaction
aggregate value of the related Party Transactions entered in to during the Financial year (LkR)
aggregate value of the related Party Transactions as % of net Revenue
Terms and Conditions of Related Party Transactions
Chevron Singapore (Private) Limited
Subsidiary of the ultimate parent
Purchase of Raw Materials for Blending of Lubricants
2,974,218,426 25% As per the Purchase Agreement between the two entities, on commercial terms.

39
Annual Report 2016
RiskManagement The Company encounters varied risks that originate from the micro and macro environment, which would impact the value creation and preservation process. The entity’s risk management process involves setting corporate objectives, identification of risks, assessing their likelihood and severity, risk response, information and communication and periodic monitoring. The key risks faced by the Company are mapped in a detailed risk register, assessed and profiled based on its potential impact and likelihood and are managed through risk response strategies.
The audit committee spearheads the risk management process through periodic assessment and monitoring and cascades to the management committee for implementation and execution. Risk management is deeply rooted and embedded in the corporate culture at Chevron.
internal Control FrameworkChevron’s policy is to conduct its business in accordance with the highest standards of integrity and ethics, and in compliance with all applicable laws. The company implements, and maintains effective internal controls to guide and monitor compliance with applicable legal requirements and to maintain reliable and accurate financial reporting
Chevron has adopted the “Internal Control – Integrated Framework” issued by the Committee of Sponsoring Organizations of the Treadway Commission (COSO) to document, catalogue, assess and maintain its systems of internal controls over financial reporting. The COSO framework emphasizes publicly traded companies to adopt an internal control framework that is free from bias; allows for reasonably consistent qualitative and quantitative measurements of the company’s internal controls; is complete, and enables an objective evaluation of internal controls over financial reporting.
Corporate Culture & internal Control
Framework
Risk Identification
ObjectiveSetting
RiskResponse
Monitoring
RiskAssessment
Information and Communication

40
Chevron Lubricants Lanka PLC
Risk assessment and profilingEach identified risk is assessed based on the likelihood of it materializing and the potential impact it would have on the entity. Audit committee and management judgment remain crucial to assessing likelihood of a potential risk, whilst the severity is determined by assessing the potential financial and non-financial impact a particular risk would exert on realizing envisaged corporate objectives
A composite risk score is ascertained based on the likelihood and impact ratings. The composite score is fundamental in scientifically profiling risks through a matrix and in prioritizing appropriate risk response strategies.
Business RiskLoss of Volumes/ market Share
Company faces the risk of losing volumes due to negative market growth, intense competition from the existing players, new entrants and unlicensed operators in the market who resort to selling adulterated products. There is no effective regulatory mechanism to curb such illegal
activities which affect the industry. The export volumes may be affected by macro-economic developments, political unrest, fiscal policies of the respective geographies.
Risk Response
Company manages these risks through customer and channel partner education, marketing communication
on product value propositions, creating awareness among the relevant stakeholders and leveraging on the brand equity. We also have regular dialogue and interaction with the shadow regulator, Ministry of Petroleum and other relevant authorities to offer constructive suggestions to regulate the industry and protect the interests of the customers and maintain high product standards.
dependence on Business Partners
Some of the critical operations of the Company such as handling warehouse operations, transportation & distribution have been outsourced. Any business disruption in the operations of such business partners may affect the company’s operations.
Risk response
Company conducts regular supplier evaluations and benchmarking of such activities to re-validate the decision parameters of outsourcing. The Company maintains excellent relationships with the business partners and shares best practices with them. In addition, the Company has developed contingency plans to face any disruptions in critical outsourced activities.
health, environment and Safety Risk
These risks relate to incidents and events that could cause injuries to employees and disrupt day to day business operations and cause damage to the environment. Damages to the
Like
lihoo
d
5 Almost Certain 5 10 15 20 254 Likely 4 8 12 16 203 Moderate 3 6 9 12 152 Unlikely 2 4 6 8 101 Remote 1 2 3 4 5
VeryLow
Low Medium High VeryHigh
1 2 3 4 5Impact
Risk Rating Low Moderate HighRisk Score (RS) 5>RS 10>RS>5 25>RS>10
(Conceptual model of the Risk Matrix)
Following are some of the key risks faced by the company.
Risk Management

41
Annual Report 2016
environment could lead to legal claims and reputational risk
Risk response
Protecting people and the environment is one of the core values advocated in the “Chevron Way” which defines who we are, what we do, what we believe and what we plan to accomplish. The underlying principles and expectations are safety and incident free operations, advocacy, compliance assurance, Conservation, product stewardship, pollution prevention, and emergency management. Chevron Operation Excellence (OE) provides for the overarching systematic management of safety, health and environment, reliability and efficiency to achieve world class performance.
operational RiskThese are risks that could arise due to systems and procedure failures, human error, fraud, lack of internal control and corporate governance practices. This would have adverse impact on profitability, competitiveness, reputation and conducting overall business operations.
Risk response
The Company has deployed policies, processes and procedures to ensure integrity of transactions, whilst also adopting controls mandated by Sarbanes-Oxley Act (SOX). Any deviations or gaps identified are reported, investigated and corrective action taken. The value chain activities
from supply chain to distribution cum sales and marketing have been integrated on a central ERP system, supplemented with standardized processes. Further, these processes, systems and controls are subjected to periodic review by internal auditors and ISO auditors.
Financial RiskForeign exchange Risk
As most of the raw materials are imported, the depreciation of the rupee against the US dollar affects the product acquisition costs adversely.
Risk response
The company consistently monitors foreign exchange movement and related economic indicators. Best possible rates are negotiated with banks for settlements of bills, whilst flexible settlement terms are negotiated with key suppliers. Hedging techniques such as forward contracts and matching foreign assets against liabilities are within the company’s framework of response strategies to manage a high degree of currency volatility and foreign exchange risk.
Credit RiskCompany grants unsecured credit for some of the customers which could lead to bad debts. However, about 60% of the credit granted is fully secured.
Risk response
Stringent credit controls are in place to limit and monitor the exposures on unsecured credit.

42
Chevron Lubricants Lanka PLC
Our Strong Fundamentals Served us well...
Financial Calendar 2016Interim Financials1st Quarter 04th May 20162nd Quarter 26th July 20163rd Quarter 13th October 20164th Quarter 01st February 2017
Dividends paid date1st Interim Dividend of Rs. 6.00 per share paid on 26th April 20162nd Interim Dividend of Rs. 5.00 per share paid on 28th June 20163rd Interim Dividend of Rs. 3.00 per share paid on 15th August 2016 4th Interim Dividend of Rs. 3.50 per share paid on 02nd November 20165th Interim Dividend of Rs. 3.50 per share paid on 04th January 2017

43
Annual Report 2016
Annual Report of the Directors
The Directors of Chevron Lubricants Lanka Plc are pleased to present their report together with the audited financial statements for the year ended 31st December 2016.
nature of the Business and Likely Future developmentsThe Core business activity of the company is import, export, manufacture and marketing of lubricants, greases, brake fluid and specialty products. The review of business activities for the year 2016 and the likely future developments are covered in detail under the Managing Director’s review and Management Discussion Analysis.
Financial StatementsThe financial statements which include the Statement of Comprehensive Income, Statement of Financial Position, Statement of Changes in Equity, Cash Flow Statement, and notes to the financial statements are given on pages 57 to 83.
accounting PoliciesDetails of the accounting policies are given in Note 2 of the Financial statements. There have been no changes to accounting policies adopted by the company during the year.
Review of BusinessCompany made a net profit after tax of Rs. 3.5bn (2015:Rs. 3.1bn), after making provisions for all known liabilities, provision for doubtful debts and depreciation on property plant and equipment. The Statement of Comprehensive Income and the Statement of Changes to the Equity are given on page 53 and 55 respectively.
dividends and Reserves Following Interim Dividends were paid during the year after confirming that the Company has satisfied the solvency test in accordance with section 57 of the Companies Act no 07 of 2007 and having obtained certificate from auditors prior to declaration of each dividend.
First Interim Dividend- Rs. 6 per share paid on 26th April 2016
Second Interim Dividend- Rs. 5 per share paid on 28th June 2016
Third Interim Dividend – Rs. 3 per share paid on 15th August 2016
Fourth Interim Dividend – Rs. 3.50 per share paid on 2nd
November 2016
Fifth Interim Dividend – Rs. 3.50 per share paid on 4th January 2017
An amount of Rs. 934,078, 564 was utilized out of the brought forward retained earnings in paying the second interim Dividend
No final dividend has been proposed by the Board.
Property, Plant & equipmentCapital expenditure incurred during 2016 including work-in-progress amounted Rs. 91,316,443 (2015: Rs. 95,445,714 The movements in Property, Plant & Equipment are given in Note 13 to the Accounts.
donationsNo donations were made by the Company during the year. (2015: 1,076,500). This is excluding the expenses charged to earnings on social responsibility programs which amounted to Rs. 12,563,598 (2015:Rs. 9,342,098). The details of the social responsibility programs are given in the corporate social responsibility report.
directorateThe following served as Directors of the Company during the year 2016:
Farrukh Saeed
Kishu Gomes
Anura Perera
Deva Rodrigo
Richard Brown
Harsha Amarasekera
In terms of Clause 84 of the Articles of the Company, Mr. Richard Brown, who retires by rotation ceases to be a director and being eligible, offers himself for re-election.

44
Chevron Lubricants Lanka PLC
director’s ShareholdingsShareholdings of the Directors including alternates and spouses’ are detailed below:
Anura Perera 400 (31.12.2015– 200).
None of the other Directors hold shares in the Company.
directors independenceDevasiri Rodrigo and Harsha Amarasekera function as Independent Directors of the Company.
As per the rules on Corporate Governance (section 6.4) stipulated by the Colombo Stock Exchange each of the above directors have made written declarations. Accordingly Devasiri Rodrigo and Harsha Amarasekera meet all the criteria of independence.
Information on Company’s compliance with other rules on corporate governance are given in Corporate Governance report in page 33.
Remuneration and other benefits of directorsThe remuneration and the value of other benefits received by the Directors are given in page 67.
directors interests in ContractsDirectors’ interests in contracts are disclosed in Note 25 to the accounts and have been declared at the meeting of the Directors.
other directorships held by the directorsOther directorships held by the Directors have been disclosed in the Corporate Governance report on page 34 These have been entered in the Interest Register.
Related Party TransactionsThe company procures most of the raw materials from Chevron group companies in the ordinary course of business. In addition the Company obtains and pays for various services provided by the group. The details of such transactions are given in note 25 to the Financial Statements. The Directors believe that the Company has fully complied with the rules of the Colombo
Stock Exchange relating to related party transactions. Report of the Related Party Transactions Review Committee and the certificate given by the Finance Director to the Inland Revenue Department are given on pages 48 and 49 respectively.
Share Capital and information on shares as at 31 December
2016Rs.
2015Rs.
Earnings Per Share 14.50 12.88
Net Assets Per Share 16.09 19.53
Market price per Share 157.10 344.00
Highest Price during the Year 350.00 460.00
Lowest Price During the Year 149.00 342.10
Price Earnings Ratio 10.83 13.35
Dividends Per Share 18.00 11.50
major ShareholdersThe twenty largest shareholders and the percentages held by them are disclosed on page 87.
ReservesRetained earnings of the Company as at 31.12.2016, amount to Rs. 3,261mn (31.12.2015 – Rs. 4,087 mn). Movements are shown in the Statement of Changes in Equity in the financial statements.
Stated CapitalDuring the financial year company increased the number of shares in issue by way of a subdivision of shares by subdividing each share into two , thus increasing the number of shares from 120,000, 000 to 240, 000,000 shares. Wherever relevant , comparative information have been re-instated to reflect this change.
Post Balance Sheet eventsThere have been no events subsequent to the Balance Sheet date which would have material effect on the company or require disclosure or adjustment to the Financial Statements.
Annual Report of the Directors

45
Annual Report 2016
internal Controls Directors are responsible for devising proper internal controls to ensure that the proper books of accounts are maintained, the integrity of financial statements, assets are safeguarded, transactions are executed by those who have appropriate authority and there is proper segregation of duties. Board Audit committee reviews the internal audit reports to ensure established controls are adhered and any deviations reported and remediated. A whistle blowing mechanism is in place to report any violations of internal controls and Business conduct and ethics code. Based on the internal control frame work as described above the Board is satisfied with the effectiveness of the internal controls for the period under review.
Statutory PaymentsThe Board of Directors confirm that to the best of their knowledge the all statutory payments for the financial year have been paid or where relevant provided for.
material issuesThere were no material issues pertaining to employees and industrial relations.
Going ConcernAfter considering the financial position, operating conditions regulatory and other factors and such matters required to be addressed in the Corporation Governance Code, the Directors have a reasonable expectation that the Company possesses adequate resources to continue in operation for the foreseeable future. For this reason, they continue to adopt the Going Concern basis in preparing the financial statements.
auditorsThe financial statements for the year have been audited by Messrs PricewaterhouseCoopers (chartered accountants). They were paid Rs. 2,103,372 (2015: Rs. 1,947,567) as audit fees and Rs. 120,000 (2015: Rs. 120,000) for issue of solvency certificates.
A resolution proposing their re-appointment as Auditors of the Company will be tabled at the Annual General Meeting.
The Auditors have confirmed that they do not have any relationship with or interests in the Company other than that of an auditor.
annual General metingThe Annual General Meeting will be held on 20th April 2017 at the Institute of Chartered Accountants of Sri lanka (6th Floor) 30A, Malalasekera Mw, Colombo 7 at 3 .30 pm.
By order of the Board
kishu Gomes a. m. anura PereraManaging Director/CEO Director/ Secretary
23 March 2017

46
Chevron Lubricants Lanka PLC
Statement of Directors’ Responsibilities
Companies Act 07 of 2007 stipulates that Directors are responsible for the preparation of financial statements for each financial year and place before a general meeting financial statements, comprising of a Statement of Comprehensive Income and a Statement of Financial Position which presents a true and fair of the state of the Company as at the end of the financial year and which comply with the requirements of the above Act. The financial statements have been prepared and presented in accordance with all relevant Sri Lanka Financial Reporting Standards Accounting Standards. The financial statements include amounts that are based on management’s best estimates and judgments.
As per the Section 148 of the Act the Directors are also required to maintain sufficient accounting records to disclose with reasonable accuracy the financial position of the Company and to ensure that the financial statements presented comply with the requirements of the Companies Act.
The directors are also responsible for devising proper internal controls for safeguarding the assets of the company against unauthorized use or disposition and prevention and detection of fraud and for reliability of financial information used within the business or publication.
The Board of Directors is of the opinion that Board has discharged their responsibilities as set out above.
The company’s financial statements have been audited by PricewaterhouseCoopers, independent auditors approved by the shareholders. Management has made available to PricewaterhouseCoopers all the Company’ financial records and data, as well as the minutes of directors’ meetings
The Board of Directors also confirms that having reviewed the financial position and strategies for managing risks faced by the Company, the company could continue in operation and has adopted the going concern basis in preparing the financial statements.
kishu Gomes a. m. anura Perera Managing Director Finance Director

47
Annual Report 2016
Audit Committee Report
CompositionThe Audit Committee comprising two independent directors; Desamanya Deva Rodrigo FCA (Chair) and Mr. Harsha Amarasekara PC complied with SEC rules relating to independence, having at least one member with membership in a professional accounting body and composition.
Terms of ReferenceThe responsibilities and work of the Committee depended on the Terms of Reference (TOR) adopted by the Company in line with Chevron, US SEC and Sri Lanka SEC requirements and best practice.
Ensuring financial statement integrity, effectiveness of internal controls over financial reporting, compliance with laws and regulations and the independence of the external auditors PricewaterhouseCoopers, was the core responsibility of the Committee. TOR also requires the Committee to evaluate the performance of the internal audit function and of the external auditors and oversee the business risk identification, management and monitoring process.
1. meeting the GoalsIn fulfilling the TOR the committee held four meetings during the year 2016.
The Committee met with the external auditors to agree the audit plan and to discuss the key interim audit findings. It also ensured that auditors have had unimpeded access to records, other audit evidence and personnel and have not been imposed with any restrictions on scope or on reporting.
The reports issued by local internal audit and by the external auditors were reviewed, the implications of the matters reported were assessed and the relevant risk mitigation and management procedures implemented or to be implemented were discussed with the management to ensure that they were adequate to protect the company from reported risks.
The Committee examined and was satisfied with the independence of the external auditors.
The Committee also reviewed the year-end financial statements prepared by the management in conformity with the requirements of the Companies Act No 7 of 2007, and the unaudited interim financial statements. The review included a year end discussion with the external auditors and discussions with the executive Directors of the movements in key account balances, the reasons for fluctuations from budget and previous year financial data to ensure that the reported results and financial position at the balance sheet date were consistent with the Committee’s understanding of the operating environment, results and strategic plans and budget of the company.
Business risk reviews and presentation of their results to the Board of Directors were made in the presence of all members of the Audit Committee who ensured that the risk management function overall was effective in design and in operation. The risk management activity is closely linked to strategic planning and the Committee was satisfied with the business risk review and management process.
appreciationThe contribution made by the Managing Director and other Directors in fulfilling the obligations of the Audit Committee is recognized with appreciation.
Sgd, deva RodrigoChairman Audit Committee
23 March 2017

48
Chevron Lubricants Lanka PLC
Related Party Transactions Review Committee Report
introductionThe Related Party Transactions Review Committee was formed by the Board as a Board Committee in December 2015.
Committee CompositionThe Committee comprises one Independent Non-Executive Director and one Non-Executive Director. The composition of the Committee fulfilled the requirements of the Listing Rule No. 9.2.2 of the Colombo Stock Exchange, throughout the financial year. The composition of the Related Party Transactions Review Committee is indicated below.
Name of Director Directorship Status at CLLP
Deva Rodrigo Independent Non-Executive Director
Richard Brown Non-Executive Director
Terms of ReferenceThe Terms of Reference of the Related Party Transactions Review Committee deals with its authority and responsibilities. The TOR encompass matters prescribed in the Listing Rules of the Colombo Stock Exchange and include the following:
• ReviewinadvanceallproposedRelatedPartyTransactionsof the Company except those explicitly exempted by section 9.5 of the rules.
• DeterminewhetherRelatedPartyTransactionsthataretobe entered into by the Company require the prior approval of the Board or shareholders of the Company
• EnsurethatnoDirectoroftheCompanyshallparticipatein any discussion of a proposed Related Party Transaction for which he or she is a related party, unless such Director is requested to do so by the Committee for the express purpose of providing information concerning the Related Party Transaction to the Committee in its ongoing dealings with the relevant related party.
• Wherenecessary,theCommitteeshallrequesttheBoardofDirectors to approve the Related Party Transactions, which are under review by the Committee. In such instances, the approval of the Board of Directors should be obtained prior to entering in to the relevant Related Party Transaction.
• IntheeventaRelatedPartyTransactionwillbeongoing(aRecurrent Related Party Transaction), the Related Party Transactions Review Committee may establish guidelines for the senior management to follow in its ongoing dealings with the Related Party. Thereafter, the Committee, on an annual basis, shall review and assess ongoing relationships with the Related Party to determine whether they are in compliance with the Committee’s guidelines and that the Related Party Transaction remains appropriate.
Policies and Procedures Sri Lanka Accounting standards define Related Party Transactions. This definition is consistent with Section 9 of the
listing rules of CSE. Under these the members of the Board of Directors of the Company have been identified as Key Management Personnel. In accordance with the Related Party Transaction Policy, declarations are obtained from each Key Management Personnel of the Company for the purpose of identifying parties related to them. Based on the information furnished in these declarations, the Company retrieves data on related party transactions from the data base of the Company.
meetingsThe Committee met on three occasions during the financial year 2016 and the members’ attendance record is indicated in page 34 of corporate governance. A meeting was held on 23 January, 2017 in lieu of the fourth meeting that was required to be held in the year 2016.
Related Party Transactions during the yearThe activities and observations of the Committee were communicated to the Board of Directors quarterly through oral briefings and by tabling the minutes of the Committee’s meetings. During the year there were no non-recurrent or recurrent Related Party Transactions that exceeded the respective thresholds mentioned in the Listing Rules. Details of other Related Party Transactions entered into by the Company during the year are disclosed in Note 25 to the Financial Statements.
disclosures in the annual ReportThe Company has also made the following disclosures as mandated by the CSE listing rules and the Inland Revenue Act No.10 of 2006.
• RecurrentRelatedPartyTransactionsaredisclosedinpage38 of the annual report in compliance with Section 9.3.2 (b) of the listing rules of CSE.
• The“CertificatebytheDirectoronTransferPricing”is disclosed in page 49, in compliance with regulations stipulated in the Gazette Extraordinary No. 1960/39 of March 31, 2016 under Section 104 of the Inland Revenue Act, No. 10 of 2006
declaration The declaration by the Board of Directors confirming that the Company has complied with the requirements of the listing rules of the CSE on related party transactions for the financial year 2016 is given on page 44, in the ‘Annual Report of the Directors’.
Sgd,deva RodrigoChairman Related Party Transaction Review Committee
23 March 2017

49
Annual Report 2016
Chevron Lubricants Lanka PLCChevron House, 490, Galle Road,
Colombo 03, Sri Lanka
Tel: +94 11 4 524 524Fax: +94 11 4 524 555
Company Reg. No. : PQ54
The Commissioner General of Inland RevenueDepartment of Inland Revenue,Colombo 2.
29.11.2016
Dear Madam,
Certificate of the director on Transfer pricing
It is certified that the company has complied with the Transfer Pricing Regulations issued under Section 104 of the Inland Revenue Act, No. 10 of 2006. The information pursuant to these Regulations is given in approved accountant certificate produced under Section 107(2) (a) of the said Inland Revenue Act. I believe that the record of transaction/s entered into with associated undertaking/s during the period from 01/01/2015 to 31/12/2015 are at arm’s length, not prejudicial to the interests of the company and not carried out for profit shifting purposes.
Records and information of all transactions have been submitted to the, approved accountant who reviewed the transfer pricing records and no adverse remarks have been made in the certificate done by the approval accountant.
………………………………..................…. ………………………………..................…. Place For and on behalf of the Board of Directors
Anura Perera Director / Company Secretary Chevron Lubricants Lanka PLC Chevron House, 490, Galle Road, Colombo 03,
Certificate of the Director on Transfer Pricing

50
Chevron Lubricants Lanka PLC
Remuneration Committee Report
Remuneration Policy Chevron Lubricants Lanka PLC provides a remuneration package to its employees in conformity with Chevron’s worldwide remuneration policy. The framework to determine the compensation and benefits package which links the remuneration to enterprise and individual performance is provided by Chevron Global TR (Total Remuneration) Group. The local HR team assists the process by providing salary survey information and market data to the Chevron Regional TR group to determine the annual salary structures.
Business unit leaders and supervisors are responsible for evaluating performance of each individual employee and the performance evaluations of CLLP’s functional leaders and are ranked accordingly. Based on this policy, the regional TR group proposes annual salary increases to each employee.
Surveys are commissioned periodically in order to assess the prevailing salary and benefit structure within the company, the findings of which are considered and reviewed by the Committee.
As was referred to in my report last year, the Committee is satisfied with the salary review process in place.
The aggregate remuneration paid to Executive and Non- Executive Directors is given on page 67.
Sgd. harsha amarasekera Chairman, Remuneration Committee
23 March 2017

51
Annual Report 2016
Independent Auditor’s Report
independent auditor’s Report To the shareholders of Chevron Lubricants Lanka PLCReport on the Financial Statements
1 We have audited the accompanying financial statements of Chevron Lubricants Lanka PLC, which comprise the statement of financial position as at 31 December 2016, and the statements of income, other comprehensive income, changes in equity and cash flow for the year then ended, and notes, comprising a summary of significant accounting policies and other explanatory information as set out in pages 7 to 28.
management’s responsibility for the financial statements 2 Management is responsible for the preparation and the presentation of financial statements that give a true and fair view in accordance with Sri Lanka Accounting Standards, and for such internal control as management determines is necessary to enable the preparation of financial statements that are free from material misstatements, whether due to fraud or error. auditor’s Responsibility 3 Our responsibility is to express an opinion on these financial statements based on our audit. We conducted our audit in accordance with Sri Lanka Auditing Standards. Those Standards require that we comply with ethical requirements and plan and perform the audit to obtain reasonable assurance about whether the financial statements are free from material misstatement.
An audit involves performing procedures to obtain audit evidence about the amounts and disclosures in the financial statements. The procedures selected depend on the auditor’s judgement, including the assessment of the risks of material misstatement of the financial statements, whether due
to fraud or error. In making those risk assessments, the auditor considers the internal control relevant to the entity’s preparation of financial statements that give a true and fair view in order to design audit procedures that are appropriate in the circumstances, but not for the purpose of expressing an opinion on the effectiveness of the entity’s internal control. An audit also includes evaluating the appropriateness of accounting policies used and the reasonableness of accounting estimates made by management, as well as evaluating the overall presentation of financial statements.
We believe that the audit evidence we have obtained is sufficient and appropriate to provide a basis for our audit opinion.
opinion 4 In our opinion the financial statements give a true and fair view of the financial position of Chevron Lubricants Lanka PLC as at 31 December 2016 and of its financial performance and its cash flows for the year then ended in accordance with Sri Lanka Accounting Standards
Report on other Legal and Regulatory Requirements5 These financial statements also comply with the requirements of Section 151(2) of the Companies Act, No. 7 of 2007.
COLOMBO CHARTERED ACCOUNTANTS

52
Chevron Lubricants Lanka PLC
Year ended 31 December Notes 2016 2015
Sales 5 12,089,110,879 11,563,854,206
Cost of sales (6,418,424,438) (6,368,022,136)
Gross profit 5,670,686,441 5,195,832,070
Other income 8 3,175,351 10,900,488
Distribution expenses (537,596,553) (501,918,210)
Administrative expenses (620,822,598) (561,582,482)
Operating profit 6 4,515,442,641 4,143,231,866
Finance income 9 187,266,438 175,350,343
Finance costs 9 (38,161) (38,355)
Finance income - net 9 187,228,277 175,311,988
Profit before tax 4,702,670,918 4,318,543,854
Income tax expenses 10 (1,222,260,985) (1,226,708,646)
Profit for the year 3,480,409,933 3,091,835,208
Earnings per share attributable to the owners of the Company during the year
Basic earnings per share (LKR) 11 14.50 12.88
Notes on pages 57 to 83 form an integral part of these financial statements
Report of the independent auditors’ on page 51
Income Statement(All amounts in notes are shown in Sri Lanka Rupees unless otherwise stated)

53
Annual Report 2016
Year ended 31 December Notes 2016 2015
Profit for the year 3,480,409,933 3,091,835,208
Other comprehensive income:
Items that will not be reclassified to profit or loss
Remeasurement of retirement benefit obligations 20 18,311,187 4,648,423
Deferred tax attributable to remeasurement of retirement benefit obligations 16 (5,127,132) (1,301,558)
Other comprehensive income for the year, net of tax 13,184,055 3,346,865
Total comprehensive income for the year 3,493,593,988 3,095,182,073
Notes on pages 57 to 83 form an integral part of these financial statements
Report of the independent auditors’ on page 51
Statement of Comprehensive Income(All amounts in notes are shown in Sri Lanka Rupees unless otherwise stated)

54
Chevron Lubricants Lanka PLC
Statement of Financial Position(All amounts in notes are shown in Sri Lanka Rupees unless otherwise stated)
Year ended 31 December Notes 2016 2015
AssetsNon-current assetsProperty, plant and equipment 13 2,132,857,872 2,195,826,396
Trade and other receivables 14 74,915,018 77,100,227
2,207,772,890 2,272,926,623
Current assetsInventories 17 1,789,584,711 1,308,618,987
Trade and other receivables 14 1,138,882,023 1,124,410,097
Cash and cash equivalents 18 1,910,266,703 2,339,048,578
4,838,733,437 4,772,077,662
Total assets 7,046,506,327 7,045,004,285
Equity and liabilitiesCapital and reservesStated capital 19 600,000,000 600,000,000
Retained earnings 3,260,622,616 4,087,028,628
3,860,622,616 4,687,028,628
Non-current liabilitiesRetirement benefit obligations 20 119,511,188 125,557,205
Deferred tax liabilities 16 246,303,605 173,641,215
365,814,793 299,198,420
Current liabilitiesTrade and other payables 21 2,139,094,343 1,347,178,568
Current income tax liabilities 680,974,575 711,598,669
2,820,068,918 2,058,777,237
Total liabilities 3,185,883,711 2,357,975,657
Total equity and liabilities 7,046,506,327 7,045,004,285
The Board of Directors is responsible for the preparation and I certify that these financial statements have been prepared inpresentation of these financial statements. The financial statements compliance with the requirements of the Companies Act, No. 7were authorised for issue by Board of Directors on 23 March 2017. of 2007.
kishu Gomes a.m anura Perera erande de Silva Managing Director Director / Chief Financial Officer Manager - Finance and Planning
Notes on pages 57 to 83 form an integral part of these financial statements
Report of the independent auditors’ on page 51

55
Annual Report 2016
Notes Statedcapital
Retained earnings
Total
Balance at 1 January 2015 600,000,000 4,599,210,366 5,199,210,366
Super gain tax for year of assessment 2013/14 10 (b) Nil (847,363,811) (847,363,811)
Profit for the year Nil 3,091,835,208 3,091,835,208
Other comprehensive income for the year, net of tax Nil 3,346,865 3,346,865
Total comprehensive income for the year Nil 3,095,182,073 3,095,182,073
Transactions with owners - Dividends 12 Nil (2,760,000,000) (2,760,000,000)
Balance at 31 December 2015 600,000,000 4,087,028,628 4,687,028,628
Balance at 1 January 2016 600,000,000 4,087,028,628 4,687,028,628
Profit for the year Nil 3,480,409,933 3,480,409,933
Other comprehensive income for the year, net of tax Nil 13,184,055 13,184,055
Total comprehensive income for the year Nil 3,493,593,988 3,493,593,988
Transactions with owners - Dividends 12 Nil (4,320,000,000) (4,320,000,000)
Balance at 31 December 2016 600,000,000 3,260,622,616 3,860,622,616
Notes on pages 57 to 83 form an integral part of these financial statements
Report of the independent auditors’ on page 51
Statement of Changes in Equity(All amounts in notes are shown in Sri Lanka Rupees unless otherwise stated)

56
Chevron Lubricants Lanka PLC
Year ended 31 December Notes 2016 2015
Cash flows from operating activities
Cash generated from operations 24 4,906,014,831 4,732,264,582
Interest paid 9 (38,161) (38,355)
Retirement benefits paid 20 (7,958,802) (8,228,541)
Income tax paid (1,185,349,822) (1,694,859,444)
Net cash generated from operating activities 3,712,668,046 3,029,138,242
Cash flows from investing activities
Purchase of property, plant and equipment 13 (91,316,443) (95,445,714)
Proceeds from disposal of property, plant and equipment 198,068 258,148
Interest received 149,668,454 154,569,025
Net cash generated from investing activities 58,550,079 59,381,459
Cash flows from financing activities
Dividends paid (4,200,000,000) (2,040,000,000)
Net cash used in financing activities (4,200,000,000) (2,040,000,000)
Net (decrease) / increase in cash and cash equivalents (428,781,875) 1,048,519,701
Movement in cash and cash equivalents
Cash and cash equivalents at beginning of year 2,339,048,578 1,290,528,877
(Decrease) / increase in cash and cash equivalents (428,781,875) 1,048,519,701
Cash and cash equivalents at end of year 18 1,910,266,703 2,339,048,578
Notes on pages 57 to 83 form an integral part of these financial statements
Report of the independent auditors’ on page 51
Cash Flow Statement (All amounts in notes are shown in Sri Lanka Rupees unless otherwise stated)
57
Annual Report 2016
Notes to the Financial Statements(All amounts in notes are shown in Sri Lanka Rupees unless otherwise stated)
1 General information Chevron Lubricants Lanka PLC carries on the business
of importing, blending, distributing and marketing of lubricant oils and greases. The Company is a public limited liability company incorporated and domiciled in Sri Lanka. The address of its registered office is Chevron House, 490, Galle Road, Colombo 03.
The Company has its primary listing on the Colombo Stock Exchange. The ultimate parent of the Company is Chevron Corporation Inc., incorporated in San Ramon - USA.
These financial statements have been approved for issue by the Board of Directors on 23 March 2017.
2 Summary of significant accounting policies The principal accounting policies applied in the
preparation of these financial statements are set out below. These policies have been consistently applied to all the years presented, unless otherwise stated.
2.1 Basis of preparation
The financial statements are prepared in accordance with and comply with Sri Lanka Accounting Standards (SLFRSs / LKASs). The financial statements are prepared under the historical cost convention. The Company’s financial statements are prepared in accordance with SLFRSs / LKASs, as issued by the Institute of Chartered Accountants of Sri Lanka.
The preparation of financial statements in conformity with SLFRSs / LKASs requires the use of certain critical accounting estimates. It also requires management to exercise judgement in the process of applying the Company’s accounting policies. The areas involving a higher degree of judgement or complexity or areas where assumptions and estimates are significant to the financial statements are disclosed in Note 4.
2.2 Changes in accounting policies and disclosures
(a) New accounting standards, amendments and interpretations issued but not yet adopted
Certain new accounting standards and interpretations have been published that are not
mandatory for 31 December 2016 reporting periods and have not been early adopted by the Company. The Company is yet to assess the impact of these new standards that are set out below:
(i) SLFRS 9 ‘Financial Instruments’, retains but simplifies the mixed measurement model in LKAS 39 ‘Financial Instruments: Recognition and Measurement’ and establishes a single model that has only three primary classification categories for financial assets: amortised cost, fair value through profit or loss and fair value through Other Comprehensive Income (“OCI”) for certain financial assets that are debt instruments. Classification of debt assets will be driven by the entity’s business model for managing the financial assets and the contractual cash flow characteristics of the financial assets. A debt instrument is measured at amortised cost only if the entity is holding it to collect contractual cash flows and the cash flows represent principal and interest. All other debt and equity instruments, including investments in complex debt instruments and equity investments, must be recognised at fair value. All fair value movements on financial assets are taken through the profit or loss, except for equity investments that are not held for trading, which may be recorded in the profit or loss or in reserves without subsequent recycling to the profit or loss. For financial liabilities, the standard retains most of the LKAS 39 requirements. These include amortised cost accounting for most financial liabilities, with bifurcation of embedded derivatives. The main change is that, in cases where the fair value option is taken for financial liabilities, the part of a fair value change due to an entity’s own credit risk is recorded in OCI rather than the profit or loss, unless this creates an accounting mismatch. The new hedge accounting rules align hedge accounting more closely with common risk management practices. As a general rule, it will be easier to apply hedge accounting going forward. Further, SLFRS 9 introduces a new expected credit losses model on impairment for all financial assets that replaces the incurred loss impairment model used in LKAS 39.

58
Chevron Lubricants Lanka PLC
The expected credit losses model is forward-looking and eliminates the need for a trigger event to have occurred before credit losses are recognised. SLFRS 9 also introduces expanded disclosure requirements and a change in presentation .The standard is effective for accounting periods beginning on or after 1 January 2018. Early adoption is permitted.
(ii) SLFRS 15 ‘Revenue from contracts with customers’ replaces LKAS 18 ‘Revenue’ and LKAS 11 ‘Construction contracts’ and related interpretations. The core principle in SLFRS 15 is that an entity recognises revenue to depict the transfer of promised goods or services to the customer in an amount that reflects the consideration to which the entity expects to be entitled in exchange for those goods or services.
Revenue is recognised when a customer obtains control of goods or services, i.e. when the customer has the ability to direct the use of and obtain the benefits from the goods or services. A new five-step process is applied before revenue can be recognised:
• Identify contracts with customers;
• Identify the separate performance obligations;
• Determine the transaction price of the contract;
• Allocate the transaction price to each of the separate performance obligations; and
• Recognise the revenue as each performance obligation is satisfied.
Key provisions of the new standard are as follows:
• Any bundled goods or services that are distinct must be separately recognised, and any discounts or rebates on the contract price must generally be allocated to the separate elements.
• If the consideration varies (such as for incentives, rebates, performance fees, royalties, success of an outcome etc), minimum amounts of revenue must be recognised If they are not at significant risk of reversal.
• The point at which revenue is able to be recognised may shift: some revenue which is
currently recognised at a point in time at the end of a contract may have to be recognised over the contract term and vice versa.
• There are new specific rules on licenses, warranties, non-refundable upfront fees, and consignment arrangements, to name a few.
• As with any new standard, there are also increased disclosures.
The standard is effective for accounting periods beginning on or after 1 January 2018. Entities will have a choice of full retrospective application, or prospective application with additional disclosures and earlier application is permitted.
There are no other standards or IFRIC interpretations that are not yet effective that would be expected to have a material impact to the Company.
2.3 Foreign currency translation
(a) Functional and presentation currency Items included in the financial statements are
measured using the currency of the primary economic environment in which the entity operates (‘the functional currency’). The financial statements are presented in Sri Lanka Rupees, which is the Company’s presentation currency.
Foreign exchange gains and losses are presented in the income statement within ‘net finance income’.
(b) Transactions and balances Foreign currency transactions are translated into
the functional currency using the exchange rates prevailing at the dates of the transactions or valuation where items are re-measured. Foreign exchange gains and losses resulting from the settlement of foreign currency transactions and from the translation at year end exchange rates of monetary assets and liabilities denominated in currencies other than the functional currency are recognised in the statement of comprehensive income.
Notes to the Financial Statements(All amounts in notes are shown in Sri Lanka Rupees unless otherwise stated)

59
Annual Report 2016
2.4 Property, plant and equipment
All property, plant and equipment is stated at historical cost less depreciation. Historical cost includes expenditure that is directly attributable to the acquisition of the items.
Where an item of property, plant and equipment comprises major components having different useful lives, they are accounted for as separate items of property, plant and equipment.
The cost of self-constructed assets include the cost of materials, direct labour and appropriate proportion of production overheads. Cost also includes site restoration costs.
Subsequent costs are included in the asset’s carrying amount or recognised as a separate asset, as appropriate, only when it is probable that future economic benefits associated with the item will flow to the Company and the cost of the item can be measured reliably. The carrying amount of the replaced part is derecognised. All other repairs and maintenance are charged to the statement of comprehensive income during the financial period in which they are incurred.
Capital work in progress represents all amounts paid on work undertaken, and still in an unfinished state as at the end of the year.
Depreciation is calculated on the straight line method to allocate the cost of each asset, to their residual values over their estimated useful lives commencing from date of availability for use. On disposal of assets, depreciation ceases on the date that the asset is derecognised.
The principal annual rates used for this purpose are: % Land improvements 3.57 - 5 Leasehold buildings 2.22 - 3.57 Storage tanks and pipe lines 6.25 Plant and machinery 6.25 - 20 Office furniture and equipment 10 - 20 Motor vehicles 10 - 20 Computers 16.67 - 33.33
Leasehold buildings are depreciated over the lesser of useful economic life and lease period.
The assets’ residual values and useful lives are reviewed, and adjusted if appropriate, at the end of each reporting period.
Gains and losses on disposals are determined by comparing the proceeds with the carrying amount and are recognised within other income in the statement of comprehensive income.
Where the carrying amount of an asset is greater than its estimated recoverable amount, it is written down immediately to its recoverable amount.
2.5 Impairment of non-financial assets
Assets are reviewed for impairment whenever events or changes in circumstances indicate that the carrying amount may not be recoverable. An impairment loss is recognised for the amount by which the asset’s carrying amount exceeds its recoverable amount. The recoverable amount is the higher of an asset’s fair value less costs to sell and value in use. For the purposes of assessing impairment, assets are grouped at the lowest levels for which there are separately identifiable cash flows (cash-generating units). Non-financial assets other than goodwill that suffered an impairment are reviewed for possible reversal of the impairment at each reporting date.
2.6 Accounting for leases - where the Company is the lessee
Leases of assets under which all the risks and benefits of ownership are effectively retained by the lessor are classified as operating leases. Payments made under operating leases are charged to the statement of comprehensive income on a straight-line basis over the period of the lease.
When an operating lease is terminated before the lease period has expired, any payment required to be made to the lessor by way of penalty is recognised as an expense in the period in which termination takes place.

60
Chevron Lubricants Lanka PLC
2.7 Financial assets
(a) Classification The Company classifies its financial assets in the
following categories: at fair value through profit or loss, loans and receivables, available for sale and held to maturity investments. The classification depends on the purpose for which the financial assets were acquired. Management determines the classification of its financial assets at initial recognition and re-evaluates this designation at every reporting date. At the reporting date, there were no financial assets at fair value through profit or loss, available for sale and held to maturity investments.
All financial assets are recognised initially at fair value plus, in the case of assets not at fair value through profit or loss, directly attributable transaction costs.
Loans and receivables Loans and receivables are non-derivative financial
assets with fixed or determinable payments that are not quoted in an active market. They are included in current assets as trade and other receivables except for maturities greater than 12 months after the end of reporting period. These are classified as non-current assets. The Company’s loans and receivables comprise trade and other receivables and cash and cash equivalents in the statement of financial position.
(b) Recognition and measurement of financial assets Regular purchases and sales of financial assets are
recognised on the trade date – the date on which the Company commits to purchase or sell the asset. Financial assets are derecognised when the rights to receive cash flows from the investments have expired or have been transferred and the Company has transferred substantially all risks and rewards of ownership. Loans and receivables are carried at amortised cost using the effective interest method.
(c) Impairment of financial assets Assets carried at amortised cost The Company assesses at the end of each reporting
period whether there is objective evidence that a financial asset or a group of financial assets is impaired. A financial asset or a group of financial assets is impaired and impairment losses are incurred only if there is objective evidence of impairment as a result of one or more events that occurred after the initial recognition of the asset (a ‘loss event’) and that loss event (or events) has an impact on the estimated future cash flows of the financial asset or a group of financial assets that can be reliably estimated.
For loans and receivables category, the amount of the loss is measured as the difference between the asset’s carrying amount and the present value of estimated future cash flows (excluding future credit losses that have not been incurred) discounted at the financial asset’s original effective interest rate. The carrying amount of the asset is reduced and the amount of the loss is recognised in the statement of comprehensive income. Cash flows relating to loans and receivables falling due within a period of less than one year are not discounted if the effect of discounting is immaterial.
Impairment testing of trade receivables is described in Note 2.10.
2.8 Financial liabilities
2.8.1 Classification and initial recognition
Financial liabilities are initially recognised at fair value, net of transaction costs.
The Company’s financial liabilities consist of trade and other payables. Trade payables are obligations to pay for goods or services that have been acquired in the ordinary course of business from suppliers. Trade payables are classified as current liabilities if payment is due within one year or less (or in the normal operating cycle of the business if longer). If not, they are presented as non-current liabilities.
2.8.2 Subsequent measurement
Financial liabilities are subsequently carried at amortised cost using effective interest method.
Notes to the Financial Statements(All amounts in notes are shown in Sri Lanka Rupees unless otherwise stated)

61
Annual Report 2016
2.8.3 Derecognition
The Company derecognises a financial liability when its contractual obligations are discharged or cancelled or expired.
2.8.4 Offsetting financial instruments
Financial assets and liabilities are offset and the net amount reported in the statement of financial position when there is a legal enforceable right to offset the recognised amounts and there is an intention to settle on a net basis or realise the asset and settle the liability simultaneously. The legally enforceable right must not be contingent on future events and must be enforceable in the normal course of business and in the event of default, insolvency or bankruptcy of the Company or the counterparty.
2.9 Inventories
Inventories are stated at the lower of cost and net realisable value. Cost is determined on a weighted average basis. The cost of finished goods comprises raw materials, direct labour, other direct costs and related production overheads, but excludes interest expense. Net realisable value is the estimate of the selling price in the ordinary course of business, less the costs of completion and selling expenses.
2.10 Trade receivables
Trade receivables are amounts due from customers for goods sold or services performed in the ordinary course of business. If collection is expected in one year or less (or in the normal operating cycle of the business if longer), they are classified as current assets. If not, they are presented as non-current assets.
Trade receivables are recognised initially at fair value and subsequently measured at amortised cost using the effective interest method, less provision for impairment. A provision for impairment of trade receivables is established when there is objective evidence that the Company will not be able to collect all amounts due according to the original terms of receivables. Significant financial difficulties of the debtor, probability that the debtor will enter bankruptcy or financial reorganisation,
and default or delinquency in payments are considered indicators that the trade receivable is impaired. The amount of the provision is the difference between the asset’s carrying amount and the present value of estimated future cash flows, discounted at the original effective interest rate.
The carrying amount of the asset is reduced through the use of an allowance account, and the amount of the loss is recognised in the statement of comprehensive income within distribution expenses. When a trade receivable is uncollectible, it is written off against the allowance account for trade receivables. Subsequent recoveries of amounts previously written off are credited against distribution expenses in the statement of comprehensive income.
2.11 Cash and cash equivalents
For the purposes of the cash flow statement, cash and cash equivalents comprise cash in hand, deposits held at call with banks, other short-term highly liquid investments with original maturities of three months or less, net of bank overdrafts. In the statement of financial position, bank overdrafts are included in borrowings in current liabilities.
2.12 Stated capital
Ordinary Shares are classified as equity.
2.13 Employee benefits
(a) Defined contribution plans Defined contribution plan is a plan under which the
Company pays a fixed contribution into a separate entity. All employees of the Company in Sri Lanka are members of the Employees’ Provident Fund and Employees’ Trust Fund, to which the Company contributes 15% and 3% respectively, of employees’ basic or consolidated wage or salary. The Company has no further payment obligations once the contributions have been paid. The contributions are recognised as employee benefit expenses when they are due.
62
Chevron Lubricants Lanka PLC
(b) Defined benefit obligation A defined benefit plan is a plan that is not a
defined contribution plan. Defined benefit plan defines an amount of benefit that an employee will receive on retirement, usually dependent on one or more factors such as age, years of service and compensation.
The Company pays gratuity to its eligible employees computed at one month’s salary for each completed year of service ,which exceeds the amount stipulated by the Gratuity Act, No. 12 of 1983, which is a defined benefit plan.
The liability recognised in the statement of financial position in respect of gratuity is the present value of the defined benefit obligation at the statement of financial position date together with adjustments for unrecognised past-service costs. The defined benefit obligation is calculated annually by independent actuaries using the projected unit credit method. The present value of the defined benefit obligation is determined by discounting the estimated future cash outflows using interest rates of government bonds, as there is no deep market on high quality corporate bonds, by the actuarial valuer.
Past service costs are recognised immediately as an expense in the statement of comprehensive income, unless the changes to the plan are conditional on the employees remaining in service for a specified period of time (vesting period). In this case, the past service costs are amortised on a straight-line basis over the vesting period.
Actuarial gains and losses from experience adjustments and changes in actuarial assumptions are recognised under other comprehensive income of the statement of comprehensive income.
The assumptions based on which the results of the actuarial valuation was determined, are included in Note 20 to the financial statements.
2.14 Current and deferred income tax
The tax expense for the period comprises current and deferred tax.
The provision for current income tax is based on the elements of income and expenditure as reported in the financial statements and computed in accordance with the tax laws enacted or substantively enacted at the date of the statement of financial position.
Deferred income tax is recognised using the liability method on all temporary differences arising between the tax bases of assets and liabilities and their carrying values in the financial statements. Deferred income tax is determined using tax rates that have been enacted or substantively enacted by the statement of financial position date and are expected to apply when the related deferred income tax asset is realised or the deferred income tax is settled.
Deferred income tax assets are recognised only to the extent that it is probable that future taxable profit will be available against which the temporary differences can be utilised.
Deferred income tax assets and liabilities are offset when there is a legally enforceable right to offset current tax assets against current tax liabilities and when the deferred income tax assets and liabilities relate to income taxes levied by the same taxation authority on either the same taxable entity or different taxable entities where there is an intention to settle the balances on a net basis.
The principal temporary differences arise from depreciation on property, plant and equipment and defined benefit obligations.
2.15 Provisions
Provisions are recognised when the Company has a present legal or constructive obligation as a result of past events; it is probable that an outflow of resources will be required to settle the obligation; and the amount has been reliably estimated. Provisions are not recognised for future operating losses.
Notes to the Financial Statements(All amounts in notes are shown in Sri Lanka Rupees unless otherwise stated)

63
Annual Report 2016
Where there are a number of similar obligations, the likelihood that an outflow will be required in settlement is determined by considering the class of obligations as a whole. A provision is recognised even if the likelihood of an outflow with respect to any one item included in the same class of obligations may be small.
Provisions are measured at the present value of the expenditures expected to be required to settle the obligation using a pre-tax rate that reflects current market assessments of the time value of money and the risks specific to the obligation. The increase in the provision due to passage of time is recognised as interest expense.
2.16 Revenue recognition
Revenue comprises the fair value of the consideration received or receivable for the sale of goods and services in the ordinary course of the Company’s activities. Revenue is shown net of value-added tax, returns, rebates and discounts.
The Company recognises revenue when the amount of revenue can be reliably measured, it is probable that future economic benefits will flow to the entity and specific criteria have been met for each of the Company’s activities as described below. The amount of revenue is not considered to be reliably measurable until all contingencies relating to the sale have been resolved.
(a) Sale of goods Sale of goods are recognised on delivery of products
to the customer, the customer has accepted the products and collectability of the related receivables is reasonably assured.
(b) Interest income Interest income is recognised on a time-proportion
basis using the effective interest method unless collectability is in doubt.
2.17 Dividend distribution
Final dividend distribution to the Company’s shareholders is recognised as a liability in the Company’s financial
statements in the period in which the dividends are approved by the Company’s shareholders.
2.18 Segment reporting
A segment is a distinguishable component of an enterprise that is engaged in either providing products or services (Business segment) or in providing products or services within a particular economic environment (Geographical segment), which is subject to risk and rewards that are different from those of other segments.
However, there are no distinguishable components to be identified as segments for the Company.
3 Financial risk management3.1 Financial risk
3.1.1 Financial risk factors
The Company’s activities expose it to a variety of financial risks. Market risk (including currency risk, interest rate risk and price risk), credit risk and liquidity risk. The Company’s overall risk management programme focuses on the unpredictability of financial risks and seeks to minimise potential adverse effects on the Company’s financial performance.
Risk management is performed by the management under policies approved by the board of directors. The board provides guidance for overall risk management.
The principal financial instruments of the Company comprise of short term deposits, money market investments, and cash. The main purpose of these finance instruments is to raise and maintain liquidity for the Company’s operations, and maximise returns on the Company’s financial reserves. The Company has various other financial instruments such as trade receivables and trade payables which arise directly from its business activities.
(a) Market risk(i) Foreign exchange risk The Company is principally exposed to fluctuations
in the value of the US Dollar (USD) against the Sri Lankan Rupee (LKR). The Company’s functional

64
Chevron Lubricants Lanka PLC
currency is LKR in which most of the transactions are denominated, and all other currencies are considered foreign currencies for reporting purposes. Certain bank balances, trade receivables, and trade payables are denominated in foreign currencies.
The Company’s financial statements which are presented in LKR, are affected by foreign exchange fluctuations through both translation risk and transaction risk. Changes in foreign currency exchange rates may affect the Company’s cost of materials purchased and services obtained from related companies in foreign currencies. In particular, depreciation of the LKR against the USD can impact the Company’s operating results through its impact on cost of imported raw materials.
Sensitivity analysis As at 31 December 2016, a foreign exchange loss
of LKR 3,229,366 would have resulted if LKR had weakened by 1% against USD with all other variables held constant on translation of year end foreign currency denominated balances.
(b) Credit risk The credit quality of financial assets that are neither
past due nor impaired can be assessed by reference to external credit ratings (if available) or to historical information about counterparty default rates.
Credit risk arises from cash and cash equivalents and deposits with banks and financial institutions, as well as credit exposures to customers, including outstanding receivables and committed transactions.
Trade receivables The Company is responsible for managing and
analysing the credit risk for each of their new customers before standard payment and delivery terms and conditions are offered. The management assesses the credit quality of the customer, taking into account its financial position, past experience and other factors. The utilisation of credit limits
is regularly monitored. Management does not expect any losses from non-performance by these counterparties.
Cash and cash equivalents The company invests in government security and
rated banks. The company limits the concentration of financial exposure to any single financial institution.
(c) Liquidity risk In the management of liquidity risk, the Company
monitor and maintain a level of cash in hand at bank deemed adequate by the management to finance the Company’s operations and to mitigate the effects of fluctuations in cash flows. The Company’s objective is to maintain a balance between continuity of funding and flexibility through the use of available bank facilities. Access to source of funding is sufficiently available.
Surplus cash held over and above the amount required for working capital management is invested in interest bearing savings accounts, treasury bills and repurchase agreements, time deposits, choosing instruments with appropriate maturities or sufficient liquidity to provide sufficient head-room. At the reporting date, the Company held money market funds of LKR 1,510,800,000 (2015 - LKR 1,964,800,000) and other liquid assets of LKR 1,471,183,117 (2015 - LKR 1,446,155,968) that are expected to readily generate cash inflows for managing liquidity risk.
The table below analyses the Company’s non-derivative financial liabilities into relevant maturity groupings based on the remaining period at the statement of financial position date to the contractual maturity date. The amounts disclosed in the table are the contractual undiscounted cash flows.
Notes to the Financial Statements(All amounts in notes are shown in Sri Lanka Rupees unless otherwise stated)

65
Annual Report 2016
As at 31 December 2016 Less than 3months
Between 3months and 1 year
Between 1 and 2 years
Between 2 and 5 years
Over 5 years
Liabilities
Trade and other payables
(excluding statutory payables) 917,767,464 Nil Nil Nil Nil
Amounts due to related parties (Note 21) 1,070,903,319 Nil Nil Nil Nil
Total liabilities 1,988,670,783 Nil Nil Nil Nil
As at 31 December 2015 Less than 3months
Between 3months and 1 year
Between 1 and 2 years
Between 2 and 5 years
Over 5 years
Liabilities
Trade and other payables
(excluding statutory payables) 726,774,467 Nil Nil Nil Nil
Amounts due to related parties (Note 21) 536,618,303 Nil Nil Nil Nil
Total liabilities 1,263,392,770 Nil Nil Nil Nil
(d) Price risk The Company is exposed to the commodity price risk
pertaining to base oils.
The Company monitors price of base oils on a dynamic basis and manages procurement accordingly.
(e) Interest rate risk The Company has cash and bank balances including
deposits placed with government and creditworthy banks. The Company monitors interest rate risk by actively monitoring the yield curve trends and interest rate movements.
3.2 Capital risk management
The Company’s objectives when managing capital are to safeguard the Company’s ability to continue as a going concern in order to provide returns for shareholders and benefits for other stakeholders and to maintain an optimal capital structure to reduce the cost of capital.
The capital structure of the Company represents equity attributable to owners of the Company, comprising issued stated capital and retained earnings.
The Company has not obtained any debt facilities (other than temporary bank overdrafts) to finance operations over the past 5 years.
4 Critical accounting estimates and judgements Estimates and judgements are continually evaluated and
are based on historical experience and other factors, including expectations of future events that are believed to be reasonable under the circumstances.
4.1 Critical accounting estimates and assumptions
The Company makes estimates concerning the future. The resulting accounting estimates will, by definition, seldom equal the related actual results. The estimates that have a significant risk of causing a material adjustment to the carrying amount of assets and liabilities within the next financial year are discussed below.
(a) Estimated useful lives of property, plant and equipment (PPE)
The Company reviews annually the estimated useful lives of PPE based on factors such as business plan and strategies, expected level of usage and future developments. Future results of operations could be materially affected by changes in these estimates

66
Chevron Lubricants Lanka PLC
brought about by changes in the factors mentioned. A reduction in the estimated useful lives of PPE would increase the recorded depreciation charge and decrease the PPE balance.
(b) Defined benefit obligations The present value of the gratuity obligations depends
on a number of factors that are determined on an actuarial basis using a number of assumptions. The assumptions used in determining the net cost for gratuity include the discount rate. Any changes in these assumptions will impact the carrying amount of gratuity obligations.
The Company determines the appropriate discount rate at the end of each year. This is the interest rate that should be used to determine the present value of estimated future cash outflows expected to be required to settle the gratuity obligations. In determining the appropriate discount rate, the Company considers the interest rates of government bonds that are denominated in the currency in which the benefits will be paid and that have terms to maturity approximating the terms of the related pension obligation.
Other key assumptions for defined benefit obligations are based in part on current market conditions, additional information is disclosed in Note 20.
(c) Allowance for doubtful debts The Company assesses at the date of statement
of financial position whether there is objective evidence that trade receivables have been impaired. Impairment loss is calculated based on a review of the current status of existing receivables and historical collections experience. Such provisions are adjusted periodically to reflect the actual and anticipated impairment.
(d) Estimated impairment of non-current assets The Company reviews for impairment of property,
plant and equipment in accordance with the Accounting Policy in Note 2.5. The recoverable amount of these assets have been determined based on higher of the assets’ fair value less cost to sell and value in use. These calculations require the use of estimates and judgements.
Management believes that any reasonably possible change in the estimated future cash flows of the operations on which the recoverable amounts of the cash-generating units is based would not cause the cash-generating units’ carrying amount to exceed its recoverable amount.
4.2 Critical judgements in applying the entity’s accounting policies
No critical judgements have been made in applying the entity’s accounting policies.
Notes to the Financial Statements(All amounts in notes are shown in Sri Lanka Rupees unless otherwise stated)

67
Annual Report 2016
5 Sales Sales are arrived as follows:
2016 2015
Net sales 12,089,110,879 11,563,854,206
6 expenses by nature
2016 2015
Directors' emoluments
- executive 39,417,137 38,124,545
- non executive 5,430,000 6,757,319
44,847,137 44,881,864
Auditors' remuneration
- audit 2,103,372 1,947,567
- non audit 120,000 120,000
2,223,372 2,067,567
Depreciation on property, plant and equipment (Note 13) 150,965,946 143,068,133
Amortisation of marketing support fee paid [Note 14(f)] 22,159,697 23,514,007
Reversal of provision for impairment on trade receivables [Note 14(i)] (769,167) (5,378,977)
Property, plant and equipment written off (Note 13) 3,229,982 167,168
Repair and maintenance expenditure 17,887,425 9,611,912
Operating lease rental - property 43,528,808 38,982,620
Employee benefit costs (Note 7) 236,516,795 226,911,709
7 Employee benefit costs
2016 2015
Salaries and wages 189,246,915 183,011,302
Contribution to defined contribution plans 27,045,908 25,367,867
Contribution to defined benefit obligations (Note 20) 20,223,972 18,532,540
236,516,795 226,911,709
Average monthly number of persons employed by the Company during the year:
Permanent employees 79 78
79 78

68
Chevron Lubricants Lanka PLC
8 other income
2016 2015
Scrap sales 310,406 4,599,152
Write back of unassigned credit balances in debtors ledger 410,640 1,547,833
Profit on disposal of property, plant and equipment 109,029 258,148
Empty drum sales 2,345,276 4,495,355
3,175,351 10,900,488
9 Finance income and costs
2016 2015
Finance income:Interest income on short term deposits 144,584,231 159,441,176
Interest income on employee loans 545,814 667,966
145,130,045 160,109,142
Net foreign exchange transaction and translation gains 42,136,393 15,241,201
187,266,438 175,350,343
Finance costs:
Interest expense on bank overdraft (38,161) (38,355)
Finance income - net 187,228,277 175,311,988
10 Tax
2016 2015
Current tax:
Current tax on profits for the year 1,157,736,574 1,080,620,717
(Over) / under provision for income tax in respect of previous years (3,010,847) 75,343,906
1,154,725,727 1,155,964,623
Deferred tax :
Origination of temporary differences (Note 16) 67,535,258 70,744,023
Income tax expense 1,222,260,985 1,226,708,646
Deferred tax charged to other comprehensive Income (Note 16) 5,127,132 1,301,558
1,227,388,117 1,228,010,204
The tax on the Company’s profit before tax differs from theoretical amount that would arise using the basic tax rate of the Company as follows:
Notes to the Financial Statements(All amounts in notes are shown in Sri Lanka Rupees unless otherwise stated)

69
Annual Report 2016
2016 2015
Profit before tax 4,702,670,918 4,318,543,854
Tax calculated at a tax rate of 28% (2015 - 28%) 1,316,747,857 1,209,192,280
Tax effects of:
- Different tax rates (69,514,282) (45,799,514)
- Income not subject to tax (10,904,052) (3,885,266)
- Expenses not deductible for tax purposes 17,288,749 20,203,680
Tax effect of qualifying payments [See Note (a) below] (28,346,440) (28,346,440)
Under / (over) provision for income tax in respect of previous years (3,010,847) 75,343,906
Tax charge 1,222,260,985 1,226,708,646
(a) The company has claimed qualifying payment relief in terms of Section 34 (2) (s) of the Inland Revenue (Amendment) Act No. 8 of 2012 on the investments made in the expansion of its plant. Accordingly, out the sum of Rs. 404,949,140 directly attributable to expansion, the company has already claimed Rs. 303,711,855 for years of assessment 2013/14, 2014/15, 2015/16 and would be claiming Rs. 101,237,285 for the year of assessment 2016/17. The Company has no further unclaimed investment relief as of 31 December 2016.
(b) As per the provisions of Part III of the Finance Act, No. 10 of 2015 which was certified on 30 October 2015, the Company was liable for Super Gain Tax of Rs. 847,363,811. According to the Act, the Super Gain Tax shall be deemed to be an expenditure in the financial statements relating to the year of assessment which commenced on 1 April 2013. The Act supersedes the requirements of the Sri Lanka Accounting Standards, hence the expense of Super Gain Tax is accounted in accordance with the requirements of the said Act as recommended by the Statement of Alternative Treatment (SoAT) on Accounting for Super Gain Tax issued by the Institute of Chartered Accountants of Sri Lanka, dated 24 November 2015.
11 earnings per share Basic earnings per share is calculated by dividing the net profit attributable to shareholders by the number of shares in issue as
at end of the year.
2016 2015
Profit attributable to shareholders 3,480,409,933 3,091,835,208
Number of ordinary shares in issue at 31 December (Note 19) 240,000,000 240,000,000
Basic earnings per share (LKR) 14.50 12.88
The Shareholders of the Company ratified the proposed share sub-division of one into two of the issued ordinary shares at the extra ordinary general meeting held on the 7 June 2016. The share sub-division increased the number of shares two-fold from 120,000,000 to 240,000,000 shares. Therefore Basic EPS for 2015 has been restated in accordance with LKAS 33.
12 dividends
2016 2015
Proposed and paid interim dividend LKR 18.00 per share (2015 - LKR 23.00 per share) 4,320,000,000 2,760,000,000

70
Chevron Lubricants Lanka PLC13
Pr
oper
ty, p
lant
and
equ
ipm
ent
Land
impr
ovem
ent
Leas
ehold
bu
ilding
s St
orag
e ta
nks
Plan
t and
m
achin
ery
Offi
ce
furn
iture
and
equip
ment
Mot
or
vehic
les C
ompu
ters
Cap
ital
wor
k in
prog
ress
Total
Year
ende
d 31
Dec
embe
r 201
5 O
penin
g ne
t boo
k am
ount
20
6,516
,945
1,109
,639,2
51
382,8
58,37
6 4
43,87
3,023
4
8,360
,955
24,23
4,618
13
,225,7
93
14,90
7,022
2,
243,6
15,98
3 A
dditi
ons
Nil
2,09
5,921
N
il 9,
861,7
32
12,60
2,198
10
,200,
000
17,0
99,23
9 4
3,586
,624
95,44
5,714
Tr
ansfe
rred
from
capi
tal w
ork-
in-pr
ogre
ss
Nil
Nil
Nil
3,39
1,020
N
il N
il 10
,822,1
67
(14,2
13,18
7) N
il W
rite
offs
- cos
t (No
te 6
) N
il N
il N
il (4
,186,5
26)
(5,90
3,221
) N
il (7
,834,5
11) N
il (1
7,924
,258)
- a
ccum
ulate
d dep
recia
tion (
Note
6)
Nil
Nil
Nil
4,13
1,889
5,
903,2
21
Nil
7,72
1,980
N
il 17
,757,0
90
Disp
osals
- co
st
Nil
Nil
Nil
Nil
Nil
Nil
(8,89
6,130
) N
il (8
,896,1
30)
- a
ccum
ulate
d de
prec
iatio
n N
il N
il N
il N
il N
il N
il 8,
896,1
30
Nil
8,89
6,130
D
epre
ciatio
n ch
arge
(Not
e 6)
(7
,594,0
79)
(39,9
08,80
3) (2
5,345
,747)
(48,7
62,80
5) (6
,730,1
17) (5
,197,1
16)
(9,52
9,466
) N
il (1
43,0
68,13
3) C
losin
g ne
t boo
k am
ount
19
8,922
,866
1,071,
826,3
69
357,5
12,62
9 4
08,30
8,333
54
,233,0
36
29,23
7,502
31
,505,2
02
44,2
80,45
9 2,
195,8
26,39
6
At 3
1 Dec
embe
r 201
5 C
ost
210,
872,9
29
1,124
,170,1
76
416
,776,9
78
598,3
40,76
5 86
,772,5
97
60,84
7,459
56
,594,8
98
44,2
80,45
9 2,
598,6
56,26
1 A
ccum
ulate
d de
prec
iatio
n (1
1,950
,063
) (5
2,343
,807)
(59,2
64,34
9) (1
90,0
32,43
2) (3
2,539
,561)
(31,6
09,95
7) (2
5,089
,696)
Nil
(402
,829,8
65)
Net
boo
k am
ount
19
8,922
,866
1,071,
826,3
69
357,5
12,62
9 4
08,30
8,333
54
,233,0
36
29,23
7,502
31
,505,2
02
44,2
80,45
9 2,
195,8
26,39
6
Year
ende
d 31
Dec
embe
r 201
6 O
penin
g ne
t boo
k am
ount
19
8,922
,866
1,071,
826,3
69
357,5
12,62
9 4
08,30
8,333
54
,233,0
36
29,23
7,502
31
,505,2
02
44,2
80,45
9 2,
195,8
26,39
6 A
dditi
ons
9,99
7,492
3,
690,1
37
5,63
8,514
5,
744,8
79
13,49
1,443
N
il 4
,838,7
81
47,9
15,19
7 91
,316,4
43
Tran
sferre
d fro
m ca
pita
l wor
k-in-
prog
ress
N
il 10
,389,3
29
Nil
29,53
5,857
3,
400,
771
179,5
00
775,0
00
(44,2
80,45
7) N
il W
rite
offs
- cos
t (No
te 6
) (6
05,0
20)
(369
,832)
Nil
(10,
402,4
59)
(2,91
2,384
) N
il (1
,515,0
00)
Nil
(15,8
04,69
5)
- acc
umula
ted d
epre
ciatio
n (No
te 6)
4
67,37
8 16
7,051
N
il 7,
887,9
27
2,53
7,357
N
il 1,5
15,0
00
Nil
12,57
4,713
D
ispos
als -
cost
N
il N
il N
il N
il (1
,282,8
12)
(124
,000
) N
il N
il (1
,406,8
12)
- a
ccum
ulate
d de
prec
iatio
n N
il N
il N
il N
il 1,1
93,77
3 12
4,000
N
il N
il 1,3
17,77
3 D
epre
ciatio
n ch
arge
(Not
e 6)
(7
,785,5
92)
(40,
350,
683)
(25,5
26,60
5) (5
1,715
,552)
(8,81
7,153
) (6
,261,4
85)
(10,
508,8
76)
Nil
(150
,965,9
46)
Clo
sing
net b
ook a
mou
nt
200,9
97,12
4 1,0
45,35
2,371
33
7,624
,538
389,3
58,98
5 61
,844,0
31
23,15
5,517
26
,610,1
07
47,9
15,19
9 2,
132,8
57,87
2
At 3
1 Dec
embe
r 201
6 C
ost
220,
265,4
01
1,137
,879,8
10
422
,415,4
92
623,2
19,0
42
99,46
9,615
60
,902,9
59
60,69
3,679
4
7,915
,199
2,67
2,761
,197
Acc
umula
ted
depr
eciat
ion
(19,2
68,27
7) (9
2,527
,439)
(84,7
90,95
4) (2
33,86
0,05
7) (3
7,625
,584)
(37,7
47,44
2) (3
4,083
,572)
Nil
(539
,903,3
25)
Net
boo
k am
ount
20
0,997
,124
1,045
,352,3
71
337,6
24,53
8 38
9,358
,985
61,84
4,031
23
,155,5
17
26,61
0,107
4
7,915
,199
2,13
2,857
,872
(a)
Pr
oper
ty, p
lant
and
equ
ipm
ent i
nclu
des f
ully
dep
reci
ated
ass
ets
still
in b
ooks
, the
cos
t of w
hich
at 3
1 Dec
embe
r 20
16 a
mou
nted
to L
KR
12
4,57
7,063
(20
15 -
LKR
123,
517,
320)
.
(b)
D
epre
ciat
ion
expe
nse
of L
KR 12
7,25
4,48
0 (2
015
- LK
R 12
0,56
9,66
4) h
as b
een
char
ged
in c
ost o
f goo
ds s
old,
LKR
8,2
30,5
22 (2
015
- LK
R 7,
228,
671)
as
adm
inist
rativ
e e
xpen
ses
and
LKR
15,4
80,9
44 (
2015
- LK
R 15
,269
,798
) as
selli
ng a
nd d
istrib
utio
n ex
pens
es.
Notes to the Financial Statements(All amounts in notes are shown in Sri Lanka Rupees unless otherwise stated)

71
Annual Report 2016
14 Trade and other receivables
2016 2015
Trade receivables 1,087,731,783 1,088,691,927
Less: provision for impairment of trade receivables (16,015,370) (16,784,537)
Trade receivables - net 1,071,716,413 1,071,907,390
Prepayments 15,472,722 878,083
Deposits 27,787,143 26,898,442
Staff loans [refer (e) below] 28,643,415 30,402,330
Marketing support fee paid to service
centre operators [refer (f) below] 41,523,903 46,744,101
Other receivables [refer (d) below] 7,073,322 12,595,348
1,192,216,918 1,189,425,694
Receivable from related parties [Note 25 (d) (i)] 21,580,123 12,084,630
Total trade and other receivables 1,213,797,041 1,201,510,324
Less: non-current portion
Staff loans 21,475,530 23,480,658
Marketing support fee paid to service centre operators 25,652,345 26,721,127
Deposits 27,787,143 26,898,442
Total non-current portion 74,915,018 77,100,227
Current portion 1,138,882,023 1,124,410,097
(a) Trade receivables by credit quality:
2016 2015
Neither past due nor impaired 1,000,003,119 1,025,273,434
Past due but not impaired 71,713,294 46,633,956
Impaired 16,015,370 16,784,537
1,087,731,783 1,088,691,927
(b) The past due but not impaired balance relates to a number of independent customers for whom there is no recent history of default or in circumstances where sufficient collateral is available. The age analysis of past due but not impaired balance is as follows:
2016up to 3 months 3 to 6 months over 6 months Total
Past due but not impaired 66,141,361 5,571,933 Nil 71,713,294

72
Chevron Lubricants Lanka PLC
2015Up to 3 months 3 to 6 months Over 6 months Total
Past due but not impaired 44,696,619 1,917,598 19,739 46,633,956
The impaired receivables have been fully provided for.
(c) The carrying amounts of trade and other receivables are denominated in following currencies:
2016 2015
US Dollars 172,640,974 129,829,110
Sri Lankan Rupees 1,041,156,067 1,071,681,214
1,213,797,041 1,201,510,324
(d) Other receivables mainly consist of interest receivable of LKR 3,644,099 (2015 - LKR 8,182,507) on short term deposits.
(e) Staff loans due at the financial position date represent loans given to staff on fixed repayment terms and are unsecured. These loans are largely given at a concessionary rate of 4.2% p.a. (2015 - 4.2% p.a.).
(f) Marketing support fee is an advance payment made to the service station operators under which a bulk payment is made at the beginning of the contract period to meet the marketing expenses over the contract period. Service station operator should guarantee a minimum volume over the contract period to meet his obligations under the contract. If the terms are not met, service station operator is required to refund to the Company a proportionate amount of the bulk payment. The marketing support payment is amortised over the contract period and amortisation charge is recognised in the statement of comprehensive income.
(g) The effective market interest rates on non-current receivables (staff loans) as at 31 December 2016 were 15% p.a. (2015 - 11% p.a.).
(h) The maximum exposure to credit risk at the reporting date is the carrying value of each class of receivables mentioned above. However, the Company does hold collateral security for a proportion of its trade receivables.
(i) Movement of the provision for impairment of trade receivables is as follows:
2016 2015
At 1 January 16,784,537 22,163,514
Reversal of provision for impairment (Note 6) (769,167) (5,378,977)
At 31 December 16,015,370 16,784,537
Notes to the Financial Statements(All amounts in notes are shown in Sri Lanka Rupees unless otherwise stated)

73
Annual Report 2016
15 Financial instruments by category
Loans andreceivables
Total
a) 31 December 2016 Financial assets - measured at amortised cost
Trade and other receivables (excluding prepayments and
marketing support fee paid to service centre operators) 1,156,800,416 1,156,800,416
Cash and cash equivalents (Note 18) 1,910,266,703 1,910,266,703
3,067,067,119 3,067,067,119
Other financial liabilities
Total
b) 31 December 2016 Financial liabilities - measured at amortised cost
Trade and other payables (excluding statutory liabilities) 1,988,670,783 1,988,670,783
Loans andreceivables
Total
c) 31 December 2015 Financial assets - measured at amortised cost
Trade and other receivables (excluding prepayments and
marketing support fee paid to service centre operators) 1,153,888,140 1,153,888,140
Cash and cash equivalents (Note 18) 2,339,048,578 2,339,048,578
3,492,936,718 3,492,936,718
Loans andreceivables
Total
d) 31 December 2015 Financial liabilities - measured at amortised cost 1,263,392,770 1,263,392,770

74
Chevron Lubricants Lanka PLC
e) Credit quality of financial assets that are not impaired can be assessed by reference to historical information.
2016 2015
Trade receivables Distributors 704,799,636 746,588,586
Commercial / industrial and others 275,849,790 232,706,159
Export customers / overseas 91,066,987 92,612,645
1,071,716,413 1,071,907,390
2016 2015
Cash and cash equivalents 399,313,197 374,025,518
Cash at Banks with AAA to A ratings 1,510,800,000 1,964,800,000
Government securities 153,506 223,060
Cash in hand 1,910,266,703 2,339,048,578
16 deferred tax liabilities Deferred tax is calculated on all temporary differences under the liability method using an effective tax rate of 28% (2015 - 28%).
The gross movement on the deferred income tax account is as follows:
2016 2015
At beginning of year 173,641,215 101,595,634
Charged to income statement (Note 10) 67,535,258 70,744,023
Charged to other comprehensive income (Note 10) 5,127,132 1,301,558
At end of year 246,303,605 173,641,215
The analysis of deferred tax assets and deferred tax liabilities is as follows:
2016 2015
Deferred tax assets- Deferred tax assets to be recovered after more than 12 months (28,982,273) (30,421,996)
- Deferred tax assets to be recovered within 12 months (4,480,862) (4,734,022)
(33,463,135) (35,156,018)
Deferred tax liabilities- Deferred tax liability to be recovered after more than 12 months 210,102,965 144,529,664
- Deferred tax liability to be recovered within 12 months 69,663,775 64,267,569
279,766,740 208,797,233
Deferred tax liabilities - net 246,303,605 173,641,215
Notes to the Financial Statements(All amounts in notes are shown in Sri Lanka Rupees unless otherwise stated)

75
Annual Report 2016
Deferred tax liabilities Accelerated tax depreciation
Total
At 1 January 2015 135,168,090 135,168,090
Charged to income statement 73,629,143 73,629,143
At 31 December 2015 208,797,233 208,797,233
Charged to income statement 70,969,507 70,969,507
At 31 December 2016 279,766,740 279,766,740
Deferred tax assets Defined benefit
obligations
Total
At 1 January 2015 (33,572,456) (33,572,456)
Credited to income statement (2,885,120) (2,885,120)
Charged to other comprehensive income (Note 10) 1,301,558 1,301,558
At 31 December 2015 (35,156,018) (35,156,018)
Credited to income statement (3,434,249) (3,434,249)
Charged to other comprehensive income (Note 10) 5,127,132 5,127,132
At 31 December 2016 (33,463,135) (33,463,135)
17 Inventories
2016 2015
Raw materials and consumables 1,401,710,500 966,429,212
Finished goods 387,874,211 342,189,775
1,789,584,711 1,308,618,987
(a) Raw material and consumables and finished goods include goods in transit amounting to LKR 534,721,086 (2015 - LKR 19,392,276).
(b) The cost of inventories consumed and included in cost of sales amounted to LKR 6,335,573,369 (2015 - LKR 6,123,127,311).
18 Cash and cash equivalents
2016 2015
Cash at bank and in hand 399,466,703 374,248,578
Short term deposits 1,510,800,000 1,964,800,000
1,910,266,703 2,339,048,578
Short term deposits mainly consist of repos, treasury bills and time deposits with a tenure of 1 to 3 months. The weighted average effective interest rate on short term deposits was 7.37% (2015 - 5.89%). The cash and cash equivalents are denominated in following currencies:

76
Chevron Lubricants Lanka PLC
2016 2015
US Dollars 265,373,680 82,903,024
Sri Lankan Rupees 1,644,893,023 2,256,145,554
1,910,266,703 2,339,048,578
19 Stated capital
Ordinary shares Number of
shares Value of
shares
At 31 December 2015 120,000,000 600,000,000
At 31 December 2016 240,000,000 600,000,000
All issued shares are fully paid and do not have a par value.
The Company effected a sub-division of its issued ordinary shares. The share sub-division increased the number of shares by two-fold.
20 Retirement benefit obligations
2016 2015
Statement of financial position obligations for:Gratuity benefits 119,511,188 125,557,205
Income statement charge:Gratuity benefits (Note 7) 20,223,972 18,532,540
Other comprehensive income:Remeasurement gain (18,311,187) (4,648,423)
The movement in the defined benefit obligation over the year is as follows:
2016 2015
At 1 January 125,557,205 119,901,629
Current service cost 7,216,245 8,041,148
Interest cost 13,007,727 10,491,392
Remeasurement gain (18,311,187) (4,648,423)
Benefits paid (7,958,802) (8,228,541)
At 31 December 119,511,188 125,557,205
The amounts recognised in the statement of comprehensive income are as follows:
Notes to the Financial Statements(All amounts in notes are shown in Sri Lanka Rupees unless otherwise stated)

77
Annual Report 2016
2016 2015
Current service cost 7,216,245 8,041,148
Interest cost 13,007,727 10,491,392
Total included in the employee benefit costs (Note 7) 20,223,972 18,532,540
The provision is not externally funded, but actuarially valued and the valuation was carried out by Actuarial & Management Consultants (Private) Limited, an independent actuary, on 31 December 2016 using the Projected Unit Credit Method. The principal actuarial assumptions used were as follows:
2016 2015
Discount rate 12.59% 10.36%
compounded compounded
annually annually
Estimated salary increment rate 5% per year 5% per year
Withdrawal rate 8% per annumup to
8% per annumup to
age 55 and 0% age 55 and 0%
thereafter thereafter
Assumptions regarding future mortality experience are set in accordance with A 67/70 Mortality Table.
The sensitivity of the defined benefit obligation to changes in the weighted principal assumptions is:
Change inassumption
Increase inassumption
Decrease inassumption
Discount rate 1.00% Decrease by 4.13% Increase by 4.48%
Future salary growth rate 1.00% Increase by 4.96% Decrease by 4.63%
The above sensitivity analysis is based on a change in an assumption while holding all other assumptions constant. In practice, this is unlikely to occur, and changes in some of the assumptions may be correlated. When calculating the sensitivity of the defined benefit obligation to significant actuarial assumptions the same method (present value of the defined benefit obligation calculated with the projected unit credit method at the end of the reporting period) has been applied as when calculating the pension liability recognised within the statement of financial position.
The methods and types of assumptions used in preparing the sensitivity analysis did not change compared to the previous period.

78
Chevron Lubricants Lanka PLC
Maturity profile of the defined benefit obligations
The weighted average duration of the defined benefit obligation is 4.79 years. The distribution of the timing of benefit payments is as follow.
2016 2015
Less than 1 year 16,003,078 16,907,223
Between 1 – 2 years 14,665,251 16,294,890
Between 2 – 5 years 64,974,423 65,765,235
Between 5 - 10 years 83,116,528 77,689,927
178,759,280 176,657,275
21 Trade and other payables
2016 2015
Trade payables 251,237,267 186,968,258
Accrued expenses [see note (a) below] 265,042,670 199,558,022
Other payables [see note (b) below] 551,911,087 424,033,985
1,068,191,024 810,560,265
Payable to related companies - Trade [Note 25 (d)(ii)] 685,343,319 206,138,303
- Dividend [Note 25 (d)(iii)] 385,560,000 330,480,000
1,070,903,319 536,618,303
2,139,094,343 1,347,178,568
(a) Accrued expenses include import fees payable of LKR 151,679,146 (2015 - LKR 5,148,455), promotional incentives of LKR 21,561,840 (2015 - LKR 87,457,046), advertising and sales promotion expenses of LKR 22,626,926 (2015 - LKR 23,879,963), CSR project expenses of LKR 3,483,897 (2015 - LKR 3,355,821) and employee related payables amounting to LKR 23,729,950 (2015 - LKR 25,459,719).
(b) Other payables mainly consists of liabilities to non trade vendors pertaining to capital expenditure of LKR Nil (2015 - LKR 11,035,109), interim dividend payable to shareholders other than parent company of LKR 395,121,521 (2015 - LKR 317,708,134) and WHT payable in relation to dividend of LKR 82,790,082 (2015 - LKR 71,811,866).
(c) The carrying amounts of trade and other payables are denominated in following currencies:
2016 2015
US Dollars 760,686,719 259,116,282
Sri Lankan Rupees 1,378,407,624 1,088,062,286
2,139,094,343 1,347,178,568
Notes to the Financial Statements(All amounts in notes are shown in Sri Lanka Rupees unless otherwise stated)

79
Annual Report 2016
22 Contingent liabilities There were no material contingent liabilities existing at the date of the statement of financial position.
23 Commitments Capital commitments There were no capital commitments at the date of the statement of financial position (as at 31 December 2015 - LKR Nil).
Financial commitments The Company has entered into Service Level Agreements (SLA) with Chevron USA Inc., Chevron International Pte Ltd and
Chevron Holdings Inc. which governs the services offered by the Group companies and reimbursement cost incurred by the Group.
Operating lease commitments - where the Company is the lessee(a) Cancellable Details of cancellable operating leases are as follows:
Description Lessor Term
Lease of land on which bending plant and warehouse facility is located at Sapugaskanda Lanka IndustrialEstates Limited
30 Years
Lease of Tank Yard at Mutwal Sri Lanka PortsAuthority
30 Years
The undiscounted future minimum lease payments under cancellable operating leases are as follows:
2016 2015
Not later than one year 25,451,829 24,414,643
Later than one year and not later than five years 108,046,254 103,600,417
Later than five years 614,742,666 632,368,965
748,240,749 760,384,025
(b) Non-cancellable Details of cancellable operating leases are as follows:
Description Lessor Term
Lease of building at which the Company’s registered office is located in Colombo 03
Oceanica Group Private Limited
5 Years
The undiscounted future minimum lease payments under non-cancellable lease is as follows:
Non-cancellable 2016 2015
Not later than one year 13,536,000 13,536,000
Later than one year and not later than five years 16,920,000 30,456,000
30,456,000 43,992,000

80
Chevron Lubricants Lanka PLC
24 Cash generated from operations Reconciliation of profit before tax to cash generated from operations:
2016 2015
Profit before tax 4,702,670,918 4,318,543,854
Adjustments for:
Depreciation (Note 13) 150,965,946 143,068,133
Property, plant and equipment written off (Note 6) 3,229,982 167,168
Amortisation of marketing support fee paid (Note 6) 22,159,697 23,514,007
Profit on disposal of property, plant and equipment (Note 8) (109,029) (258,148)
Interest income (Note 9) (145,130,045) (160,109,142)
Interest expense (Note 9) 38,161 38,355
Reversal of provision for impairment of trade receivables [Note 14(i)] (769,167) (5,378,977)
Defined benefit obligations (Note 20) 20,223,972 18,532,540
Changes in working capital
- trade and other receivables (38,215,655) (17,692,142)
- inventories (480,965,724) 437,621,909
- payables 671,915,775 (25,782,975)
Cash generated from operations 4,906,014,831 4,732,264,582
25 directors’ interest in contracts and related party transactions with the Company None of the directors of the Company had any direct or indirect interests in any contracts with the Company other than those
stated below:
Mr Anura Perera, Mr Kishu Gomes and Mr Farrukh Saeed, directors of the Company, are also directors of Chevron Ceylon Limited, which is the immediate holding company.
The following transactions were carried out with the related parties.
(i) Reimbursable expenses incurred by Chevron Lubricants Lanka PLC
2016 2015
Chevron Ceylon Limited nil 92,612
Chevron International Pte Limited 1,987,080 Nil
1,987,080 92,612
(ii) Other related party transactions
The Company is controlled by Chevron Ceylon Limited which owns 51% of the Company’s shares. The remaining 49% of the shares are widely held. The ultimate parent of the Company is Chevron Corporation Inc, incorporated in San Ramon - USA. All the related entities disclosed below with which the Company had transactions during the year are related through the ultimate parent company.
Notes to the Financial Statements(All amounts in notes are shown in Sri Lanka Rupees unless otherwise stated)

81
Annual Report 2016
(a) Sales of goods and services
2016 2015
Sales of goods:
Chevron (Tianjin) Lubricants Company Limited nil 3,046,125
Chevron Thailand Limited 3,826,714 2,402,662
Chevron Marine Products LLC 98,942,124 71,348,697
102,768,838 76,797,484
Goods are sold based on the price list in force and terms that would be available to third parties.
(b) Purchases of goods and services
2016 2015
Purchase of goods:
Chevron Singapore (Private) Limited 2,974,218,426 2,414,632,167
Chevron Asia Pacific Holdings Ltd (Chevron Alkhalij) 28,509,725 27,550,792
Chevron Thailand Limited 66,436,003 122,469,456
Chevron Oronite (Private) Limited 450,244,510 408,009,507
Chevron (Tianjin) Lubricants Company Limited 30,357 2,947,794
Chevron Products Company 7,501,971 1,592,837
Chevron Brazil Lubricants Limited 4,387,200 4,793,475
Chevron Belgium N.V 4,201,785 1,433,485
Chevron Lubricants Vietnam Ltd 5,022,414 6,796,773
3,540,552,391 2,990,226,286
2016 2015
Purchases of services:
Chevron International Pte Limited 411,348,651 366,489,426
Chevron Holdings Inc. (Philippines) 4,540,234 2,555,290
Chevron USA Inc. (Chevron Information Technology Company) 61,322,107 53,456,610
Chevron USA Inc. (Chevron Products Company) 51,185,313 49,473,300
Chevron Belgium N.V 156,531 253,465
Chevron Service Company nil 275,900
Chevron Corporation 249,298 Nil
Chevron Energy Technology Company nil 1,066,398
528,802,134 473,570,389

82
Chevron Lubricants Lanka PLC
The Company procures most of its raw materials (base oils and additives) from related parties on commercial terms and conditions.
The Company receives services from Chevron Group Companies (CGCs) for which payments are made by the Company. These services include Original Equipment Manufacturers (OEM) endorsement and identification and acquisition, product life cycle management, regional marketing, global supply chain planning and operations, operational excellence and enterprise resources planning, human resources management services, legal services, IT services and finance. The Company has entered into service level agreements with relevant Chevron affiliates, setting out the methodology, terms and conditions for the service charges among Group Companies.
Purchases of goods and services during the year from related parties amounts to 105% (2015 - 74%) of net assets and 58% (2015 - 49%) of total assets at the end of the financial year.
(c) Key management compensation Key management consists the members of the Board. The compensation paid or payable to key management personnel is
shown below:
2016 2015
Salaries and other short-term employee benefits 49,420,480 49,194,660
49,420,480 49,194,660
(d) Outstanding balances arising from sale / purchase of goods / services (i) Receivable from related parties:
2016 2015
Chevron Products Company 420,445 550,669
Chevron Marine Products LLC 21,159,678 11,533,961
21,580,123 12,084,630
Notes to the Financial Statements(All amounts in notes are shown in Sri Lanka Rupees unless otherwise stated)

83
Annual Report 2016
(ii) Payable to related parties:
2016 2015
Chevron Brasil Lubricantes LTD 8,007 Nil
Chevron International Pte Limited 113,921,544 90,117,833
Chevron Holdings Inc. (Philippines) 518,202 132,508
Chevron Singapore (Private) Limited 537,017,898 17,141,857
Chevron Oronite (Private) Limited 11,151,754 25,976,754
Chevron USA Inc. (Chevron Information Technology Company) 15,633,605 21,285,324
Chevron Thailand Limited 2,157,211 7,079,396
Chevron USA Inc. (Chevron Products Company) 4,873,748 26,268,063
Chevron Belgium N.V 61,350 Nil
Chevron Lubricants Vietnam Limited nil 973,296
Chevron Asia Pacific Holdings Ltd (Chevron Alkhalij) nil 15,904,620
Chevron (Tianjin) Lubricants Company Limited nil 1,207,891
Chevron Energy Technology Company nil 50,761
685,343,319 206,138,303
(iii) Dividend payable to related party:
2016 2015
Chevron Ceylon Limited 385,560,000 330,480,000
26 events after the end of reporting period No events have occurred since the statement of financial position date which would require adjustments to, or disclosure in,
the financial statements.

84
Chevron Lubricants Lanka PLC20
1620
1520
1420
1320
1220
1120
1020
0920
0820
07
Trad
ing
Resu
ltsTu
rnov
er 12
,089
,111
11,56
3,854
11
,519,8
91
11,19
7,152
11
,754,0
46
11,0
39,94
5 9,
471,2
56
8,69
0,55
4 8,
900,
298
8,65
4,342
Profi
t Bef
ore
Tax
& O
CI
4,70
2,671
4
,318,5
44
3,69
9,633
3,
453,5
98
3,111
,457
2,76
7,780
2,
333,9
50
2,34
4,370
1,4
82,96
2 1,6
58,25
2
Taxa
tion
1,222
,261
1,226
,709
952,8
00
921,6
97
845,6
30
767,1
64
832,6
76
849,4
65
535,2
40
579,8
93
Profi
t Aft
er Ta
x 3,
480,
410
3,09
1,835
2,
746,8
33
2,53
1,900
2,
265,8
27
2,00
0,61
6 1,5
01,27
4 1,4
94,90
5 94
7,722
1,0
78,35
9
Bala
nce
Shee
tSh
are
Cap
ital
600,
000
600,
000
600,
000
600,
000
600,
000
600,
000
600,
000
600,
000
600,
000
600,
000
Rese
rves
3,26
0,62
3 4
,087
,029
4
,599,2
10
4,24
0,02
1 3,
525,8
18
2,55
8,145
1,6
37,52
9 1,6
06,25
5 1,5
51,35
0 1,2
33,62
7
Shar
ehol
ders
fund
s 3,
860,
623
4,68
7,029
5,
199,2
10
4,84
0,02
1 4
,125,8
18
3,15
8,145
2,
237,5
29
2,20
6,255
2,
151,3
50
1,833
,627
Prop
erty
, Pla
nt &
Equ
ipm
ent
2,13
2,858
2,
195,8
26
2,24
3,616
1,2
96,65
1 21
5,813
19
3,113
22
0,33
8 26
0,08
0 32
5,608
38
7,869
Cur
rent
& N
on C
urre
nt
Ass
ets
excl
udin
g PP
E 4,
913,6
48
4,84
9,178
4
,233,1
83
5,75
5,821
5,
731,6
94
4,16
0,80
6 3,
154,7
27
3,77
1,466
2,
846,2
58
2,48
3,180
Cur
rent
Lia
bilit
ies
2,82
0,06
9 2,
058,7
77
1,056
,091
2,
090,
392
1,734
,361
1,094
,004
1,0
28,59
1 1,7
06,31
3 92
7,828
93
8,389
Non
Cur
rent
Lia
bilit
ies
365,8
14
299,1
98
221,4
97
122,0
60
87,32
8 10
1,769
10
8,945
11
8,978
92
,688
99,0
32
Net
Ass
ets
3,86
0,62
3 4
,687,0
29
5,19
9,211
4,84
0,02
1 4
,125,8
18
3,15
8,145
2,
237,5
29
2,20
6,255
2,
151,3
50
1,833
,627
Key
Indi
cato
rsG
ross
Div
iden
ds R
s. 00
0' 4,
320,
000
2,76
0,00
0 2,
400,
000
1,800
,000
1,3
20,0
00
1,080
,000
1,4
70,0
00
1,440
,000
63
0,00
0 75
0,00
0
Div
iden
d pe
r Sha
re
Rup
ees
18.0
0 11
.50
10.0
0 7.
50
5.50
4
.50
6.13
6.
00
2.63
3.
13
Pric
e Ea
rnin
gs R
atio
Tim
es
10.83
13
.35
17.46
12
.69
10.70
10
.20
12.75
11
.38
11.65
9.
49
Mar
ket v
alue
per
sha
re a
s at
31
st D
ecem
ber
Rup
ees
157.1
0 34
4.00
399.6
0 26
7.80
202.0
0 17
0.00
159.5
0 14
1.75
92.0
0 85
.25
Retu
rn o
n Eq
uity
%
81
63
55
56
62
74
68
69
48
65
Net
Ass
ets
per s
hare
Rup
ees
16.0
9 19
.53
21.66
20
.17
17.19
13
.16
9.32
9.
19
8.96
7.
64
Net
Inco
me
to Tu
rnov
er
%
29
27
24
23
19
18
16
17
11
12
Ear
ning
s per
Sha
re
Rup
ees
14.50
12
.88
11.45
10
.55
9.44
8.
34
6.26
6.
23
3.95
4
.49
Not
e : T
he C
ompa
ny e
ffec
ted
an in
crea
se o
f the
Com
pany
’s sh
ares
by
way
of a
sub
divi
sion
of e
ach
ordi
nary
sha
re in
to tw
o or
dina
ry s
hare
s th
us in
crea
sing
the
num
ber o
f sha
res f
rom
120,
00
0,0
00
ord
inar
y sh
ares
to 2
40,0
00,
00
0 e
ffec
tive
7th
June
20
16. T
here
fore
Bas
ic E
PS /
DPS
/ N
et A
sset
per
sha
re fo
r prio
r ye
ars
have
bee
n re
stat
ed fo
r com
para
tive
purp
ose.
How
ever
PE
Ratio
has
bee
n re
tain
ed u
nadj
uste
d to
refle
ct h
istor
ical
reco
rds.
Ten Year Financial Summary

85
Annual Report 2016
Statement of Value Added (in Rupees millions)
(in Rupees millions)
2016 2015
Value additionTurn Over 12,089 11,564Finance Income 187 175Less: Materials and services purchased 7,128 7,008value created 5,148 4,731
Distribution of Value additionTo employees as salaries 276 265To state by way of taxes 1,227 1,228To share holders as dividends 3,354 2,760Retained in the business - Depreciation 151 143 - Earnings 140 335
5,148 4,731
Statement of Value added -2015
To employees as salaries
58%
3%7% 6%
26%
To state by way of taxesTo share holders as dividendsRetained in the business - DepreciationEarnings
Statement of Value added -2016
To employees as salaries
65%
3% 3% 5%
24%
To state by way of taxesTo share holders as dividendsRetained in the business - DepreciationEarnings

86
Chevron Lubricants Lanka PLC
Shareholder Information
No of shares held No ofshareholders
No ofshareholders %
Total Holdings
Total Holdings %
1 - 1000 2,427 54.23 795,150 0.33 1001 - 10,000 1,441 32.20 5,580,381 2.33 10,001 - 100,000 493 11.02 15,044,368 6.27 100,001 - 1,000,000 84 1.88 30,832,361 12.85 1,000,001 & over 30 0.67 187,747,740 78.23 Total 4,475 100.00 240,000,000 100.00
Analysis report of shareholders as at 31st December 2016
No of shares held No ofshareholders
No ofshareholders %
Total Holdings
Total Holdings %
Individual 4,179 93.39 31,812,820 13.26 Institutional 296 6.61 208,187,180 86.74 Total 4,475 100.00 240,000,000 100.00
Resident 4,319 96.51 176,654,192 73.60 Non- Resident 156 3.49 63,345,808 26.40 Total 4,475 100.00 240,000,000 100.00
Public Holding 117,599,600 49.00%
Share price movements Closing Highest Lowest
Market value of share in 1996 50.00 50.00 40.00 Market value of share in 1997 46.00 64.50 35.00 Market value of share in 1998 62.75 70.00 57.00 Market value of share in 1999 75.00 75.00 55.25 Market value of share in 2000 50.00 68.00 45.00 Market value of share in 2001 75.00 88.00 54.50 Market value of share in 2002 120.50 124.00 72.00 Market value of share in 2003 71.50 227.00 69.00 Market value of share in 2004 63.75 110.00 54.50 Market value of share in 2005 58.00 74.00 52.25 Market value of share in 2006 85.00 90.50 56.00 Market value of share in 2007 85.25 97.50 76.00 Market value of share in 2008 92.00 118.25 81.75 Market value of share in 2009 141.75 233.00 93.00 Market value of share in 2010 159.50 193.75 141.00 Market value of share in 2011 170.00 183.50 152.00 Market value of share in 2012 202.00 205.20 160.00 Market value of share in 2013 267.80 375.00 202.00 Market value of share in 2014 399.60 400.00 263.00Market value of share in 2015 344.00 460.00 342.10 Market value of share in 2016 157.10 350.00 149.00

87
Annual Report 2016
20 Largest Shareholdersas at 31st December 2016
Name of Shareholders Number of Shares %
Chevron Ceylon Limited 122,400,000 51.00
Citigroup Global Markets Limited Agency Trading Prop Securities A/C 4,653,040 1.94
BNYM SA/NV- Blackrock Frontiers Investment Trust PLC 4,443,434 1.85
BNYM SA/NV-NEON LIBERTY EMERGING MARKETS FUND LP 4,177,352 1.74
RBC Investor Services Bank- COELI SICAV I- FRONTIER MARKETS FUND 3,759,702 1.57
Nothern Trust Global Services London S/A VERDIPAPIRONDET ODIN EMERGING MARKETS 3,144,194 1.31
HSBC International Nominees Ltd-SSBT-Aberdeen Institutional Commingled Funds, LLC 2,986,444 1.24
Renuka Hotels Limited 2,800,000 1.17
Cargo Boat Development Company Limited 2,800,000 1.17
BNYM SA/NV- FRONTAURA GLOBAL FRONTIER FUND LLC 2,769,163 1.15
HSBC INTL NOM LTD-BP2S LUXEMBOURG-ABERDEEN GLOBAL FRONTIER MARKETS EQUITY FUND 2,652,390 1.11
HSBC INTL NOM LTD -BBH-FIDELITY FUNDS 2,195,083 0.91
HSBC INTL NOM LTD-SSBT PARAMETRIC EMERGING MARKETS FUND 2,003,628 0.83
Sri Lanka Insurance Corporation Ltd - Life Fund 2,000,000 0.83
HSBC International Nominees Ltd-Morgan Stanley & Co INTL PLC-OWN A/C 2,000,000 0.83
Crescent Launderers & Dry Cleaners (Pvt) Ltd 2,000,000 0.83
BNYM SA/NV- Frontier Market Opportunities Master FD, L.P 1,876,963 0.78
HSBC INTL NOM LTD-SSBT WASATCH FRONTIER EMERGING SMALL COUNTRIES FUND 1,831,578 0.76
HSBC INTL NOMINEES LTD-SSBT-FRANK RUSSEL TRUST COMPANY COMINGLED BENEFIT FUNDS TRUST GNA-6QH3 1,809,078 0.75
HSBC INTL NOM LTD- JPMCB INVESTERINGSFORENINGEN BANKINVEST, NEW EMERGING MARKETS AKTIER KL 1,703,354 0.71
Total 174,005,403 72.50

88
Chevron Lubricants Lanka PLC
Shareholder Information
as at 31st December 2015
Name of Shareholders Number of Shares %
Chevron Ceylon Limited 61,200,000 51.00
HSBC INTL NOM LTD-SSBT WASATCH FRONTIER EMERGING SMALL COUNTRIES FUND 6,224,848 5.19
Citigroup Global Markets Limited Agency Trading Prop Securities A/C 2,954,168 2.46
BNYM SA/NV- Blackrock Frontiers Investment Trust PLC 2,238,940 1.87
HSBC International Nominees Ltd-SSBT-Aberdeen Institutional Commingled Funds, LLC 1,880,000 1.57
HSBC INTL NOM LTD-BP2S LUXEMBOURG-ABERDEEN GLOBAL FRONTIER MARKETS EQUITY FUND 1,830,800 1.53
RBC Investor Services Bank- COELI SICAV I- FRONTIER MARKETS FUND 1,829,851 1.52
HSBC International Nominees Ltd-BPSS Lux Aberdeen Global Asian Small companies fund 1,675,287 1.40
Caceis Bank Luxembourg S/A BARCA GLOBAL MASTER FUND LPOGIER 1,592,496 1.33
Renuka Hotels Limited 1,400,000 1.17
Cargo Boat Development Company Limited 1,400,000 1.17
HSBC INTL NOMINEES LTD-BP2S LONDON- ABERDEEN ASIA SMALLER COMPANIES INVESTMENT TRUST 1,384,697 1.15
Nothern Trust Global Services London S/A VERDIPAPIRONDET ODIN EMERGING MARKETS 1,256,947 1.05
Nothern Trust CO S/A- Nothern Trust Fiduciary Services (Ireland) Ltd AS TRUSTEE TO BARING ASEAN FRO 1,224,739 1.02
BNYM SA/NV-NEON LIBERTY EMERGING MARKETS FUND LP 1,109,098 0.92
Mellon Bank N.A.- Florida Retirement System 1,095,406 0.91
Employees Provident Fund 1,007,958 0.84
HSBC INTL NOM LTD-SSBT PARAMETRIC EMERGING MARKETS FUND 1,001,814 0.83
Crescent Launderers & Dry Cleaners (Pvt) Ltd 1,000,000 0.83
CB NY S/A WASATCH FRONTIER EMERGING SMALL COUNTRIES CIT FUND 950,060 0.79
Total 94,257,109 78.55

89
Annual Report 2016
Notice of Annual General Meeting
NOTICE IS HEREBY GIVEN that the Twenty Fourth Annual General Meeting of Chevron Lubricants Lanka PLC will be held on Thursday, 20th April 2017 at 3.30p.m. at Level 6 Public Forum, The Institute of Chartered Accountants of Sri Lanka, 30A, Malalasekera Mawatha, Colombo 07 for the following purposes.
• ToreceiveandconsidertheReportoftheDirectorswiththestatement of accounts for the year ended 31.12.2016 and the Report of the Auditors thereon.
• Tore-electMr.RichardBrown,whoretiresbyrotationin terms of Clause 84 of the Articles of the Company, a Director.
• Tore-electasDirector,Mr.DevaRodrigowhohasattainedthe age of 70 years and retires in terms of Article 83(viii) of the Articles of Association of the Company, for which the following notice has been given by a member:
“That the age limit stipulated in Section 210 of the Companies Act No.7 of 2007 shall not apply to Mr. Deva Rodrigo who has attained the age of 70 years and that he be re-elected a Director of the Company”.
• ToreappointMessrs.PricewaterhouseCoopersasAuditors and to authorise the Directors to determine their remuneration.
• ToauthorizetheDirectorstodetermine&makedonations.
• Toconsideranyotherbusinessofwhichduenoticehasbeengiven.
By Order of the Board
a.m. anura PereraSecretaryColombo
23 March 2017
Note:
1. A member entitled to attend and vote at the meeting is entitled to appoint a proxy to attend and vote instead of him.
2. A proxy need not be a member of the Company. The form of proxy is attached herewith.
3. The Completed form of proxy should be deposited at the Registered Office of the Company at Chevron House 490, Galle Road, Colombo 3 not less than 48 hours before the time appointed for the holding of the meeting.

90
Chevron Lubricants Lanka PLC
Corporate Information
Legal Form : A Public Limited Liability Company (Incorporated in 1992 and listed on the Colombo Stock Exchange)
directors : Farrukh Saeed - Chairman Kishu Gomes - Managing Director & CEO Richard Brown Harsha Amarasekara Deva Rodrigo Anura Perera
Secretary : Anura Perera Chevron House, 490, Galle Road, Colombo 3
Registered office : Chevron House 490, Galle Road, Colombo 3 Tel: 0114 524524
Company Registration number : PQ 54
Registrars to the Company : S S P Corporate Services (Private) Limited 101, Inner Flower Road, Colombo 3
auditors : PricewaterhouseCoopers Chartered Accountants P.O. Box 918 100, Braybrooke Place, Colombo 2
Lawyers to the Company : Julius & Creasy Attorneys-at-Law and Notaries Public No 41, Janadhipathi Mawatha, Colombo 1
Bankers : Citibank NA Deutsche Bank Commercial Bank of Ceylon PLC
Web address : www.chevron.lk
email : [email protected]
Telephone : 0114 524 524
Facsimile : 0114 524 566Designed & produced by
Printed by Karunaratne & Sons (Pvt) Limited

91
Annual Report 2016
Form of Proxy
CHEVRON LUBRICANTS LANKA PLCFORM OF PROXYANNUAL GENERAL MEETING
I/We the undersigned (please print) ................................................................................................................................................................................................
…...…………………………………………………………………………………........................................................................................................................................................…….…………..
of …………………………………………………………………….............…….............……………. being member/s of Chevron Lubricants Lanka PLC do hereby appoint
Farrukh Saeed whom failing
Honnantharage Kishu Pradeep Kumara Gomes whom failing
Richard Bridgmore Brown whom failing
Parakrama Deva Rodrigo whom failing
Shiran Harsha Amarasekera whom failing
Adikarige Mervin Anura Perera whom failing
as my / our proxy to represent me / us and to vote as indicated hereunder for me / us and on my / our behalf at the Twenty Fourth Annual General Meeting of Chevron Lubricants Lanka PLC to be held on Thursday, 20th April 2017 at 3.30p.m. at Level 6 Public Forum, The Institute of Chartered Accountants of Sri Lanka, 30A, Malalasekera Mawatha, Colombo 07 and at any adjournment thereof and at every poll which may be taken in consequence thereof: FOR AGAINST
1. To receive and adopt the Report of the Directors and the Statement of Accounts for the year ended 31st December 2016 with the Report of Auditors thereon.
2. To re-elect Mr. Richard Brown who retires by rotation, a Director
3. To re-elect Mr. Deva Rodrigo who is over the age of 70 years and who retires in terms of Article 83(viii) of the Articles of Association of the Company.
4. To authorize the Directors to determine & make donations.
5. To reappoint Messrs PricewaterhouseCoopers as Auditors and to authorise the Directors to determine their remuneration.
Signed this …………..day of………..2017 Signature ……………………………….
NOTES:
1. Please indicate with an “X” in the space provided how your proxy is to vote on each resolution. If there is in the view of the proxy holder doubt (by reason of the way in which the instructions in the proxy have been completed) as to the way in which the proxy holder should vote, the proxy holder will vote as he thinks fit.
2. A proxy need not be a member of the Company.
3. Instructions as to completion are noted on the reverse hereof.

Form of Proxy
INSTRUCTIONS AS TO COMPLETION
1. Please perfect the Form of Proxy overleaf, after filling in legibly your full name and address and by signing in the space provided and filling in the date of signature.
2. If the shareholder is a Company or Corporate body, the proxy should be executed under its Common Seal in accordance with its Articles of Association or Constitution.
3. If the Form of Proxy has been signed by an attorney, the relative Power of Attorney should also accompany the Form of Proxy for registration, if such Power of Attorney has not already been registered with the company.
4. The Completed Form of Proxy should be deposited at the Registered Office of the Company, located at Chevron House, 490, Galle Road, Colombo 3, 48 hours prior to the time appointed for the holding of the meeting.


www.chevron.lk
Our Family of Brands