welcome to © 2009 rational acoustics llc. all rights reserved. rational acoustics and smaart are...
TRANSCRIPT

Welcome to
© 2009 Rational Acoustics LLC. All rights reserved.Rational Acoustics and Smaart are registered trademarks of Rational Acoustics LLC.
2
An Introduction to Smaart v7
3
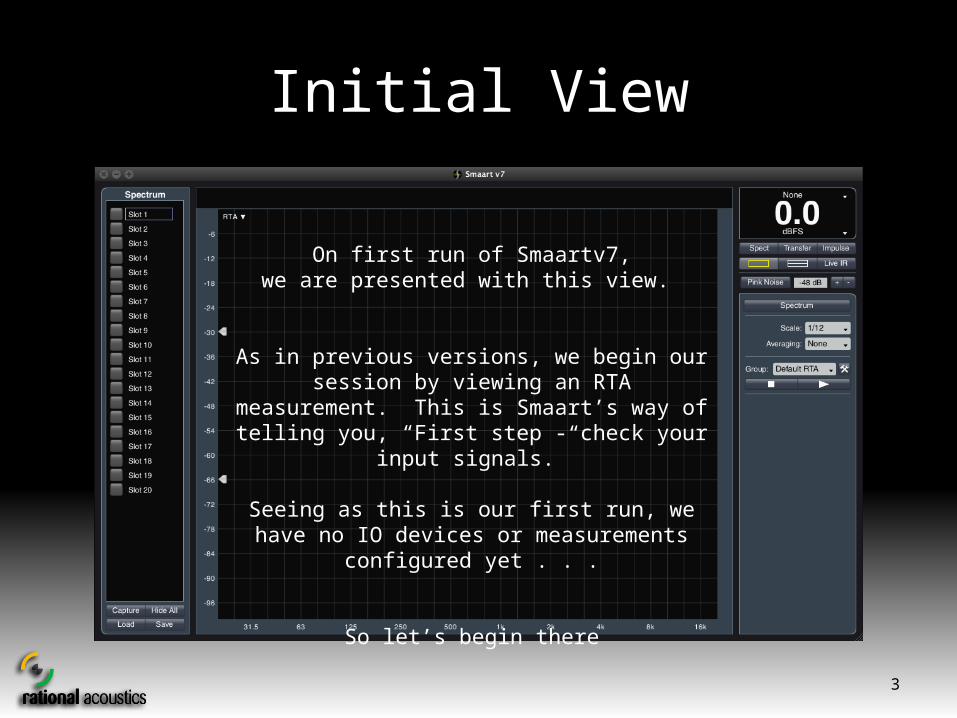
Initial View
On first run of Smaartv7,we are presented with this view.
As in previous versions, we begin our session by viewing an RTA measurement. This is Smaart’s way of
telling you, “First step - check your input signals.”
Seeing as this is our first run, we have no IO devices or measurements configured yet . . .
So let’s begin there

4
Configuring Smaart v7

5
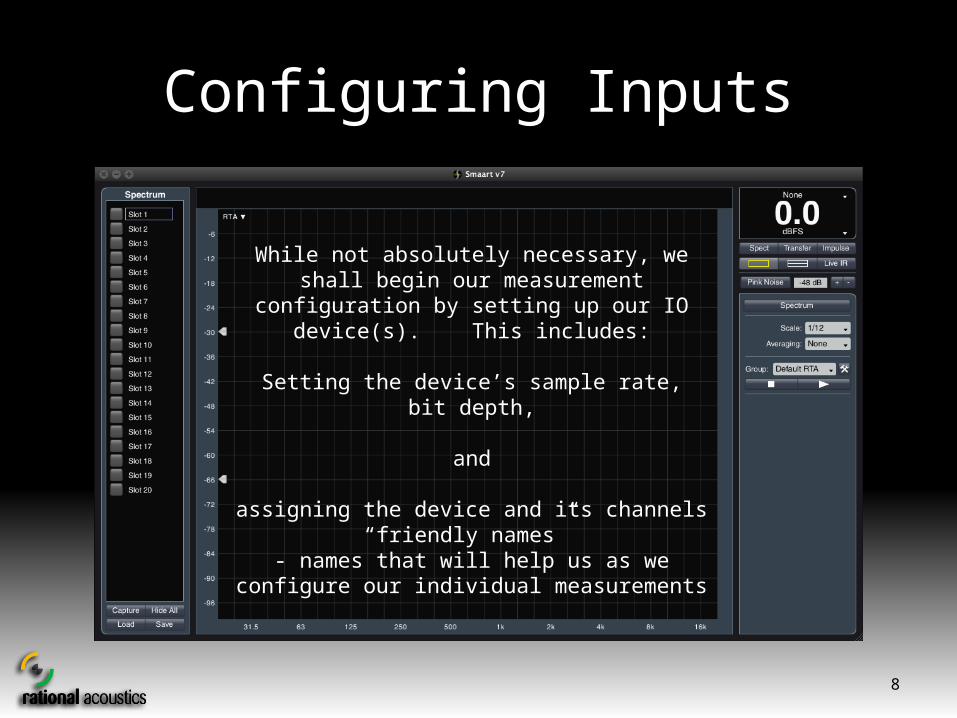
Configuring Inputs
Smaart v7 is able to acquire input signals from any devices that have .wav, CoreAudio, or ASIO drivers recognizable by our computer’s Operating System.
in fact
we can grab multiple signals from multiple sourcessimultaneously
(Note: only one ASIO source can be accessed at a time)

6
Configuring Inputs
When Smaart v7 starts,you are presented with this splash screen

7
Configuring Inputs
While you are being entertained with this lovely art, Smaart is busy checking to see what Input devices are
available to your OS.
It is here that Smaart builds its list of input devices, and once a device has been discovered, it will continue to show up for configuration in
subsequent runs – even if it is not connected at start up.
8
Configuring Inputs
While not absolutely necessary, we shall begin our measurement configuration by setting up our IO
device(s). This includes:
Setting the device’s sample rate,bit depth,
and
assigning the device and its channels “friendly names” - names that will help us as we configure our individual
measurements

9
Configuring Inputs
We configure our input device(s) from the “Audio IO” Options Dialogue
We access this via the “Options Menu” or by using the *hot key command [Opt + A]
* “Hot Keys” are Smaart’s built-in, keyboard-based commands
Smaart Menu Bar
10
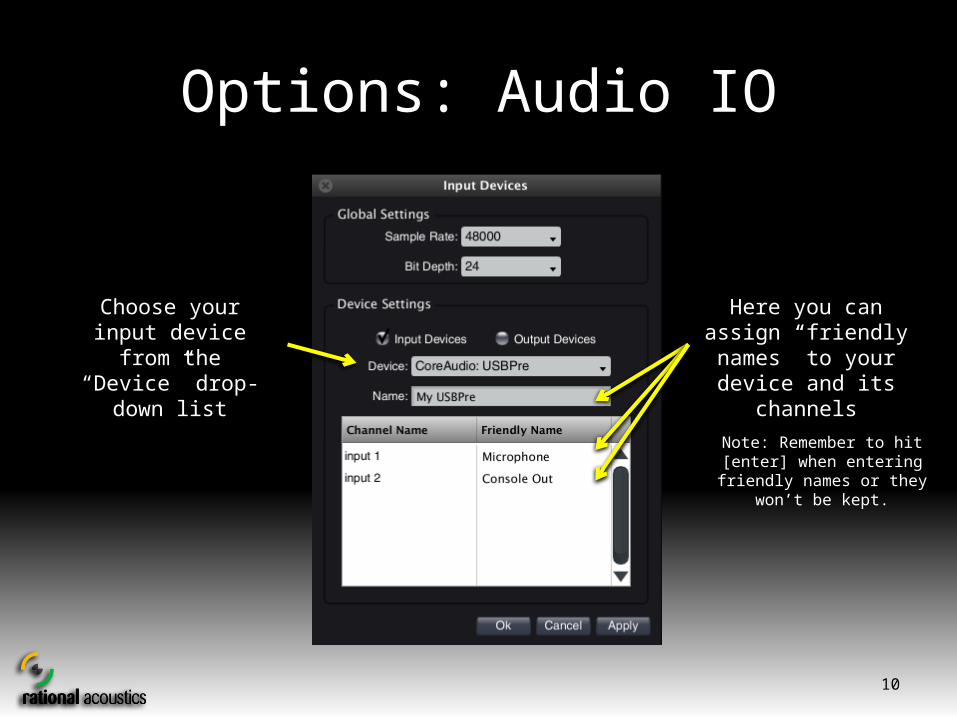
Options: Audio IO
Choose your input device from the “Device”
drop-down list
Here you can assign “friendly names” to your device and its channels
Note: Remember to hit [enter] when entering friendly names or
they won’t be kept.

11
Configuring Measurement Groups
Now that we have configured our Input device(s), the next step is configuring our measurements.
Instead of a fixed measurement topology, Smaart v7’s object-oriented code base allows us to configure as many single-channel (Spectrum) and dual-channel
(Response) sessions/objects as we wish.- and -
These measurements can be run either individually or simultaneously, depending upon our requirements.
In order to structure and manage our measurement configuration, we organize our measurements into
Spectrum and Response “Groups”.

12
Configuring Measurement Groups
To configure our measurements, we use the “Group Manager” Options Dialog
We access this dialog box via the “Options Menu”, via the Group Manager button
or by using the hot key command [Opt + G]
Smaart Menu Bar
or

13
Options: Group Manager
Our first view of the Group Manager dialog.– No measurements configured –

14
Options: Group ManagerConfiguring Measurement Groups
The Group “tree view” shows our complete
measurement configuration.
This menu is used to select the Group that is being configured, and to create/copy/delete
groups.

15
Choose “New Input” to create a new Spectrum
measurement in this Spectrum Group.
The Group Tab view shows the entire
selected group, with separate detail tabs for each individual engine.
(Note: No measurements have yet been configured for this group, so the group tab is
empty.)
Options: Group ManagerConfiguring Measurement Groups
16
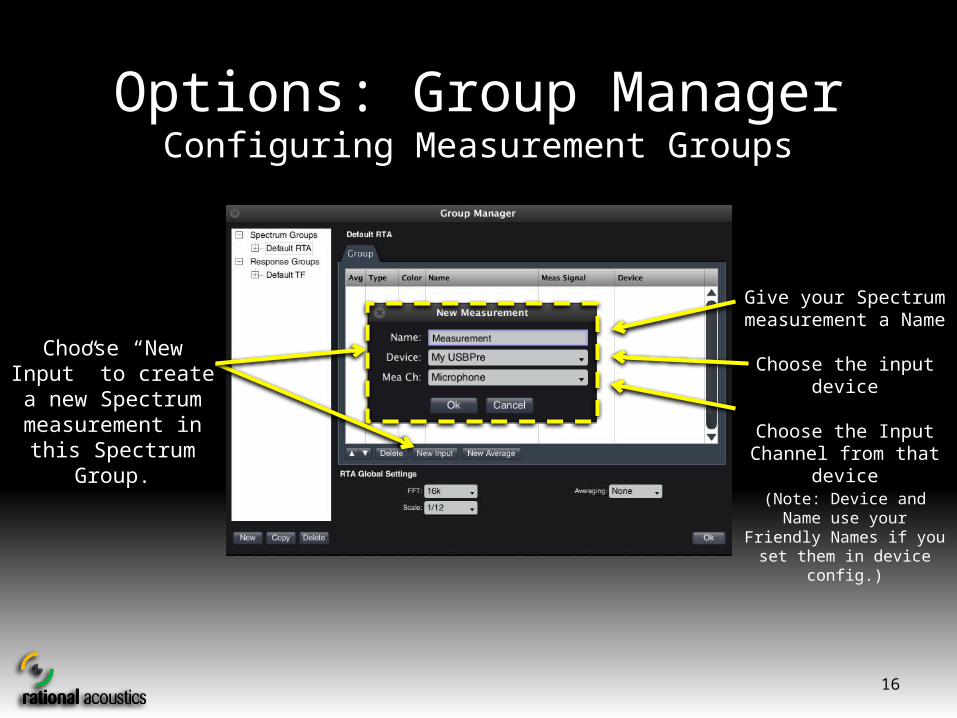
Choose “New Input” to create a new Spectrum
measurement in this Spectrum Group.
Give your Spectrum measurement a Name
Choose the input device
Choose the Input Channel from that device
(Note: Device and Name use your Friendly Names if you set
them in device config.)
Options: Group ManagerConfiguring Measurement Groups

17
The new spectrum measurement can now be found in the Group
Tree The Group Tab view now shows the new
measurement.
(Note: The measurement is assigned a color automatically. You can change this assignment by clicking on the color swatch
and selecting another.)
An individual spectrum measurement tab has
been added to the Group.
Options: Group ManagerConfiguring Measurement Groups

18
The new spectrum measurement can now be found in the Group
Tree The Group Tab view now shows the new
measurement.
(Note: The measurement is assigned a color automatically. You can change this assignment by clicking on the color swatch
and selecting another.)
An individual spectrum measurement tab has
been added to the Group.
By repeating these steps, we can create as many measurements as we need in this Group.
Options: Group ManagerConfiguring Measurement Groups
19
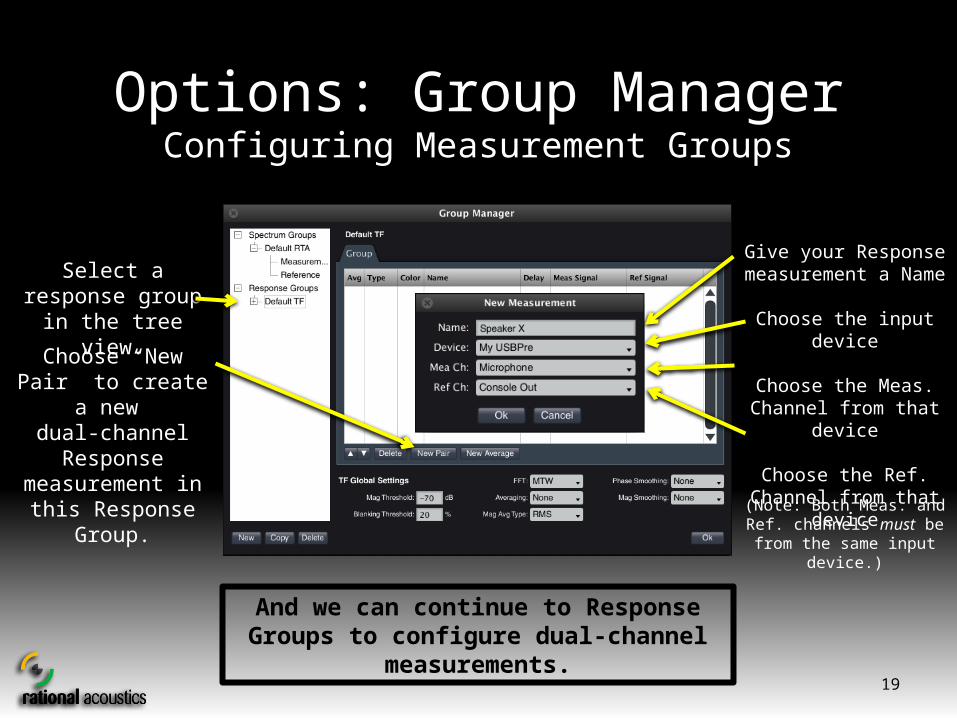
Select a response group in the tree view.
And we can continue to Response Groups to configure dual-channel measurements.
Options: Group ManagerConfiguring Measurement Groups
Choose “New Pair” to create a new
dual-channel Response measurement in this
Response Group.
Give your Response measurement a Name
Choose the input device
Choose the Meas. Channel from that device
Choose the Ref. Channel from that device
(Note: Both Meas. and Ref. channels must be from the
same input device.)

20
The new response measurement can now be found in the Group
Tree
The Group Tab view now shows the new
measurement.
(Note: The measurement is assigned a color automatically. You can change this assignment by clicking on the color swatch
and selecting another.)
An individual response measurement tab has
been added to the Group.
Options: Group ManagerConfiguring Measurement Groups

21
Initial View
Upon clicking the “OK” button . . .we are now back to our initial, starting view in
Smaart v7 – a single measurement window view of RTA
The big difference is now we have two spectrum/single-channel measurements configured!
Now with measurements configured!
22
Configuring Smaart v7
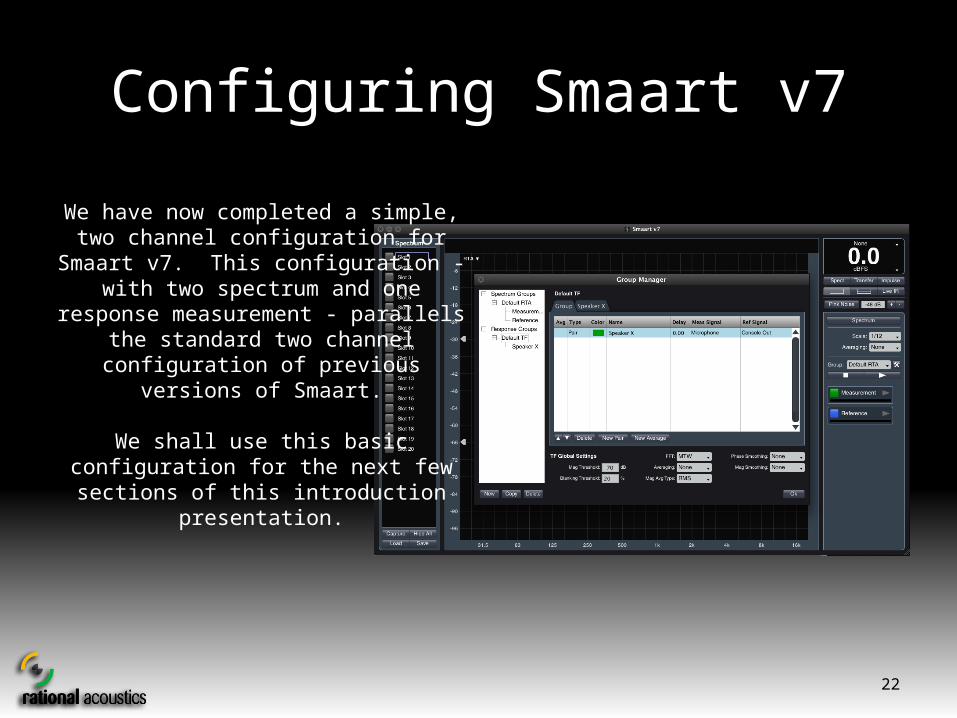
We have now completed a simple, two channel configuration for Smaart v7. This configuration
- with two spectrum and one response measurement - parallels the standard two
channel configuration of previous versions of Smaart.
We shall use this basic configuration for the next few sections of this introduction
presentation.
23
Configuring Smaart v7
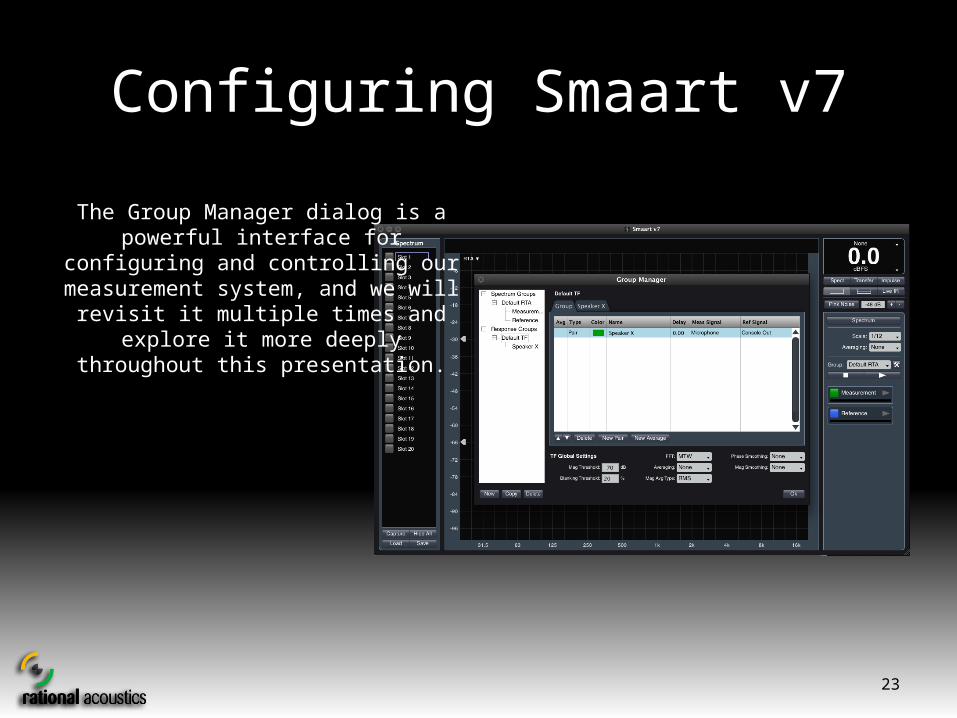
The Group Manager dialog is a powerful interface for configuring and controlling our measurement system, and we will revisit it multiple times and explore it more deeply
throughout this presentation.
24
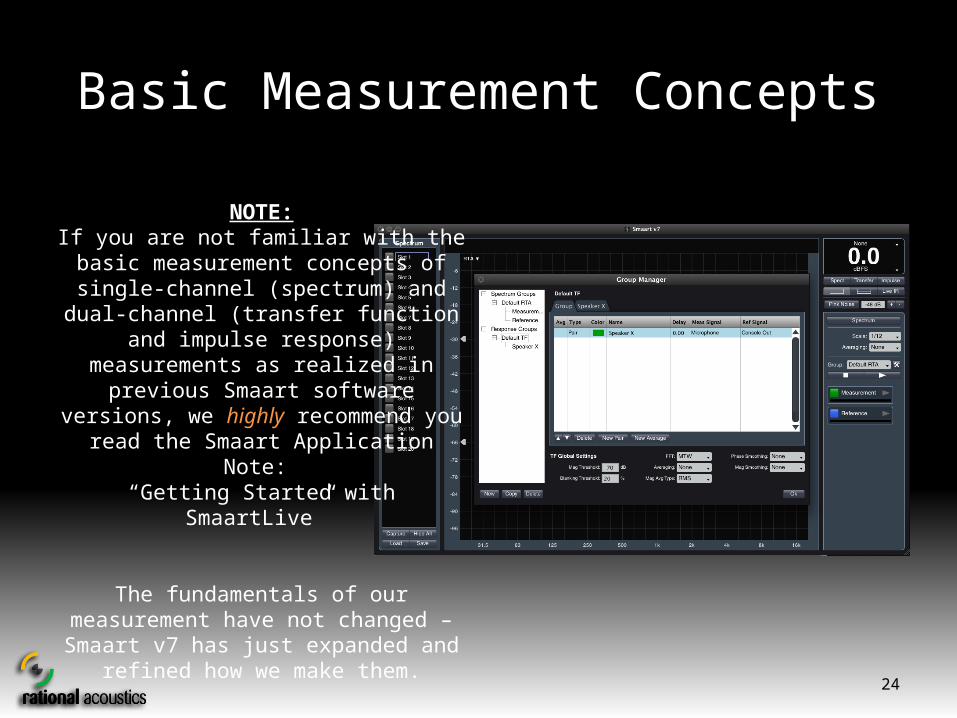
Basic Measurement Concepts
NOTE:If you are not familiar with the basic
measurement concepts of single-channel (spectrum) and dual-channel (transfer function
and impulse response) measurements as realized in previous Smaart software versions,
we highly recommend you read the Smaart Application Note:
“Getting Started with SmaartLive”
The fundamentals of our measurement have not changed – Smaart v7 has just expanded
and refined how we make them.

25
A Quick Tour of the Interface
26
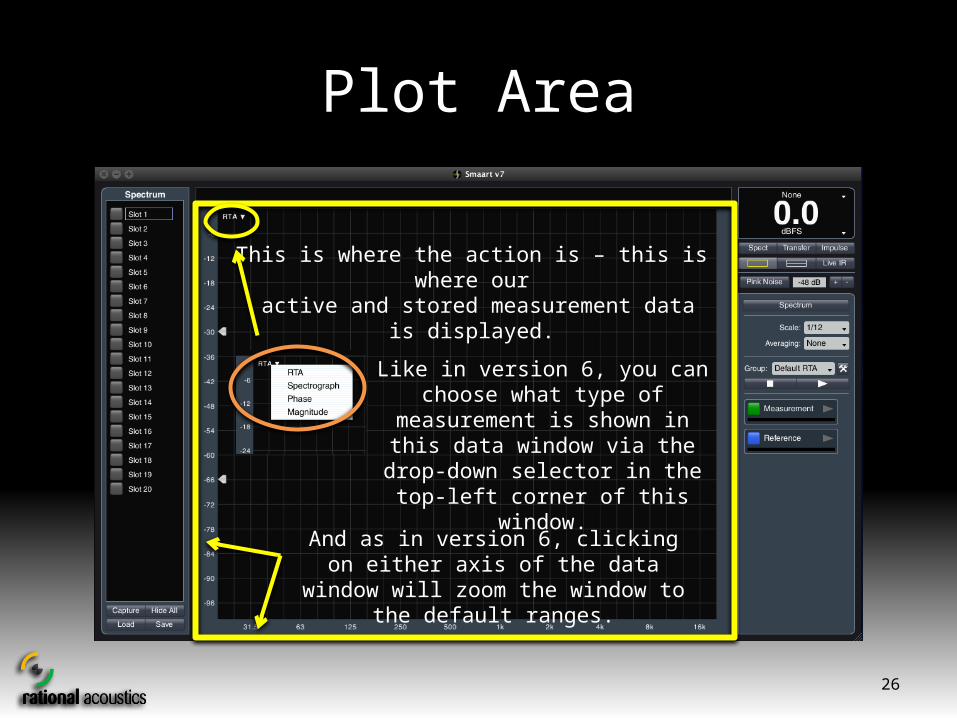
Plot Area
This is where the action is – this is where our active and stored measurement data is displayed.
Like in version 6, you can choose what type of measurement is shown in this
data window via the drop-down selector in the top-left corner of this
window.
And as in version 6, clicking on either axis of the data window will zoom the window to the
default ranges.

27
Plot Area – Click & Drag
Now you can actively click on, grab and move RTA and Transfer Function traces using your mouse
in the v7 plot area!
On screen control handles!
Various threshold controls (Spectrograph, Coherence Blanking) show up in, and can be
modified from, the data plot area – on the fly!
New in v7!

28
Cursor Readout
As in past versions, here you find information about your cursor position.
29
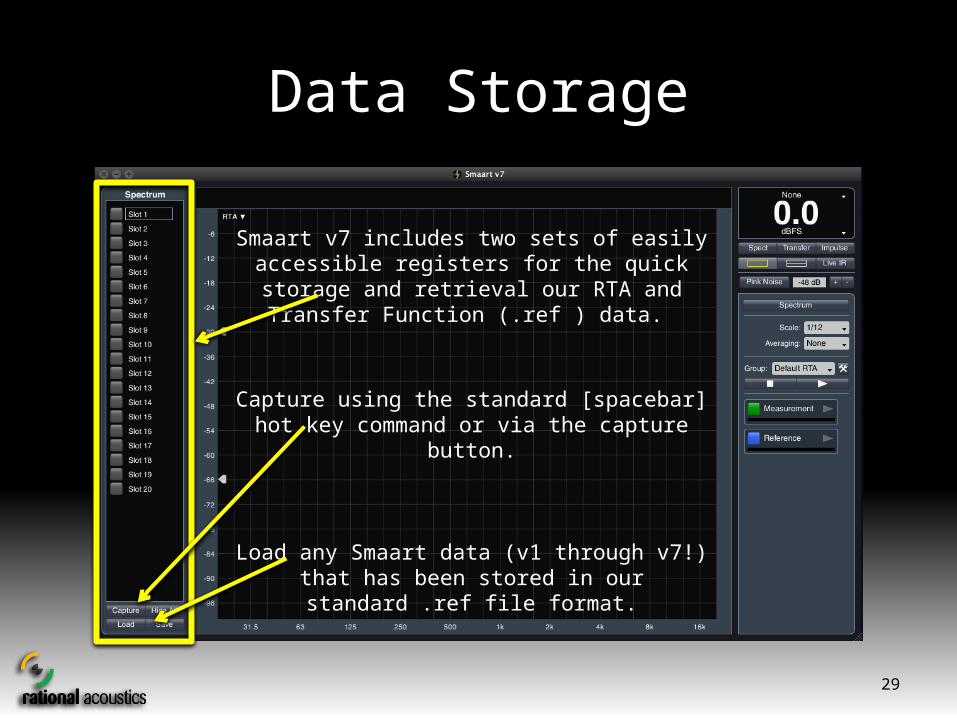
Data Storage
Smaart v7 includes two sets of easily accessible registers for the quick storage and retrieval our RTA
and Transfer Function (.ref ) data.
Capture using the standard [spacebar] hot key command or via the capture button.
Load any Smaart data (v1 through v7!) that has been stored in our standard .ref file format.
30
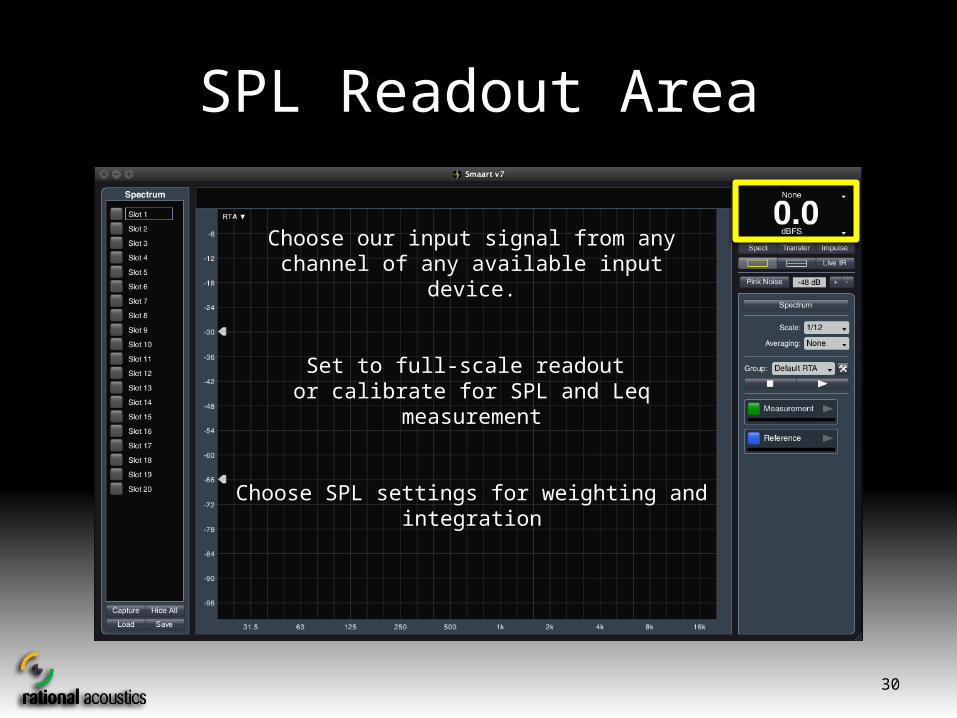
SPL Readout Area
Choose our input signal from any channel of any available input device.
Set to full-scale readout or calibrate for SPL and Leq measurement
Choose SPL settings for weighting and integration

31
Measurement View Control
Like earlier versions of Smaart, measurement view buttons are used to determine what type of
measurement data is displayed and how many widows are visible.
32
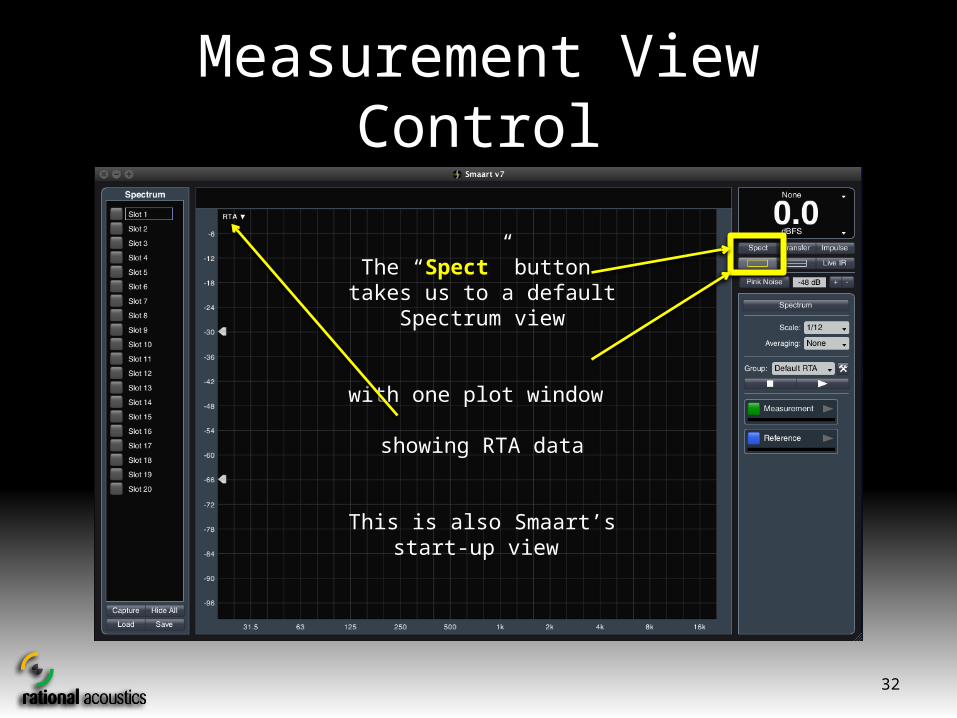
Measurement View Control
The “Spect” button takes us to a default Spectrum view
with one plot window
showing RTA data
This is also Smaart’s start-up view
33
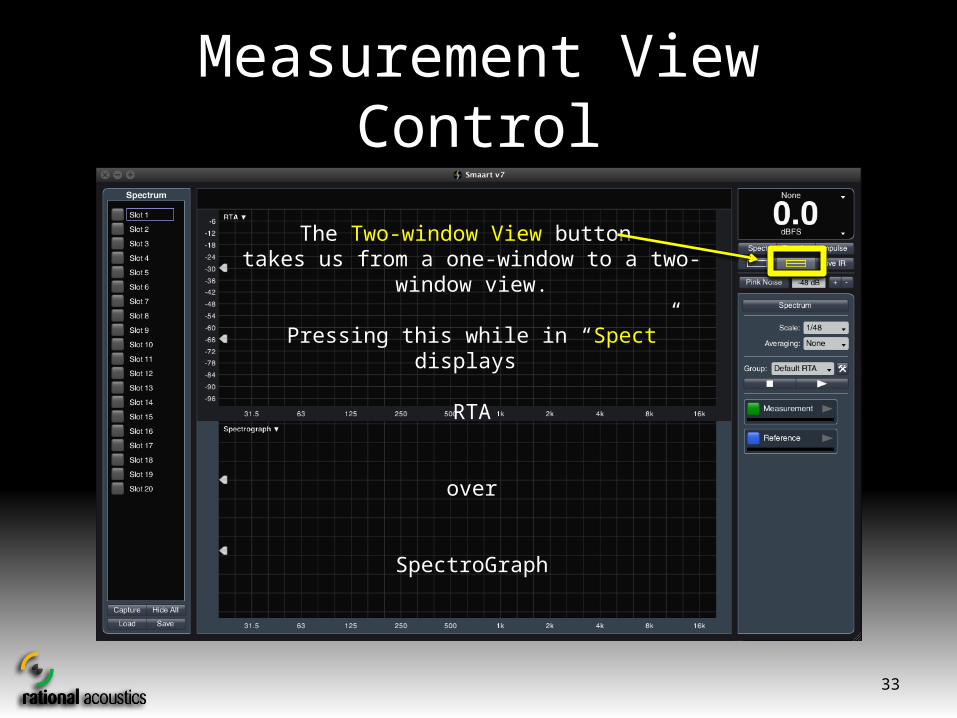
Measurement View Control
The Two-window View button takes us from a one-window to a two-window view.
Pressing this while in “Spect” displays
RTA
over
SpectroGraph

34
Measurement View Control
The “Transfer” button takes us to a default Transfer Function view, with two plot windows:
The Top Window displays TF Phase
The Bottom Window displays TF Magnitude
35
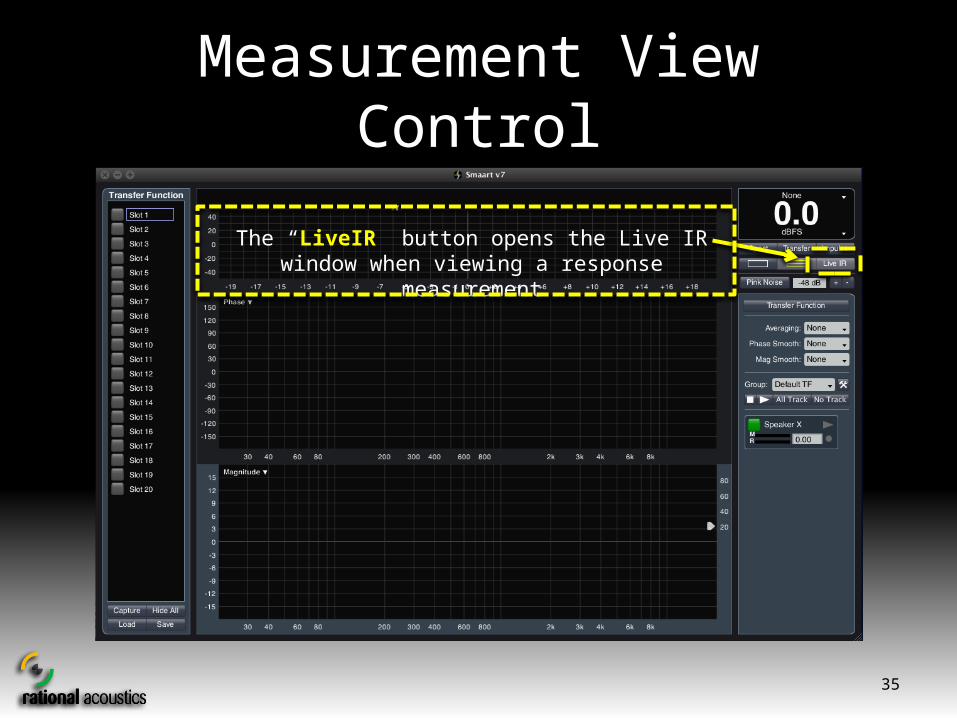
Measurement View Control
The “LiveIR” button opens the Live IR window when viewing a response measurement

36
Measurement View Control
The “Impulse” button takes us to Impulse Response Mode
And the “Real Time” buttonIn IR mode takes us back to Real Time Mode
This switch can also be triggered via the “Mode” Menu.

37
Signal Generator
This strip controls Smaart’s signal generator.
Pressing the button turns the generator on/off.
Clicking on the level field brings up the generator control dialog

38
Measurement Controls
This area is where we select and control our measurements.
The controls presented here vary depending upon whether we are addressing Spectrum (single-channel)
or Transfer Function (dual-channel) measurements
39
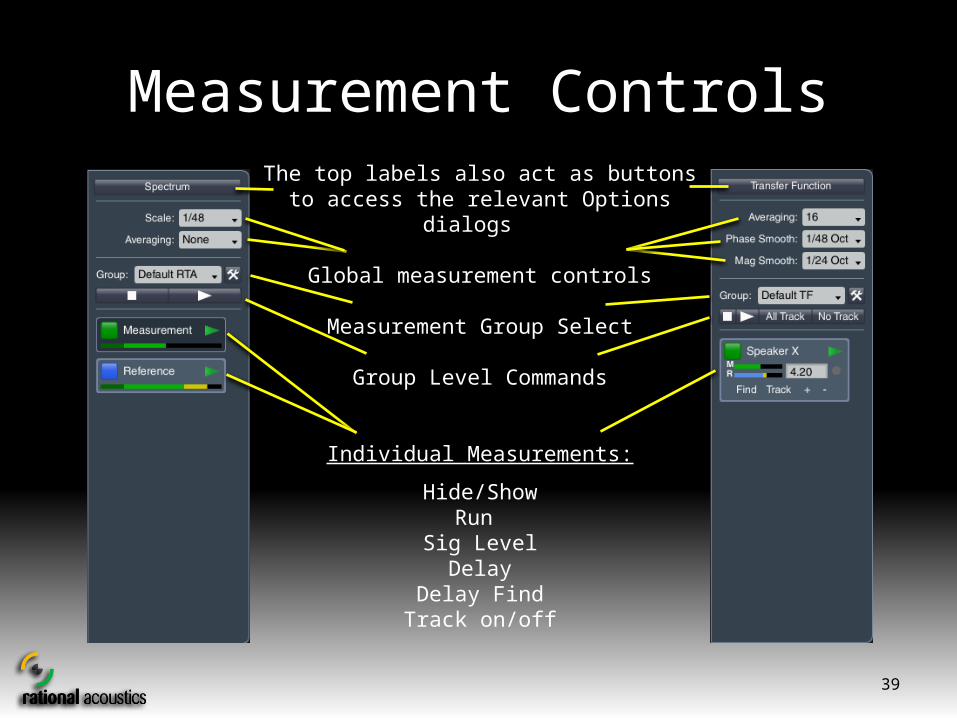
Measurement ControlsThe top labels also act as buttons to access the
relevant Options dialogs
Global measurement controls
Measurement Group Select
Group Level Commands
Individual Measurements:
Hide/ShowRun
Sig LevelDelay
Delay FindTrack on/off

40
Spectrum Measurements
41
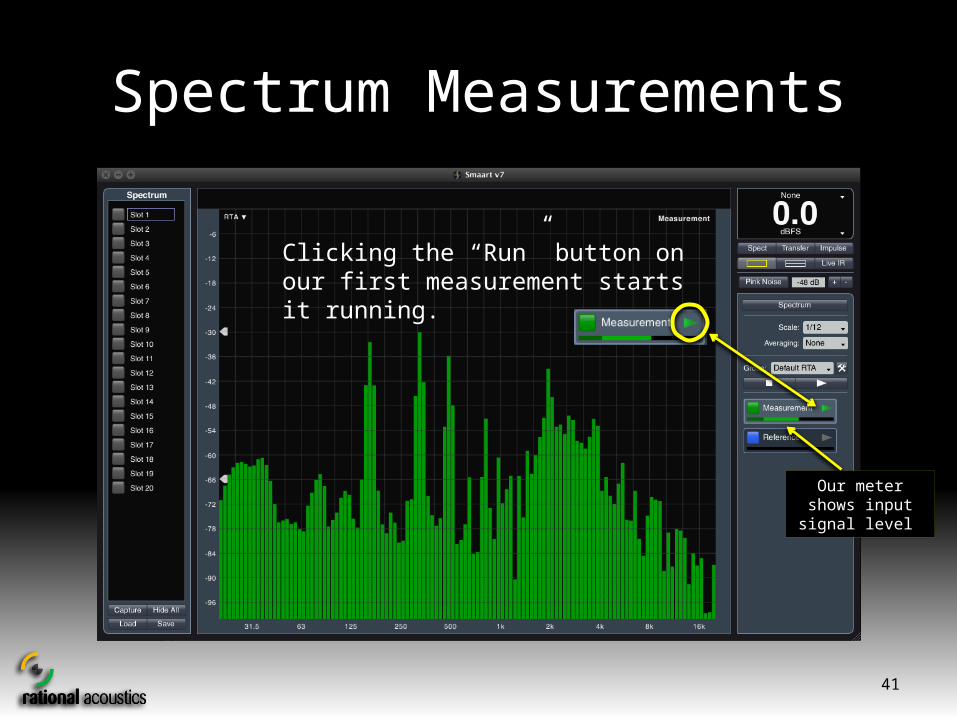
Spectrum Measurements
Clicking the “Run” button on our first measurement starts it running.
Our meter shows input signal level

42
Spectrum Measurements
RTA display settings can be adjusted in the
Spectrums Options dialog

43
Spectrum Measurements
We can use the Global Spectrum controls to vary Scale and Averaging
44
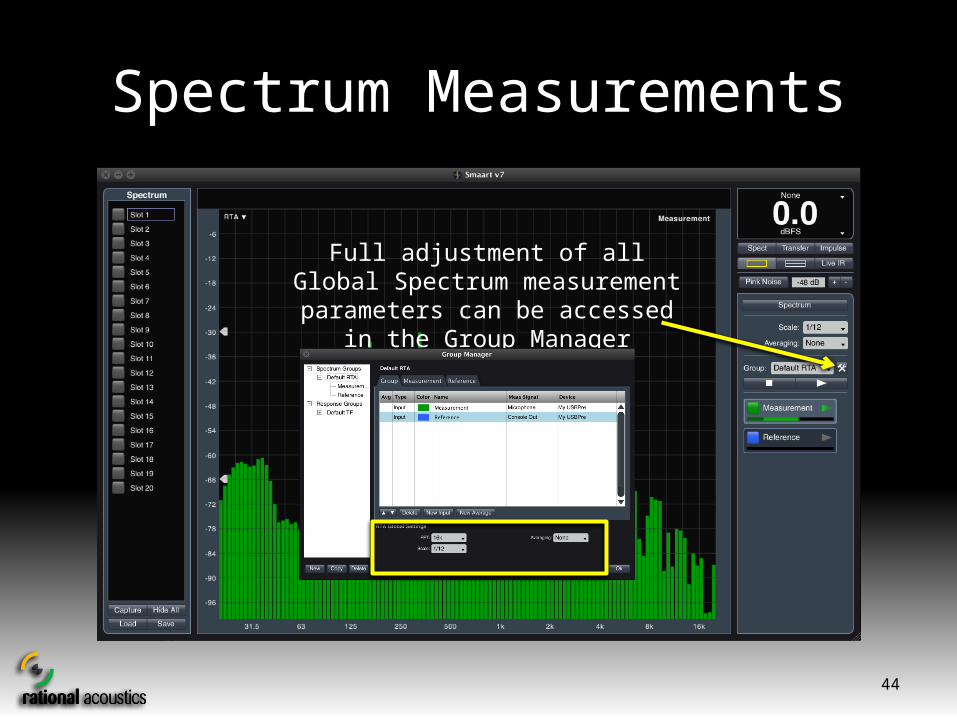
Spectrum Measurements
Full adjustment of all Global Spectrum measurement parameters can be accessed in the Group Manager

45
Spectrum Measurements
Clicking the “Run” button on our second measurement starts it running as well.
The lighter background color indicates that this is the “active” measurement - it is displayed in front of any other measurement

46
Spectrum Measurements
Clicking on the first measurement makes it the “active” measurement and brings it
to the front.
The lighter background color indicates that this is the “active” measurement - it is displayed in front of any other measurement

47
Spectrum Measurements
Clicking on its colored square hides a measurement trace and an “X” is shown.
Even though a measurement’s trace is hidden, it is still running – as evidenced by its input meter.

48
Spectrum Measurements
To capture data from the active measurement, click on a data Register slot
then capture using either the “Capture” buttonor the [space bar] hot key.
You can re-name your data by
highlighting its name and typing a
new one.

49
Spectrum Measurements
Pressing the two-window button now brings up a view with RTA in
the top window and Spectrograph in the lower window.
RTA data trace now hidden

50
Spectrum Measurements
Clicking the One-Window view button and choosing “Spectrograph” in the
drop-down view selector gives us a full window view of the Spectrograph

51
Spectrum Measurements
The Spectrograph view vertically displays a series of spectrum measurements or “slices”.
Smaart v7 stores a slice history so we can scroll back through data which has passed off the screen. We can also control the number of
vertical “pixels per slice” to adjust the measurement scroll speed.
We adjust both of these settings in the Spectrum Options dialog.
52
Transfer Function Measurements

53
Transfer Function Measurements
The “Transfer” button takes us to a default Transfer Function view, with two plot windows:
Top: TF Phase Bottom: TF Magnitude
With noise going through our speaker system,clicking the “Run” button on our measurement
starts it running.

54
Transfer Function Measurements
First steps in our Transfer Function (Frequency Response)
measurement process issetting our input levels
andsetting our measurement delay
We have used the signal generator as
our pink noise source
55
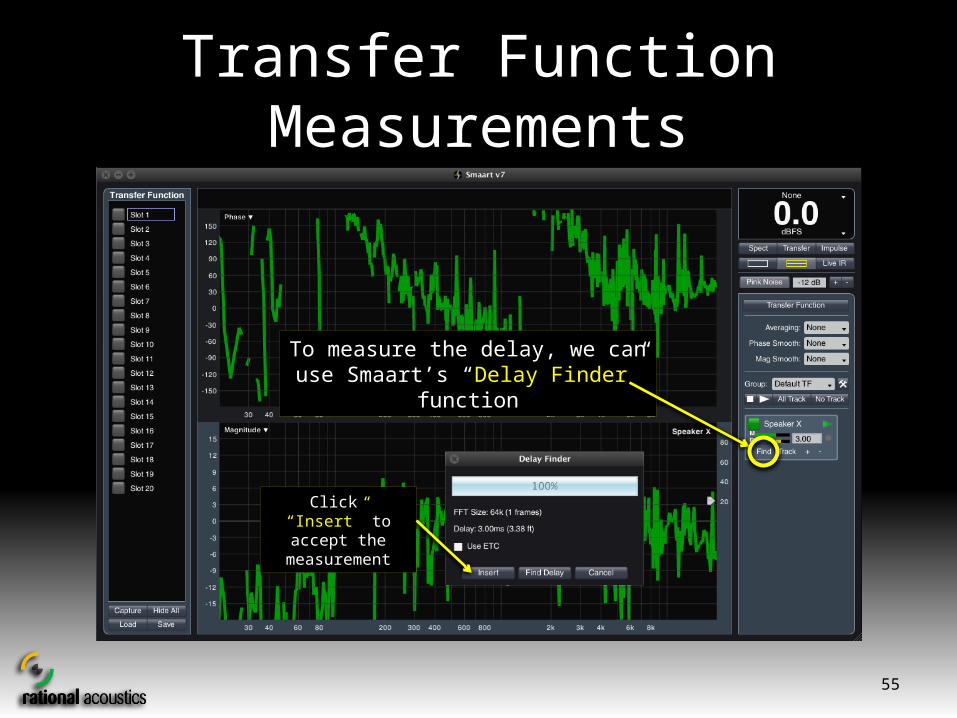
Transfer Function Measurements
To measure the delay, we can use Smaart’s “Delay Finder” function
Click “Insert” to accept the
measurement

56
Transfer Function Measurements
Increase Averaging to stabilize our measurementand
Adjust Mag and Phase Trace Smoothing to improve readability
Note: The Coherence trace will not be available until
we engage averaging.
The Coherence blanking threshold
control
*Remember, we can adjust trace offset by
“clicking” directly on a trace and “dragging” it
up and down.
57
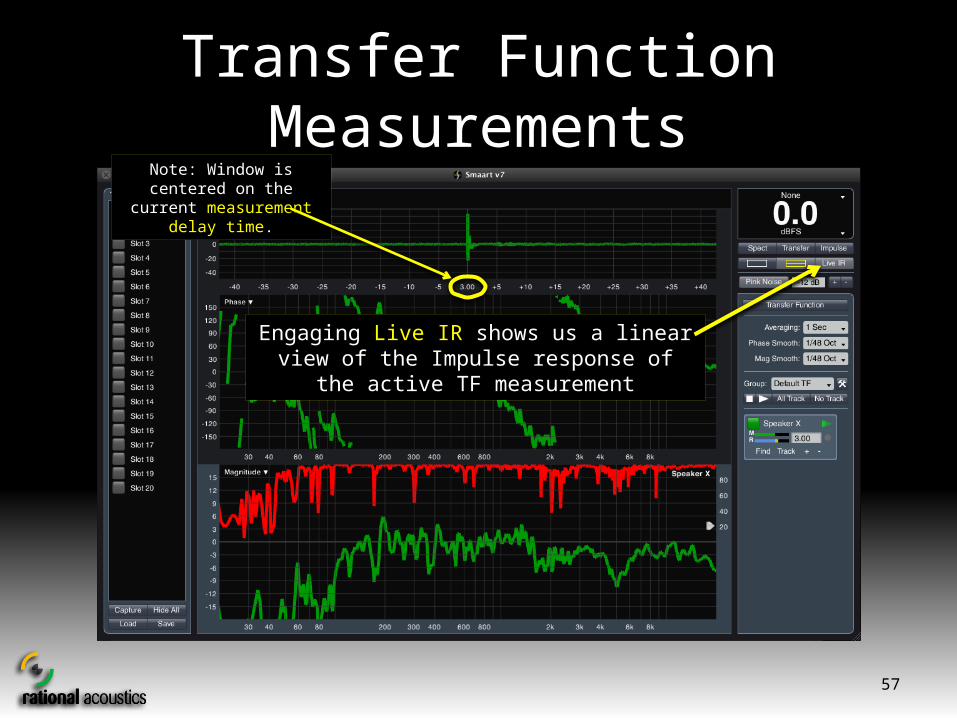
Transfer Function Measurements
Engaging Live IR shows us a linear view of the Impulse response of the active TF measurement
Note: Window is centered on the current measurement
delay time.

58
Transfer Function Measurements
Smaart v7’s delay Track uses the Live IR function to automatically and continuously measure and
adjust the measurement delay
Yellow Dot indicates tracking is engaged
Click on the “Track” Button or Yellow Dot to engage Tracking

59
Transfer Function Measurements
Full control of all Global Transfer Function measurement parameters can be accessed in
the Group Manager
60
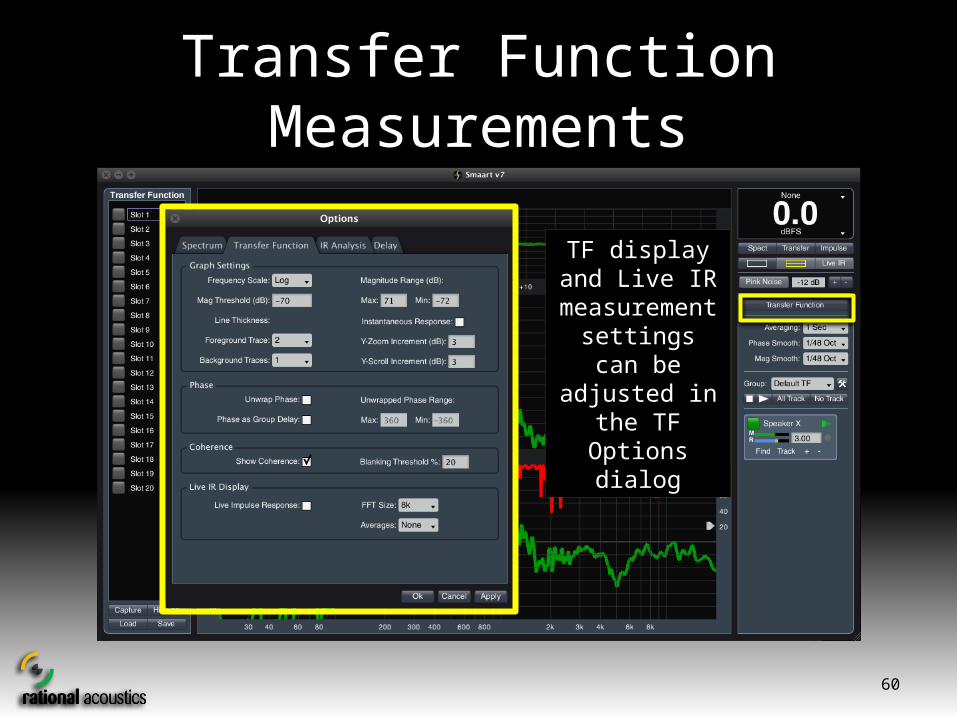
Transfer Function Measurements
TF displayand Live IR
measurement settings can be adjusted in the
TF Options dialog

61
Impulse Response Mode

62
Impulse Response Mode
The primary purpose for this mode is to perform and analyze Impulse Response Measurements
in bothTime Domain and Frequency Domain
In this mode, we can also analyze previous IR measurements that have been stored
in standard .wav audio file format

63
Impulse Response Mode
To make a IR measurement we:
select a configured Response Measurement
set our measurement FFT size / TC
adjust our signal levels
hit Start
64
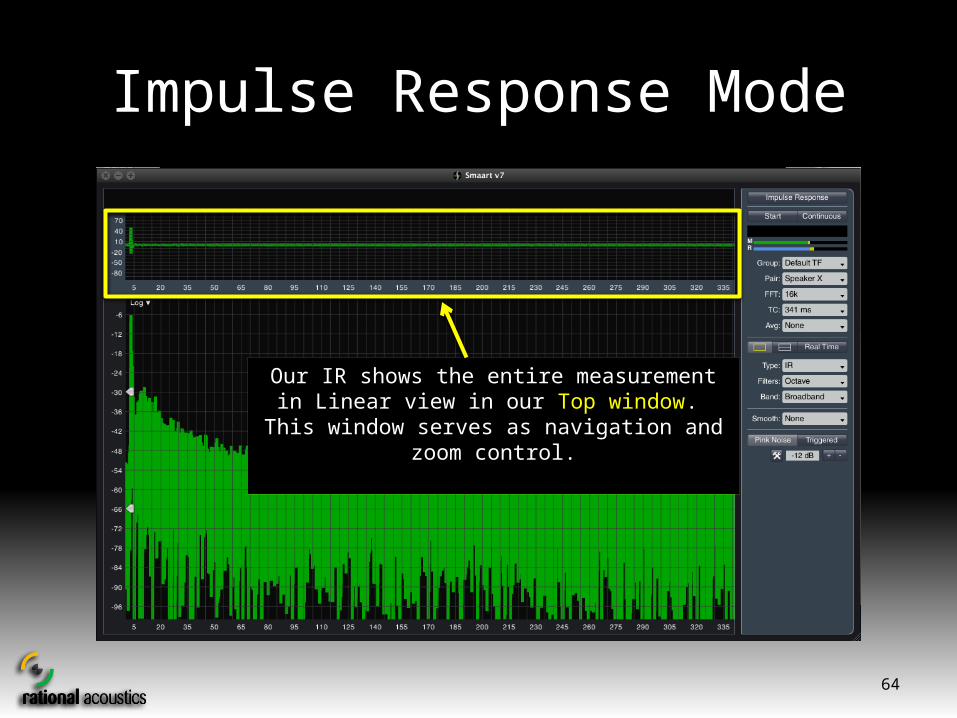
Impulse Response Mode
Our IR shows the entire measurement in Linear view in our Top window.
This window serves as navigation and zoom control.
65
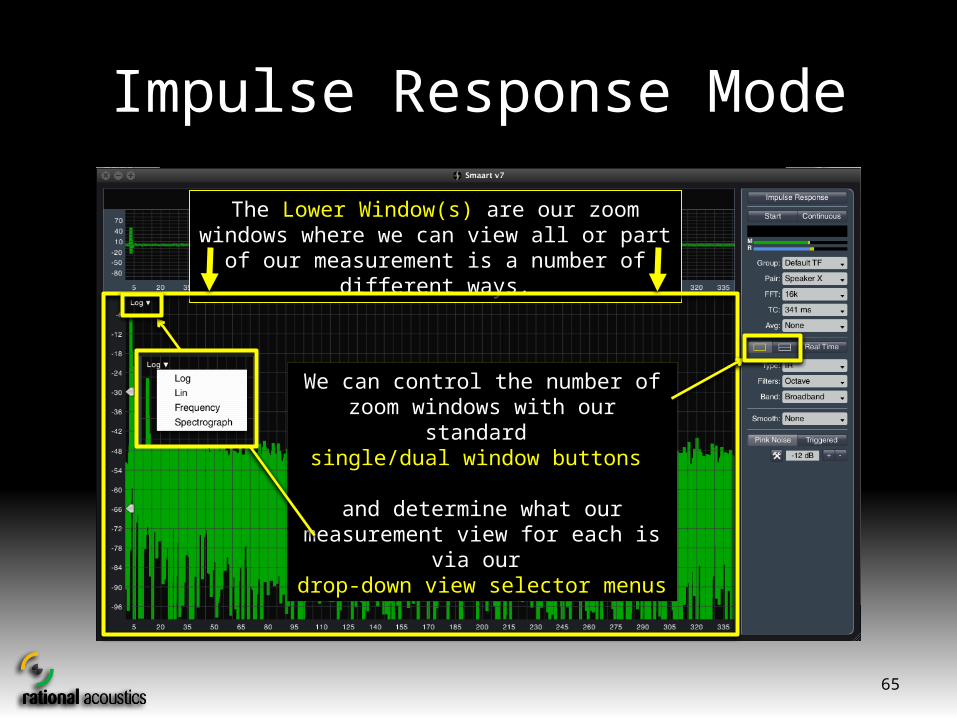
Impulse Response Mode
The Lower Window(s) are our zoom windows where we can view all or part of our measurement is a
number of different ways.
We can control the number of zoom windows with our standard single/dual window buttons
and determine what our measurement view for each is via our
drop-down view selector menus

66
Impulse Response Mode
This window is displaying a Log view of our Impulse

67
Impulse Response Mode
This window is displaying a Linear (zoomed) view of our Impulse
This window shows the bottom window zoom range
68
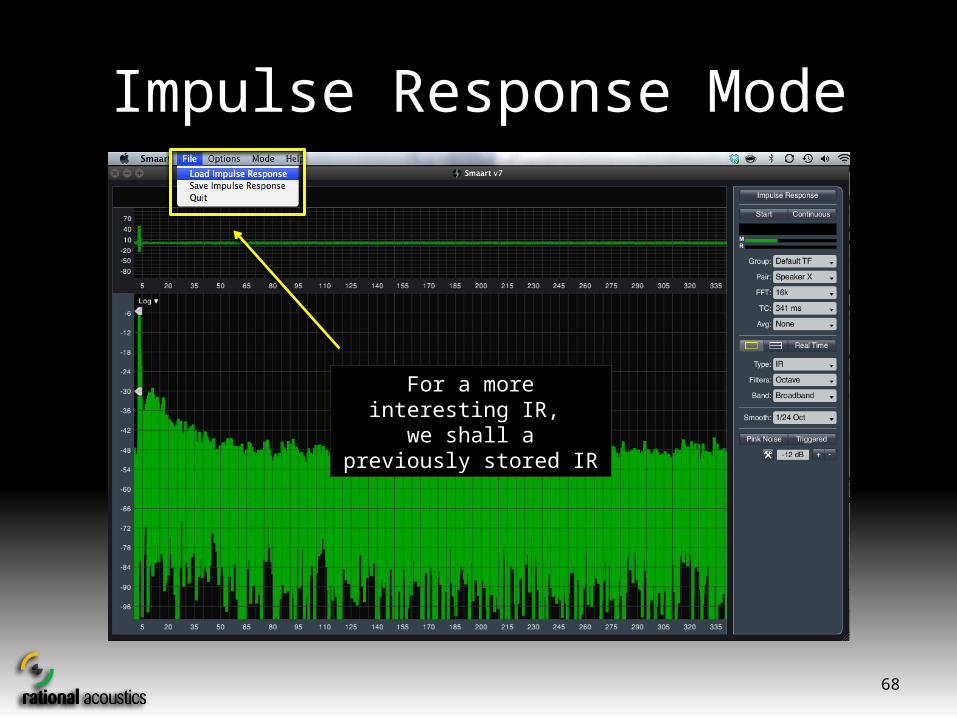
Impulse Response Mode
For a more interesting IR, we shall a previously stored IR
69
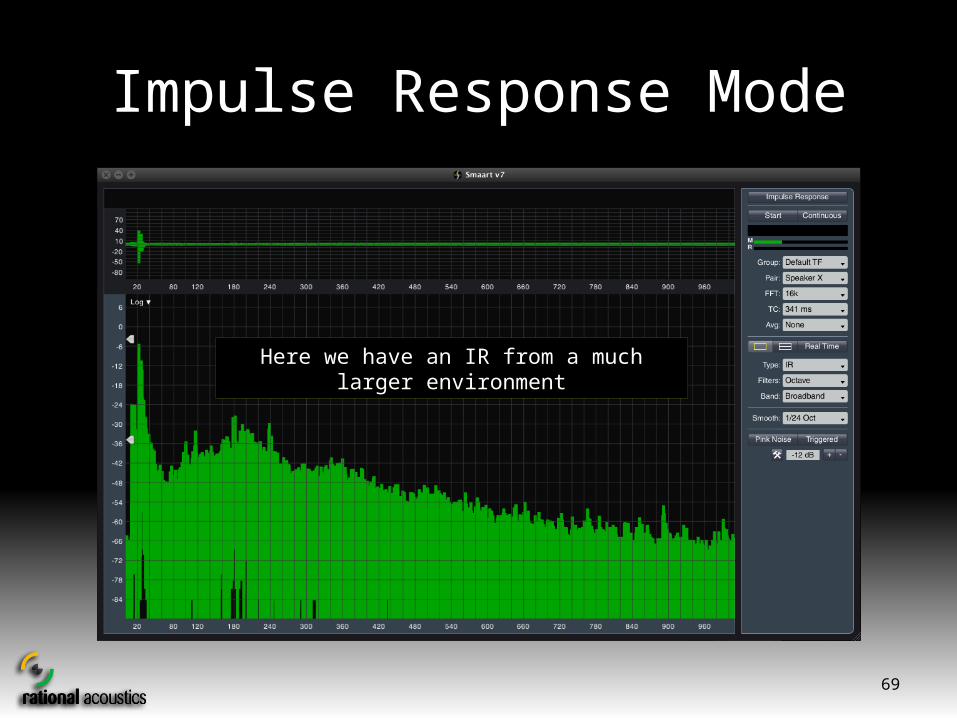
Impulse Response Mode
Here we have an IR from a much larger environment
70
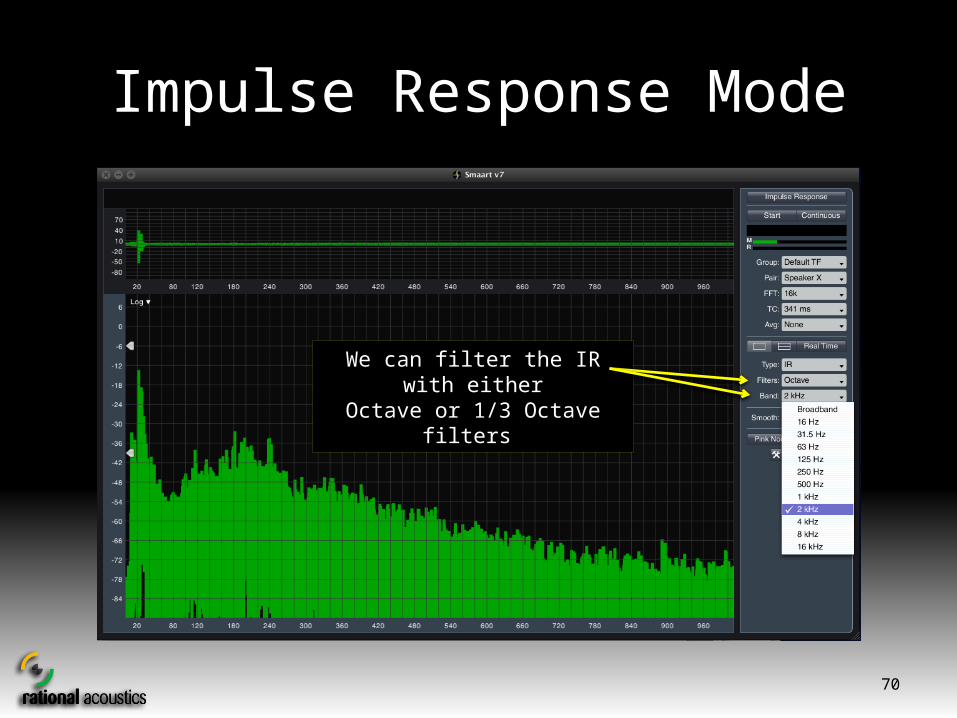
Impulse Response Mode
We can filter the IR with eitherOctave or 1/3 Octave filters
71
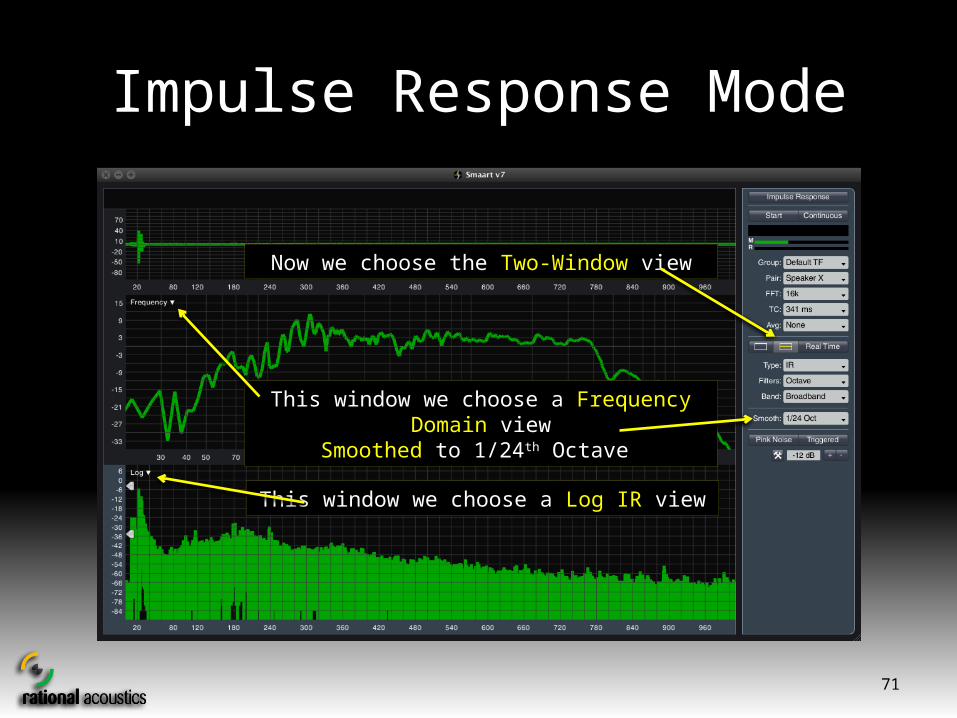
Impulse Response Mode
Now we choose the Two-Window view
This window we choose a Frequency Domain viewSmoothed to 1/24th Octave
This window we choose a Log IR view
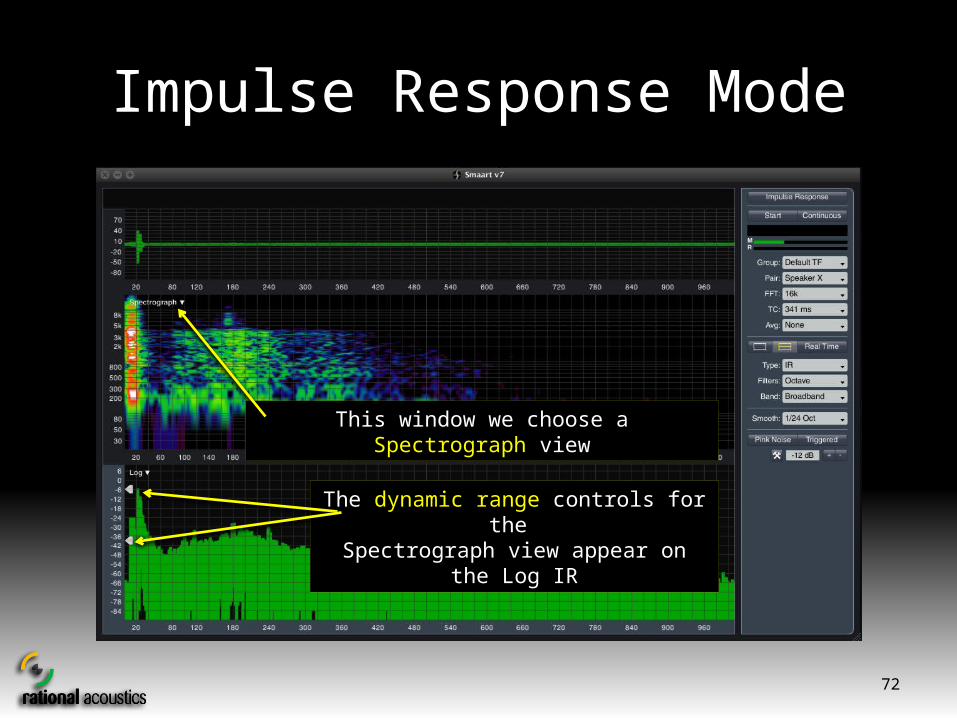
72
Impulse Response Mode
This window we choose a Spectrograph view
The dynamic range controls for the Spectrograph view appear on the Log IR

73
Impulse Response Mode
IR displayand
Spectrograph measurement settings can be adjusted in the
IR Options dialog
74
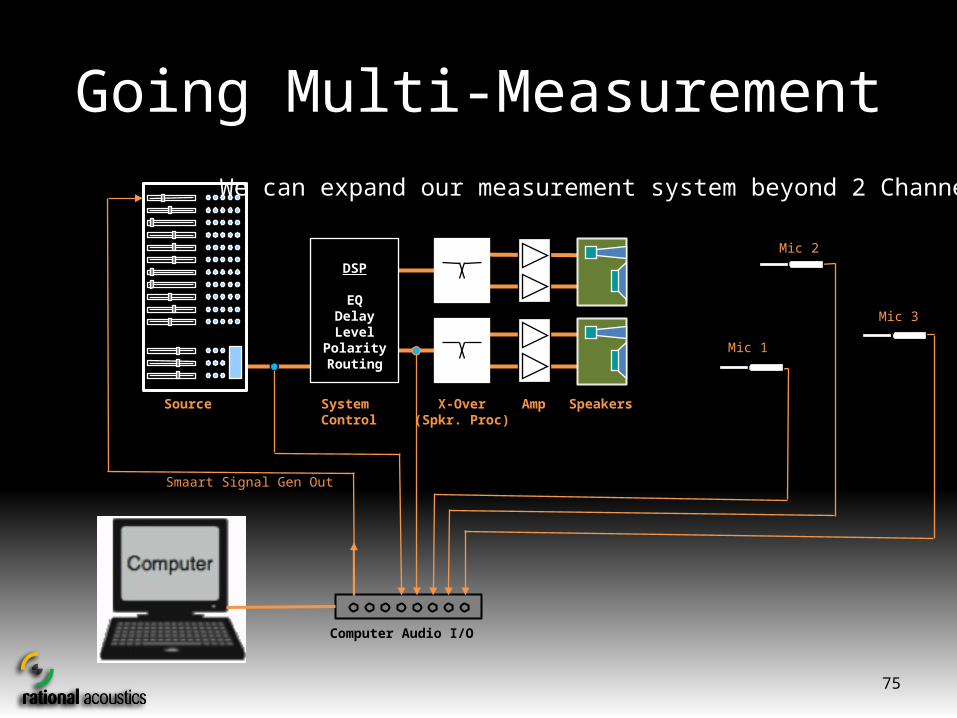
Going Multi-Measurement
Going Multi-Measurement
75
Amp SpeakersX-Over(Spkr. Proc)
SystemControl
DSP
EQDelayLevel
PolarityRouting
Computer Audio I/O
Source
Mic 1
Mic 2
Mic 3
Smaart Signal Gen Out
We can expand our measurement system beyond 2 Channels

76
Why Measurement Groups?
The short answer is, it depends upon our measurement needs and the complexity of our measurement system.
In the case of Spectrum Measurements, we could build a Group for each input device that we use. This will allow us to
quickly check signal presence for our devices.

77
Why Measurement Groups?
Here we see the spectra of the five input channels that we are using from our device
“PreSonus FireStudio”Measurement Group Select

78
Why Measurement Groups?
In the case of Response Measurements, we could build Groups for each sub-system we plan to measure. This allows
us to better organize our measurement process as well as the resulting data we capture.

79
Why Measurement Groups?
Our Group Names indicate the subsystem we shall be measuring
Our first three response measurements in this Group are measurements of the Main Left speaker system
from three separate Mic positions: Balcony, FOH and Roaming
Each measurement uses Console L Out as its Ref

80
Why Measurement Groups?
The fourth Response measurement in our Mains Left Group is a
measurement of our Left System EQ. Here we use EQ Out L as our Meas and
Console L Out as our Ref
Since this “Left EQ” measurement is a purely electronic measurement, we may want to
adjust some of our measurement parameters for this response separate from the Global
settings. To do this, we access its individual
measurement Tab.
Here we choose to fix the averaging for this measurement to
“16” by un-checking the “Use Global” box. We also fix the
Mag and Phase Smoothing to “None”
If want, we can also have the trace for this measurement graph inverted

81
Why Measurement Groups?
The fifth Response measurement in our Mains Left Group is a live average
of our first three response measurements which we have named
“ML Average”
We highlight our AVG response and then choose the measurements from this group that we wish to include in this live average
To create this response measurement we use the “New Average” button.

82
Multi-Channel Measurement
Here we have our five Simultaneous Response
Measurements

83
Multi-Channel Mania
And here, we swap the Phase display for RTA