week ending april 13, 2013 (mmwr week 15) rol...number of lab confirmed flu hospitalizations 24 49...
TRANSCRIPT
Week Ending April 13, 2013 (MMWR Week 15) All data are provisional and may change as more reports are received.
I. ILINet 2
II. Virologic surveillance 4
III. Rapid antigen tests 7
IV. Hospitalizations and deaths 8
V. Syndromic surveillance 11
VI. Activity level definitions 14
VII. SC influenza surveillance components
15
VIII. National Surveillance 16
Current week Previous week Change from previous week
Percent of ILI visits reported by ILINet providers .48% .86% .38
Number of positive confirmatory tests 26 36 10
Number of lab confirmed flu hospitalizations 24 49 25
Number of lab confirmed flu deaths 0 1 1
So
uth
Car
oli
na
Dep
artm
ent
of
Hea
lth
an
d E
nvi
ron
men
tal
Co
ntr
ol
Div
isio
n o
f A
cute
Dis
ease
Ep
idem
iolo
gy
MMWR Week 15 at a Glance: Influenza Activity Level: SPORADIC Note: Activity level definitions are found on page 14 ILI Activity Status (South Carolina baseline is 2.05%*): Below baseline in the Upstate Region (.38%), the Midlands Region (.57%), and the Pee Dee Region (.63%). No reports were received from the Low Country Region. The state ILI percentage was .48%. These data reflect reports from 14 (43.8%) providers. SC Viral Isolate and RT-PCR Activity: 26 positive specimens were reported. Since 9/30/12, 1153 positive specimens have been reported. Positive Rapid Flu Test Activity: 1074 positive rapid tests were reported. Since 9/30/12, 57,528 positive rapid tests have been reported. Hospitalizations: 24 lab confirmed hospitalizations were reported. Since 9/30/12, 1689 hospitalizations have been reported. Deaths: No lab confirmed deaths were reported. Since 9/30/12, 43 deaths have been reported.
In this issue:
Summary of ILI Activity, Positive Confirmatory Tests, and Influenza Associated Hospitalizations and Deaths
http://www.scdhec.gov/flu/flu-activity-surveillance.htm 2
Summary of ILI Activity, Positive Confirmatory Tests, and Influenza Associated Hospitalizations and Deaths
I. ILINet Influenza-Like Illness Surveillance
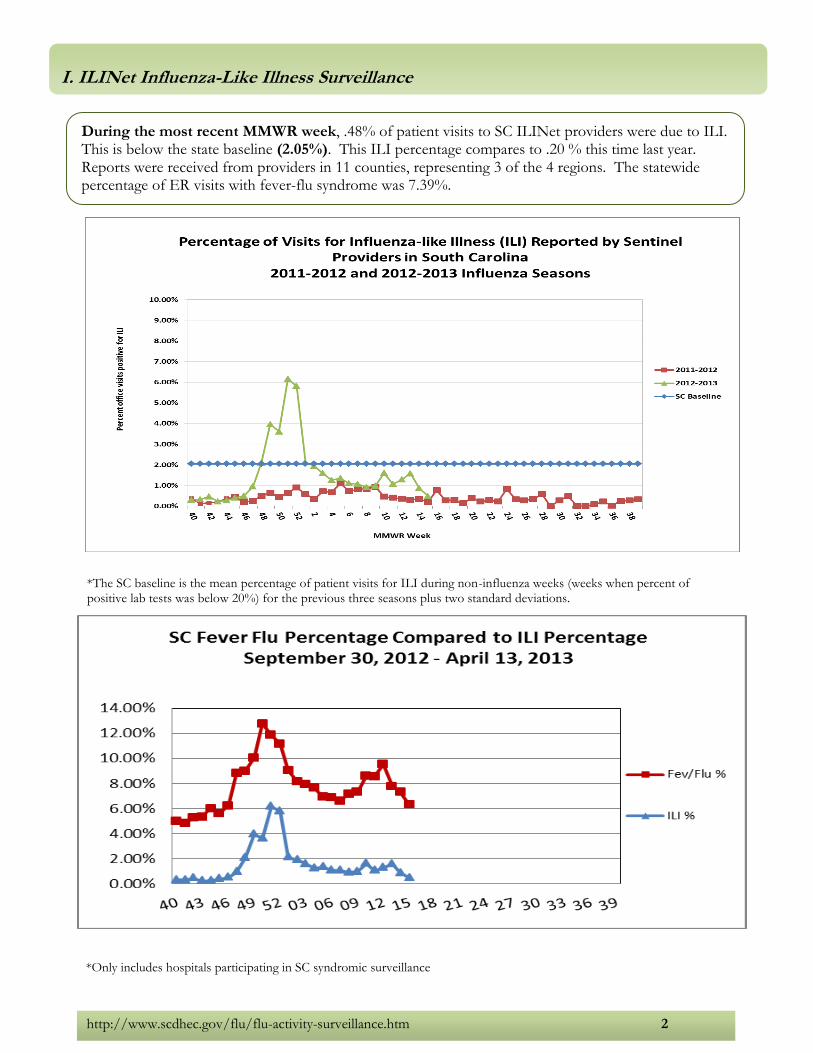
During the most recent MMWR week, .48% of patient visits to SC ILINet providers were due to ILI. This is below the state baseline (2.05%). This ILI percentage compares to .20 % this time last year. Reports were received from providers in 11 counties, representing 3 of the 4 regions. The statewide percentage of ER visits with fever-flu syndrome was 7.39%.
*The SC baseline is the mean percentage of patient visits for ILI during non-influenza weeks (weeks when percent of positive lab tests was below 20%) for the previous three seasons plus two standard deviations.
*Only includes hospitals participating in SC syndromic surveillance

http://www.scdhec.gov/flu/flu-activity-surveillance.htm 3
Influenza-Like Illness Reported by Sentinel Providers April 7, 2013 – April 13, 2013
County ILI % County ILI %
Abbeville --- Greenwood NR
Aiken 0% Hampton NR
Allendale --- Horry NR
Anderson 3.92% Jasper NR
Bamberg --- Kershaw 1.61%
Barnwell --- Lancaster ---
Beaufort NR Laurens NR
Berkeley NR Lee ---
Calhoun --- Lexington 2.50%
Charleston NR Marion ---
Cherokee --- Marlboro ---
Chester --- McCormick NR
Chesterfield --- Newberry ---
Clarendon --- Oconee ---
Colleton --- Orangeburg ---
Darlington --- Pickens 3.03%
Dillon NR Richland .14%
Dorchester NR Saluda 0%
Edgefield --- Spartanburg .32%
Fairfield --- Sumter NR
Florence .63% Union ---
Georgetown NR Williamsburg ---
Greenville .33% York 1.80%
NR: No reports received
---: No enrolled providers
*County ILI percentages are affected by the number of reporting providers within that county.
Region ILI % # of
Reporters
Upstate (Light blue) .38 6
Midlands (Red) .57 6
Pee Dee (Yellow) .63 2
Low Country (Dark blue) - 0
http://www.scdhec.gov/flu/flu-activity-surveillance.htm 4
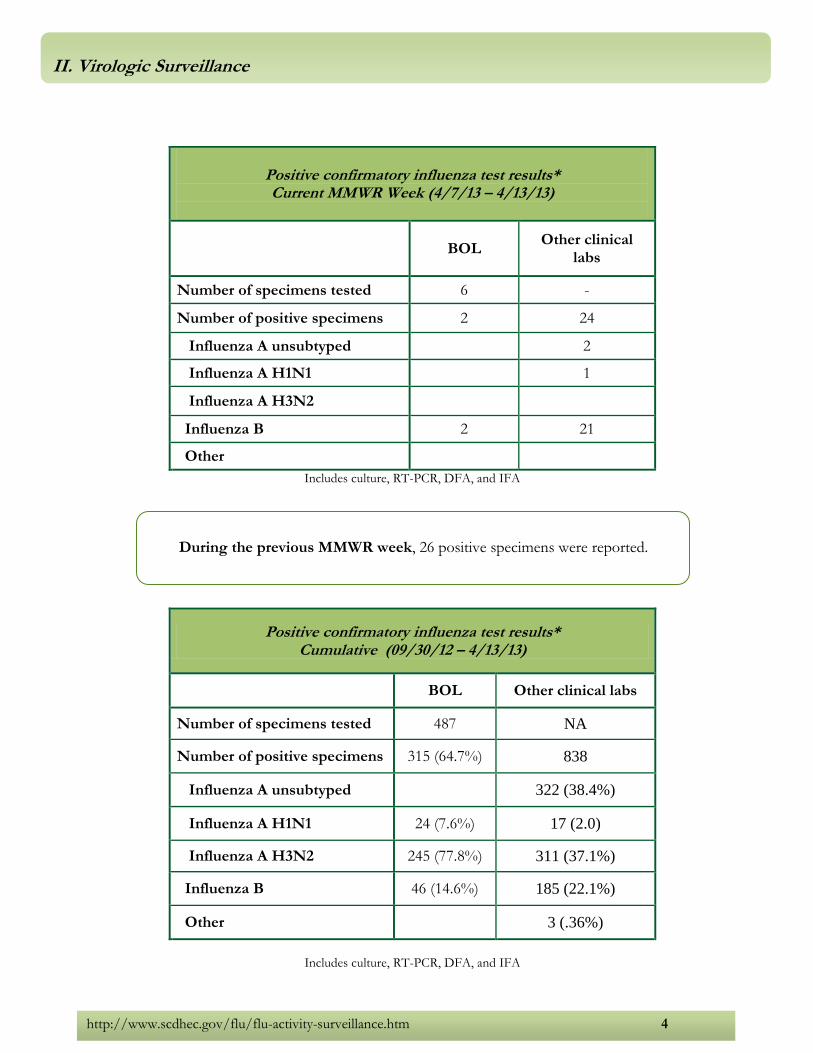
Positive confirmatory influenza test results* Current MMWR Week (4/7/13 – 4/13/13)
BOL
Other clinical labs
Number of specimens tested 6 -
Number of positive specimens 2 24
Influenza A unsubtyped 2
Influenza A H1N1 1
Influenza A H3N2
Influenza B 2 21
Other
Includes culture, RT-PCR, DFA, and IFA
Positive confirmatory influenza test results* Cumulative (09/30/12 – 4/13/13)
BOL Other clinical labs
Number of specimens tested 487 NA
Number of positive specimens 315 (64.7%) 838
Influenza A unsubtyped 322 (38.4%)
Influenza A H1N1 24 (7.6%) 17 (2.0)
Influenza A H3N2 245 (77.8%) 311 (37.1%)
Influenza B 46 (14.6%) 185 (22.1%)
Other 3 (.36%)
Includes culture, RT-PCR, DFA, and IFA
II. Virologic Surveillance
During the previous MMWR week, 26 positive specimens were reported.
http://www.scdhec.gov/flu/flu-activity-surveillance.htm 5
County Positive Tests County Positive Tests County Positive Tests
Abbeville Dillon Marion
Aiken 4 Dorchester Marlboro
Allendale Edgefield McCormick
Anderson Fairfield 1 Newberry
Bamberg Florence Oconee
Barnwell Georgetown Orangeburg
Beaufort Greenville Pickens
Berkeley 2 Greenwood 1 Richland
Calhoun Hampton Saluda 3 Charleston 7 Horry 2 Spartanburg 2
Cherokee Jasper Sumter 1
Chester Kershaw Union
Chesterfield Lancaster 2 Williamsburg
Clarendon Laurens York 1
Colleton Lee Unknown
Darlington Lexington
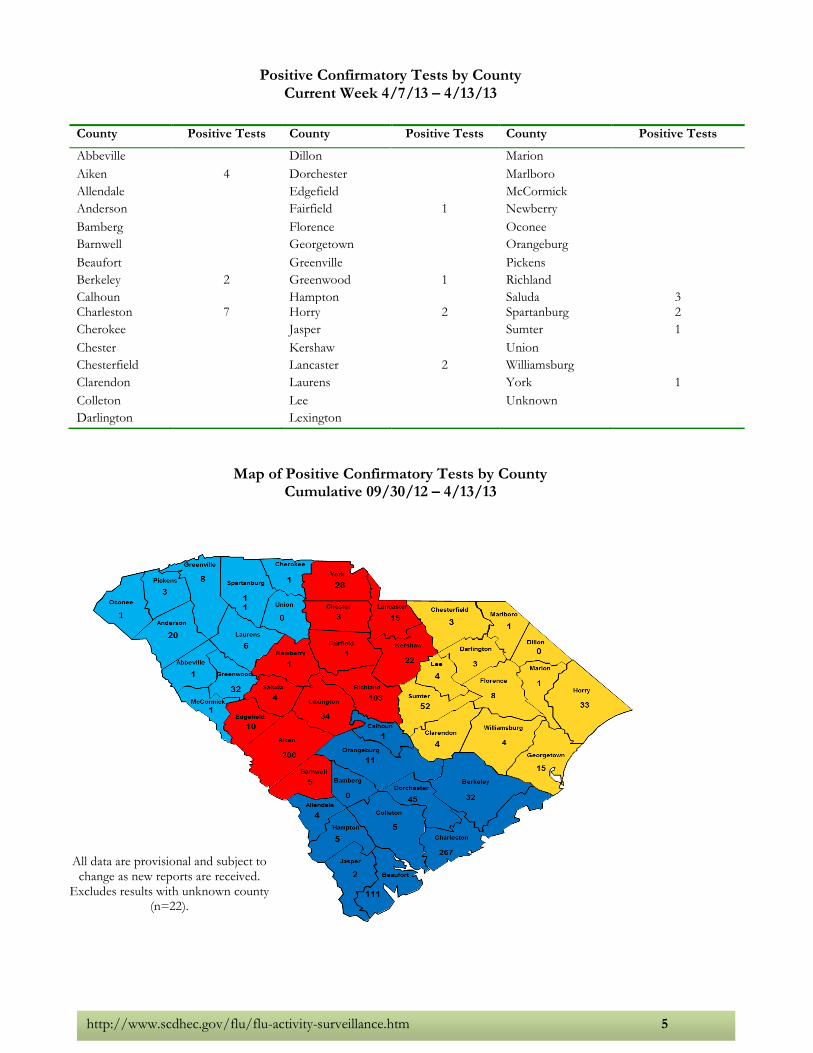
Map of Positive Confirmatory Tests by County Cumulative 09/30/12 – 4/13/13
All data are provisional and subject to change as new reports are received.
Excludes results with unknown county (n=22).
Positive Confirmatory Tests by County Current Week 4/7/13 – 4/13/13

http://www.scdhec.gov/flu/flu-activity-surveillance.htm 6
A
H1N1 A
H3N2 B A
Unsub Unk A
H1N1 A
H3N2 B A
Unsub Unk
Upstate
Abbeville 1 McCormick 1
Anderson 8 6 5 1 Oconee 1
Cherokee 1 Pickens 3
Greenwood 22 8 3 Spartanburg 2 5 4
Greenville 2 1 5 Union
Laurens 2 4
Midlands
Aiken 5 3 49 143 1 Lancaster 3 5 7
Barnwell 2 3 Lexington 5 5 24
Chester 1 2 Newberry 1
Edgefield 1 3 6 Richland 3 16 24 60
Fairfield 1 Saluda 3
Kershaw 2 8 7 4 York 1 13 4 13
Pee Dee
Chesterfield 1 1 1 Horry 2 19 5 7
Clarendon 1 2 1 Lee 2 2
Darlington 1 1 1 Marion 1
Dillon Marlboro 1
Florence 1 2 5 Sumter 32 16 4
Georgetown 5 10 Williamsburg 1 3
Low Country
Allendale 4 Colleton 5
Bamberg Dorchester 38 7
Beaufort 17 80 8 8 1 Hampton 2 1 2
Berkeley 17 15 Jasper 2
Calhoun 1 Orangeburg 4 3 3
Charleston 3 214 41 8
Unknown 16 4 2
Positive Confirmatory Tests by County and Type Cumulative 9/30/12 – 4/13/13

http://www.scdhec.gov/flu/flu-activity-surveillance.htm 7
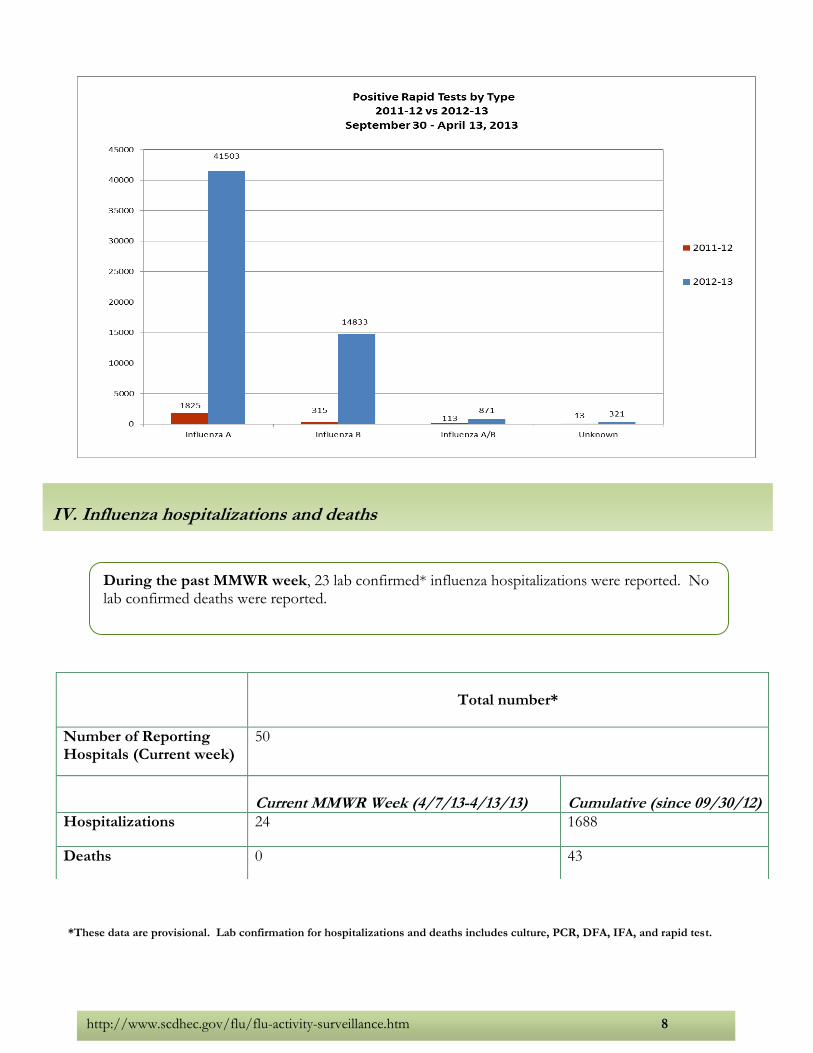
During the past MMWR week, 1074 positive rapid antigen tests were reported. Of these, 212 were influenza A, 836 were influenza B, and 26 were influenza A/B. This compares to 77 this time last year. 57,528 positive rapid tests have been reported this year.
County Positive Tests County Positive Tests County Positive Tests
Abbeville Dillon Lexington 32
Aiken 4 Dorchester 64 Marion 5
Allendale 3 Edgefield 5 Marlboro 4
Anderson 21 Fairfield 83 McCormick
Bamberg Florence Newberry 9
Barnwell 2 Georgetown 65 Oconee 6
Beaufort 28 Greenville 136 Orangeburg 25
Berkeley 48 Greenwood 32 Pickens 2
Calhoun Hampton Richland 88 Charleston 153 Horry 45 Saluda
Cherokee 7 Jasper Spartanburg 32
Chester Kershaw 40 Sumter 21
Chesterfield 5 Lancaster 5 Union
Clarendon 14 Laurens Williamsburg 5
Colleton 6 Lee 1 York 61
Darlington 17
III. Positive Rapid Antigen Tests
Positive Rapid Flu Tests by County April 7, 2013 – April 13, 2013
http://www.scdhec.gov/flu/flu-activity-surveillance.htm 8
Total number*
Number of Reporting Hospitals (Current week)
50
Current MMWR Week (4/7/13-4/13/13)
Cumulative (since 09/30/12)
Hospitalizations 24 1688
Deaths 0 43
IV. Influenza hospitalizations and deaths
During the past MMWR week, 23 lab confirmed* influenza hospitalizations were reported. No lab confirmed deaths were reported.
*These data are provisional. Lab confirmation for hospitalizations and deaths includes culture, PCR, DFA, IFA, and rapid test.

http://www.scdhec.gov/flu/flu-activity-surveillance.htm 9

http://www.scdhec.gov/flu/flu-activity-surveillance.htm 10
Lab Confirmed Influenza Deaths by County
September 30, 2012 – April 13, 2013
County Deaths County Deaths
Aiken 4 Lexington 4
Barnwell 1 McCormick 1
Beaufort 2 Newberry 1
Charleston 1 Oconee 4
Cherokee 1 Pickens 3
Clarendon 1 Richland 4
Georgetown 1 Spartanburg 2
Greenville 6 Sumter 2
Horry 1 Williamsburg 1
Jasper 1 York 2
Total Deaths 43
http://www.scdhec.gov/flu/flu-activity-surveillance.htm 11
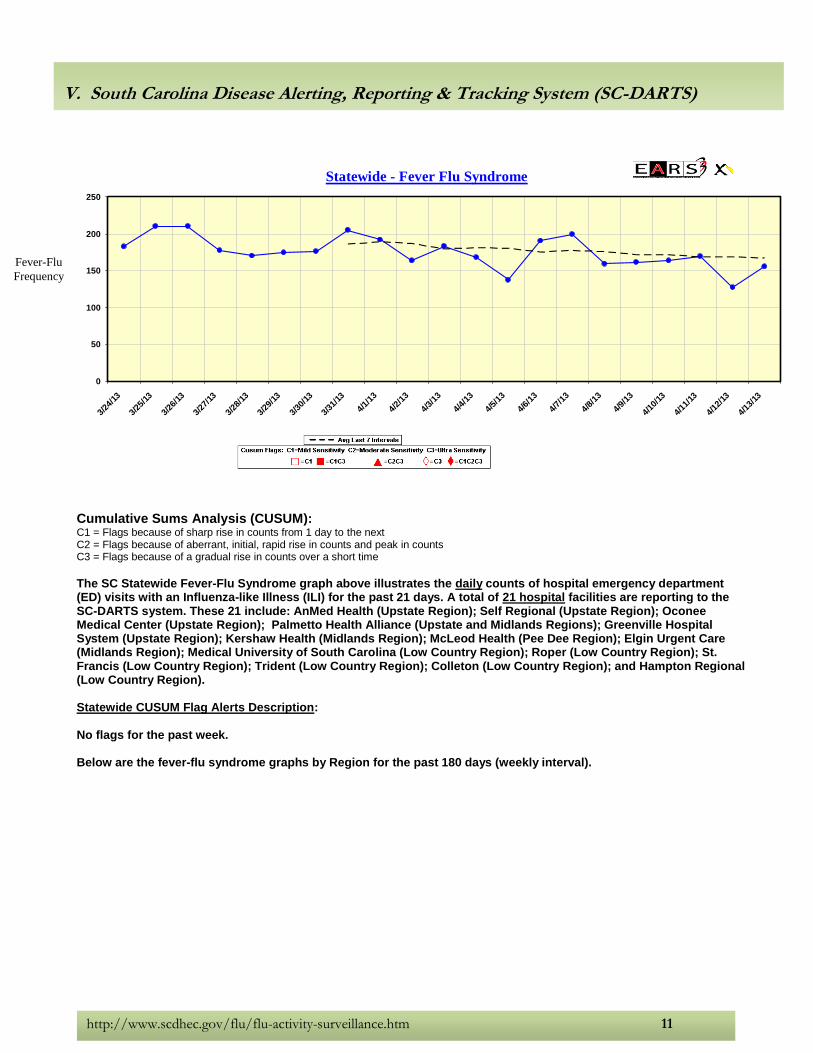
Cumulative Sums Analysis (CUSUM): C1 = Flags because of sharp rise in counts from 1 day to the next C2 = Flags because of aberrant, initial, rapid rise in counts and peak in counts C3 = Flags because of a gradual rise in counts over a short time
The SC Statewide Fever-Flu Syndrome graph above illustrates the daily counts of hospital emergency department (ED) visits with an Influenza-like Illness (ILI) for the past 21 days. A total of 21 hospital facilities are reporting to the SC-DARTS system. These 21 include: AnMed Health (Upstate Region); Self Regional (Upstate Region); Oconee Medical Center (Upstate Region); Palmetto Health Alliance (Upstate and Midlands Regions); Greenville Hospital System (Upstate Region); Kershaw Health (Midlands Region); McLeod Health (Pee Dee Region); Elgin Urgent Care (Midlands Region); Medical University of South Carolina (Low Country Region); Roper (Low Country Region); St. Francis (Low Country Region); Trident (Low Country Region); Colleton (Low Country Region); and Hampton Regional (Low Country Region). Statewide CUSUM Flag Alerts Description: No flags for the past week. Below are the fever-flu syndrome graphs by Region for the past 180 days (weekly interval).
Statewide - Fever Flu Syndrome
0
50
100
150
200
250
3/24
/13
3/25
/13
3/26
/13
3/27
/13
3/28
/13
3/29
/13
3/30
/13
3/31
/13
4/1/
13
4/2/
13
4/3/
13
4/4/
13
4/5/
13
4/6/
13
4/7/
13
4/8/
13
4/9/
13
4/10
/13
4/11
/13
4/12
/13
4/13
/13
V. South Carolina Disease Alerting, Reporting & Tracking System (SC-DARTS)
Fever-Flu
Frequency

http://www.scdhec.gov/flu/flu-activity-surveillance.htm 12
Upstate Region Hospitals (# of Facilities): AnMed Health (3); Self-Regional (1); Oconee Medical Center (1); Greenville Hospital System (4); Palmetto Health Easley (1)
Midlands Region Hospitals (# of Facilities): Palmetto Health Baptist (1); Palmetto Health Richland (1); Kershaw Health (1); Elgin Urgent Care (1)
Upstate Region - Fever Flu Syndrome
0
100
200
300
400
500
600
700
800
10/1
4/12
10/2
1/12
10/2
8/12
11/4
/12
11/1
1/12
11/1
8/12
11/2
5/12
12/2
/12
12/9
/12
12/1
6/12
12/2
3/12
12/3
0/12
1/6/
13
1/13
/13
1/20
/13
1/27
/13
2/3/
13
2/10
/13
2/17
/13
2/24
/13
3/3/
13
3/10
/13
3/17
/13
3/24
/13
3/31
/13
4/7/
13
Midlands Region - Fever Flu Syndrome
0
50
100
150
200
250
300
350
10/1
4/12
10/2
1/12
10/2
8/12
11/4
/12
11/1
1/12
11/1
8/12
11/2
5/12
12/2
/12
12/9
/12
12/1
6/12
12/2
3/12
12/3
0/12
1/6/
13
1/13
/13
1/20
/13
1/27
/13
2/3/
13
2/10
/13
2/17
/13
2/24
/13
3/3/
13
3/10
/13
3/17
/13
3/24
/13
3/31
/13
4/7/
13
Fever-Flu
Frequency
Fever-Flu
Frequency

http://www.scdhec.gov/flu/flu-activity-surveillance.htm 13
Pee Dee Region Hospitals (# of Facilities): McLeod Health (1)
Low Country Region Hospitals (# of Facilities): Medical University of South Carolina (1); Roper (1); St. Francis (1); Trident (1); Hampton Regional (1); Colleton (1)
Pee Dee Region - Fever Flu Syndrome
0
20
40
60
80
100
120
10/1
4/12
10/2
1/12
10/2
8/12
11/4
/12
11/1
1/12
11/1
8/12
11/2
5/12
12/2
/12
12/9
/12
12/1
6/12
12/2
3/12
12/3
0/12
1/6/
13
1/13
/13
1/20
/13
1/27
/13
2/3/
13
2/10
/13
2/17
/13
2/24
/13
3/3/
13
3/10
/13
3/17
/13
3/24
/13
3/31
/13
4/7/
13
Low Country Region - Fever Flu Syndrome
0
100
200
300
400
500
600
700
800
900
10/1
4/12
10/2
1/12
10/2
8/12
11/4
/12
11/1
1/12
11/1
8/12
11/2
5/12
12/2
/12
12/9
/12
12/1
6/12
12/2
3/12
12/3
0/12
1/6/
13
1/13
/13
1/20
/13
1/27
/13
2/3/
13
2/10
/13
2/17
/13
2/24
/13
3/3/
13
3/10
/13
3/17
/13
3/24
/13
3/31
/13
4/7/
13
Fever-Flu
Frequency
Fever-Flu
Frequency

http://www.scdhec.gov/flu/flu-activity-surveillance.htm 14
Activity Level
ILI activity/Outbreaks
Laboratory data
No activity Low And No lab confirmed cases
Sporadic Not increased And Isolated lab-confirmed cases
OR Not increased And Lab confirmed outbreak in one institution
Local
Increased ILI in 1 region; ILI activity in other regions is not increased
And Recent (within the past 3 weeks) lab evidence of influenza in region with increased ILI
OR 2 or more institutional outbreaks (ILI or lab confirmed) in 1 region; ILI activity in other regions is not increased
And
Recent (within the past 3 weeks) lab evidence of influenza in region with the outbreaks; virus activity is no greater than sporadic in other regions
Regional
Increased ILI in 2-3 regions And
Recent (within the past 3 weeks) lab confirmed influenza in the affected regions OR
Institutional outbreaks (ILI or lab confirmed) in 2-3 regions
And Recent (within the past 3 weeks) lab confirmed influenza in the affected regions
Widespread
Increased ILI and/or institutional outbreaks (ILI or lab confirmed) in at least 4 of the regions
And
Recent (within the past 3 weeks) lab confirmed influenza in the state.
VI. Influenza activity levels
http://www.scdhec.gov/flu/flu-activity-surveillance.htm 15
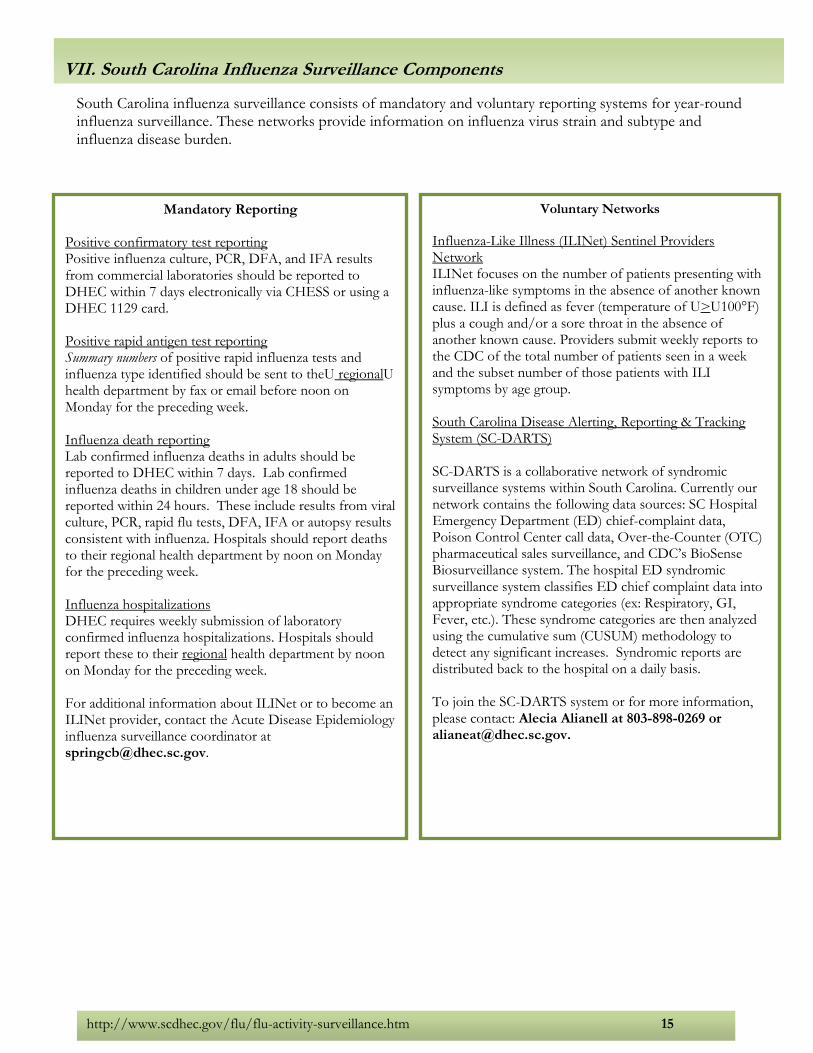
South Carolina influenza surveillance consists of mandatory and voluntary reporting systems for year-round influenza surveillance. These networks provide information on influenza virus strain and subtype and influenza disease burden.
VII. South Carolina Influenza Surveillance Components
Mandatory Reporting Positive confirmatory test reporting Positive influenza culture, PCR, DFA, and IFA results from commercial laboratories should be reported to DHEC within 7 days electronically via CHESS or using a DHEC 1129 card. Positive rapid antigen test reporting Summary numbers of positive rapid influenza tests and influenza type identified should be sent to theU regionalU health department by fax or email before noon on Monday for the preceding week. Influenza death reporting Lab confirmed influenza deaths in adults should be reported to DHEC within 7 days. Lab confirmed influenza deaths in children under age 18 should be reported within 24 hours. These include results from viral culture, PCR, rapid flu tests, DFA, IFA or autopsy results consistent with influenza. Hospitals should report deaths to their regional health department by noon on Monday for the preceding week. Influenza hospitalizations DHEC requires weekly submission of laboratory confirmed influenza hospitalizations. Hospitals should report these to their regional health department by noon on Monday for the preceding week. For additional information about ILINet or to become an ILINet provider, contact the Acute Disease Epidemiology influenza surveillance coordinator at [email protected].
Voluntary Networks
Influenza-Like Illness (ILINet) Sentinel Providers Network ILINet focuses on the number of patients presenting with influenza-like symptoms in the absence of another known cause. ILI is defined as fever (temperature of U>U100°F) plus a cough and/or a sore throat in the absence of another known cause. Providers submit weekly reports to the CDC of the total number of patients seen in a week and the subset number of those patients with ILI symptoms by age group. South Carolina Disease Alerting, Reporting & Tracking System (SC-DARTS) SC-DARTS is a collaborative network of syndromic surveillance systems within South Carolina. Currently our network contains the following data sources: SC Hospital Emergency Department (ED) chief-complaint data, Poison Control Center call data, Over-the-Counter (OTC) pharmaceutical sales surveillance, and CDC’s BioSense Biosurveillance system. The hospital ED syndromic surveillance system classifies ED chief complaint data into appropriate syndrome categories (ex: Respiratory, GI, Fever, etc.). These syndrome categories are then analyzed using the cumulative sum (CUSUM) methodology to detect any significant increases. Syndromic reports are distributed back to the hospital on a daily basis. To join the SC-DARTS system or for more information, please contact: Alecia Alianell at 803-898-0269 or [email protected].

http://www.scdhec.gov/flu/flu-activity-surveillance.htm 16
During week 14 (March 31 – April 6, 2013), influenza activity decreased in the United States.
o Viral Surveillance: Of 4,462 specimens tested and reported by collaborating laboratories, 484 (10.9%) were positive for influenza.
o Pneumonia and Influenza Mortality: The proportion of deaths attributed to pneumonia and influenza (P&I) was below the epidemic threshold.
o Influenza-Associated Pediatric Deaths: Five pediatric deaths were reported. o Influenza-Associated Hospitalizations: A cumulative rate for the season of 43.2 laboratory-
confirmed influenza-associated hospitalizations per 100,000 population was reported. Of reported hospitalizations, 50% were among adults 65 years and older.
o Outpatient Illness Surveillance: The proportion of outpatient visits for influenza-like illness (ILI) was 1.5%. This is below the national baseline of 2.2%. Two of 10 regions reported ILI at or above region-specific baseline levels. Two states experienced low activity; 48 states and New York City experienced minimal activity, and the District of Columbia had insufficient data.
o Geographic Spread of Influenza: Four states reported widespread influenza activity; 7 states reported regional influenza activity; the District of Columbia, Puerto Rico, and 14 states reported local influenza activity; 24 states reported sporadic influenza activity; Guam and one state reported no influenza activity, and the U.S. Virgin Islands did not report.
A description of surveillance methods is available at: http://www.cdc.gov/flu/weekly/overview.htm
VIII. National Surveillance MMWR Week 14 (3/31-4/6)