week 1, video 5 - upenn.edu
TRANSCRIPT
Case Study – San Pedro
Week 1, Video 5

Case Study of Classification
◻ With educational data
◻ Thousands of examples to choose from
◻ This example is one I know particularly well
Case Study of Classification
◻ San Pedro, M.O.Z., Baker, R.S.J.d., Bowers, A.J., Heffernan, N.T. (2013) Predicting College Enrollment from Student Interaction with an Intelligent Tutoring System in Middle School. Proceedings of the 6th International Conference on Educational Data Mining, 177-184.
Research Goal
◻ Can we predict student college attendance◻ Based on student engagement and learning in
middle school mathematics◻ Using fine-grained indicators distilled from
interactions with educational software in middle school (~5 years earlier)
Why?
◻ We can infer engagement and learning in middle school, which supports� Automated intervention� Providing actionable info to teachers and school
leaders
◻ But which indicators of engagement and learning really matter?� Can we find indicators that a student is at-risk,
that we can act on, before problem becomes critical?
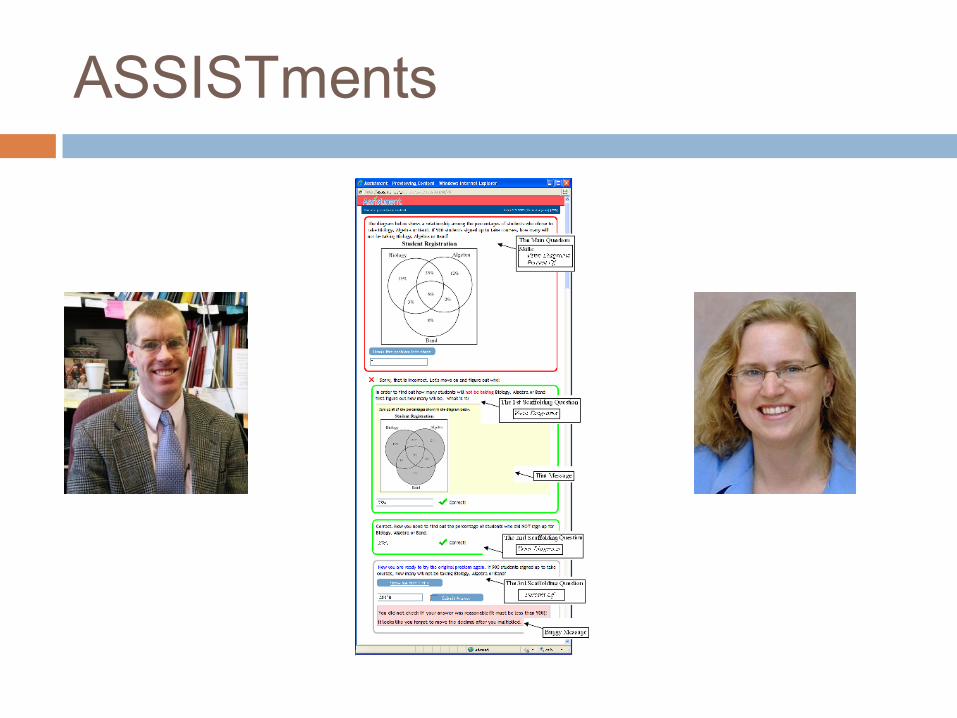
ASSISTments
Log Data
◻ 3,747 students� In 3 school districts in Massachusetts
■ 1 urban■ 2 suburban
◻ Completed 494,150 math problems� Working approximately 1 class period a week for the
entire year◻ Making 2,107,108 problem-solving attempts or
hint requests in ASSISTments◻ Between 2004-2007
Data set
◻ Records about whether student eventually attended college
◻ 58% of students in sample attended college

Automated Detectors
◻ A number of automated detectors were applied to the data from ASSISTments
◻ These detectors had themselves been previously developed using prediction modeling and were published in previous papers, including (Pardos et al., 2013)
◻ Building a detector and then using it in another analysis is called discovery with models
Automated Detectors
◻ Learning� Bayesian Knowledge Tracing; we’ll discuss this
later in the course
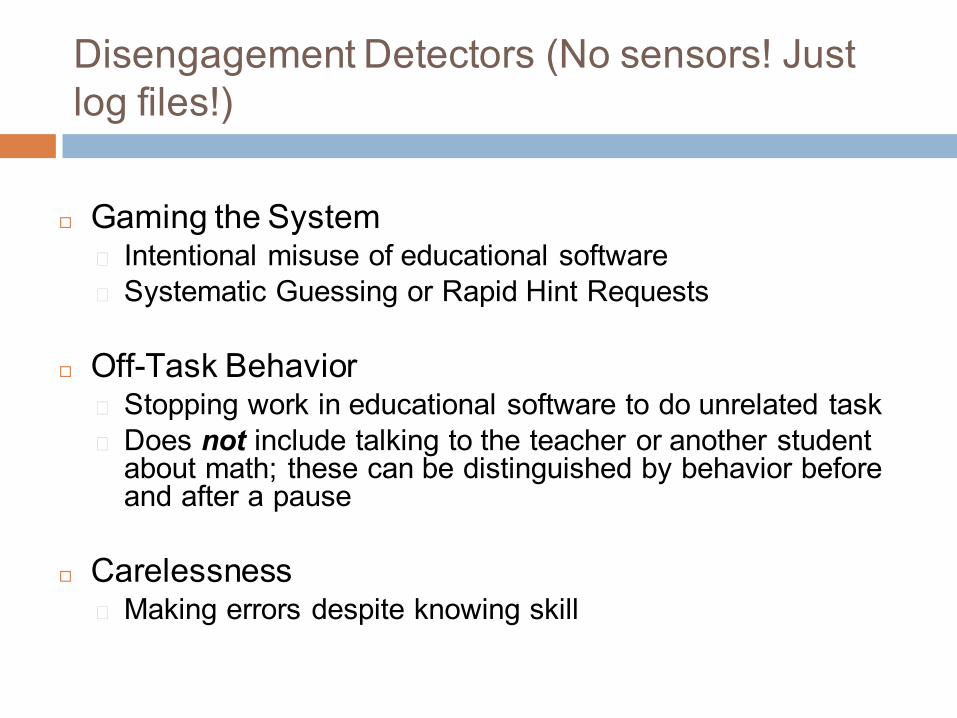
Disengagement Detectors (No sensors! Just log files!)
◻ Gaming the System� Intentional misuse of educational software � Systematic Guessing or Rapid Hint Requests
◻ Off-Task Behavior� Stopping work in educational software to do unrelated task� Does not include talking to the teacher or another student
about math; these can be distinguished by behavior before and after a pause
◻ Carelessness� Making errors despite knowing skill

Affect Detectors (No sensors! Just log files!)
◻ Boredom
◻ Frustration
◻ Confusion
◻ Engaged Concentration

College Attendance Model
◻ Predict whether a student attended college from a student’s year-long average according to the detectors
◻ Logistic Regression Classifier (binary data)◻ Cross-validated at the student-level� We’ll discuss this next week

Individual Feature Predictiveness
College Mean Std. Dev.
t-value
Student Knowledge
NO 0.292 0.151 -15.481(p<0.01)YES 0.378 0.180
Correctness NO 0.382 0.161 -17.793(p<0.01)YES 0.483 0.182
Boredom NO 0.287 0.045 5.974(p<0.01)YES 0.278 0.047
Engaged Concentration
NO 0.483 0.041 -11.979(p<0.01)YES 0.500 0.044
Confusion NO 0.130 0.054 5.686(p<0.01)YES 0.120 0.052

Individual Feature Predictiveness
College Mean Std. Dev.
t-value
Off-Task NO 0.304 0.119 1.184p=0.237YES 0.300 0.116
Gaming NO 0.041 0.062 8.862(p<0.01)YES 0.026 0.044
Carelessness NO 0.132 0.066 -13.361(p<0.01)YES 0.165 0.077
Number of First Actions(Proxy for
Attendance)
NO 114.500
91.771 -8.673(p<0.01)
YES 144.560
113.357
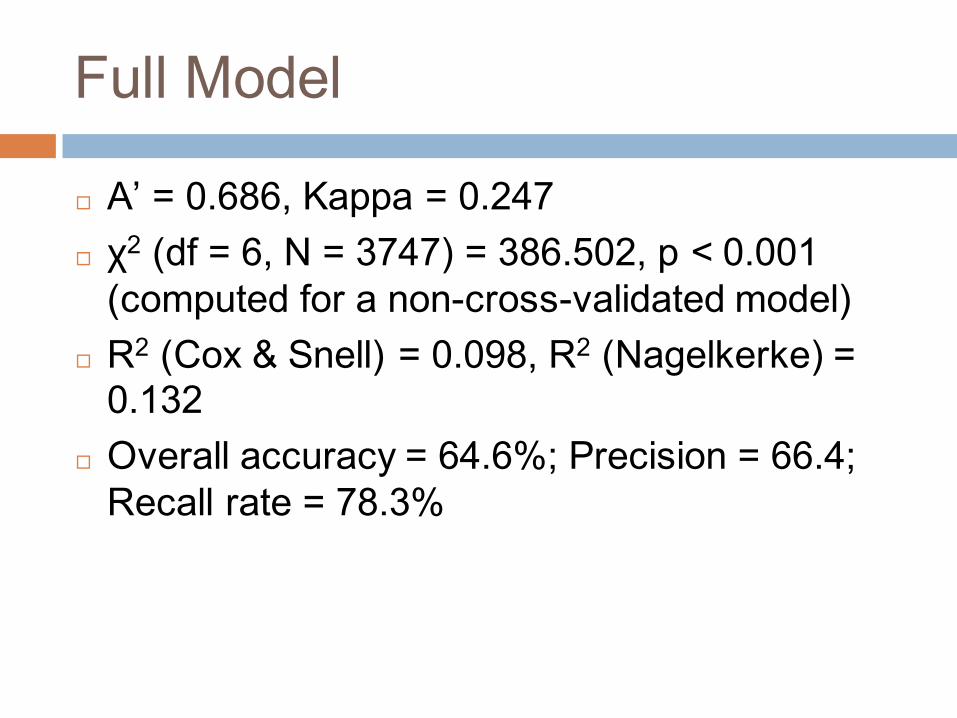
Full Model
◻ A’ = 0.686, Kappa = 0.247◻ χ2 (df = 6, N = 3747) = 386.502, p < 0.001
(computed for a non-cross-validated model) ◻ R2 (Cox & Snell) = 0.098, R2 (Nagelkerke) =
0.132◻ Overall accuracy = 64.6%; Precision = 66.4;
Recall rate = 78.3%
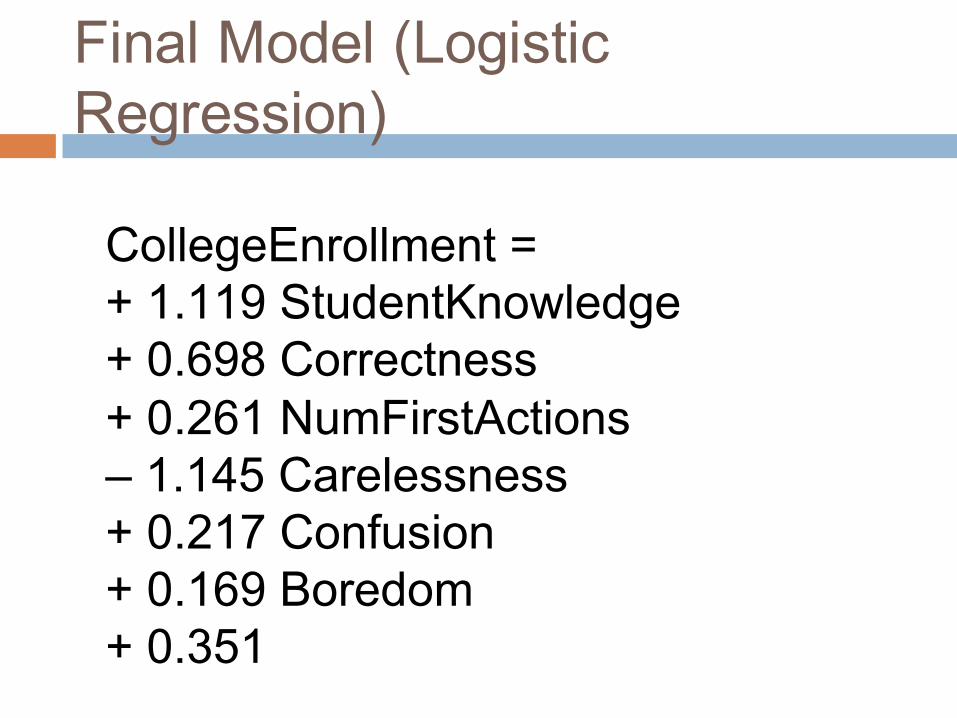
Final Model (Logistic Regression)
CollegeEnrollment = + 1.119 StudentKnowledge + 0.698 Correctness + 0.261 NumFirstActions – 1.145 Carelessness + 0.217 Confusion + 0.169 Boredom + 0.351

Flipped Signs
CollegeEnrollment = + 1.119 StudentKnowledge + 0.698 Correctness + 0.261 NumFirstActions – 1.145 Carelessness + 0.217 Confusion + 0.169 Boredom + 0.351

Implications
◻ Carelessness is bad… once we take knowledge into account
◻ Boredom is not a major problem… among knowledgeable students� When unsuccessful bored students are removed,
all that may remain are those who become bored because material may be too easy
� Does not mean boredom is a good thing!

Implications
◻ Gaming the System drops out of model� Probably because gaming substantially hurts
learning� But just because Gaming->Dropout is likely
mediated by learning, doesn’t mean gaming doesn’t matter!■ 0.34 σ effect

Implications
◻ Off-Task Behavior is not such a big deal� How much effort goes into stopping it?� Past meta-analyses find small significant effect on
short-term measures of learning■ But not when collaborative learning is occurring?
Implications
◻ In-the-moment interventions provided by software (or suggested by software to teachers) may have unexpectedly large effects, if they address boredom, confusion, carelessness, gaming the system

Next Lecture
◻ Less conservative classification algorithms