weed technology education/extension
TRANSCRIPT
Education/Extension
Using a Grower Survey to Assess the Benefits and Challenges ofGlyphosate-Resistant Cropping Systems for Weed Management in U.S. Corn,
Cotton, and Soybean
David R. Shaw, Wade A. Givens, Luke A. Farno, Patrick D. Gerard, David Jordan, William G. Johnson,Stephen C. Weller, Bryan G. Young, Robert G. Wilson, and Michael D. K. Owen*
Over 175 growers in each of six states (Illinois, Indiana, Iowa, Mississippi, Nebraska, and North Carolina) were surveyedby telephone to assess their perceptions of the benefits of utilizing the glyphosate-resistant (GR) crop trait in corn, cotton,and soybean. The survey was also used to determine the weed management challenges growers were facing after using thistrait for a minimum of 4 yr. This survey allowed the development of baseline information on how weed management andcrop production practices have changed since the introduction of the trait. It provided useful information on commonweed management issues that should be addressed through applied research and extension efforts. The survey also allowedan assessment of the perceived levels of concern among growers about glyphosate resistance in weeds and whether theybelieved they had experienced glyphosate resistance on their farms. Across the six states surveyed, producers reported 38,97, and 96% of their corn, cotton, and soybean hectarage planted in a GR cultivar. The most widely adopted GR croppingsystem was a GR soybean/non-GR crop rotation system; second most common was a GR soybean/GR corn crop rotationsystem. The non-GR crop component varied widely, with the most common crops being non-GR corn or rice. A largerange in farm size for the respondents was observed, with North Carolina having the smallest farms in all three crops. Alarge majority of corn and soybean growers reported using some type of crop rotation system, whereas very few cottongrowers rotated out of cotton. Overall, rotations were much more common in Midwestern states than in Southern states.This is important information as weed scientists assist growers in developing and using best management practices tominimize the development of glyphosate resistance.Nomenclature: Glyphosate; corn, Zea mays L.; cotton, Gossipium hirsutum L.; rice, Oryza sativa L.; soybean, Glycine max(L.) Merr.Key words: Crop diversity, crop rotation, glyphosate-resistant crops, resistance management, survey.
The choice of components in a cropping system has asubstantial impact on weed management. Diversified crop-ping systems that capitalize on benefits from varying seedingdate, crop life cycle, herbicide sites of action, herbicide timing,crop residue layer, and soil disturbance may effectively andeconomically manage weed populations, and reduce the weedseedbank (Ball 1992; Barberi and Lo Cascio 2001; Derksen etal. 2002; Hutcheon et al. 1998; Kegode et al. 1999; Unger etal. 1999). Conversely, remaining in the same cropping systemover a long period results in selection of weed species that arebest adapted to the specifics of that system. Historically,changes in agronomic production practices have also broughtabout substantial changes in the dominant weed species in acommunity, and thus the herbicides necessary to effectivelymanage them. For example, as producers adopt conservationtillage practices, there is typically a concomitant increase inthe herbicide regime required because tillage is no longer atool for weed management (Shaw and Rainero 1990; Wruckeand Arnold 1985). Indeed, some soybean producers were
initially reluctant to adopt conservation tillage because thesesystems resulted in an increase in perennial weeds, annualgrasses, and small-seeded broadleaf weeds; required moreherbicide applications; and eliminated the option of preplant-incorporated herbicides (Buhler et al. 1994; Swanton et al.1998).
A majority of herbicide-resistant (HR) weed populationshave evolved where monoculture use of a single herbicideactive ingredient or site of action has occurred (Gressel andSegel 1990). With a cropping system that emphasizescontinuous planting, minimal cultivation, and the frequentuse of similar herbicides, it is not surprising that resistance hasresulted in some common and problematic weed species(Mathews 1994). When declining efficacy of selectiveherbicides due to resistance occurs, changes in weedmanagement practices must be implemented to reduce yieldlosses. For example, triazine-resistant weed biotypes were amajor problem in corn fields in eastern Ontario, Canada(Stephenson et al. 1990). More than 75% of the cornhectarage was infested with two or more triazine-resistantweed species. Some of the dominant agronomic practicesincluded continuous corn; nearly all fields were treated withatrazine, and the use of POST herbicides was not common.However, in southwestern Ontario, where corn had beengrown the longest, triazine-resistant weeds were only a minorproblem. In that region, the dominant agronomic practicesincluded crop rotation; atrazine was only used on 60% of the
DOI: 10.1614/WT-08-042.1* Professor, Research Associate, Post-Doctoral Research Associate, and
Professor, Mississippi State University, Box 9652, Mississippi State, MS 39762;Professor, North Carolina State University, Raleigh, NC 27695; AssistantProfessor and Professor, Purdue University, West Lafayette, IN 47907; Professor,Southern Illinois University, Carbondale, IL 62901; Professor, University ofNebraska, Scotts Bluff, NE 69361; and Professor, Iowa State University, Ames,IA 50011. Corresponding author’s E-mail: [email protected]
Weed Technology 2009 23:134–149
134 N Weed Technology 23, January–March 2009
corn hectarage, and other POST herbicides were commonlyused. The introduction of alternative crops in a crop rotationprovides the opportunity to increase herbicide diversity, alterthe herbicide application rate, or implement other weedcontrol techniques. These tactics may be effective in reducingthe development of HR weeds (Mathews 1994).
With continued use of the same herbicide or site of action,weed species shifts are inevitable (Tingle and Chandler 2004).By removing the more competitive weed species, niches arecreated for the establishment of new species that were notcommon previously (Aldrich et al. 1997; Tuesca et al. 2001).Thus, the introduction and use of HR crops was viewed as avaluable new tool to control weeds that were adapted tocropping systems in use at the time of their introduction(Shaw 1995). The incredible popularity of HR crops could beattributed to their effectiveness in weed control, as well astheir simplicity and lower cost. When HR crops are grown,producers often apply a single herbicide at a higher rate ofactive ingredient and at multiple times during the seasonwithout concern about crop injury (Owen and Zelaya 2005;Reddy 2001; Shaner 2000). Although a number of HR cropshave been developed, the greatest impact on cropping systemshas come from the development of GR crops. Glyphosatecontrols a very broad spectrum of weeds that occur inagricultural, industrial, and domestic situations (Baylis 2000);thus, it is ideally suited as a broad-spectrum POST herbicidein GR crops (Dill 2005). Simplifying weed managementwithout a requirement for tillage as a part of the managementprogram has also allowed producers to implement moreconservation tillage practices. This increase has resulted in areduction in soil erosion and improved soil structure and,with fewer trips across the field, cost saving in fuel andequipment (Baylis 2000). With the expiration of theglyphosate patent in 2000, the proliferation of genericformulations of glyphosate has led to a dramatic decline inglyphosate pricing, making GR cropping systems even moreeconomical (Duke 2005).
With the overwhelming popularity of GR crops, a shift inweed populations to more glyphosate-tolerant species, or thedevelopment of GR biotypes, was inevitable. Though weedscientists initially debated how long it would take for glyphosateresistance to evolve in GR cropping systems, it was only 3 yrafter the adoption of GR soybean that resistance was identifiedin horseweed [Conyza canadensis (L.) Cronq.] (Owen andZelaya 2005; VanGessel 2001). To date, 14 weed species havebeen confirmed worldwide with GR biotypes (Heap 2008). Asthe planting of GR crops is over 90% in soybean and cotton,and is quickly approaching 50% for corn (Sankula 2006),additional resistant species and biotypes will certainly occur.However, producers will continue to use GR cropping systemseven in the presence of GR weeds because of the broadspectrum of other weeds controlled (Dill 2005). Thus, it isimperative to determine how GR cropping systems can besustained long-term, because much of the agricultural economyis built around the availability and effectiveness of this trait.
Survey information has been used by weed scientists for anumber of purposes, including determining perceptions ofproblem weeds (Gibson et al. 2005; Webster and MacDonald2001), understanding producer needs (Norsworthy 2003),
documenting weed shifts and herbicide resistance develop-ment (Bourgeois et al. 1997; Scott and VanGessel 2006), anddeveloping educational programs (Loux and Berry 1991).Because GR crops have been in use for over a decade, theopportunity now exists to document the changes that haveoccurred in weed management and herbicide use patterns,emerging problematic weed species, and grower perceptions ofweed problems in GR cropping systems. This informationwould be useful to academia and industry so that effectivestrategies and outreach programs can be developed andtailored that will improve the sustained utilization of GRtechnology. The overarching objectives of the surveyconducted were to determine practices used by producersprior to and after adopting a GR cropping system, anychanges in the producers’ weed pressure, tillage practices, andherbicide usage pattern in various GR cropping systems, aswell as producer awareness of GR weeds and precautions thatthey are taking to offset the risk of selecting for GR weeds.This paper will provide the introductory and foundationalinformation for the survey, including the entire surveyinstrument. Additional papers in this series will analyzespecific datasets from this extensive survey. The specificobjectives for this paper are to understand the diversity ofcropping systems associated with GR crops, and determine thecharacteristics of full-time farming operations that have usedGR technology.
Materials and Methods
A survey instrument was designed by the authors (Table 1),and a telephone survey using this instrument was conductedby Marketing Horizons Inc. between November 9, 2005, andJanuary 6, 2006. Producers from six states—Illinois, Indiana,Iowa, Mississippi, Nebraska, and North Carolina—werecontacted. These states were selected to represent the majorGR-crop growing regions of the United States, and for theirdiversity of environments, cropping systems, and weedpopulations. A list of all growers from these states who hadsigned an agreement to use the GR crop (Roundup ReadyTM)technology was obtained from Monsanto Agricultural Prod-ucts Company, and survey respondents were randomlyselected from this list. Respondents were initially askedwhether they were actively involved in farming; if they wereresponsible for the decisions concerning the seeds, traits, andherbicides purchased for their operation; if they planted aminimum of 101 hectares of corn, soybean, or cotton in2005; and if they planted the GR trait for a minimum of 3 yr.This minimum hectarage was established to ensure that thesurvey focused on full-time growers rather than those with asmall hectarage as a source of secondary income. Producerswere disqualified from the survey if they or anyone in theirhousehold worked for a farm chemical manufacturer,distributor, or retailer, or if they worked for a seed companyother than as a farmer/dealer.
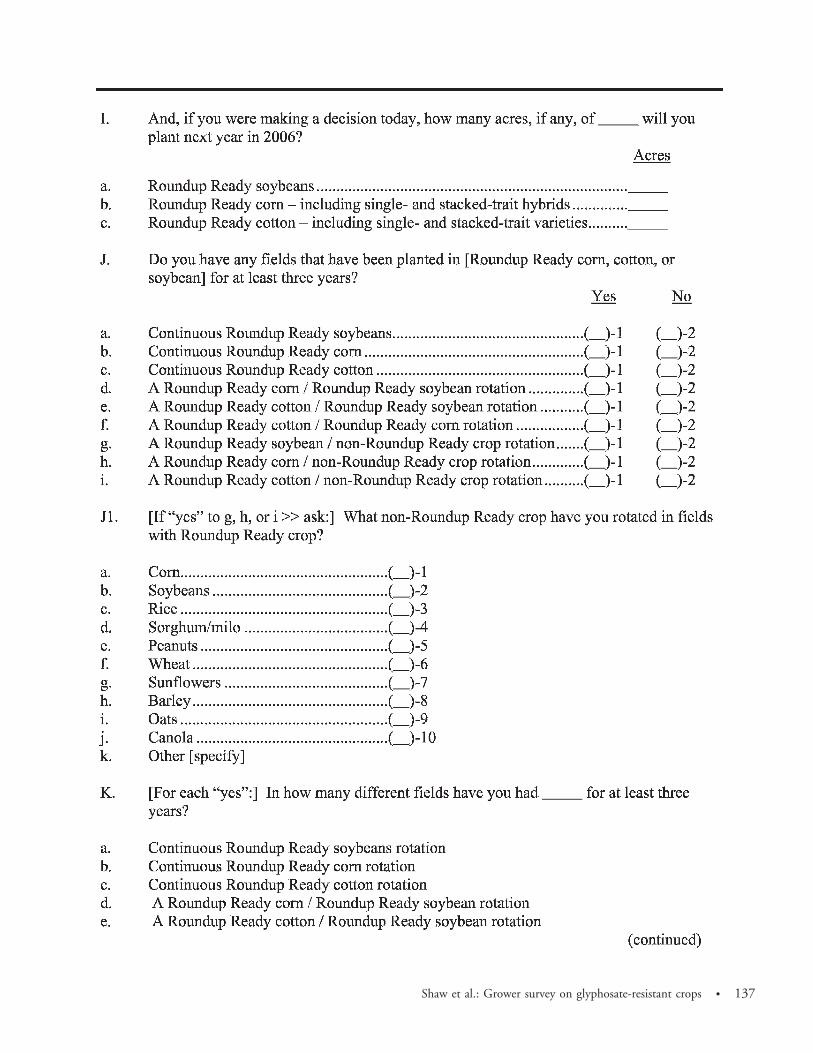
The survey was composed of four sections. Questions in thefirst section of the survey pertained to crops grown currentlyand in the past 6 yr. Information was collected on the numberof hectares that were planted in the past and would be plantedin the coming year, the number of years the GR trait had been
Shaw et al.: Grower survey on glyphosate-resistant crops N 135

planted, and the number of fields for which the GR trait hadbeen planted for at least the past 3 yr. This information wasused to place each producer into one of six groups, describedbelow.
The second section of the survey dealt with weed pressureand tillage practices on a specific, representative field.Producers were asked about the intensity of weed pressureand what weeds were problems for that field prior to the use
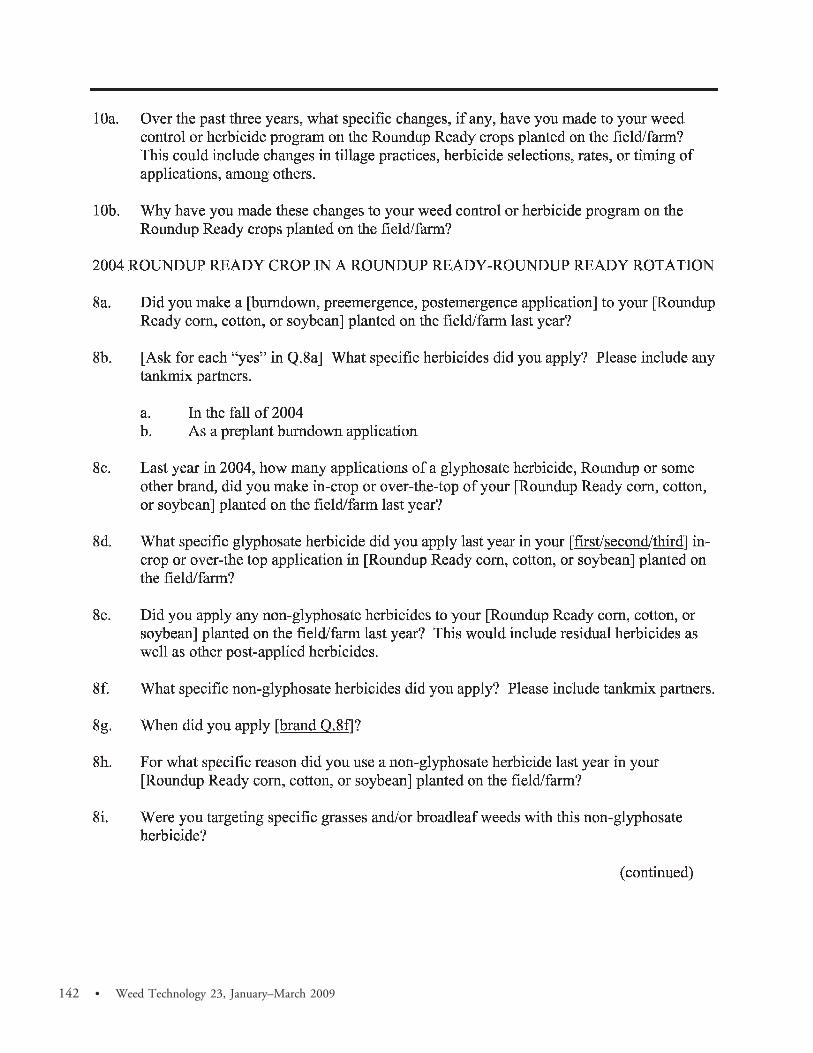
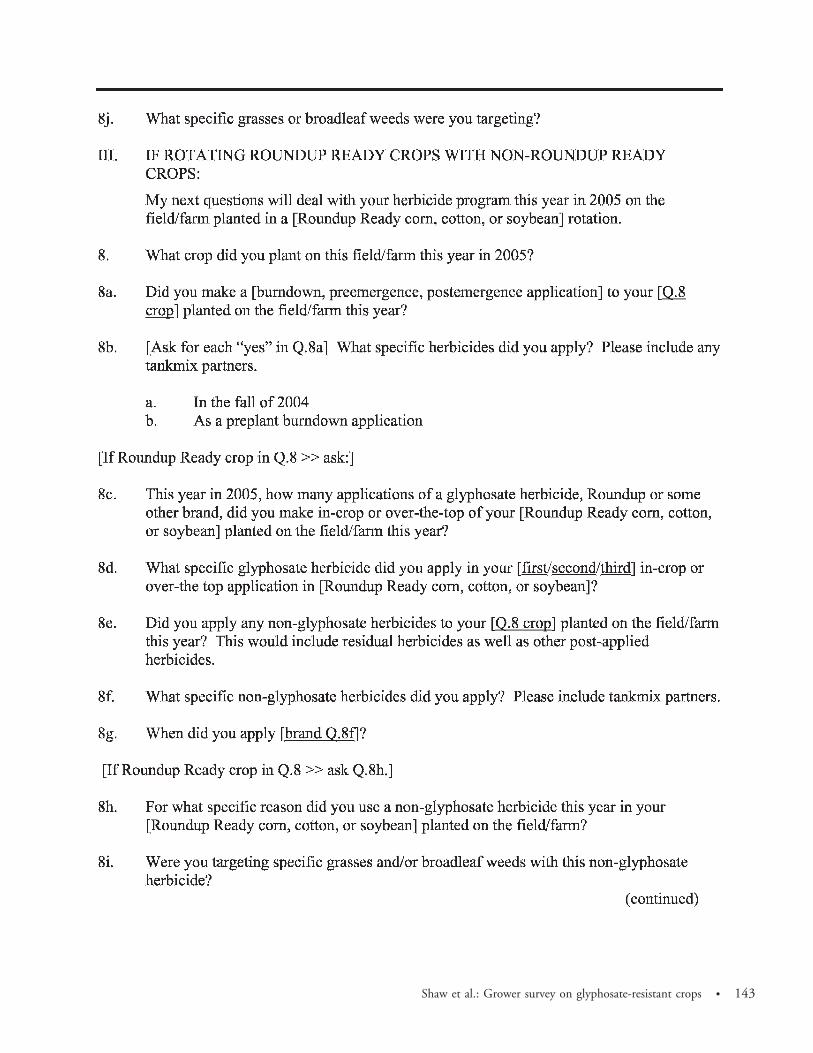
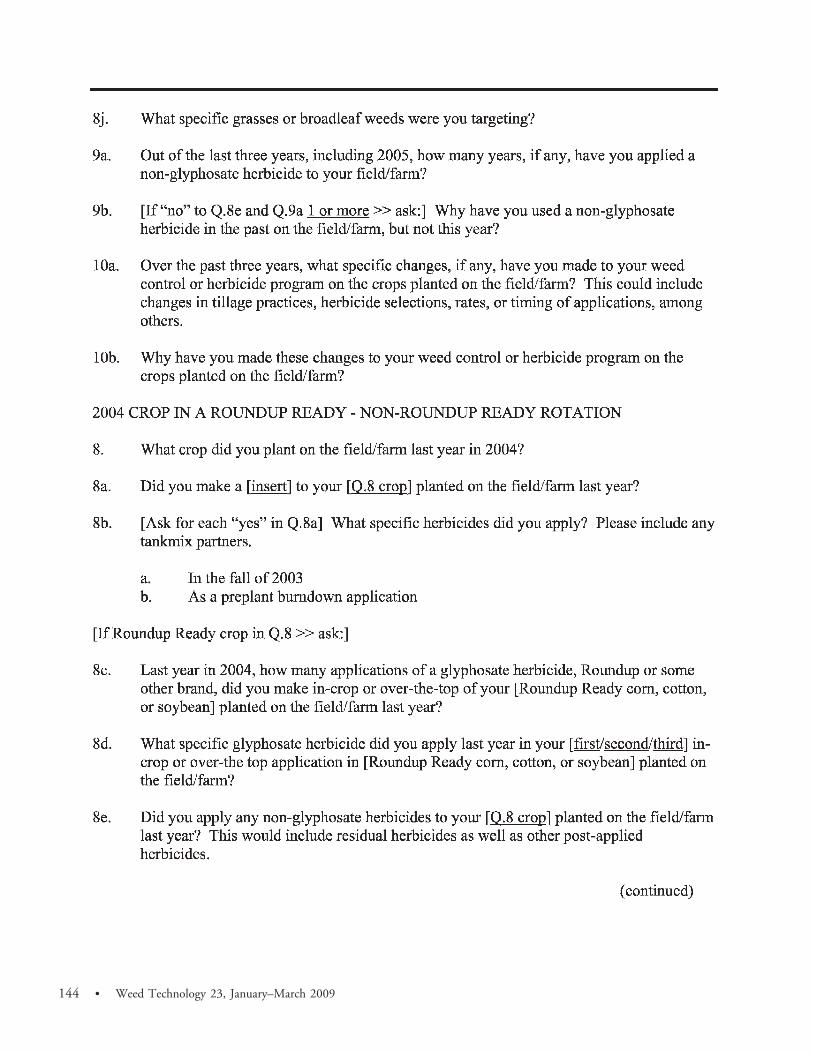
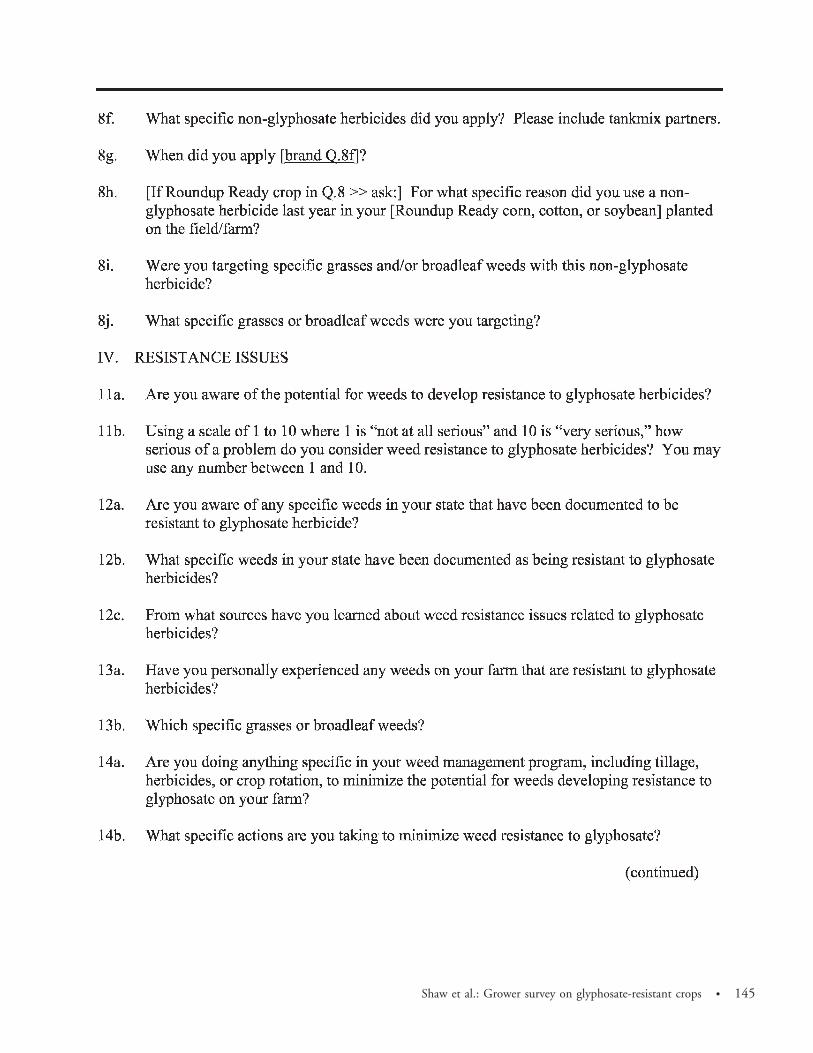
Table 1. Complete instrument for the telephone survey conducted in the winter of 2005/2006 to 356 determine grower perceptions of weed problems and herbicideresistance threat.
136 N Weed Technology 23, January–March 2009
Shaw et al.: Grower survey on glyphosate-resistant crops N 137

138 N Weed Technology 23, January–March 2009

Shaw et al.: Grower survey on glyphosate-resistant crops N 139
140 N Weed Technology 23, January–March 2009

of the GR trait, what the current weed pressure was in thatfield, and what specific weeds were currently problems. Dataon prior and current tillage practices were also collected, aswas the number of years that the field had been in the currenttillage practice. Producers were asked why they changed tillage
practices, if the change in tillage caused any weed shifts, and,if so, in what way.
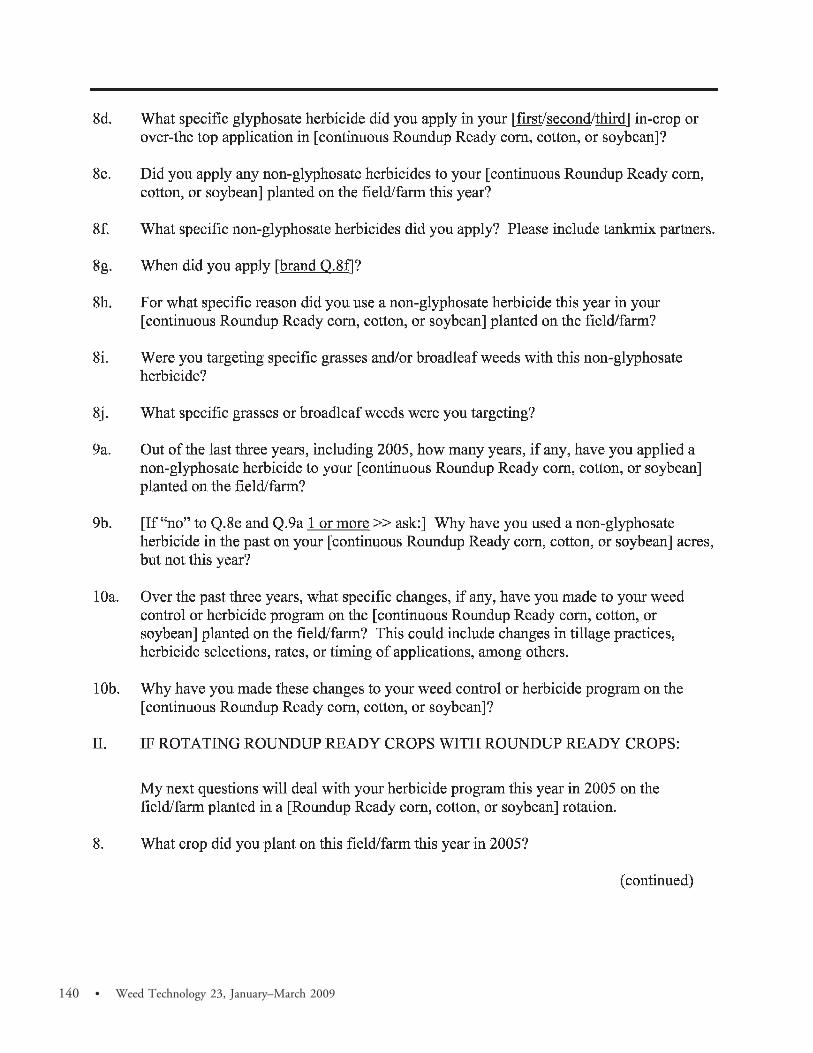
The third section pertained to herbicide use. Producerswere questioned on what herbicides they had used in the past,and what they were presently using. This usage included both
Shaw et al.: Grower survey on glyphosate-resistant crops N 141
142 N Weed Technology 23, January–March 2009
Shaw et al.: Grower survey on glyphosate-resistant crops N 143
144 N Weed Technology 23, January–March 2009
Shaw et al.: Grower survey on glyphosate-resistant crops N 145

glyphosate- and non–glyphosate-based herbicides. For non-glyphosate herbicides, the timing of application(s) wasdetermined, and the specific reason (or reasons) the herbicide(or herbicides) was or were used. The producers were alsoasked if they had made any changes to their herbicide programover the past 3 yr and, if so, why these changes were made.
The final section of the survey focused on GR weeds.Producers were asked about their awareness level of thepotential of GR weeds to develop, how serious theyconsidered this issue to be, if they were aware of any GRweeds in their state, and what those weeds were. They werealso asked where they learned about GR weed issues, if theyhad any personal experience with GR weeds, and, if so, whatthose weeds were. Finally, producers were asked about whatmeasures, if any, they were taking to minimize thedevelopment of GR weeds.
All survey data were entered into a spreadsheet and, ifnecessary, converted into numerical values for analysis. Datareported in this manuscript focus on the foundationinformation from the survey regarding the various croprotations reflected in the survey, and demographics on farm
size. In all cases, these values represent averages when therespondent did in fact have that cropping system; in otherwords, zero values were not entered into the averaging. A chi-square analysis was completed on the data reported inTables 2 through 4, and reported percentages are significant(P , 0.05) unless stated otherwise in the discussion of thedata from these three tables.
Results and Discussion
Producers participating in the survey managed 235,000,38,000, and 236,000 ha of corn, cotton, and soybean in 2005,respectively (data not shown). Of this, 38, 97, and 96%, oftheir corn, cotton, and soybean hectarage, respectively, wereplanted in a GR cultivar (data not shown). These highnumbers were not surprising, because the survey was based ongrowers who had signed contracts for the GR trait. Theirpercentages were higher than national averages for GR cultivarplantings, which were 26, 61, and 87% for corn, cotton, andsoybean, respectively, in 2005 (USDA ERS 2008a). Respon-
146 N Weed Technology 23, January–March 2009

dents were fairly evenly divided between the six states bydesign (Table 2); the survey continued contacting producersfrom the list until at least 175 responses had been obtainedfrom each state. The majority of farms participating in thesurvey had continuous GR soybean, GR soybean/GR corn, orGR soybean/non-GR crop as their cropping system. Withinthe GR soybean/non-GR crop category, the majority of therespondents had either rice or non-GR corn as the rotationwith GR soybean. Of particular note were the large differencesbetween states in continuous monocropping systems com-pared to rotations. The southern states (Mississippi and NorthCarolina) had a strong majority of the hectarage in continuousmonocropping systems, whereas the converse was true withthe Midwestern states (Illinois, Indiana, Iowa, and Nebraska).Given the propensity for herbicide-resistance selectionpressure to increase under a single monocontinuous croppingsystem, southern U.S. cropping systems may be especiallyvulnerable to development of resistance to glyphosate.
Producers using continuous GR soybean and cottoncropping systems had done so for an average of 4.8 and5.0 yr, respectively (data not shown). This again raisesconcern, because remaining in the same cropping andherbicide program for a number of years increases selectionpressure for resistance development. Producers using a GR
soybean/non-GR crop rotation system had done so for anaverage of 6.4 yr. The GR corn/non-GR crop system had thelowest average time in the system, at 2.9 yr. This would beexpected, because GR corn has been available a much shortertime, and adoption has been slower.
The number of hectares in a particular crop varied widely,depending on the crop and rotation scheme used (Table 3).Although our survey was limited to growers that had aminimum of 101 ha (in order to focus on full-time farmingoperations), production hectarage reported from our surveywas comparable to U.S. Department of Agriculture (USDA)data on farm size for each crop in the various regionsrepresented (USDA ERS 2008b). For example, USDA dataindicated an average farm size of 352 and 280 ha for corn andsoybean, respectively, in the Heartland farm resource region,which encompasses Illinois, Indiana, Iowa, and parts ofNebraska (states relevant to our study). USDA statistics forthe Southern Seaboard region (which includes NorthCarolina) are 270, 362, and 164 ha as average farm sizes forcorn, cotton, and soybean, respectively. In the MississippiPortal region (which includes most of the state of Mississippi)average farm sizes for these crops are 642, 760, and 380 ha,respectively.
Farmers growing corn had more hectarage in GR corn/non-GR crop than any other cropping system questioned(Table 3). Corn growers reported no cotton hectarage intheir farming operation, and much less continuous GRsoybean than the cropping systems that contained corn in therotation. Conversely, soybean growers in the survey reported
Table 2. Number of survey respondents with specific cropping systems from each of six states.
Crop rotation Total Iowa Illinois Indiana Mississippi North Carolina Nebraska
------------------------------------------------------------------------------------------------Number of respondents -----------------------------------------------------------------------------------------------
Continuous GR soybean 307 16 31 59 109 79 13Continuous GR corn 84 25 21 9 1 3 25Continuous GR cotton 97 —b — — 47 50 —GR corn/GR soybean 402 112 82 80 8 19 101GR cotton/GR soybean 38 — — — 13 25 —GR cotton/GR corn 11 — — — 9 2 —GR soybean/non-GR crop 495 89 105 106 39 69 87GR corn/non-GR crop 85 25 17 2 — 6 35GR cotton/non-GR crop 24 — — — 7 17 —Total respondentsa 1,195 205 201 202 178 207 202
a Growers were allowed to respond with up to two crop rotations used in their farm operations. Thus, the sum for the number of responses received for each croprotation is greater than the number of participating grower respondents (1,195).
b Rotation was not used in that state.
Table 3. Farm size of survey respondents, evaluated by primary crop and specificcropping system.
Crop rotation
Respondents’ primary crop
Corn Cotton Soybean
-------------------------ha (number of respondents) -----------------------
Continuous GR corn 367 (84) — 223 (67)Continuous GR cotton — a 345 (97) —Continuous GR soybean 153 (180) 151 (19) 227 (307)GR corn/GR soybean 257 (399) — 210 (397)GR cotton/GR soybean 94 (13) 208 (32) 188 (35)GR cotton/GR corn 195 (10) 327 (7) 874 (5)GR corn/non-GR crop 380 (85) — 238 (71)GR cotton/non-GR crop 105 (15) 292 (23) 172 (19)GR soybean/non-GR crop 238 (461) 231 (5) 213 (495)Average 237 (995) 296 (128) 211 (1,120)
a Growers with this particular crop did not have this cropping systemcombination.
Table 4. Farm size of survey respondents, evaluated by crop produced and state.
State Corn Cotton Soybean
-------------------------ha (number of respondents) -----------------------
Illinois 282 (198) NAa 215 (198)Indiana 264 (196) NA 246 (202)Iowa 232 (205) NA 178 (198)Mississippi 135 (58) 350 (59) 287 (154)Nebraska 292 (201) NA 196 (182)North Carolina 100 (137) 251 (69) 156 (186)Average 237 (995) 296 (128) 211 (1,120)
a NA, growers from this state did not have this crop.
Shaw et al.: Grower survey on glyphosate-resistant crops N 147

relatively similar hectarage across all of the cropping systems,when in fact they did have that cropping system in theiroperation. When looking at the number of respondents ineach cropping system category, the number of both corn andsoybean growers with either GR corn/GR soybean or a GRsoybean/non-GR crop rotation (presumably the majority ofwhich was non-GR corn) was much higher than the othercropping systems. Very few cotton growers reported that theywere using any type of a crop rotation system.
Farm-size data were also evaluated by state for each crop(Table 4). Overall, these data again were fairly comparable toUSDA farm-size data broken down by crop and region of theUnited States (USDA ERS 2008b). Another comparison thatcould be made would be USDA data on average farm size bystate (regardless of land use). For the six states in this study,farm sizes averaged 151, 101, 142, 106, 376, and 68 ha forIllinois, Indiana, Iowa, Mississippi, Nebraska, and NorthCarolina, respectively (USDA ERS 2008c). This latter data setincludes minor crops and farms with small hectarage in whichthe primary income is generated outside the farmingoperation. Our survey was focused on information generatedfrom full-time farming operations.
In our survey, corn growers in Mississippi and NorthCarolina had substantially smaller hectarage of corn comparedto the other states (Table 4). Conversely, soybean growers inMississippi had the largest farm sizes for that crop of any ofthe six states. As expected, growers in only Mississippi andNC reported cotton hectarage, with farms substantially largerin Mississippi than in North Carolina. Farm sizes for all threecrops were smallest in North Carolina. These data areconfirmed by USDA statistics as well. When looking at thenumber of respondents by crop from each state, Mississippihad far fewer corn growers than any other state surveyed,followed by North Carolina (Table 4). The others states werefairly equal in number, and almost all respondents from thosestates had corn hectarage in their farming operation (Tables 2and 4). This was similarly true with soybean. Thus, thepotential for crop rotations is fairly strong throughout all sixstates in this study. Crop rotation is one of the strongestopportunities for herbicide resistance management, becausethis usually opens up a number of new agronomic practicesand herbicide options. Conversely, our data also indicate aheavy reliance on GR traits in all of the crops reported in oursurvey, which negates many of the advantages that croprotation provides.
This survey generated a number of practical questionsregarding the best management practices for managing weedshifts toward species or biotypes more tolerant to glyphosate.As a follow-up to the survey (but not reported in this paper),long-term field studies have been initiated that will developpaired comparisons between grower practices vs. academicrecommendations for effective resistance management. Theacademic recommendations will focus on following herbicideresistance management practices, primarily the inclusion ofherbicides with other sites of action, particularly residualherbicides at planting.
Based on producer responses, five groupings of croppingsystems were developed for the long-term field studies that areplanned: continuous GR soybean, continuous GR cotton, GR
corn/GR soybean rotation, GR soybean/non-GR croprotation, and GR corn/non-GR crop rotation (Table 2). Fourstates—Illinois, Indiana, Mississippi, and North Carolina—had analyzable numbers of the continuous GR soybeansystem. Mississippi and North Carolina are the only states tocontain the continuous GR cotton system. The fourMidwestern states (Illinois, Indiana, Iowa, and Nebraska)had sufficient numbers of the GR corn/GR soybean rotationfor consideration, and all six states had sufficient numbers ofthe GR soybean/non-GR crop rotation for analysis (althoughdifferences occurred in the specific non-GR crop in therotation). Nebraska is the only state to have the GR corn/non-GR crop rotation in sufficient numbers in the survey foranalysis. Each state selected the top four groupings from thatstate as the basis for field selection for the long-term fieldstudies that are to follow. Six fields with a minimum of 16 hain size were selected per category, and the fields were dividedequally between grower practice and academic recommenda-tion. Results of these studies will be reported in future papers.
As can be noted from the survey questions in Table 1, alarge volume of data were generated from the survey. Resultsfrom various sections of the survey have been analyzedseparately, and are reported in the three papers immediatelyfollowing this manuscript, as well as in additional papers yetto be developed.
The survey information reported here provides a goodsense of the diversity of cropping systems utilized bygrowers that use the GR trait in their agronomic program.It also highlights the challenges and opportunities in using thistrait: challenge from the standpoint of the heavy reliance on asingle trait and herbicide for weed management; opportunityfrom the standpoint of the wide range of cropping systemsand thus varying weed management practices to minimize thechances of development of glyphosate resistance. Weedscientists must use this information to capitalize on theseopportunities and effectively provide information on bestmanagement practices for sustainable weed management,including the complete range of management strategies thatcan be brought to bear.
Acknowledgments
This research was funded by Monsanto AgriculturalProducts Company. Manuscript approved for publication asjournal article J-11396 of the Mississippi Agricultural andForestry Experiment Station, Mississippi State University.
Literature Cited
Aldrich, R. J. and R. J. Kremer. 1997. Principles in Weed Management. 2nd ed.Ames, IA: Iowa State University Press. Pages 35–63.
Ball, D. 1992. Weed seedbank response to tillage, herbicides, and crop rotationsequence. Weed Sci. 40:654–659.
Barberi, P. and B. Lo Cascio. 2001. Long-term tillage and crop rotation effects onweed seedbank size and composition. Weed Res. 41:325–340.
Baylis, A. D. 2000. Why glyphosate is a global herbicide: strengths, weaknessesand prospects. Pest. Manag. Sci. 56:299–308.
Bourgeois, L., I. N. Morrison, and D. Kelner. 1997. Field and producer survey ofACCase resistant wild oat in Manitoba. Can. J. Plant Sci. 77:709–714.
148 N Weed Technology 23, January–March 2009
Buhler, D. D., D. E. Stoltenberg, R. L. Becker, and J. L. Gunsolus. 1994.Perennial weed populations after 14 years of variable tillage and croppingpractices. Weed Sci. 42:205–209.
Derksen, D. A., R. L. Anderson, R. E. Blackshaw, and B. Maxwell. 2002. Weeddynamics and management strategies for cropping systems in the northernGreat Plains. Agron. J. 94:174–185.
Dill, G. M. 2005. Glyphosate-resistant crops: history, status, and future. Pest.Manag. Sci. 61:219–224.
Duke, S. O. 2005. Taking stock of herbicide-resistant crops ten years afterintroduction. Pest. Manag. Sci. 61:211–218.
Gibson, K. D., W. G. Johnson, and D. E. Hillger. 2005. Farmer perceptions ofproblematic corn and soybean weeds in Indiana. Weed Technol.19:1065–1070.
Gressel, J. and L. A. Segel. 1990. Modeling the effectiveness of herbicide rotationsand mixtures as strategies to delay or preclude resistance. Weed Technol.4:186–198.
Heap, I. 2008. International Survey of Herbicide Resistant Weeds. http://www.weedscience.org/in.asp. Accessed: August 20, 2008.
Hutcheon, J. A., C. D. Stride, and K. J. Wright. 1998. Manipulation of weedseedbanks in reduced tillage systems for sustainable weed control. AspectsAppl. Bio. 51:249–254.
Kegode, G. O., F. Forcella, and S. Clay. 1999. Influence of crop rotation, tillage,and management inputs on weed seed production. Weed Sci. 47:175–183.
Loux, M. M. and M. A. Berry. 1991. Use of a grower survey for estimating weedproblems. Weed Technol. 5:460–466.
Mathews, J. M. 1994. Management of herbicide resistant weed populations.Pages 317–335 in S. B. Powles and J.A.M. Holtum, eds. Herbicide Resistancein Plants. Boca Raton, FL: Lewis.
Norsworthy, J. K. 2003. Use of soybean surveys to determine weed managementneeds of South Carolina farmers. Weed Technol. 17:195–201.
Owen, M.D.K. and I. A. Zelaya. 2005. Herbicide-resistant crops and weedresistance to herbicides. Pest Manag. Sci. 61:301–311.
Reddy, K. N. 2001. Glyphosate-resistant soybean as a weed management tool:opportunities and challenges. Weed Bio. Manag. 1:193–202.
Sankula, S. 2006. Quantification of the Impacts on U.S. Agriculture ofBiotechnology-Derived Crops Planted in 2005. http://www.ncfap.org/whatwedo/pdf/2005biotechimpacts-finalversion.pdf. Accessed: September 23, 2007.
Scott, B. A. and M. J. VanGessel. 2006. Delaware soybean grower survey ofglyphosate-resistant horseweed (Conyza canadensis). Weed Technol.21:270–274.
Shaner, D. L. 2000. The impact of glyphosate-tolerant crops on the use of otherherbicides and on resistance management. Pest Manag. Sci. 56:320–326.
Shaw, D. R. 1995. Herbicide-resistant crops and implications for herbicide-resistant weeds. Proc. South. Weed Sci. Soc. 48:38.
Shaw, D. R. and H. P. Rainero. 1990. Weed control in soybean under differentcropping and tillage systems. J. Prod. Agric. 3:453–460.
Stephenson, G. R., M. D. Dykstra, R. D. McLaren, and A. S. Hamill. 1990.Agronomic practices influencing triazine-resistant weed distribution inOntario. Weed Technol. 4:199–207.
Swanton, C. J., T. J. Vyn, K. Chandler, and A. Shrestha. 1998. Weedmanagement strategies for no-till soybeans (Glycine max) grown on clay soils.Weed Technol. 12:660–669.
Tingle, C. H. and J. M. Chandler. 2004. The effect of herbicides and croprotation on weed control in glyphosate-resistant crops. Weed Technol.18:940–946.
Tuesca, D., E. Puricelli, and J. C. Papa. 2001. A long-term study of weed florashifts in different tillage systems. Weed Res. 41:369–382.
Unger, P. W., S. D. Miller, and O. R. Jones. 1999. Weed seeds in long-termdryland tillage and cropping system plots. Weed Res. 39:213–223.
U.S. Department of Agriculture Economic Research Service [USDA ERS].2008a. Adoption of Genetically Engineered Crops in the U.S. http://www.ers.usda.gov/Data/BiotechCrops/. Accessed: August 16, 2008.
U.S. Department of Agriculture Economic Research Service [USDA ERS].2008b. Farm Acres by Type and Region. http://www.ers.usda.gov/Data/.Accessed: August 16, 2008.
U.S. Department of Agriculture Economic Research Service [USDA ERS]. 2008c.State Fact Aheets. http://www.ers.usda.gov/statefacts/. Accessed: August 16, 2008.
VanGessel, M. J. 2001. Glyphosate resistant horseweed from Delaware. WeedSci. 49:703–705.
Webster, T. M. and G. E. MacDonald. 2001. A survey of weeds in various cropsin Georgia. Weed Technol. 15:771–790.
Wrucke, M. A. and W. E. Arnold. 1985. Weed species distribution as influencedby tillage and herbicides. Weed Sci. 33:853–856.
Received March 5, 2008, and approved August 22, 2008.
Shaw et al.: Grower survey on glyphosate-resistant crops N 149