web’s weekly roundup and long strangles into economic data events may 9, 2015 presenter: web...
TRANSCRIPT

Web’s Weekly RoundupAnd Long Strangles into Economic Data Events
May 9, 2015
Presenter: Web Begole
Day trading, short term trading, options trading, and futures trading are extremely risky undertakings. They generally are not appropriate for someone with limited capital, little or no trading experience, and/ or a low tolerance for risk. Never execute a trade unless you can afford to and are prepared to lose your entire investment. All trading operations involve serious risks, and you can lose your entire investment. No trades are recommendations or advice and we cannot be sued for losses of capital. All trades are for educational purposes only. Contact your broker or RIA for execution, margin, and other capital requirements. Everyone watching presentation adheres to ALL disclaimers on www.optionhacker.com and www.keeneonthemarket.com
RISK DISCLAIMER
Web’s Weekly Roundup
• Analysis of /ES (S&P 500 Futures) and forecast
• Analysis of /DX (US Dollar Futures) and forecast
• Analysis of /CL (Crude Oil Futures) and forecast
• Analysis of /6E (Euro Futures) and forecast
• Long Strangles Into Economic Data Events
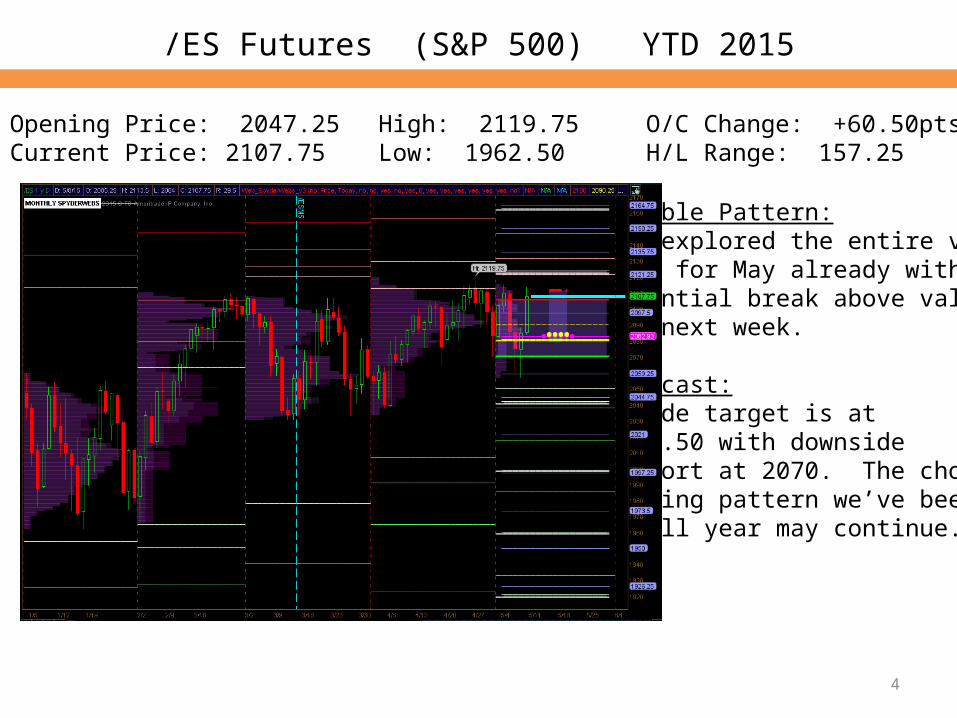
/ES Futures (S&P 500) YTD 2015
4
Opening Price: 2047.25Current Price: 2107.75
High: 2119.75Low: 1962.50
O/C Change: +60.50ptsH/L Range: 157.25
Notable Pattern:Has explored the entire value area for May already with a potential break above value for next week.
Forecast:Upside target is at 2120.50 with downside support at 2070. The choppy topping pattern we’ve been in all year may continue.
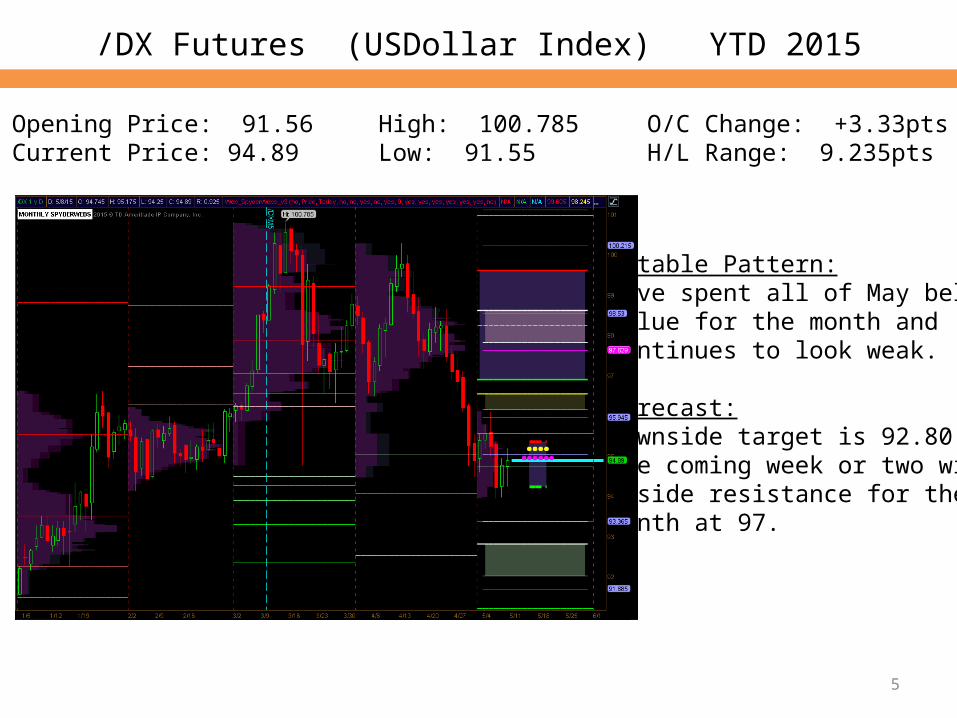
/DX Futures (USDollar Index) YTD 2015
5
Opening Price: 91.56Current Price: 94.89
High: 100.785Low: 91.55
O/C Change: +3.33ptsH/L Range: 9.235pts
Notable Pattern:Have spent all of May below value for the month and continues to look weak.
Forecast:Downside target is 92.80 in the coming week or two with upside resistance for the month at 97.
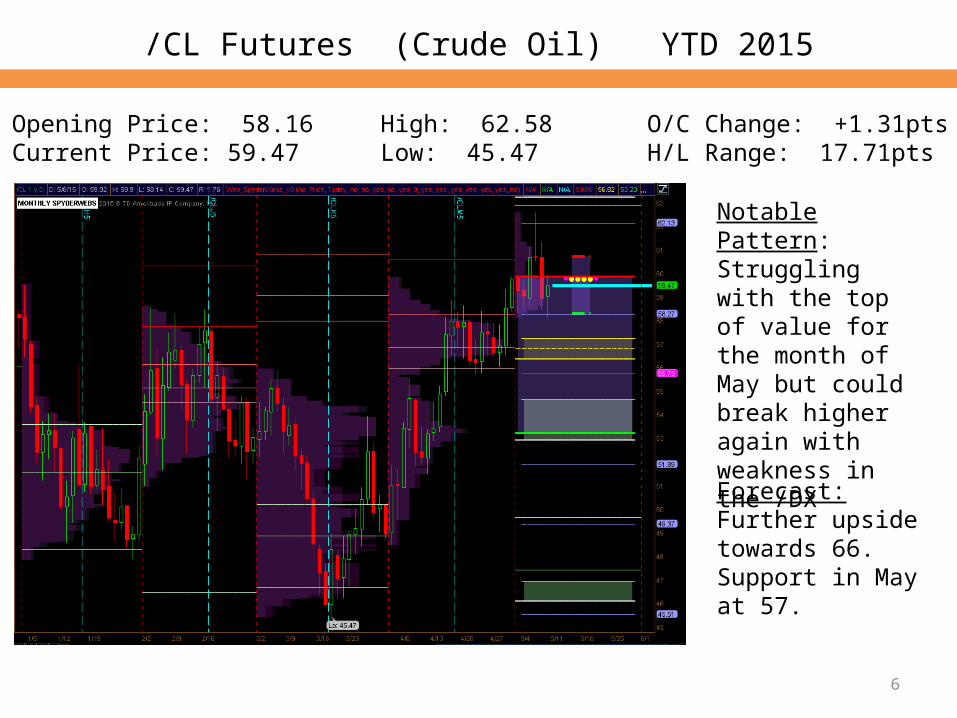
/CL Futures (Crude Oil) YTD 2015
6
Opening Price: 58.16Current Price: 59.47
High: 62.58Low: 45.47
O/C Change: +1.31ptsH/L Range: 17.71pts
Notable Pattern:Struggling with the top of value for the month of May but could break higher again with weakness in the /DX
Forecast:Further upside towards 66. Support in May at 57.
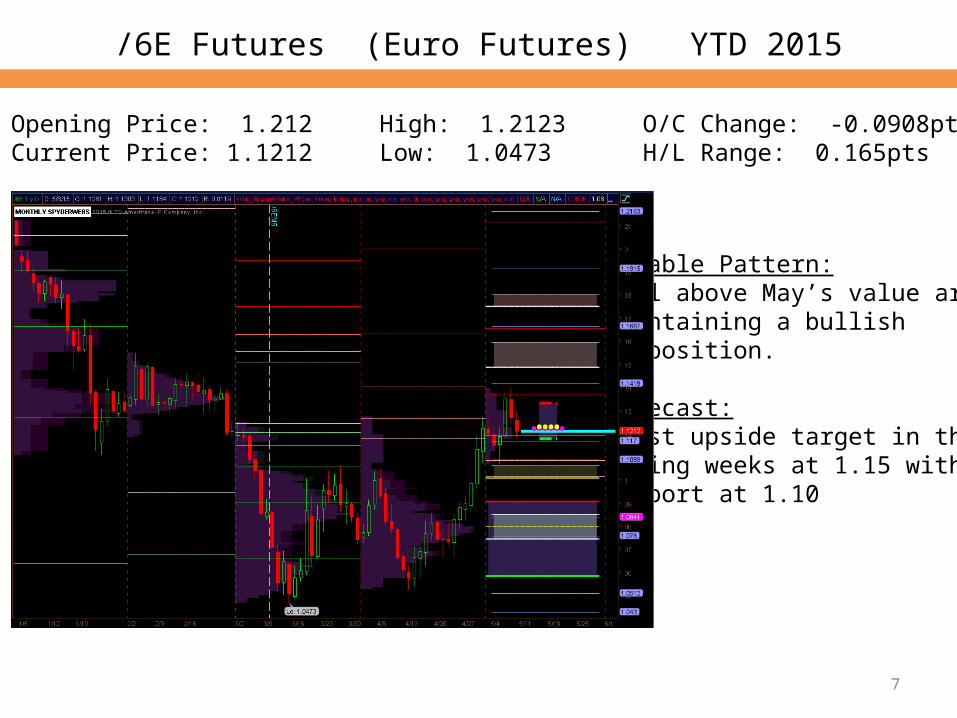
/6E Futures (Euro Futures) YTD 2015
7
Opening Price: 1.212Current Price: 1.1212
High: 1.2123Low: 1.0473
O/C Change: -0.0908ptsH/L Range: 0.165pts
Notable Pattern:Well above May’s value area maintaining a bullish disposition.
Forecast:First upside target in the coming weeks at 1.15 with support at 1.10
Looking Ahead
• Overall:
• The overall market was rather quiet this week even after the Non-Farm payroll numbers
which caused an early boost in values but seemingly stifled by many stating the market is
overvalued.
• The Dollar index is finding significant weakness as large money speculators have reduced
their long USD plays significantly in recent weeks.
• I believe Crude remains in a bullish trend however I found it interesting that the response
to the first notable draw-down in inventory numbers since early January had little
immediate effect. It did however take us to new highs on the year.
Long Strangles Into Economic Data Events
• The Virtues and Risks of Long Strangles
• The mechanics of how a long strangle works (and how it may not)
• Economic Data Events that provide opportunities
• A few examples
• Finding the best stocks to use as vehicles
9
Long Strangles Into Economic Data Events
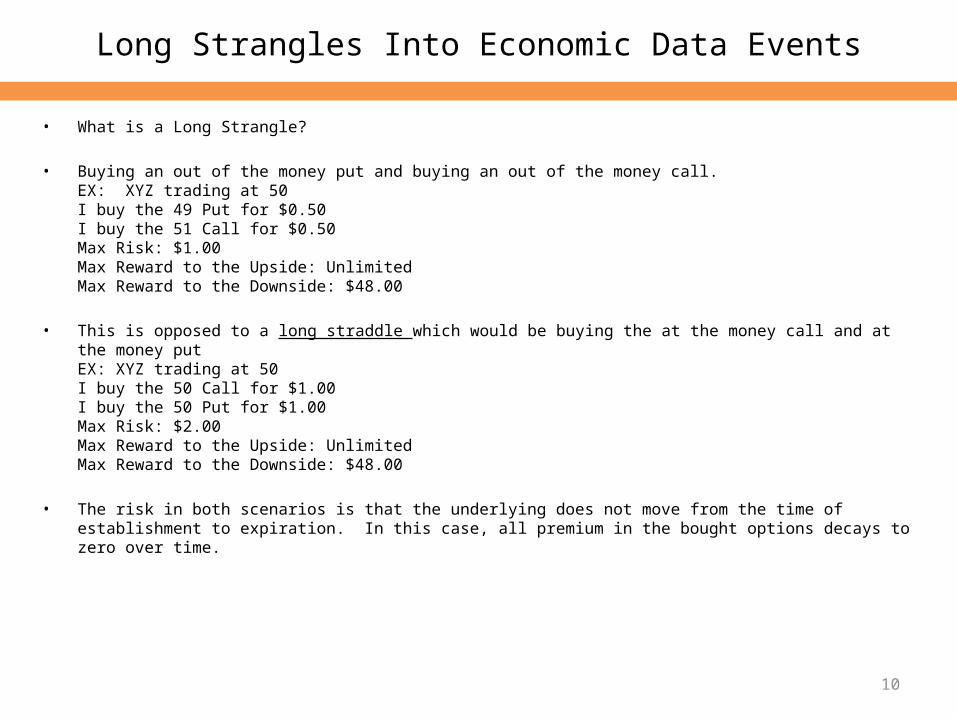
• What is a Long Strangle?
• Buying an out of the money put and buying an out of the money call.EX: XYZ trading at 50I buy the 49 Put for $0.50I buy the 51 Call for $0.50Max Risk: $1.00Max Reward to the Upside: UnlimitedMax Reward to the Downside: $48.00
• This is opposed to a long straddle which would be buying the at the money call and at the money putEX: XYZ trading at 50I buy the 50 Call for $1.00I buy the 50 Put for $1.00Max Risk: $2.00Max Reward to the Upside: UnlimitedMax Reward to the Downside: $48.00
• The risk in both scenarios is that the underlying does not move from the time of establishment to expiration. In this case, all premium in the bought options decays to zero over time.
10
Long Strangles Into Economic Data Events
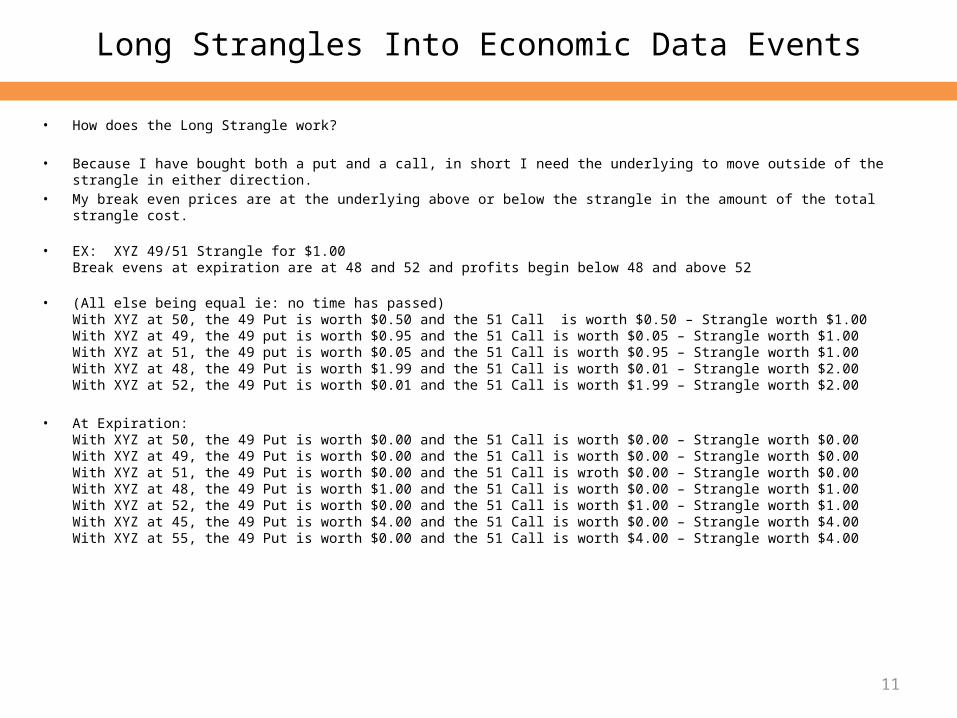
• How does the Long Strangle work?
• Because I have bought both a put and a call, in short I need the underlying to move outside of the strangle in either direction.• My break even prices are at the underlying above or below the strangle in the amount of the total strangle cost.
• EX: XYZ 49/51 Strangle for $1.00Break evens at expiration are at 48 and 52 and profits begin below 48 and above 52
• (All else being equal ie: no time has passed)With XYZ at 50, the 49 Put is worth $0.50 and the 51 Call is worth $0.50 – Strangle worth $1.00With XYZ at 49, the 49 put is worth $0.95 and the 51 Call is worth $0.05 – Strangle worth $1.00With XYZ at 51, the 49 put is worth $0.05 and the 51 Call is worth $0.95 – Strangle worth $1.00With XYZ at 48, the 49 Put is worth $1.99 and the 51 Call is worth $0.01 – Strangle worth $2.00With XYZ at 52, the 49 Put is worth $0.01 and the 51 Call is worth $1.99 – Strangle worth $2.00
• At Expiration:With XYZ at 50, the 49 Put is worth $0.00 and the 51 Call is worth $0.00 – Strangle worth $0.00With XYZ at 49, the 49 Put is worth $0.00 and the 51 Call is worth $0.00 – Strangle worth $0.00With XYZ at 51, the 49 Put is worth $0.00 and the 51 Call is wroth $0.00 – Strangle worth $0.00With XYZ at 48, the 49 Put is worth $1.00 and the 51 Call is worth $0.00 – Strangle worth $1.00With XYZ at 52, the 49 Put is worth $0.00 and the 51 Call is worth $1.00 – Strangle worth $1.00With XYZ at 45, the 49 Put is worth $4.00 and the 51 Call is worth $0.00 – Strangle worth $4.00With XYZ at 55, the 49 Put is worth $0.00 and the 51 Call is worth $4.00 – Strangle worth $4.00
11

Long Strangles Into Economic Data Events
• Economic Data Events that Provide Opportunities
• Much like Earnings events for stocks, economic data events are relatively binary events (either the news will be good or bad) but unlike earnings, economic data events have a third option: The “Meh, nothing new” option.The thing is, the third option takes a bit to “digest” in the market leading to some volatility in the moment while the market decides if this is fundamentally new or not.
• These events happen on different schedules from weekly to bi-weekly to monthly to quarterly etc.– Non-Farm Payrolls– FOMC Meeting Announcements– GDP Numbers– Trade Imbalances– EIA Crude Inventory Numbers– Natural Gas Inventory Numbers– Just to name some of them…..
• What we’ll focus on today is specifically the EIA Crude Inventory Numbers. These numbers come out every week and quantify the build or draw-down in Crude Oil inventories internationally. A build is generally a bearish sign for Crude Oil pricesA drawdown is generally a bullish sign for Crude Oil prices
• But just like with earnings events, there are analysis expectations on what the inventory numbers are likely to be. As other information is available: The current or updates to overall Crude Oil demand, the barrel/day outflows from other countries, the Baker Hughes Rig Count number on Fridays, other news events or announcements surrounding OPEC or even wars going on that may raise demand on Crude oil.
12

Long Strangles Into Economic Data Events
• The EIA Inventory announcement is released at 10:30am Eastern every Wednesday morning [it may shift to Thursday on weeks in which Monday was a market holiday]A lesser known “preview” event The API Inventory Numbers come out on Tuesdays at 4:35pm Eastern [it may shift to Wednesday as above]EIA – International numbersAPI – American numbers
• Some examples of how this can be played:
Tuesday April 21 end of dayNOV trades at 53.13The Weekly 4/24 52.5/53.5 Strangle costs $0.83At the end of the day Thursday April 23, the strangle is worth $1.99
Tuesday April 28 end of dayOIH trades at 37.59The Weekly 5/1 37/38 Strangle costs $0.48At the end of the day Thursday April 30th, the strangle is worth $1.08
Tuesday May 5 end of dayNOV trades at 55.40The Weekly 5/8 55/56 Strangle costs $1.01At the end of the day Thursday May 7th, the strangle is worth $2.52
13
Long Strangles Into Economic Data Events
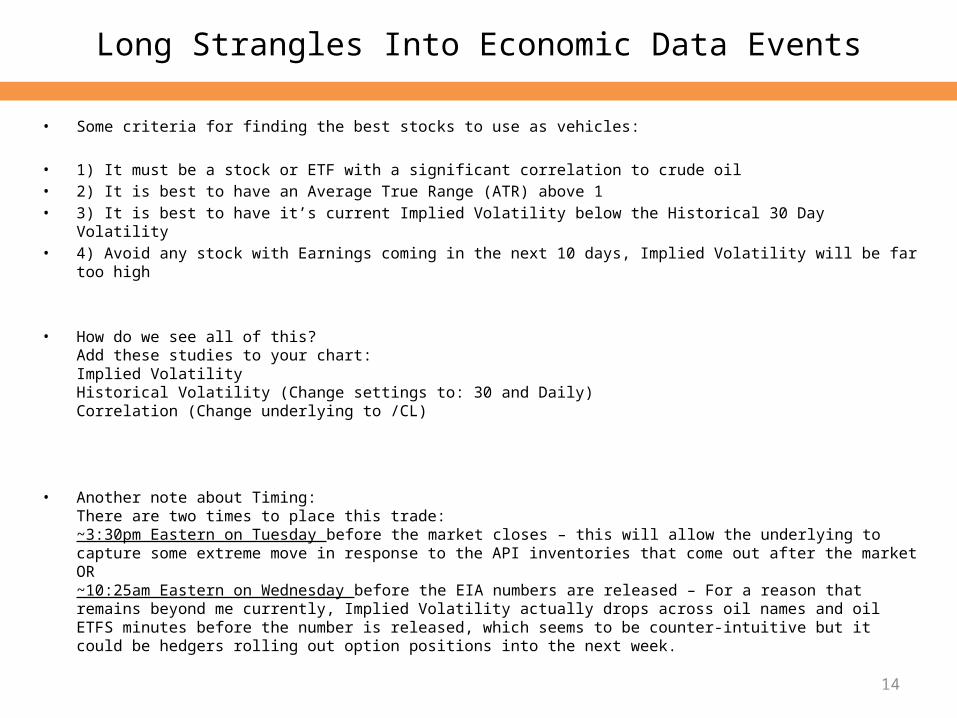
• Some criteria for finding the best stocks to use as vehicles:
• 1) It must be a stock or ETF with a significant correlation to crude oil• 2) It is best to have an Average True Range (ATR) above 1• 3) It is best to have it’s current Implied Volatility below the Historical 30 Day Volatility• 4) Avoid any stock with Earnings coming in the next 10 days, Implied Volatility will be far too high
• How do we see all of this? Add these studies to your chart:Implied VolatilityHistorical Volatility (Change settings to: 30 and Daily)Correlation (Change underlying to /CL)
• Another note about Timing:There are two times to place this trade:~3:30pm Eastern on Tuesday before the market closes – this will allow the underlying to capture some extreme move in response to the API inventories that come out after the marketOR~10:25am Eastern on Wednesday before the EIA numbers are released – For a reason that remains beyond me currently, Implied Volatility actually drops across oil names and oil ETFS minutes before the number is released, which seems to be counter-intuitive but it could be hedgers rolling out option positions into the next week.
14
Long Strangles Into Economic Data Events
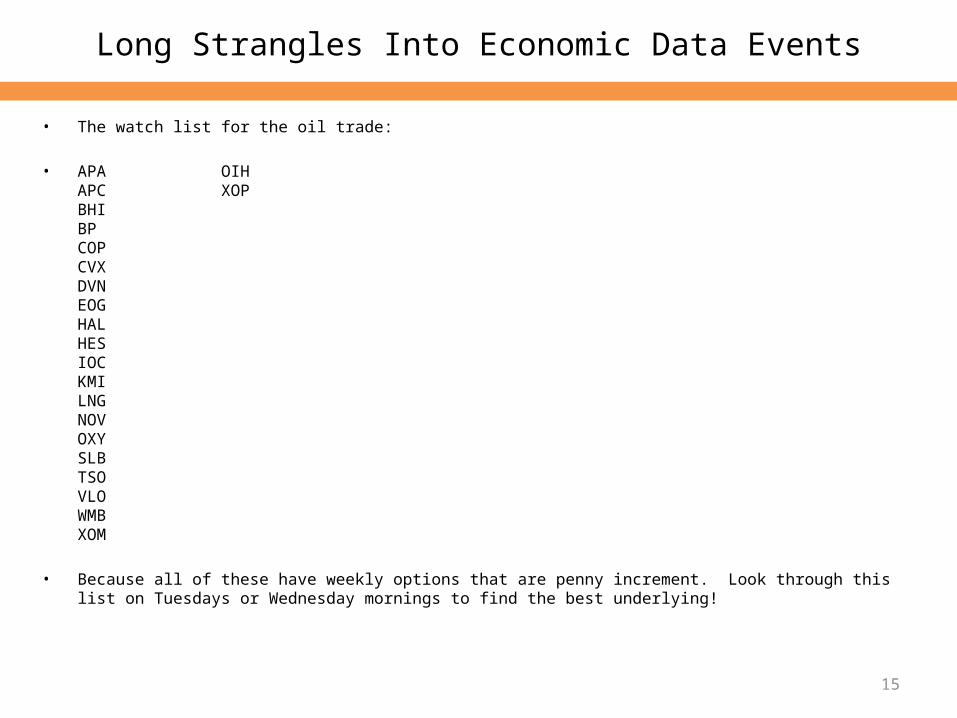
• The watch list for the oil trade:
• APA OIHAPC XOPBHIBPCOPCVXDVNEOGHALHESIOCKMILNGNOVOXYSLBTSOVLOWMBXOM
• Because all of these have weekly options that are penny increment. Look through this list on Tuesdays or Wednesday mornings to find the best underlying!
15
Long Strangles Into Economic Data Events
• Some other notes:
These trades will move heavily over the course of the week. When one side of the strangle is worth enough to count the whole strangle as a double I like to take half of those off and leave the rest for more profits. This reduces my initial investment to zero and allows further movement for more profits. Also keeping on the opposite side of the strangle allows me to have some further profits should an underlying reverse heavily to the other side.
16

Q & A With Web