assessment.tamu.eduassessment.tamu.edu/.../fall_2012_graduating_honors_… · web viewthey make...
TRANSCRIPT

Fall 2012 Graduating Honors Students
Last Modified: 01/31/2013
Filter By: Report Subgroup
1. When do you expect to graduate from Texas A&M?
# Answer Response %
1 December 2012 153 100%
2 May 2013 0 0%
3 August 2013 0 0%
4 December 2013 0 0%
5 May 2014 0 0%
6 Not sure at this time 0 0%
Total 153 100%
Statistic Value
Min Value 1
Max Value 1
Mean 1.00
Variance 0.00
Standard Deviation 0.00
Total Responses 153
2. What degree will you receive?
# Answer Response %
1 BA 34 22%
2 BS 103 67%
3 B.B.A. 15 10%
4 B.Ed 1 1%
5 B.L.A. 0 0%
Total 153 100%

Statistic Value
Min Value 1
Max Value 4
Mean 1.89
Variance 0.34
Standard Deviation 0.58
Total Responses 153
3. From what college are you graduating?
# Answer Response %
1 AG 14 9%
2 AR 7 5%
3 BA 16 10%
4 ED 7 5%
5 EN 41 27%
6 GE 2 1%
7 LA 42 27%
8 SC 12 8%
9 VM 10 7%
10 GV 2 1%
Total 153 100%
Statistic Value
Min Value 1
Max Value 10
Mean 5.37
Variance 5.43
Standard Deviation 2.33
Total Responses 153

4. Did you
# Answer Response %
1enter TAMU as a freshman?
133 87%
2transfer from another school?
20 13%
Total 153 100%
Statistic Value
Min Value 1
Max Value 2
Mean 1.13
Variance 0.11
Standard Deviation 0.34
Total Responses 153
5. Did you change major while at TAMU?
# Answer Response %
1 Yes 54 35%
2 No 99 65%
Total 153 100%
Statistic Value
Min Value 1
Max Value 2
Mean 1.65
Variance 0.23
Standard Deviation 0.48
Total Responses 153

6. Did you take Honors courses or participate in the Honors community?
# Answer Response %
1 Yes 153 100%
2 No 0 0%
Total 153 100%
Statistic Value
Min Value 1
Max Value 1
Mean 1.00
Variance 0.00
Standard Deviation 0.00
Total Responses 153
7. How many hours of Honors courses did you take while at Texas A&M?
# Answer Response %
1 3 or less 61 40%
2 4 to 8 36 24%
3 9 or more 56 37%
Total 153 100%
Statistic Value
Min Value 1
Max Value 3
Mean 1.97
Variance 0.77
Standard Deviation 0.88
Total Responses 153

8. Are you graduating with an Honors transcript distinction?
# Answer Response %
1 Yes 45 29%
2 No 108 71%
Total 153 100%
Statistic Value
Min Value 1
Max Value 2
Mean 1.71
Variance 0.21
Standard Deviation 0.46
Total Responses 153
9. Which of the following describe your choice to take honors courses? (Please select all that apply)
# Answer Response %
1 Wanted a challenge 77 50%
2Wanted to use Honors Early Registration
106 69%
3 Liked the professor 45 29%
4 Liked the grade distribution 32 21%
5
Wanted to complete requirements for a transcript distinction
54 35%
6 Other (please specify) 22 14%

Other (please specify)
liked the class
Smaller class size
smaller class size
Don't think i took the classes but I got into Gamma Sigma Delta Honor society.
Less stupid people
Smaller classes
to get into grad school
Wanted the more in-depth knowledge provided in honors lectures
suggested by advisor
My advisor told me to
accident
Knowledge
Sue Geller told me to at my NSC
recommended by a professor
Scholarship
worked with schedule
Wanted to learn more
Wanted a better education! (Why isn't this an option on this?)
I had a scholarship for Honors, and lived in the honors dorm as a freshman, but never took a course.
was curious
Wanted to graduate with honors
Accidental
Statistic Value
Min Value 1
Max Value 6
Total Responses 153

10. When did you start taking honors courses?
# Answer Response %
1 1st semester Freshman 79 52%
2 2nd semester Freshman 31 20%
3 1st semester Sophomore 13 8%
4 2nd semester Sophomore 8 5%
5 1st semester Junior 6 4%
6 2nd semester Junior 7 5%
7 1st semester Senior 1 1%
8 2nd semester Senior 2 1%
9 Other (please specify) 6 4%
Total 153 100%
Other (please specify)
?
was planning on taking organic chemistry honors but the professor took a sabbatical and so I did not end up taking it honors
none
Never took a course, lived in the dorm as a freshman.
Statistic Value
Min Value 1
Max Value 9
Mean 2.36
Variance 4.35
Standard Deviation 2.09
Total Responses 153

11. Did you participate in any of the following leadership organizations/experiences? (Please select all that apply):
# Answer Response %
1Honors Student Council
2 1%
2
Honors Invitational Peer (HIP) Leaders
2 1%
3 University Scholars 5 4%
4 Student Government 8 6%
5 MSC Wiley Lecture Series 4 3%
6
MSC Jordan L.T. Institute for International Awareness
5 4%
7Public Policy Internship Program
3 2%
8 None 114 80%
Statistic Value
Min Value 1
Max Value 8
Total Responses 142

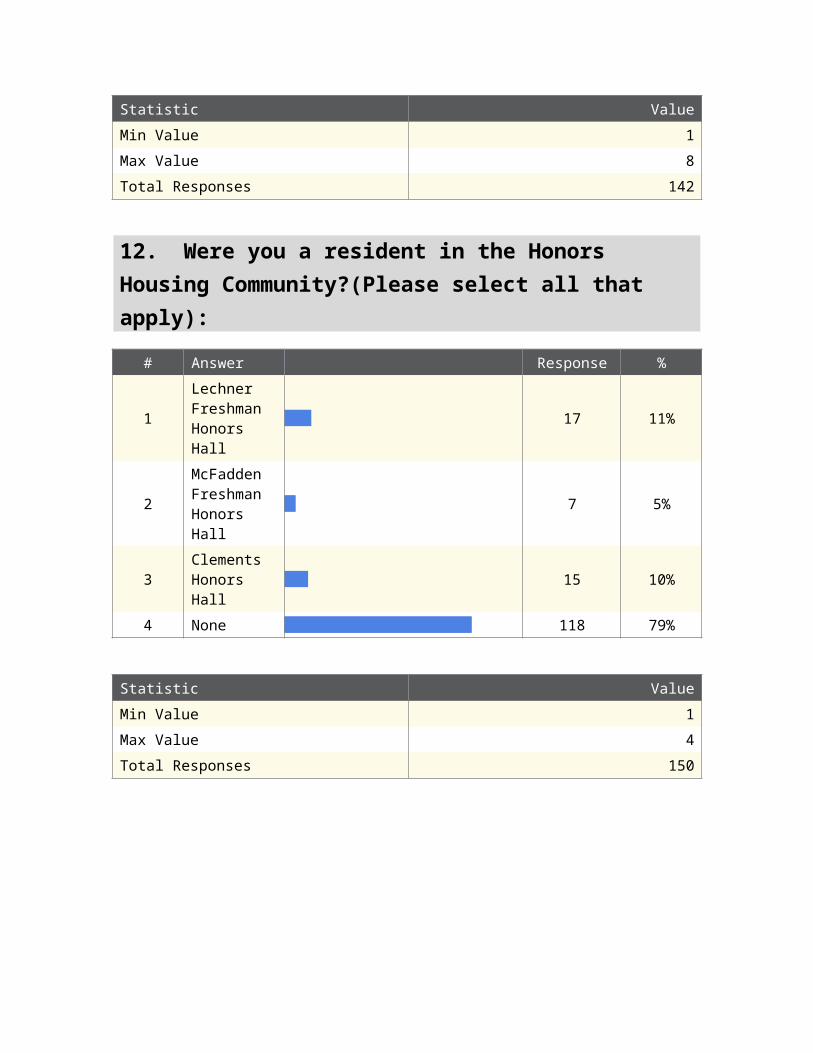
12. Were you a resident in the Honors Housing Community?(Please select all that apply):
# Answer Response %
1Lechner Freshman Honors Hall
17 11%
2McFadden Freshman Honors Hall
7 5%
3 Clements Honors Hall 15 10%
4 None 118 79%
Statistic Value
Min Value 1
Max Value 4
Total Responses 150
13. Did you hold a leadership position in the Honors Community? (Please select all that apply):
# Answer Response %
1Sophomore Advisor (McFadden|Lechner)
2 1%
2Junior Advisor (McFadden|Lechner)
1 1%
3 Peer Advisor (Clements) 0 0%
4Honors organization officer (see list above)
2 1%
5 None 146 97%

Statistic Value
Min Value 1
Max Value 5
Total Responses 150

14. Are/were you a member of any of the following honor societies? (Please select all that apply):
# Answer Response %
1 Phi Beta Kappa 10 8%
2 Phi Kappa Phi Honor Society 11 8%
3Golden Key International Honour Society
11 8%
4National Society of Collegiate Scholars
26 20%
5 Freshman: Phi Eta Sigma 15 11%
6 Sophomore: Lambda Sigma 3 2%
7Senior: Cap & Gown-Mortar Board
0 0%
8
Non-traditional students: Pinnacle Honor Society
0 0%
9 Accounting: Beta Alpha Psi 0 0%
10
Aerospace Engineering: Sigma Gamma Tau
2 2%
11Agriculture: Gamma Sigma Delta
1 1%
12
Agriculture & Biomedical Sciences: Alpha Zeta
3 2%
13 Architecture: Tau Sigma Delta 1 1%
14 Biology: Beta Beta Beta 0 0%
15
Biomedical Engineering: Alpha Eta Mu Beta
0 0%
16
Business Administration: Beta Gamma Sigma
0 0%
17
Business Management: Sigma Iota Epsilon
0 0%
18
Chemical Engineering: Omega Chi Epsilon
4 3%
19 Civil Engineering: Chi Epsilon 0 0%
20 Communication: Lambda Pi Eta 2 2%
21Computer Science: Upsilon Pi Epsilon
0 0%
22Construction Science: Sigma Lambda Chi
3 2%
23 Dance: Nu Alpha Delta 0 0%
24 Education: Kappa Delta Pi 2 2%
25Electrical Engineering: Eta Kappa Nu
1 1%
26 Engineering: Tau Beta Pi 3 2%
27Engineering Technology: Tau Alpha Pi
0 0%
28 English: Sigma Tau Delta 1 1%
29 Floriculture: Pi Alpha Xi 0 0%
30 Geography: 0 0%

Gamma Theta Upsilon

31 Health: Eta Sigma Gamma 1 1%
32 Hispanic Studies: Sigma Delta Pi 0 0%
33History (international): Phi Alpha Theta
2 2%
34Industrial Distribution: Sigma Delta
0 0%
35Industrial Engineering: Alpha Pi Mu
1 1%
36International Education: Phi Beta Delta
0 0%
37 Mathematics: Pi Mu Epsilon 4 3%
38Mechanical Engineering: Pi Tau Sigma
1 1%
39Ocean Engineering: Omega Epsilon
0 0%
40Petroleum Engineering: Pi Epsilon Tau
0 0%
41 Philosophy: Phi Sigma Tau 0 0%
42 Political Science: Pi Sigma Alpha 1 1%
43Pre-Medicine: Alpha Epsilon Delta
0 0%
44 Psychology: Psi Chi 6 5%
45 Social Sciences: Pi Gamma Mu 1 1%
46 Sociology: Alpha Kappa Delta 2 2%
47 None 59 45%

Statistic Value
Min Value 1
Max Value 47
Total Responses 132

15. What were some positive aspects of your honors experience?

Text Response
Felt as if the professor was able to discuss more with the class making one's opinion valuable.
Excellent courses taught by dedicated, engaged professors -- without exception.
intellectual discussions in class
Reduced class size and the option to learn more about things I cared about Registering early definitely improved my grade outcomes
Early enrollment.
I liked living in Clements
Smaller class sizes gave you more access to the professor for help
Philosophy of logic encouraged my atheism
Great classes and professors
Early registration
The class was small. I only took one honors course.
Interesting classes
Smaller class sizes
Got to work with distinguished professors and faculty to challenge myself academically and further my knowledge in my study of interest.
None, I just got a cool certificate and that was it. It looks good on my resume but so does my GPA so I don't think it was worth my time.
The courses were actually challenging and the professors interesting. Plus, I was able to register early and therefore create a schedule that was conducive to my overall academic success.
I was able to personalize my courses a little bit more and study what really interested me. I liked that.
Smaller classes with great students and professors.
I enjoyed the small class sizes, discussion style of classes, as well as more variation in assignments such as projects and essays outside of standard multiple choice tests. I also felt that these classes provided more depth in the subject matter covered than regular courses. I also had a wonderful experience with the Honors Research Fellows program. I was able to gain academic presentation, research, and publication experience.
Small class sizes, greater emphasis on writing and discussion, challenging
I just took a 1 hour honors freshman seminar class. It was nice because it was only like 10 students and it was very relaxed.
Smaller classes, worked with other hardworking students
Alpha Kappa Delta was well organized and a great way to meet other students as enthusiastic about doing well in school as I was.
I loved the small class size and interactive teaching.
Most of my honors professors were very good. They enriched my knowledge on the course, and they presented the material in a very interesting way. They where very prepared and dedicated to their students, and they were very willing to work with us to help us learn the material.

It was smaller classes.
None, I did not have a positive experience with my honors courses.
Getting into grad school
I originally started taking Honors courses when I came in as a Freshman because I was told by my adviser at the time that in order to keep my McFadden scholarship I would have to take at least one honors class per semester. The early registration times were also really nice. I made A's in all three of my honors classes, and can say I thoroughly enjoyed 2 of them, much more so than I think I would have enjoyed a non-Honors course in those areas.
I only took one class. I really enjoyed it because there was a better student-teacher ratio.
I liked being in classes with smart students who were just as dedicated as I was. I also enjoyed having one of the best professors in the department teach my course. My honors POLS 331 course in the Fall of 2011 was my only negative experience with an honors professor (I still wonder how he ended up teaching that section...). Aside from that, I enjoyed that the professors treated us like actual college students, and recognized our desire to go above and beyond.
Smaller classes, higher level class discussions, being in class with students and professors who cared.
Working with other honors students on projects
Smaller class sizes, independent research assignments, better professors.
Not sure what to say
Smaller class size, high-quality professors
Found out halfway through the semester that the course didn't make and we were completing a more difficult courseload for regular credit.
Loved the professor, loved the class
The housing experience was a definite plus - the camaraderie helped me forge friends, the endemic school spirit made me more involved in my activities, and the dorm-wide closeness meant there was always someone there to do homework with or just talk to. The course depth was another great aspect of my experience The honors courses I took always left me with a greater understanding of my subject. I retain knowledge the best when I know the foundation upon which the knowledge is built; understanding how the subject matter relates is derived is a component of my honors courses that made them my favorite, and was sadly absent from non-honors courses. Finally, the honors professors were amazing, both in their knowledge and the ability to explain that knowledge in ways a novice like me could understand. Their enthusiasm for their subject was infectious, and every honors course I took made me want to take more.
I did not enjoy the honors class I took.
the sophomore advisors and the community aspect of the freshmen honors dorms was great!
I enjoyed the smaller class sizes and professors
I enjoyed the few honors classes that I did attend and I enjoyed the early registration
Early registration Small classes Good professors Mentors One on one with advisors
Small classes, good professors, surrounded by smart students, challenging course load
Cornerstone program and studying abroad
I liked having honor society meetings and meeting people from my major.

Living in Lechner Hall and then Clements Hall.
The class sizes were my favorite part because, as a freshmen, all of my other courses were giant lectures of 100+ students.
The professors I got to meet and get to know better were really awesome. Most of them teach honors classes because they like to get to know their students better than they can in huge lecture hall classes.
great classes and smart people. a lot of my good friends came from the honors programs
I met some of my best friends. I was challenged.
Early registration
Recognition and pride in my education. Ability to use honor on my resume.
Smaller class sizes and better professors!
Gained public speaking experience.
Great teaching
Smaller classes with relevant work and material. Challenging.
The challenge and participation involved in smaller classes
Smaller classes, better professors
The course material was always very challenging but stimulated my interest every semester. The class sizes were also smaller, allowing each student more time and opportunity to get to know the professors.
These are, in my view, the major benefits (in no particular order): small class sizes; discussion-oriented classes; higher percentage of academically oriented and engaged students; higher percentage of smarter students (sorry, not sure how better to put this); more engaged professors; and even higher likelihood of making friends. All of these benefits are further enhanced in upper-division classes. Honestly, from the perspective of a liberal arts (philosophy) major, it's much closer to getting an education at a more traditionally liberal arts oriented college/university. If I had come in as a freshmen (not a transfer), and if I didn't have time constraints due to finances (I survived mostly on savings), I would have attempted to take every single class possible as honors.
I could put it on my resume
Challenging and interesting course work, like minded students.
Great classes, great teachers, fun outside educational assignments
Easier classes, early registration
n/a
fun, challenging, better pacing than non-honors courses, good benefits (community and early registration)
The class was much better, smaller size, and more challenging. I think I learned more than if I had been in the regular class.
smaller classes
Challenging, camaraderie, leadership, network, educational, diverse, fun
Great interaction, depth, and small class size.

Statistic Value
Total Responses 72

16. What improvements would you recommend that the University Honors Program implement?
Text Response
None
more focus on individual honors classes rather than the graduation distinction
Make things more clear about how to pursue and secure distinction as well as the options granted to honors students through a meeting at the beginning of freshman year or a required advisor visit
The honors professors are awful. The teach with much less effort. They are disorganized and come to class with no preparation especially in the math department. They think that because it is an "honors" class that they do whatever they want and call it "stream of consciousness" as an excuse. The whole program is rubbish. They make us jump through pointless hoops to put the word "honors" on our degree. I feel that this program has taken time away from things that could actually prepare me for things after college like a job or seeking more financial independence. Also, it focuses on liberal arts which really puts off scientists and engineers.
NOt force the students to take every class as honors
Offer more relevant classes honors. It is frustrating that the class needed to complete an honors distinct aren't offered honors.
Admittance to incoming freshman more encouraged
More honors classes for university required courses
didn't like the professors
No improvements recommended.
Not available within my major
Don't let Dr. Maggard teach ENGR 111. He was an arrogant man who lorded over his students, treating them like they were worthless idiots. He soured me on taking honors courses. In other words, be very careful who you let teach the courses.
Not require honors status to register for honors courses. That limit kept me from taking some really intriguing classes that I could have benefitted from!
Not sure, the only thing I got from the program other than the certificate is a bunch of junk e-mails.
If you change the policies/requirements for the program one semester before a student graduates, please make it so they can still graduate with honors distinctions under the requirements in which they entered the program.
When I applied for a Rhodes Scholarship, the Honors office refused to help because I did not go through their specific process. They told me that because I hadn't done it that way, I would never be able to complete the application. I was.
None
I do not like the new requirement of attending an honors event every semester.
Make more honors classes available, continue to be committed to smaller class sizes throughout

budget cuts, greater visibility (know several people who didn't know there was an honors option)
I decided to not continue in Honors because the requirements to get actual distinctions were ridiculous. I would have had to retake several classes and take several classes I didn't need in my major. So I would recommend doing away with that or lowering the requirements in some way.
More honors course offerings.
Drop the GPA requirement from 3.5 to 3.0
The Honors Program should do a better job in engaging its students in the Honors Community. I didn't get involved in the Honors community cause I didn't really know how I could. I think the mandatory housing for Freshmen will help get students more engaged in the Honors program.
I would suggest the Honors Program professors be more understanding of the different learning abilities.
Prior to taking honors courses, I had been told by my academic advisor that honors courses were "enriched" rather than "accelerated", meaning that the honors courses exposed students to more content or got to go more in depth on particular subjects than normal. This turned out to be false. The honors courses were nothing but more homework, with no additional exposure to the subject. To improve this, actually make the honors coursework enriched, otherwise its not worth the headache.
There isn't anything that I would change
As an engineer, after finishing your first year there really aren't any honors choices left. For me this was a non-issue as I no longer had above a 3.5 GPR, however I do know many people that stopped taking honors courses specifically for the fact that it just became extra work, not differentiated work. As an engineer, the workload is already overwhelming, taking a class as "honors" to just do more work would really exacerbate the problem.
No idea.
Make it known! I didn't find out until my sophomore year that I could take honors; apparently I had been qualified to do it the whole time. This is what prevented me from being able to graduate with honors. Well that and the highly over-inflated view that the honors office has of its program, and the reluctance to aid students who are sophomores to pursue a graduation with honors.
Offer more options for honors courses to take. It seems like the options have dwindled the past few semesters.
just make you take honors courses in your major and not other ones that don't matter to you
Automatic pre-registration enrollment. Clearer info on how to obtain honors distinctions.
Not sure
None in particular
more variety of courses should be offered
Offer the lectures separately from the regular courses. This did occur in earlier classes (chemistry, physics, etc.), but as I moved up in my coursework, the honors and regular courses would share a lecture. My enthusiasm for honors courses wasn't for the fancy sticker I could get on my diploma, it was for the greater knowledge offered by the professor in the setting of exceptionally intelligent students. If I can get the same knowledge without having extra

homework problems and harder tests, why would I take the honors course? Two of my sister's math honors professors would have simultaneous lectures and identical tests between the honors and non-honors students, and give bonus points to the non honors students to curve their grade. This is a disincentive for honors courses, and because of antics like this, when possible I would take the non-honors section of courses with shared lectures; I got the benefit without the cost of taking it honors. This should not be a feature of the honors program.
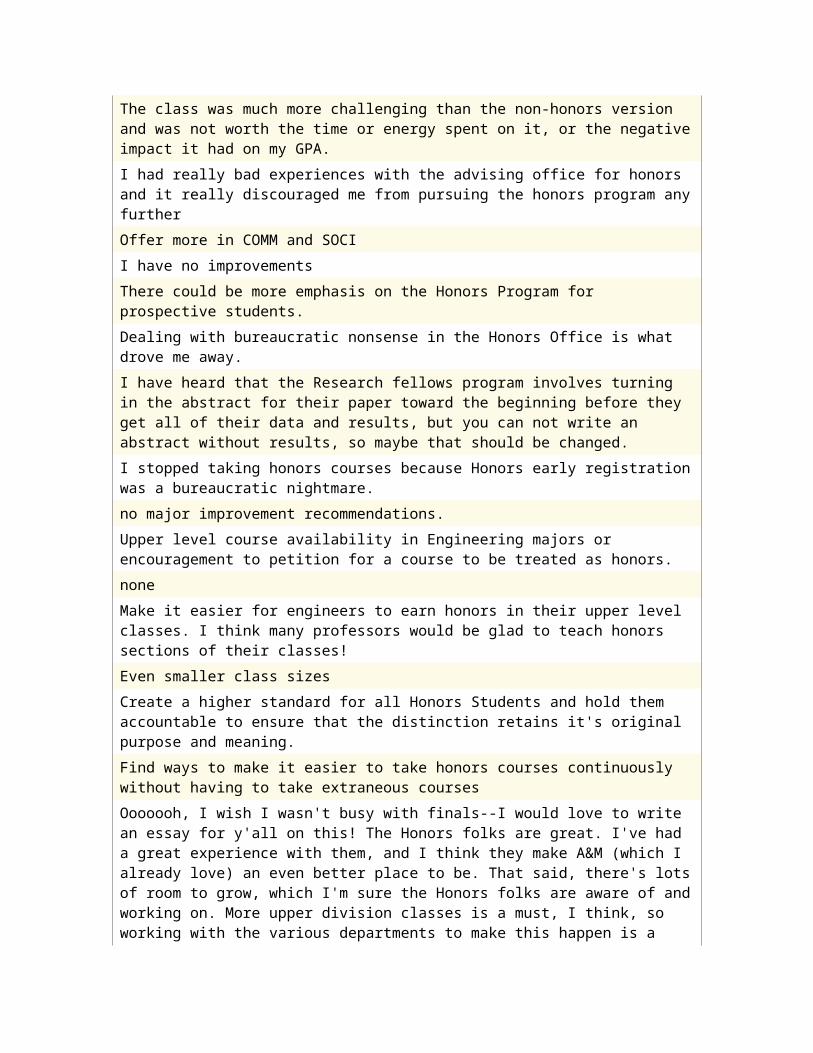
The class was much more challenging than the non-honors version and was not worth the time or energy spent on it, or the negative impact it had on my GPA.
I had really bad experiences with the advising office for honors and it really discouraged me from pursuing the honors program any further
Offer more in COMM and SOCI
I have no improvements
There could be more emphasis on the Honors Program for prospective students.
Dealing with bureaucratic nonsense in the Honors Office is what drove me away.
I have heard that the Research fellows program involves turning in the abstract for their paper toward the beginning before they get all of their data and results, but you can not write an abstract without results, so maybe that should be changed.
I stopped taking honors courses because Honors early registration was a bureaucratic nightmare.
no major improvement recommendations.
Upper level course availability in Engineering majors or encouragement to petition for a course to be treated as honors.
none
Make it easier for engineers to earn honors in their upper level classes. I think many professors would be glad to teach honors sections of their classes!
Even smaller class sizes
Create a higher standard for all Honors Students and hold them accountable to ensure that the distinction retains it's original purpose and meaning.
Find ways to make it easier to take honors courses continuously without having to take extraneous courses
Ooooooh, I wish I wasn't busy with finals--I would love to write an essay for y'all on this! The Honors folks are great. I've had a great experience with them, and I think they make A&M (which I already love) an even better place to be. That said, there's lots of room to grow, which I'm sure the Honors folks are aware of and working on. More upper division classes is a must, I think, so working with the various departments to make this happen is a must. Also, playing up the Honors program more as being academically awesome would be great. We have enough "get a job" classes here--we're an engineering school. But in the liberal arts, A&M doesn't get the respect it deserves, and even if it got the respect it currently deserves, we really need to be even better. I'm being one-sided here, it's true. But in my experience--and I worked for years in the I.T./I.S. industry before returning to school here--it doesn't matter all that much to hiring managers whether a fresh grad has an honors distinction. But for a liberal arts major aiming at grad school (the natural "moving up" in that area), honors distinctions, research, etc, are very

important. Also, and I'll stop here due to time constraints on my part, I recommend having the best and most experienced honors professors hold workshops to train newer honors professors on the best ways to teach honors courses. The newer professors sometimes just tack on work or stiffen their grading. The whole learning experience can be very different with a motivated class. Seminar-style classes are possible, and much more rewarding. Dr. Albert Broussard and Dr. Stephen Daniel are examples of professors who really know how to make an honors class a great educational experience.
Name Recognition-There did not appear to be any career motivation to take part in honors.
If you take one honors course and then do not take one for a semester, it was not possible to take honors courses again, in my experience.
Make sure freshmen get in honors classes if they are eligible. I wasn't eligible coming in, but I was after my first semester. I wish I would have known and started taking them sooner. Advisors need to stress this to their students. I always met with my advisor, and she never mentioned it to me.
None
n/a
make incoming students more aware of the requirements and distinctions
Making students more aware of the programs, encouraging them to participate. I didn't hear about it at all during my new student conference when I registered. I blew off classes my first semester and once I got my act together towards november and realized there were such things as honors classes I signed up for one via a waiver, but couldn't pull my GPR above a 3.5 in order to rejoin the honors program.
More effective input from HSC and honors students when determining policy
Statistic Value
Total Responses 60
17. Did you receive any scholarships or fellowships while you were an undergraduate at Texas A&M?
# Answer Response %
1 Yes 109 71%
2 No 44 29%
Total 153 100%

Statistic Value
Min Value 1
Max Value 2
Mean 1.29
Variance 0.21
Standard Deviation 0.45
Total Responses 153

18. Please indicate which scholarships or fellowships you received. (Check all that apply by holding "Ctrl" key on PC or command key on Mac.)
# Answer Response %
1 President's Endowed 29 37%
2 President's Achievement 6 8%
3 Academic Achievement 23 29%
4 Lechner Scholarship 3 4%
5 McFadden Scholarship 2 3%
6 National Merit 13 17%
7 Barbara S. and Julian B. "Barry" Coon
1 1%
8 DruEtta C. and Morris G. Coon
0 0%
9 William James Crenan '49
1 1%
10 Lucille Dougherty 0 0%
11 Joseph H. Emmert, Jr. '69 0 0%
12 Melvin Hamilton '71 0 0%
13 Crawford and Hattie Jackson Foundation
0 0%
14
Katherine Ann Keller Memorial Scholarship
0 0%
15 Lola Mae & Charles
0 0%

LaMotte Memorial Scholarship

16 Annie Lee and Robert H. Schultz
0 0%
17
William A. Triche and Homer A. Triche
1 1%
18 Emily & Robert Walker '45
0 0%
19 John Todd Willis '44 0 0%
20 Randall C. Shepard '71 0 0%
21 J. W. Birdwell '28 0 0%
22 John C. Calhoun III 0 0%
23
Jessica Jon Chancellor Memorial Lifeline Scholarship
0 0%
24
John B. and Ora Mae Dougherty Memorial LifeLines Scholarship
0 0%
25 Hugo F. Elmendorf 0 0%
26 Jr. MD '44 Lifelines Scholarship
0 0%
27
Patricia & William Gordon '67 in the Howard L. Gravett Scholars Program
0 0%
28 Richard B. Grant '29 0 0%

29 Howard Gravett 0 0%
30 Juilia Ball Lee 1 1%
31 HR Lewis 0 0%
32
Lifelines Endowed Scholarship Program
0 0%
33
Susan Luehr '84 Endowed Lifelines Scholarship
0 0%
34
Walter S. McGregor '38 Lifelines Memorial Scholarship
0 0%
35
Woodie Bennett Mike Scholarship in the Howard L. Gravett Scholars Program
0 0%
36 Jerry R. Jones 0 0%
37 William E. Wheeler '46 Lifelines
0 0%
38
Southeast Texas Health Professionals Lifelines
0 0%
39
George Reichel '70 in the Howard Gravett Scholarship Program
0 0%
40 Patsy Ruth & Delma P. Posey '59
0 0%
41 Jack Orrick '45 Lifelines 0 0%
42 Corps 21 Scholarship 0 0%
43 General Rudder Corps Scholarship
1 1%
44 Sul Ross/Corps Scholarship
2 3%
45 Chester Reed Scholarships 0 0%
46 Academic Excellence Award
23 29%
47 Honors Incentive Award
3 4%
48 Regents 5 6%
Statistic Value
Min Value 1
Max Value 48
Total Responses 78

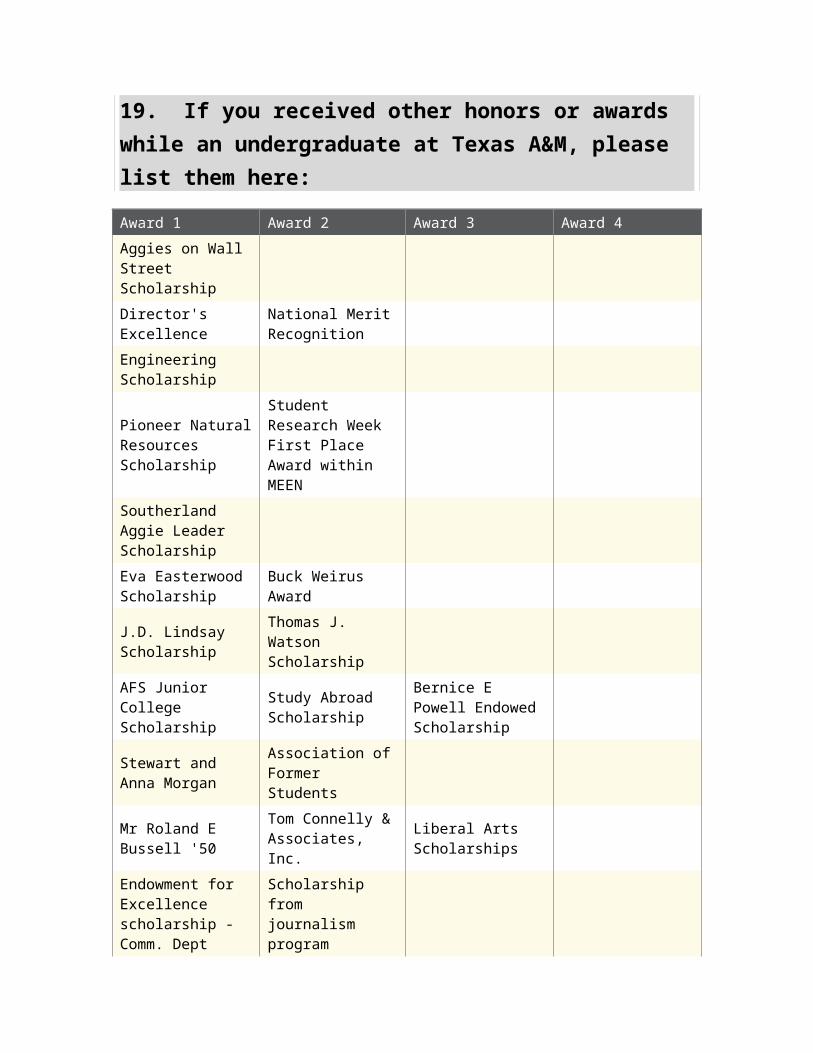
19. If you received other honors or awards while an undergraduate at Texas A&M, please list them here:
Award 1 Award 2 Award 3 Award 4
Aggies on Wall Street Scholarship
Director's Excellence National Merit Recognition
Engineering Scholarship
Pioneer Natural Resources Scholarship
Student Research Week First Place Award within MEEN
Southerland Aggie Leader Scholarship
Eva Easterwood Scholarship Buck Weirus Award
J.D. Lindsay Scholarship
Thomas J. Watson Scholarship
AFS Junior College Scholarship
Study Abroad Scholarship
Bernice E Powell Endowed Scholarship
Stewart and Anna Morgan
Association of Former Students
Mr Roland E Bussell '50
Tom Connelly & Associates, Inc.
Liberal Arts Scholarships
Endowment for Excellence scholarship - Comm. Dept
Scholarship from journalism program
Dean's List
Sam Houston Sanders Endowed Scholarship
Bertha and Samuel P. Martin endowed scholarship
Nolan flowers memorial aggie ring scholarship
International system safety award
Susan M. Arseven Endowed Scholarship
Accenture Foundation Endowed Scholarship
Robert C. Bryd Scholorship
Bolner Endowed Scholarship
Endowed Opportunity

Award Scholarship
International Fees Scholarship
Dean's List
Liberal Arts study abroad scholarship
The No One Donates Money to the College of Liberal Arts So There are No Scholarships Scholarship
aero dept scholarship
PPIP Paris PPIP DC Critical Language Scholarship
Academic Excellence Award
Faye & Eddie V. Gray Endowed Scholarship (Geosciences)
Century Scholars San Antonio A&M Mothers club
COALS Scholarship AGEC Dept. Scholarship
Noble Energy Educational Fund
Study Abroad Scholarship
Barnes and Nobles Opportunity Award
BP Chemical Engineering Scholarship
Mary K. O'Conner Process Safety Scholarship
ConocoPhillips SPIRIT Scholarship
Thomas A. Smith '66 Endowed Scholarship
Buck Weirus Spirit Award
Who's Who of Collegiate Scholors
Cain Boot and Saber Award
J Malon Southerland Scholorship
CD Holland Scholarship
Regents Academic Excellence Award
College of Eng Student Scholar
ConocoPhillips SPIRIT Scholarship Titans of Investing
Dean's Honor Roll
Chemical Engineering

Scholarship
George and Sue Sumner Student Worker Opportunity Award
Mays Business School Grant Award
cb recognition century scholars
Lucas John Kimmel Bonfire Memorial Scholarship
Outstanding Junior
Honors Research Fellowship
Student Research Week Oral Presentation 1st Place (Humanities areas)
Glasscock Humanities Award
Two Philosophy Undergraduate Essay Prizes (annual awards)
CS Scholarship ($1500/year)
Generic Honor's Scholarship upon entry.
Department Scholarship (Chemical Engineering)
State Engineering Scholarship
San Antonio Texas A&M Mother's Club
CB Recognition AwardDewitt C. & Bethel Winter Cox Scholarship
William & Mildred Dafcik Food Science & Technology Scholarship
Kellogg Company Scholarship Fund
University Honors
Dean's Honor Roll
Krik Edwards Foundation Scholarship
Keys to AggielandDavis Library Opportunity Scholarship
Dean's List
Senior Merit
Department of Computer Science Industrial Affiliate Program Scholarship (sponsored by USAA)
Marie & Jim Galloway '29 Endowed Scholarship
Department of Computer Science Industrial Affiliate Program Scholarship (sponsored by Knowledge Based

Systems, Inc.)
Statistic Value
Total Responses 52
20. Did you participate in any of the following High-Impact Experiences? (Please select all that apply):
# Answer Response %
1 First-Year Seminar 36 24%
2Common Intellectual Experience
1 1%
3 Learning Community 18 12%
4 Writing-Intensive Course 111 73%
5Collaborative Assignment or Project
43 28%
6 Undergraduate Research 43 28%
7 Diversity/Global Learning 28 18%
8 Internship 79 52%
9Service Learning, Community-Based Learning
10 7%
10 Capstone Course or Project 61 40%
11 None 12 8%
Statistic Value
Min Value 1
Max Value 11
Total Responses 153

21. Please indicate the type of research you engaged in.
# Question 491 Student Worker
Volunteer Mean
1 Research 1 20 11 8 39 1.69
2 Research 2 6 9 2 17 1.76
3 Research 3 3 2 0 5 1.40
4 Research 4 0 2 1 3 2.33
# Question 491 Student Worker
Volunteer Mean
1 Research 1 51.28% 28.21% 20.51% 39 1.69
2 Research 2 35.29% 52.94% 11.76% 17 1.76
3 Research 3 60.00% 40.00% 0.00% 5 1.40
4 Research 4 0.00% 66.67% 33.33% 3 2.33
Statistic Research 1 Research 2 Research 3 Research 4
Min Value 1 1 1 2
Max Value 3 3 2 3
Mean 1.69 1.76 1.40 2.33
Variance 0.64 0.44 0.30 0.33
Standard Deviation 0.80 0.66 0.55 0.58
Total Responses 39 17 5 3
22. Research Supervior and Department
Default - Research 1
Supervisor Department
Nancy Amato Computer Science
Brett Cooke INTS
Dr. Harry Hogan MEEN
Lanigan London Physics
Scott Dindot Veterinary Pathobiology
Griffins Biology
Douglas Snyder Psychology

? ECON
David Cairns GEOG
Margaret Ezell English
Dr. Teresa Wilcox Psychology
Valerie Balester English/University Writing Center
Dr. de Figueiredo Plant Pathology
Dr. Reed Aerospace
Josh hicks Psychology
Dr. Thomas Iliffe MarB
Schulze Marb
Bowersox Aero
Dr. Heather Lench Psychology
Anne Gundy EHRD
Tryon Wickersham Ruminant Nutrition
Leonard Bierman Management
Eitan Psychology
Dr. Abbott Vet Med
Dr. Amato Computer Science
Dr. Sorg Biology
Dr. Paul Straight BICH
Robert K. Garcia Philosophy
Rabi Mahapatra CSCE
NA PSYC
Nehemia Geva Political Science
Adams Japanese
Dr. Gerard Cote Biomedical Engineering
Robert Strong ALEC
Kyle HDNR
Lynntech, Inc
Default - Research 2
Supervisor Department
NA Explorations Publication
Dr. James Moore BMEN
DePoy Physics
Les Morey Psychology

Dr. Teresa Wilcox Psychology
Dr. Reed Aerospace
Rebecca Schlegel Psychology
Schulze Marb
Dr. Heather Lench Psychology
Eitan Psychology
Dr. Jianrong Li VIBS
Robert K. Garcia Philosophy
Mize English
Dr. Steven Wright Electrical Engineering
Lynntech, Inc
Default - Research 3
Supervisor Department
DePoy Physics
Marisol Perez Psychology
Dr. Heather Lench Psychology
Default - Research 4
Supervisor Department
Dr. Heather Lench Psychology
Statistic Research 1 Research 2 Research 3 Research 4
Min Value - - - -
Max Value - - - -
Total Responses - - - -
23. Did you make any presentations or publications as an undergraduate?
# Answer Response %
1 Yes 22 54%
2 No 19 46%
Total 41 100%

Statistic Value
Min Value 1
Max Value 2
Mean 1.46
Variance 0.25
Standard Deviation 0.50
Total Responses 41

24. Please list your presentations and/or publications below. (Journal/conference, year):
Text Response
Tech Report, TAMU, 2009
Explorations -- Fall 2009 issue. Literary criticism of Wuthering Heights. Student Research Week Spring 2011 -- oral presentation on Slovo o Polku Igoreve Summer Poster Session -- poster on Anna Karenina research
Honors Fellows Research Thesis published to the TAMU directory Presented at Student Research Week Both in Spring 2012
SPIE First Author 2012, SPIE Co-author 2011, AAS Poster Presentation 2011, Texas A&M Explorations Undergraduate Research Journal 2010
For Dr. Rister's 424 & 425 class, I made it to the final presentation process to where I presented my business plan to a room of 180+ bankers, investers and entrepreneurs.
International Writing Center Association, 2012. National Conference on Peer Tutoring and Writing, 2012, 2011. Southeastern Writing Center Association Conference, 2012. Peer Centered Blog, 2012.
Student Research Week, Texas A&M, 2012; XVIII Biennial International Conference on Infant Studies, 2012
National Conference on Peer Tutoring in Writing, Chicago, 2012
Eating behaviors (under review)
Tamug research symposium, 2012
Psyc 203 requirement
Student Research Week 2011 Oral Presentation (Humanities area)
August 2010 TRIP Board Meeting August 2011 TRIP Board Meeting August 2012 TRIP Board Meeting MGMT 466 Group Presentation BUSN 205 Group Presentation MGMT 452 Group Presentation MGMT 450 Group Presentation
USRG 2012 Poster Session
Student Research Week, 2011
I will be presenting at the 2013 George Wright Conference based on research conducted during my internship.
Statistic Value
Total Responses 16

25. Did you participate in any research internships or research fellowships away from Texas A&M while you were an undergraduate student?
# Answer Response %
1 Yes 26 17%
2 No 127 83%
Total 153 100%
Statistic Value
Min Value 1
Max Value 2
Mean 1.83
Variance 0.14
Standard Deviation 0.38
Total Responses 153
26. Please list the names of Programs, Locations, and Source of Support.
Default - 2011/2012
Program Location Source of Support
DuPont Pioneer Plainview, TX
Private cardiovascular research Clca Dr. Rakesh Shah
ECON research Allan Building Paid
Internship Houston District Court
PPIP DC TAMU
Procter and Gamble Cincinnati, OH
Internship Denver, CO Centers for Medicare and Medicaid Services
Operation Mobilization Antananarivo, Madagascar Texas A&M
Parasol Lab College Station Gabriel Dos Reis
PwC Summer Internship Houston

MSC LT Jordan Dominican Republic
Internship Channel Islands HDNR Lab
Lynntech, INC
Default - 2010/2011
Program Location Source of Support
PPIP Paris TAMU
Procter and Gamble Cincinnati, OH
Internship San Antonio, TX Greehey Children's Cancer Research Institute
USRG College Station Dwight Look
Lynntech, INC
Default - 2009/2010
Program Location Source of Support
Study Abroad London None
Default - 2008/2009
Program Location Source of Support
Default - Pre 2008
Program Location Source of Support
Statistic 2011/2012 2010/2011 2009/2010 2008/2009 Pre 2008
Min Value - - - - -
Max Value - - - - -
Total Responses - - - - -
27. Please choose the duration for each internship.
# Question Less than 1 month
1 to 3 months
4 to 6 months
7 to 9 months
10 to 12 months
Mean
1 2011/2012 0 13 2 0 2 17 2.47
2 2010/2011 0 8 0 0 1 9 2.33
3 2009/2010 0 1 1 0 0 2 2.50
4 2008/2009 0 1 0 0 0 1 2.00
5 Pre 2008 0 0 0 0 0 0 0.00
# Question Less than 1 month
1 to 3 months
4 to 6 months
7 to 9 months
10 to 12 months
Mean
1 2011/2012 0.00% 76.47% 11.76% 0.00% 11.76% 17 2.47
2 2010/2011 0.00% 88.89% 0.00% 0.00% 11.11% 9 2.33
3 2009/2010 0.00% 50.00% 50.00% 0.00% 0.00% 2 2.50
4 2008/2009 0.00% 100.00% 0.00% 0.00% 0.00% 1 2.00
5 Pre 2008 0.00% 0.00% 0.00% 0.00% 0.00% 0 0.00
Statistic 2011/2012 2010/2011 2009/2010 2008/2009 Pre 2008
Min Value 2 2 2 2 -
Max Value 5 5 3 2 -
Mean 2.47 2.33 2.50 2.00 0.00
Variance 1.01 1.00 0.50 0.00 0.00
Standard Deviation 1.01 1.00 0.71 0.00 0.00
Total Responses 17 9 2 1 0

28. While a student at Texas A&M, did you work at a part-time or full-time job?
# Answer Response %
1 Yes 110 73%
2 No 41 27%
Total 151 100%
Statistic Value
Min Value 1
Max Value 2
Mean 1.27
Variance 0.20
Standard Deviation 0.45
Total Responses 151
29. Did you work. . .
# Answer Response %
1 On campus? 71 65%
2 Off campus? 67 61%
Statistic Value
Min Value 1
Max Value 2
Total Responses 110

30. How many semesters did you work while you were in school? Do not count any semesters during which you were not enrolled in classes at A&M (e.g. summers in which you did not take classes.)
# Answer Response %
1 1 11 10%
2 2 17 15%
3 3 15 14%
4 4 8 7%
5 5 19 17%
6 6 12 11%
7 7 11 10%
8 8 8 7%
9 9 5 5%
10 10 2 2%
11 11 0 0%
12 12 0 0%
13 more than 12 2 2%
Total 110 100%
Statistic Value
Min Value 1
Max Value 13
Mean 4.74
Variance 7.11
Standard Deviation 2.67
Total Responses 110

31. On average, how many hours a week did you work? (If you worked in more than one semester, please give the average of the semester in which you worked the most.)
# Answer Response %
1 1 to 7 13 12%
2 8 to 14 36 33%
3 15 to 21 34 31%
4 22 to 28 20 18%
5 29 or more 7 6%
Total 110 100%
Statistic Value
Min Value 1
Max Value 5
Mean 2.75
Variance 1.18
Standard Deviation 1.09
Total Responses 110

32. We would like to know what kind of work you performed and if it was related in any way to what you studied at A&M. Please check all that apply.
# Question type of work related to my studies
1 - Advertising/publishing 6 3 9
2 - Academic support 23 12 35
3 - Agricultural 3 1 4
4 - Animal care 3 2 5
5- Clerical/ administrative support
25 5 30
6 - Child care 11 4 15
7 - Financial 8 3 11
8- Information technology/technical support
7 4 11
9 - Laboratory/research work 21 17 38
10 - Manual/physical labor 8 1 9
11 - Medical/medical support 4 4 8
12 - Retail 11 0 11
13 - Restaurant 21 1 22
14 - Writing/editing 16 11 27
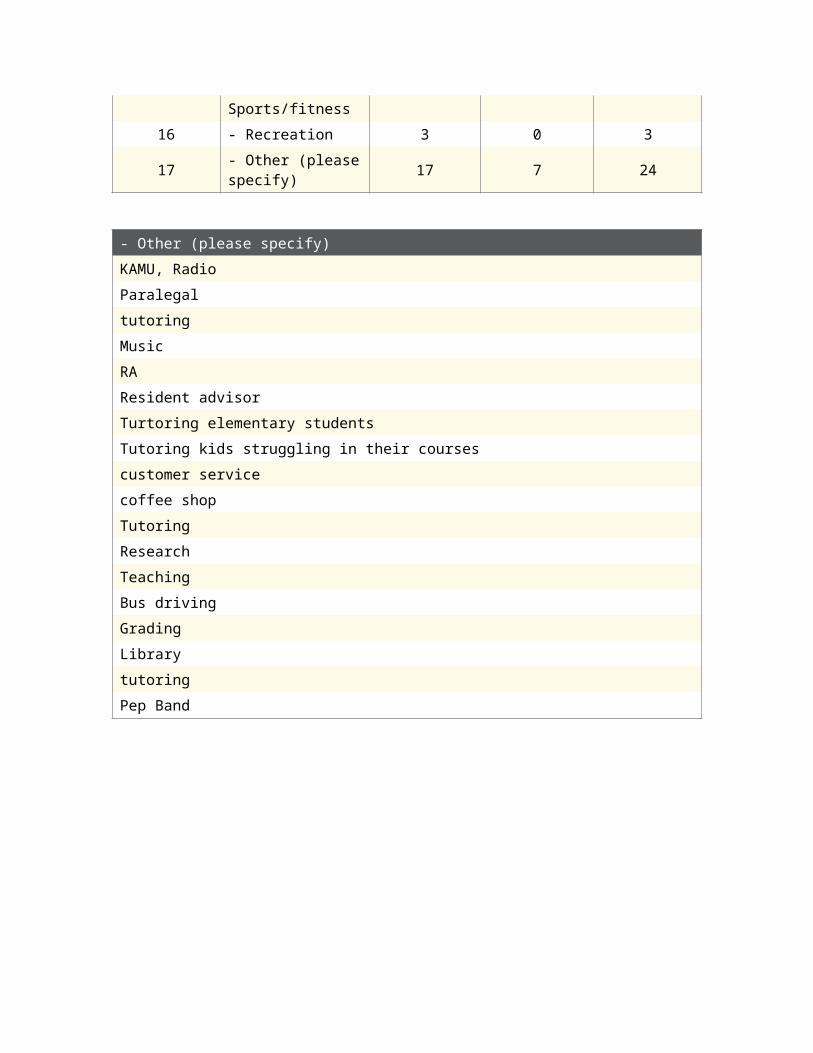
15 - Sports/fitness 5 1 6
16 - Recreation 3 0 3
17 - Other (please specify) 17 7 24

- Other (please specify)
KAMU, Radio
Paralegal
tutoring
Music
RA
Resident advisor
Turtoring elementary students
Tutoring kids struggling in their courses
customer service
coffee shop
Tutoring
Research
Teaching
Bus driving
Grading
Library
tutoring
Pep Band

Statistic
- Advertising/publishing
- Academic support
- Agricultural
- Animal care
- Clerical/ administrative support
- Child care
- Financial
- Information
technology/technical
support
- Laboratory/research wor
k
- Manual/physical labor
- Medical/medical
suppor
t
- Retail
- Restaurant
- Writing/editing
- Sports/fitness
- Recreation
- Other (please specify)
Min Value
1 1 1 1 1 1 1 1 1 1 1 1 1 1 1 1 1
Max Value
2 2 2 2 2 2 2 2 2 2 2 1 2 2 2 1 2
Total Responses
6 23 3 3 27 1
2 8 7 22 8 6 11 21 17 5 3 1
8

33. What were the primary factors for your working while in school? (select the best three.)
# Answer Response %
1 - Career exploration 19 17%
2 - Earn money to support myself 45 41%
3 - Earn extra spending money 73 66%
4 - Job experience 68 62%
5- Help me with time management
16 15%
6
- An advisor/faculty member/mentor suggested that I work
6 5%
7- My family expected me to work
20 18%
8 - I enjoy working 33 30%
Statistic Value
Min Value 1
Max Value 8
Total Responses 110
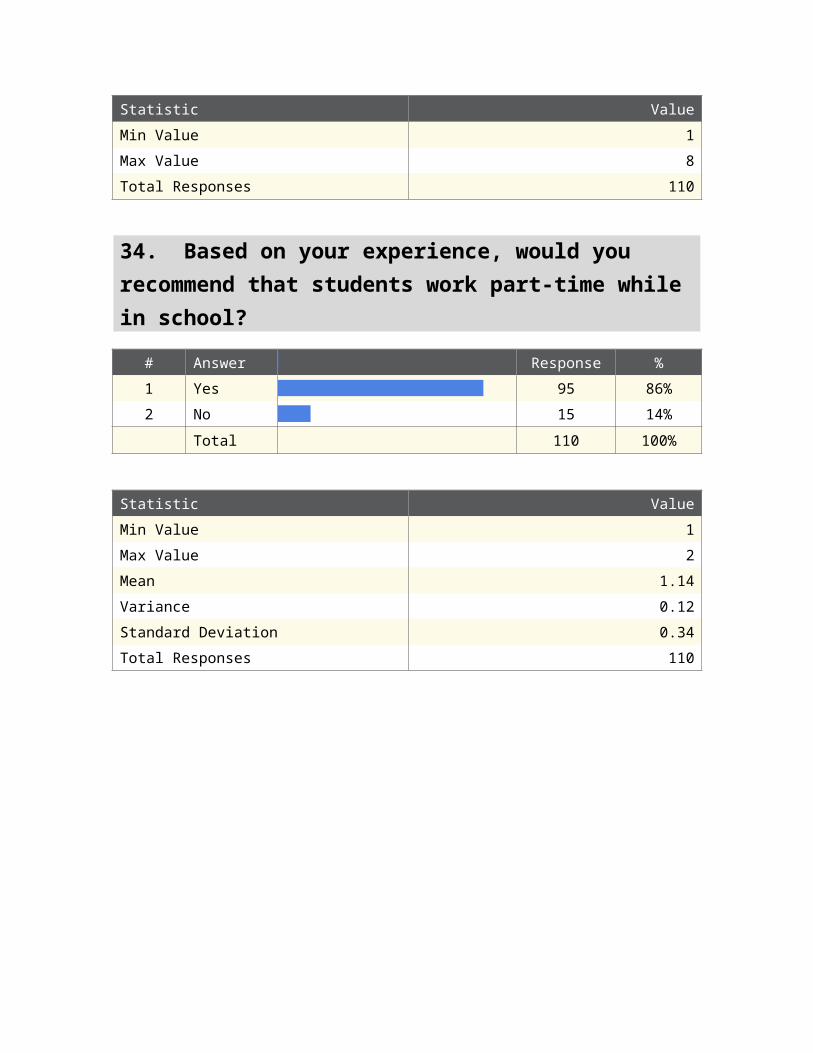
34. Based on your experience, would you recommend that students work part-time while in school?
# Answer Response %
1 Yes 95 86%
2 No 15 14%
Total 110 100%

Statistic Value
Min Value 1
Max Value 2
Mean 1.14
Variance 0.12
Standard Deviation 0.34
Total Responses 110

35. A&M's Contribution to your ability
# Question Very much
Quite a bit
Some Very little
None Mean
1 Write effectively. 39 59 39 11 3 151 2.21
2 Speak effectively. 38 58 33 16 5 150 2.28
3Create original ideas and/or products.
36 50 49 12 2 149 2.29
4Solve complex , real-world problems.
66 52 24 3 3 148 1.82
5
See the importance of history for understanding the present as well as the past.
25 39 53 25 9 151 2.70
6
Recognize the limitations of inferences and assumptions in science.
43 46 36 14 11 150 2.36
7
Draw conclusions after weighing evidence, facts and ideas.
55 61 21 7 5 149 1.97
8Interpret quantitative data.
63 51 19 12 3 148 1.93
9 Reason mathematically. 46 44 40 13 6 149 2.26
10Locate, screen and organize information.
45 55 29 16 4 149 2.19
11
Articulate the impact of technology on society.
32 52 31 25 9 149 2.51

12 Behave ethically. 56 47 33 5 6 147 2.03
13
Predict the consequences of my own actions.
41 59 32 14 3 149 2.19
14Respect cultural and ethnic differences.
52 43 36 10 8 149 2.19
15
Work effectively in a diverse and global environment.
48 47 30 16 7 148 2.24
16Work effectively as part of a team.
65 44 25 9 5 148 1.95
17
Articulate the current research and problems in my field of study.
41 54 36 10 7 148 2.24
18
Apply the appropriate methodology to the problems in my field.
45 60 33 7 3 148 2.07
19
Integrate knowledge from outside my field of study.
42 52 40 10 4 148 2.20
20Appreciate fine arts, music and literature.
24 25 39 41 19 148 3.04
21
Discuss scientific principles and methods.
37 50 32 21 8 148 2.41
22
Lead a team of individuals with backgrounds different from my own.
44 48 30 18 8 148 2.31


# Question Very much
Quite a bit
Some Very little
None Mean
1 Write effectively. 25.83% 39.07% 25.83% 7.28% 1.99% 151 2.21
2 Speak effectively. 25.33% 38.67% 22.00% 10.67% 3.33% 150 2.28
3Create original ideas and/or products.
24.16% 33.56% 32.89% 8.05% 1.34% 149 2.29
4Solve complex , real-world problems.
44.59% 35.14% 16.22% 2.03% 2.03% 148 1.82
5
See the importance of history for understanding the present as well as the past.
16.56% 25.83% 35.10% 16.56% 5.96% 151 2.70
6
Recognize the limitations of inferences and assumptions in science.
28.67% 30.67% 24.00% 9.33% 7.33% 150 2.36
7
Draw conclusions after weighing evidence, facts and ideas.
36.91% 40.94% 14.09% 4.70% 3.36% 149 1.97
8Interpret quantitative data.
42.57% 34.46% 12.84% 8.11% 2.03% 148 1.93
9 Reason mathematically. 30.87% 29.53% 26.85% 8.72% 4.03% 149 2.26
10Locate, screen and organize information.
30.20% 36.91% 19.46% 10.74% 2.68% 149 2.19
11
Articulate the impact of technology on society.
21.48% 34.90% 20.81% 16.78% 6.04% 149 2.51
12 Behave ethically. 38.10% 31.97% 22.45% 3.40% 4.08% 147 2.03

13
Predict the consequences of my own actions.
27.52% 39.60% 21.48% 9.40% 2.01% 149 2.19
14Respect cultural and ethnic differences.
34.90% 28.86% 24.16% 6.71% 5.37% 149 2.19
15
Work effectively in a diverse and global environment.
32.43% 31.76% 20.27% 10.81% 4.73% 148 2.24
16Work effectively as part of a team.
43.92% 29.73% 16.89% 6.08% 3.38% 148 1.95
17
Articulate the current research and problems in my field of study.
27.70% 36.49% 24.32% 6.76% 4.73% 148 2.24
18
Apply the appropriate methodology to the problems in my field.
30.41% 40.54% 22.30% 4.73% 2.03% 148 2.07
19
Integrate knowledge from outside my field of study.
28.38% 35.14% 27.03% 6.76% 2.70% 148 2.20
20Appreciate fine arts, music and literature.
16.22% 16.89% 26.35% 27.70% 12.84% 148 3.04
21
Discuss scientific principles and methods.
25.00% 33.78% 21.62% 14.19% 5.41% 148 2.41
22
Lead a team of individuals with backgrounds different from my own.
29.73% 32.43% 20.27% 12.16% 5.41% 148 2.31

Statistic
Write effectively.
Speak effectively.
Create original ideas and/or products.
Solve complex , real-world problems.
See the i
mportance of history for understanding the present as well
as the past.
Recognize the limitations of
inferences and assumptions in scie
Draw conclusions after weighing evidence, facts and ideas.
Interpret quantitative data.
Reason mathematically.
Locate, screen and organize information.
Articulate the i
mpact of technology on society.
Behave ethically.
Predict the consequences
of my own actions.
Respect cultural and ethnic differences.
Work effectively in a diverse and global environment.
Work effectively as part of a team.
Articulate the current research and problems in my field o
Apply the appropriate methodology to the problems in my field.
Integrate knowledge from outside my field of study.
Appreciate fine arts, music and literature.
Discuss scientific principles and methods.
Lead a team of
individuals with backgrounds different from
my ow

nce.
f study.
n.

Min Value
1 1 1 1 1 1 1 1 1 1 1 1 1 1 1 1 1 1 1 1 1 1
Max Value
5 5 5 5 5 5 5 5 5 5 5 5 5 5 5 5 5 5 5 5 5 5
Mean
2.21
2.28
2.29
1.82
2.70
2.36
1.97
1.93
2.26
2.19
2.51
2.03
2.19
2.19
2.24
1.95
2.24
2.07
2.20
3.04
2.41
2.31
Variance
0.95
1.13
0.94
0.84
1.24
1.44
1.01
1.06
1.23
1.14
1.39
1.12
1.02
1.32
1.34
1.16
1.16
0.90
1.03
1.62
1.36
1.39
Standard Deviation
0.98
1.06
0.97
0.92
1.11
1.20
1.00
1.03
1.11
1.07
1.18
1.06
1.01
1.15
1.16
1.08
1.08
0.95
1.02
1.27
1.17
1.18
Tot
151
150
149
148
151
150
149
148
149
149
149
147
149
149
148
148
148
148
148
148
148
148

al Responses

36. Importance for your future success
# Question Very importan
t
Important
Somewhat
important
Of little importanc
e
Not at all importan
t
Mean
1 Write effectively. 82 28 13 2 0 12
5 1.48
2 Speak effectively. 97 20 6 2 0 12
5 1.30
3Create original ideas and/or products.
61 31 27 6 0 125 1.82
4
Solve complex , real-world problems.
81 32 10 0 0 123 1.42
5
See the importance of history for understanding the present as well as the past.
24 32 42 23 4 125 2.61
6
Recognize the limitations of inferences and assumptions in science.
40 34 29 19 2 124 2.27
7
Draw conclusions after weighing evidence, facts and ideas.
69 41 12 1 0 123 1.55
8Interpret quantitative data.
55 42 16 8 1 122 1.84
9Reason mathematically.
38 42 23 14 3 120 2.18
10
Locate, screen and organize information.
49 53 13 5 0 120 1.78

11
Articulate the impact of technology on society.
24 29 39 26 2 120 2.61
12
Behave ethically. 88 25 6 2 0 12
1 1.36
13
Predict the consequences of my own actions.
61 44 15 1 0 121 1.64
14
Respect cultural and ethnic differences.
58 44 16 2 1 121 1.71
15
Work effectively in a diverse and global environment.
65 36 17 2 0 120 1.63
16
Work effectively as part of a team.
76 36 8 1 0 121 1.45
17
Articulate the current research and problems in my field of study.
41 42 27 10 1 121 2.07
18
Apply the appropriate methodology to the problems in my field.
53 46 19 2 1 121 1.78
19
Integrate knowledge from outside my field of study.
31 63 20 7 0 121 2.02
20
Appreciate fine arts, music and literature.
15 21 26 36 23 121 3.26
2 Discuss 30 41 26 15 9 12 2.44
1scientific principles and methods.
1
22
Lead a team of individuals with backgrounds different from my own.
61 42 17 1 0 121 1.65

# Question Very importan
t
Important
Somewhat
important
Of little importanc
e
Not at all importan
t
Mean
1 Write effectively. 65.60% 22.40% 10.40% 1.60% 0.00% 12
5 1.48
2 Speak effectively. 77.60% 16.00% 4.80% 1.60% 0.00% 12
5 1.30
3Create original ideas and/or products.
48.80% 24.80% 21.60% 4.80% 0.00% 125 1.82
4
Solve complex , real-world problems.
65.85% 26.02% 8.13% 0.00% 0.00% 123 1.42
5
See the importance of history for understanding the present as well as the past.
19.20% 25.60% 33.60% 18.40% 3.20% 125 2.61
6
Recognize the limitations of inferences and assumptions in science.
32.26% 27.42% 23.39% 15.32% 1.61% 124 2.27
7
Draw conclusions after weighing evidence, facts and ideas.
56.10% 33.33% 9.76% 0.81% 0.00% 123 1.55
8Interpret quantitative data.
45.08% 34.43% 13.11% 6.56% 0.82% 122 1.84
9Reason mathematically.
31.67% 35.00% 19.17% 11.67% 2.50% 120 2.18
10
Locate, screen and organize information.
40.83% 44.17% 10.83% 4.17% 0.00% 120 1.78
11
Articulate the impact of technology on
20.00% 24.17% 32.50% 21.67% 1.67% 120
2.61

society.

12
Behave ethically. 72.73% 20.66% 4.96% 1.65% 0.00% 12
1 1.36
13
Predict the consequences of my own actions.
50.41% 36.36% 12.40% 0.83% 0.00% 121 1.64
14
Respect cultural and ethnic differences.
47.93% 36.36% 13.22% 1.65% 0.83% 121 1.71
15
Work effectively in a diverse and global environment.
54.17% 30.00% 14.17% 1.67% 0.00% 120 1.63
16
Work effectively as part of a team.
62.81% 29.75% 6.61% 0.83% 0.00% 121 1.45
17
Articulate the current research and problems in my field of study.
33.88% 34.71% 22.31% 8.26% 0.83% 121 2.07
18
Apply the appropriate methodology to the problems in my field.
43.80% 38.02% 15.70% 1.65% 0.83% 121 1.78
19
Integrate knowledge from outside my field of study.
25.62% 52.07% 16.53% 5.79% 0.00% 121 2.02
20
Appreciate fine arts, music and literature.
12.40% 17.36% 21.49% 29.75% 19.01% 121 3.26
21
Discuss scientific principles and methods.
24.79% 33.88% 21.49% 12.40% 7.44% 121 2.44
2 Lead a team of 50.41% 34.71% 14.05% 0.83% 0.00% 12 1.65
2
individuals with backgrounds different from my own.
1

Statistic
Write effectively.
Speak effectively.
Create original ideas and/or products.
Solve complex , real-world problems.
See the i
mportance of history for understanding the present as well
as the past.
Recognize the limitations of
inferences and assumptions in scie
Draw conclusions after weighing evidence, facts and ideas.
Interpret quantitative data.
Reason mathematically.
Locate, screen and organize information.
Articulate the i
mpact of technology on society.
Behave ethically.
Predict the consequences
of my own actions.
Respect cultural and ethnic differences.
Work effectively in a diverse and global environment.
Work effectively as part of a team.
Articulate the current research and problems in my field o
Apply the appropriate methodology to the problems in my field.
Integrate knowledge from outside my field of study.
Appreciate fine arts, music and literature.
Discuss scientific principles and methods.
Lead a team of
individuals with backgrounds different from
my ow

nce.
f study.
n.

Min Value
1 1 1 1 1 1 1 1 1 1 1 1 1 1 1 1 1 1 1 1 1 1
Max Value
4 4 4 3 5 5 4 5 5 4 5 4 4 5 4 4 5 5 4 5 5 4
Mean
1.48
1.30
1.82
1.42
2.61
2.27
1.55
1.84
2.18
1.78
2.61
1.36
1.64
1.71
1.63
1.45
2.07
1.78
2.02
3.26
2.44
1.65
Variance
0.56
0.41
0.87
0.41
1.19
1.25
0.50
0.90
1.18
0.64
1.18
0.43
0.53
0.67
0.62
0.43
0.97
0.69
0.66
1.68
1.45
0.56
Standard Deviation
0.75
0.64
0.93
0.64
1.09
1.12
0.70
0.95
1.08
0.80
1.09
0.66
0.73
0.82
0.79
0.66
0.98
0.83
0.81
1.29
1.20
0.75
Tot
125
125
125
123
125
124
123
122
120
120
120
121
121
121
120
121
121
121
121
121
121
121

al Responses
37. What plans do you have for further education after graduation?
# Answer Response %
1
Graduate or professional school full time
64 42%
2
Graduate or professional school part time
12 8%
3
Pursue another Bachelor's degree
2 1%
4Specialized job training or certification
15 10%
5
No educational plans for the immediate future
60 39%
Total 153 100%

Statistic Value
Min Value 1
Max Value 5
Mean 2.97
Variance 3.44
Standard Deviation 1.85
Total Responses 153
38. What are your plans for graduate or professional school?
# Question I have been accepted
and plan to attend.
I have applied
and am still waiting for
a final decision.
I intend to apply in
the future.
Mean
1
Professional school (e.g., law, business,library, medicine, veterinary medicine, pharmacy, dentistry, etc.)
4 14 11 29 2.24
2
Allied health professions school (e.g.,nursing, medical technology, physicians assistant, etc.)
3 2 2 7 1.86
3
Graduate school (M.S., M.A., Ph.D, Ed.D.)
7 15 23 45 2.36

# Question I have been accepted
and plan to attend.
I have applied
and am still waiting for
a final decision.
I intend to apply in
the future.
Mean
1
Professional school (e.g., law, business,library, medicine, veterinary medicine, pharmacy, dentistry, etc.)
13.79% 48.28% 37.93% 29 2.24
2
Allied health professions school (e.g.,nursing, medical technology, physicians assistant, etc.)
42.86% 28.57% 28.57% 7 1.86
3
Graduate school (M.S., M.A., Ph.D, Ed.D.)
15.56% 33.33% 51.11% 45 2.36
Statistic Professional school (e.g., law,
business,library, medicine, veterinary medicine, pharmacy,
dentistry, etc.)
Allied health professions school
(e.g.,nursing, medical technology,
physicians assistant, etc.)
Graduate school (M.S., M.A., Ph.D,
Ed.D.)
Min Value 1 1 1
Max Value 3 3 3
Mean 2.24 1.86 2.36
Variance 0.48 0.81 0.55
Standard Deviation 0.69 0.90 0.74
Total Responses 29 7 45

39. What type of professional school will you be attending?
# Answer Response %
1 Business school 1 6%
2 Dental school 0 0%
3 Journalism school 0 0%
4 Law school 3 17%
5 Library school 0 0%
6 Medical school 11 61%
7 Optometry school 0 0%
8 Pharmacy school 0 0%
9 Psychology school 0 0%
10 Public health school 0 0%
11 Public policy school 0 0%
12 Veterinary school 3 17%
13 Other (please specify) 0 0%
Total 18 100%
Other (please specify)
Statistic Value
Min Value 1
Max Value 12
Mean 6.39
Variance 8.37
Standard Deviation 2.89
Total Responses 18

40. What type of allied health professional school will you be attending?
# Answer Response %
1 Athletic training 0 0%
2Cardiovascular perfusion technology
0 0%
3 Cytotechnology 0 0%
4 Dental hygiene 0 0%
5Diagnostic medical sonography
0 0%
6 Dietetics 0 0%
7 Emergency medical sciences 0 0%
8 Health administration 0 0%
9Health information management
0 0%
10 Medical technology 0 0%
11Nuclear medicine technology
0 0%
12 Nursing 0 0%
13 Occupational therapy 1 20%
14 Physical therapy 1 20%
15 Physician assistant 3 60%
16Radiation therapy technology
0 0%
17 Radiography 0 0%
18 Rehabilitation counseling 0 0%
19 Respiratory therapy 0 0%

20Respiratory therapy technology
0 0%
21
Speech-language pathology and audiology
0 0%
22 Other (please specify) 0 0%
Total 5 100%
Other (please specify)
Statistic Value
Min Value 13
Max Value 15
Mean 14.40
Variance 0.80
Standard Deviation 0.89
Total Responses 5

41. In which field(s) do you plan to pursue a Master's Degree or Doctorate degree? Check all that apply.
# Question Master's Degree Doctorate Degree
1 Agriculture (01) 0 0 0
2 Agricultural Sciences (02) 0 1 1
3 Natural Resources (03) 0 0 0
4 Architecture (04) 0 0 0
5Area, Ethnic and Cultural Studies (05)
0 0 0
6 Marketing Operations (08) 0 0 0
7
Communication, Journalism and Related Programs (09)
0 0 0
8 Communications Technologies (10) 0 0 0
9Computer and Information Sciences (11)
0 0 0
10Personal and Culinary Services (12)
1 0 1
11 Education (13) 0 0 0
12 Engineering (14) 4 3 7
13Foreign Languages and Literatures (16)
0 0 0
14Family and Consumer Sciences (19)
0 1 1
15 Home Economics (20) 0 0 0
16 Legal Studies (22) 0 0 0
17 English and Literature (23) 1 0 1

18Liberal Arts General Studies (24)
0 0 0
19 Library Science (25) 0 0 0
20Biological and Biomedical Sciences (26)
0 1 1
21 Mathematics and Statistics (27) 0 0 0
22 Military Technologies (29) 0 0 0
23 Interdisciplinary Studies (30) 0 0 0
24
Parks, Recreation, Leisure and Fitness Studies (31)
0 0 0
25Philosophy and Religious Studies (38)
0 1 1
26Theology and Religious Studies (39)
0 0 0
27 Physical Sciences (40) 1 1 2
28 Science Technologies (41) 0 0 0
29 Psychology (42) 1 4 5
30 Security Services (43) 0 0 0
31Public Administration (44)
1 1 2
32
Social Sciences (Anthropology, Economics, International Relations, Political Science, Sociology, Urban Studies) (45)
2 2 4
33 Construction 0 0 0

Trades (46)
34Mechanical and Repair Technologies (47)
0 0 0
35 Precision Production (48) 0 0 0
36 Transportation (49) 0 0 0
37Visual and Performing Arts (50)
0 0 0
38
Health Professions and Related Clinical Sciences (Medicine, Dentistry, Health Services, Allied Health, Nursing, Public Health, etc.) (51)
0 0 0
39 Business Management (52) 0 0 0
40 History (54) 0 0 0
41 Atmospheric Sciences (55) 0 0 0
42 Geography (56) 0 0 0
43 Oceanography (57) 0 0 0
44 Geosciences (58) 0 0 0
45 Geology (59) 0 0 0
46 Geophysics (60) 0 0 0
47 Envioronmental Science (61) 0 0 0

S Agriculture (01)
N Architecture (04)
M Communication, Journalism and Related Programs
C Personal and Culinary Services (12)
E Foreign Languages and Literatures (16)
H Legal Studies (22)
L Library Science (25)
M Military Technologies (29)
P Philosophy and Religious Studies (38)
P Science Technologies (41)
S Public Administration (44)
C Mechanical and Repair Technologies (47)
T Visual and Performing Arts (50)
B History (54)
G Oceanography (57)
G
(09)
M - - - - - - 1 1 - - - - - - - - 2 1 - - 1 - - - - - - - - -
M - - - - - - 1 2 - - - - - - - - 2 2 - - 2 - - - - - - - - -
T 0 0 0 0 0 0 1 6 0 0 0 0 0 0 0 0 1 1 0 0 1 0 0 0 0 0 0 0 0 0
42. My area is not listed.
Other Master's Other Doctorate
Finance
Healthcare Management
Museum Studies
International Relations
Evolutionary Biology
Statistic Value
Total Responses 5
43. Is this field related to your undergraduate major?
# Answer Response %
1Yes, same field as major
15 68%
2 Yes, related to major 6 27%
3 No, not related 1 5%
Total 22 100%

Statistic Value
Min Value 1
Max Value 3
Mean 1.36
Variance 0.34
Standard Deviation 0.58
Total Responses 22

44. Which institution will you be attending?
Name Location Department Field
Texas A&M College Station Finance
Any of 8 medical schools I applied to in Texas
Texas
University of Hawaii Hawaii Astronomy
University of Houston Houston TX
Texas A&M college of veterinary medicine College Station, TX
UT Dallas Richardson, TX Management
UTMB Galveston
Texas Woman's University Dallas, TX
University of South Florida Tampa Cellular Mollecular
and Microbiology
SMU Dallas
Texas A&M Health Science Center Bryan Nursing
Texas A&M University College Station Aerospace Engineering
Texas A&M University College Station, TX Aerospace Engineering
University of Oklahoma Norman, OK Electrical and
Computer Engineering
UTMB Galveston, TX
Texas A&M University College Station, Texas
UT Houston Houston, TX
Texas A&M University Give you 3 guesses Aerospace
Texas A&M University College Station, Texas
UTMB Galveston
Don't know yet
STCL Houston
Texas A&M Health Science Center Bryan Nursing
UTMB Galveston
Texas A&M University College Station Electrical Engineering
London, UK

Texas
Statistic Value
Total Responses 27
45. Do you plan to work full or part time while pursuing your degree?
# Answer Response %
1
Yes, I expect to work as a teaching or research assistant in my graduate program
12 55%
2
Yes, I expect to find a job at the institution
2 9%
3
Yes, I expect to work full time outside the institution
3 14%
4
Yes, I expect to work part time outside the institution
1 5%
5
No, I do not plan to work while in graduate school
4 18%
Total 22 100%

Statistic Value
Min Value 1
Max Value 5
Mean 2.23
Variance 2.56
Standard Deviation 1.60
Total Responses 22
46. What are your employment plans after graduation?
# Answer Response %
1 Nothing definite at this point 50 37%
2Private for-profit corporation/company/group-practice
58 43%
3Self-employed, own business, or professional practice (non-group)
2 1%
4Government (non-military) or other public institution or agency
3 2%
5 Teaching, library or educational administration 5 4%
6 Active military 2 1%
7
Volunteer with a government (Peace Corps, Americorps), faith-based, or international organization
4 3%
8 Other (Please specify) 11 8%
Total 135 100%

Other (Please specify)
Job
Paralegal
Medical school an consulting
Hospital
Keep working at current job
Teacher
Work as a process engineer
Graduate School
Internship at disneyland
Nursing
School
Statistic Value
Min Value 1
Max Value 8
Mean 2.50
Variance 4.51
Standard Deviation 2.12
Total Responses 135

47. Which business/industry sector will you most likely be employed in?
# Answer Response %
1 Architecture and engineering 4 7%
2Arts, design, entertainment, sports and media
4 7%
3Building and grounds cleaning and maintenance
0 0%
4 Business and financial/accounting 6 10%
5 Community and social services 1 2%
6 Computer and mathematical 8 13%
7 Construction and extraction 3 5%
8 Energy 16 27%
9 Environmental 0 0%
10 Farming, fishing and forestry 0 0%
11 Food preparation and serving related 0 0%
12 Healthcare/medical 7 12%
13 Homemaker 0 0%
14 Law enforcement 0 0%
15 Legal 1 2%
16 Life, physical, and social sciences 0 0%
17 Management 2 3%
18 Marketing and sales 1 2%
19Office and administrative support
0 0%
20 Personal care and service 0 0%

21 Training and personnel 0 0%
22 Transportation 2 3%
23 Other (Please specify) 5 8%
Total 60 100%
Other (Please specify)
Veterinary medicine
Engineering
biotechnology
Technology Consulting
Event Planning
Statistic Value
Min Value 1
Max Value 23
Mean 9.13
Variance 39.71
Standard Deviation 6.30
Total Responses 60

48. What branch of government/service?
# Answer Response %
1 U.S. Federal 2 67%
2 U.S. State 1 33%
3 U.S. Local 0 0%
4
Foreign (non-U.S.) government entity
0 0%
5
Non-governmental organization (NGO)
0 0%
Total 3 100%
Statistic Value
Min Value 1
Max Value 2
Mean 1.33
Variance 0.33
Standard Deviation 0.58
Total Responses 3

49. At what level do you plan to teach/work? (check all that apply)
# Answer Response %
1 Pre-school/Day care 0 0%
2 Private elementary/intermediate 0 0%
3 Public elementary/intermediate 2 40%
4 Private junior high/high school 0 0%
5 Public junior high/high school 4 80%
6 Vocational/technical 0 0%
7 College/university 0 0%
8 Adult education/training 0 0%
Statistic Value
Min Value 3
Max Value 5
Total Responses 5
50. What branch of military service?
# Answer Response %
1 U.S. Army 0 0%
2U.S. Navy/Marine Corps
2 100%
3 U.S. Air Force 0 0%
4 U.S. Coast Guard 0 0%
5
Other National Military (please specify country and service)
0 0%
Total 2 100%

Other National Military (please specify country and service)
Statistic Value
Min Value 2
Max Value 2
Mean 2.00
Variance 0.00
Standard Deviation 0.00
Total Responses 2
51. How well do you think your academic program prepared you for the job market?
# Answer Response %
1 Very well 28 38%
2 Generally well 38 51%
3 Ambivalent 5 7%
4 Inadequate 2 3%
5 Very inadequate 1 1%
Total 74 100%
Statistic Value
Min Value 1
Max Value 5
Mean 1.78
Variance 0.64
Standard Deviation 0.80
Total Responses 74

52. Have you received any offers of employment after graduation?
# Answer Response %
1 Yes 55 74%
2 No 19 26%
Total 74 100%
Statistic Value
Min Value 1
Max Value 2
Mean 1.26
Variance 0.19
Standard Deviation 0.44
Total Responses 74
53. What was the salary range of the highest offer you received?
# Answer Response %
1 $30,000/year or less 7 13%
2 $30,001 to $40,000/year 2 4%
3 $40,001 to $50,000/year 7 13%
4 $50,001 to $60,000/year 7 13%
5 more than $60,000/year 30 57%
Total 53 100%

Statistic Value
Min Value 1
Max Value 5
Mean 3.96
Variance 2.08
Standard Deviation 1.44
Total Responses 53
54. How likely is it that your job will require travel or relocation outside the United States in the next five years?
# Answer Response %
1 Very likely 12 22%
2 Likely 9 16%
3 Unlikely 21 38%
4 Definitely not 13 24%
Total 55 100%
Statistic Value
Min Value 1
Max Value 4
Mean 2.64
Variance 1.16
Standard Deviation 1.08
Total Responses 55

55. Is your prospective position related to your undergraduate field(s) of study?
# Answer Response %
1 Yes, same field as major 38 69%
2 Yes, related to major 12 22%
3 No, not related 5 9%
4Not applicable (unemployed, etc.)
0 0%
Total 55 100%
Statistic Value
Min Value 1
Max Value 3
Mean 1.40
Variance 0.43
Standard Deviation 0.66
Total Responses 55
56. Have you lived, studied, or worked outside of the United States since leaving high school?
# Answer Response %
1 Yes 62 41%
2 No 91 59%
Total 153 100%

Statistic Value
Min Value 1
Max Value 2
Mean 1.59
Variance 0.24
Standard Deviation 0.49
Total Responses 153
57. Which of the following describe your foreign experience? Please indicate all that apply.
# Answer Response %
1 Internship or co-op 10 16%
2 Reciprocal exchange 1 2%
3 Study abroad 53 85%
4 Field trip 1 2%
5
Employment not affiliated with an academic institution
2 3%
6 Non-academic program 6 10%
7 Other (please specify) 4 6%
Other (please specify)
Residence
mission trip
Vacation
mission trip

Statistic Value
Min Value 1
Max Value 7
Total Responses 62
58. How well do you think your international experience has prepared you for the next step in either starting a career or furthering your education?
# Answer Response %
1 Very well 40 66%
2 Generally well 10 16%
3
Neither well nor inadequately (neutral)
11 18%
4 Inadequate 0 0%
5 Very inadequate 0 0%
Total 61 100%
Statistic Value
Min Value 1
Max Value 3
Mean 1.52
Variance 0.62
Standard Deviation 0.79
Total Responses 61

59. Which of these are reasons why you have not gone abroad? Please indicate all that apply.
# Answer Response %
1No one encouraged me to do it
12 13%
2 It would delay my graduation 46 51%
3 Did not fit my degree plan 46 51%
4 Not beneficial to my career 12 13%
5 Too expensive 65 71%
6My financial aid didn't cover costs
25 27%
7 Needed to work instead 27 30%
8Family worried about my leaving the U.S.
7 8%
9Political tensions/fear of terrorism
3 3%
10I don't speak any language but English
14 15%
11Don't want to leave Texas or the U.S.
9 10%
12 Other (please specify) 10 11%

Other (please specify)
It's TOO DAMN EXPENSIVE.
I Have gone abroad many times for leisure. Your survey is deficient in this option
Had leadership responsibilities on campus that kept me here during the summer. Also, didn't want to miss semesters in the Corps
Very few places to study abroad when your major is Aerospace Engineering
I have traveled abroad for vacation
No desire
I was committed to a sports club and didn't want to leave my team in-season.
I would rather be here in College Station
I did take a few short trips but no long work/study stays
I am an international student, this is abroad for me
Statistic Value
Min Value 1
Max Value 12
Total Responses 91

60. At the time you graduate, approximately what will be the total amount borrowed to finance your undergraduate education that you are personally responsible for repaying?
# Answer Response %
1 none 85 56%
2 $1 to 9,999 20 13%
3 $10,000 to 19,999 15 10%
4 $20,000 to 29,999 15 10%
5 $30,000 to 39,999 6 4%
6 $40,000 to 49,999 2 1%
7 $50,000 or more 4 3%
8 Unable to estimate 6 4%
Total 153 100%
Statistic Value
Min Value 1
Max Value 8
Mean 2.27
Variance 3.62
Standard Deviation 1.90
Total Responses 153

61. Reflecting back, do you now think that the benefits you have received from attending Texas A&M were worth the financial costs to you and your family?
# Answer Response %
1 Yes, definitely 127 83%
2 Maybe, but not sure 21 14%
3 No, definitely not 5 3%
Total 153 100%
Statistic Value
Min Value 1
Max Value 3
Mean 1.20
Variance 0.23
Standard Deviation 0.48
Total Responses 153
62. How confident are you of success in your future?
# Answer Response %
1 Bring it on! 96 63%
2 I think I'll do well. 45 29%
3 Uncertain 9 6%
4 Not quite ready 2 1%
5 Not ready at all 1 1%
Total 153 100%

Statistic Value
Min Value 1
Max Value 5
Mean 1.48
Variance 0.53
Standard Deviation 0.73
Total Responses 153
63. Please give us your thoughts on how well Texas A&M prepared you for the future.
Responses are available on request from Mark Troy.
Statistic Value
Total Responses 65
64. Please provide an e-mail address that will be valid after graduation. This will be used by your college and department to keep you up to date on what's happening to your teachers and fellow students in you major department. Your address will not be sold or used for any other commercial purposes. Texas A&M respects your privacy.
Adresses are available on request from Mark Troy.
Statistic Value
Total Responses 132
65. gender
Value Total
M 71
F 82
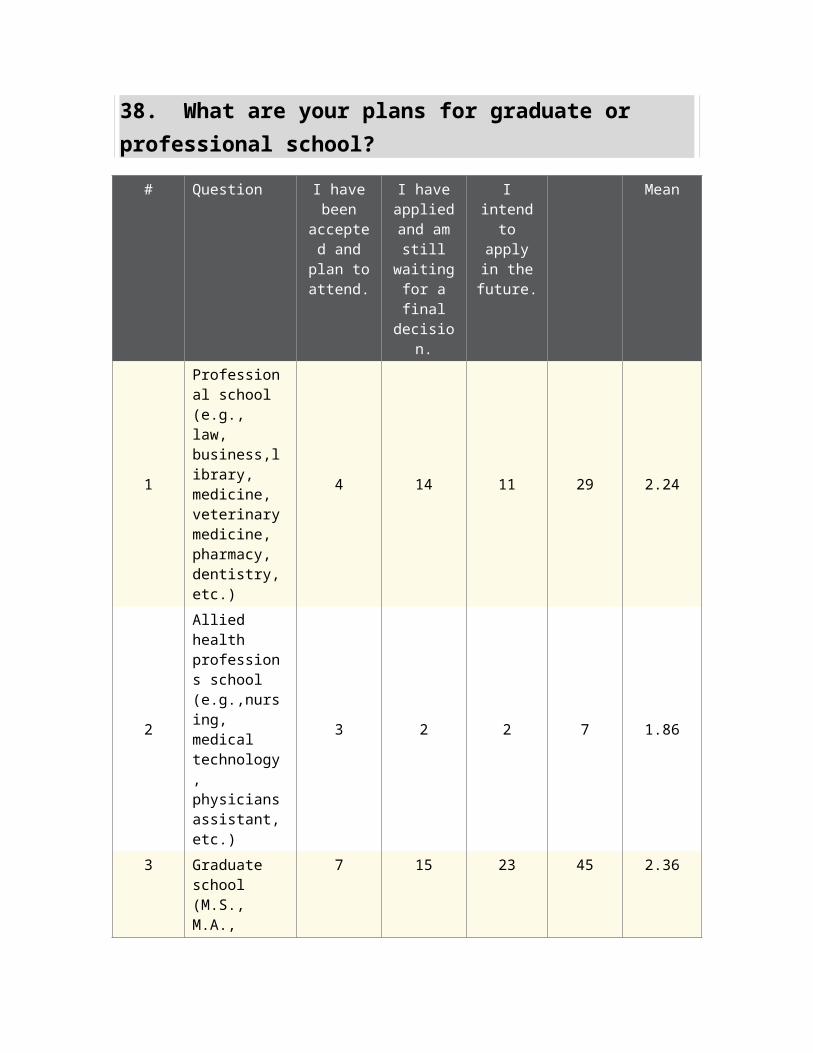
66. primaryMajor
Value Total
CPSC 4
ENGL 5
FINC 9
PSYC 12
POLS 3
INTS 7
AGBU 2
MEEN 9
PHYS 1
BIMS 10
BIOL 5
ZOOL 1
ECON 2
NUSC 3
SPAN 1
COSC 3
CHEN 12
AGEC 3
GEOG 1
INFO 3
INST 3
COMM 4
SOCI 3
APMS 3
HLTH 1
AERO 7
MARB 2
BHNR 3
HRDV 1
TCMG 1
USLA 1
ELEN 1
METR 1

MATH 1
VIST 2
HIST 2
ANSC 1
BICH 1
CECN 3
CEEN 1
BMCB 1
GENE 1
ENTC 1
WFSC 1
PHIL 1
MKTG 1
FSTC 1
CVEN 1
ENDS 1
KINE 1
CLSS 1
INEN 1
BMEN 1
BESC 1
RPTS 1

67. primaryMajorDept
Value Total
CSCE 7
ENGL 5
FINC 9
PSYC 12
POLS 3
CLLA 8
AGEC 5
MEEN 9
PHYS 1
CLVM 10
BIOL 7
ECON 2
NFSC 4
HISP 1
COSC 3
CHEN 12
GEOG 1
INFO 3
TLAC 3
COMM 4
SOCI 3
MATH 4
HLKN 2
AERO 7
MARB 2
CLBA 3
EAHR 2
ECEN 2
ATMO 1
VIZA 2
HIST 2
ANSC 1
BCBP 2

ETID 1
WFSC 1
PHUM 1
MKTG 1
CVEN 1
ARCH 1
EURO 1
ISEN 1
BMEN 1
PLPM 1
RPTS 1
68. primaryMajorCollege
Value Total
EN 41
LA 42
BA 16
AG 15
SC 12
VM 10
AR 6
GE 2
ED 7
GV 2
69. visaType
Value Total
J1 1
F1 4
OT 1
PR 1
[No Value] 146