centerforpbbefr.rutgers.educenterforpbbefr.rutgers.edu/2012pbfeam/papers/052-eff… · web...
TRANSCRIPT

Banking Efficiency in Gulf Cooperation Council (GCC) Countries: A Comparative Study
Sunil K. Mohanty*Opus College of BusinessUniversity of St. Thomas
Minneapolis, MN 55403,USAPhone: (651)-962-4416
Hong-Jen LinBrooklyn College
The City University of New YorkBrooklyn, NY 11210
Phone: (718) 351-5000 ext. [email protected]
Eid A. AljuhaniDepartment of EconomicsKing Abdulaziz University
Jeddah, Saudi [email protected]
and
Hisham J. BardesiDepartment of EconomicsKing Abdulaziz University
Jeddah, Saudi [email protected]
Revised Draft March 26, 2012______________________________________________________________________________* Corresponding author
1

Banking Efficiency in Gulf Cooperation Council (GCC) Countries: A Comparative Study
Abstract
We measure cost and profit efficiency of banks operating in six GCC countries (Bahrain, Kuwait, Oman, Qatar, Saudi Arabia, and the United Arab Emirates) for the period 1999-2010 using heteroskedastic stochastic frontier (HSF) models. We obtain measures of cost and profit efficiency and compare them across six GCC countries after allowing for heterogeneity in the inefficient component of error term as well as in the random noise term. We investigate the effects of bank size, equity capital-to-asset ratio, types of banks (Islamic versus non-Islamic banks) and ownership structure after allowing for differences in the inefficiency due to host countries’ regulatory and macro-environmental variables by using country dummies. Despite ongoing banking deregulations and reforms in GCC countries over the past two decades, the results of our study show that there is no discernible upward trend on cost or profit efficiency of banks during the 1999-2010 period. We find that Islamic banks are more likely to be less cost efficient but more profit efficient than non-Islamic banks. Banks operating in Saudi Arabia and Bahrain are more cost efficient than those that operate in Kuwait, Oman, Qatar, and the United Arab Emirates.
JEL Classification: G21, G28, G34, F23, F33
Key Words: Stochastic Frontier, Cost Efficiency, Profit Efficiency
Banking Efficiency in Gulf Cooperation Council (GCC) Countries: A Comparative Study
2

I. Introduction
Over the past two decades, the Gulf Cooperation Council (GCC) region1 has undergone
rapid economic, demographic and social changes. During the last decade, the world attention
has focused on GCC economies not only as exporters of oil and gas, but as investment
destinations with major infrastructure projects, booming tourism, and financial services sectors.
The financial systems in the Gulf region are primarily bank-based and capital markets are
relatively underdeveloped. Since 1990s, several reform policies have been undertaken to
liberalize financial markets, deregulate the banking sector, promote efficiency in the GCC
financial systems, and achieve regional economic integration.2 In addition, policymakers in GCC
countries have been working together toward the goal of establishing a single market and a
single currency by implementing monetary union among member states. The financial sector
reforms were aimed at promoting competitive, stable, and better- performing operating
environment of commercial banks that dominate GCC financial systems. In response to the
globalization of financial markets and institutions, commercial banks operating in GCC countries
have been emulating strategies of their Western counterparts by adopting new technology,
1 On May 25, 1981, six countries of the Arab Gulf region (Bahrain, Kuwait, Oman, Qatar, Saudi Arabia, and the United Arab Emirates) ratified the charter that established the Cooperation Council for the Arab States of the Gulf (GCC countries hereafter).2 In 2008, a GCC common market was established. It allows for citizens of any of the six countries to travel and trade freely within the region.
3

implementing advanced risk management systems, diversifying their product mix, and adhering
to international risk-based capital standards (Basel I, II and III ). As noted earlier, a major policy
objective of financial sector reforms in GCC countries is to enhance economic integration among
member states and promote an efficient banking system.3 Inextricably linked to this policy
objective is the improvement of the banking efficiency in GCC countries.
However, there has been relatively little research on banking efficiency in general and a
comparative study of banking efficiency in GCC countries, in particular.4 Therefore, the central
aim of this paper is to undertake a systematic and comparative study of cost and profit efficiency
of banks in GCC countries. We undertake a comparative study of cost and profit efficiency of
banks across six GCC countries using bank level quarterly data over the 1999-2010 period for
several reasons. First, as stated earlier, GCC countries had undergone a series of bank reforms
since early 1990s which dramatically changed the competitive structure and operating
environment of the banking industry in the gulf region. Second, while GCC countries achieved
significant economic development and integration throughout the 1990s and 2000s, there remain
3 GCC countries have deepened and the proportion of credit allocated to the private sector as a percentage of GDP has increased, indicating that banks in these countries have become more efficient in allocating financial resources in respective countries (e,g., see p. 113, Molyneux and Iqbal, 2005).4 For example, Ariss, Rezvanian, and Mehdian (2007) use a non-parametric approach and they compare and contrast the performance efficiency, technological progress and productivity growth of banks in GCC countries over the 1999-2004 period. Al-Muhrrani, Matthews, and Khabari (2006) investigate the market structure of Arab GCC banking over the 1993-2002 period.
4

substantial differences across individual economies. The macro- economic environment in which
GCC banking systems find themselves operating over the past decade vary greatly not only over
time, but also across six different member states. Third, Berger et al. (2000) emphasize the
importance of estimating both cost and profit efficiencies of banks in evaluating bank
performances.5 The evolution of banking sector reforms provides a unique opportunity for the
measurement of cost and profit efficiencies of individual banks operating in GCC countries.
Finally, to our knowledge, this is the first comprehensive study that examines both cost and
profit efficiencies of individual banks operating in GCC countries using a hetroskedastic
Stochastic Frontier Analysis (SFA)6 based on panel data7.
5 Hughes and Mester (2008) provide an excellent literature review on theory, practice and evidence of efficiency in banking.6 There are several advantages using SFA over Data Envelopment Analysis (DEA): (1) SFA is based on a parametric (econometric) approach that distinguishes between inefficiency and other stochastic shocks, and therefore, it can be considered superior to non-parametric approach such as the DEA (Yildirim and Philippatos, 2007); (2) prior research suggests that if one attempts to identify the impact of regulatory environment on banks’ cost and profit efficiency over time, then efficiency is better studied and modeled by combining the use of SFA with panel data ( e.g., Baltagi and Griffin, 1988; Cornwell et al., 1990; and Kumbhakar, 1993); (3) the DEA does not suggest the cause or identify the determinants of inefficiencies.7 The use of SFA with panel data provides more degree of freedom in the estimation of parameters. Given the possibility that managers may learn from prior knowledge about the production process, inefficiency may change in some persistent pattern over time (Coelli et al., 1999). In addition, regulatory or environmental factors may affect the performance of banks over time. Further, it is argued in the literature that measures of bank efficiency (cost and profit efficiency) based on the parametric efficiency scores may contain additional information about the bank performance compared to the DEA efficiency scores (e.g., Berger and Humprey, 1991; and Bauer et al., 1998) and thus, the SFA with panel data is considered to be appropriate for evaluating bank efficiency for specific set of N firms (e.g., Lang and Welzel, 1996; and Altunbas et. al., 2000).
5
The remainder of the paper is organized as follows: Section 2 compares the Islamic versus
conventional banking in GCC countries. Section 3 reviews the literature on banking efficiency.
Section 4 develops a theoretical foundation for estimations of cost and profit efficiencies of
banks using a single-step heteroskedastic stochastic frontier (HSF) model. Section 5 describes
data and variables used in the study. Section 6 discusses empirical results, and Section 7
concludes with a summary of findings of the study.
2. Islamic Banking versus Conventional Banking in GCC Countries
GCC countries own abundant sources of crude oil so they have accumulated huge amount
of foreign currencies. They have been known as major crude oil exporters and wealthy countries
worldwide. Islamic banking is an important feature of the financial sectors in GCC countries.
Indeed some Muslim countries have considered converting their entire banking sector to Islamic
principles. Islamic banking is guided by Shariah8 principles which prohibit interest payment
(riba). Islamic banks use profit-and-loss sharing (PLS) instruments9 which do not guarantee a
pre-determined profit to depositors, and Islamic banks offer some fee-based services.10 In
8Shariah is the Islamic Law and is based on the Quran. In some countries it is recognized as a source of legal law.9Mudarabah and Musharakah are some contracts that are based on the profit-and- loss sharing technique (PLS). In Mudarabah an investor (usually an Islamic bank) and an entrepreneur (individual or institutional) enter a joint venture where the investor provides the necessary funds and the entrepreneur provides knowhow. Both parties ex-ante agrees to a profit-sharing plan. Murabahah, in contrast, is a contract based on cost-plus-profit approach. 10 Fee-based services include the widely used contracts of Murabahah and Ijarah. The bank arranges to sell a good to a customer and it charges a risk-adjusted fee. Ijarah is a lease contract where the bank leases an asset to a customer who pays fees to use the asset.
6

contrast, conventional banks (both commercial and investment) earn profits through the
implementation of interest on deposits where they offer a small interest rate, and loans where
they charge a higher interest rate.
Demand for Islamic financial products grew as a consequence of the wealth accruing to
Muslims during the 1970s oil boom. The first Islamic bank founded (the Dubai Islamic Bank) in
1975 offered only the most fundamental contracts such as safekeeping accounts, sale and PLS
contracts. The first Islamic equity funds were launched in the early 1990s. These were the
Islamic response to the conventional mutual and hedge funds. In the late 1990s, ‘takaful’ was
introduced allowing the privilege of Shariah compliant life insurance to millions of Muslims.
The dawn of the 21st century witnessed the launch of Islamic indexes from Dow Jones, FTSE
and more recently from S&P, so that investors could track the performance of firms that comply
with Islamic law. These days, many Islamic banks offer credit cards and allow their customers
to have overdraft facility despite the fact that it was considered completely unlawful a few years
ago. Moreover, Islamic banks have been investing significant resources in the implementation of
Internet, mobile phone and telephone banking. In some more liberal countries such as the UAE,
Islamic banks have gone a step further by introducing special privileges for women clients
following conventional practices (Dubai Islamic Bank website).
7

Furthermore, the traditional values of Islamic finance have had an increasing appeal to
Western investors who were disillusioned with the banking practices of conventional banks in
the wake of the global financial crisis. Islamic banks are therefore no longer only a feature of
traditional Muslim regions. Today, there are more than 300 Islamic financial institutions spread
across 70 countries of the world. Thus, increased globalization coupled with growing attraction
of Islamic finance worldwide has led to direct competition between Islamic and conventional
banks. Since the growth, efficiency and competitive environment of the financial sector are vital
for economic integration and development of GCC countries, it is important to assess efficiency
of Islamic banking compared to conventional banking across six GCC member states in gulf
region. Of particular importance of our study is the source of any efficiency difference between
conventional banks and Islamic banks.
3. Literature Review
A large body of literature spanning over the past three decades addresses banking efficiency
in the United States (e.g., Berger and Humphrey, 1997; Berger and Strahan, 1998) and Europe
(e.g., Allen and Rai, 1996; Pastor, Perez, and Quesada, 1997; Altunbas, Gardener, Molyneux,
and Moore, 2001), and more recently, literature on banking efficiency in the Asia-Pacific region
is developing (see Bhattacharya, Lovell, and Sahay, 1997, for India; Rezvanian and Mehdian,
2002, for Singapore; Sathye, 2003 for India; Berger, Hasan, and Zhou, 2010; and Lin and Zhang,
8

2009 for China). Prior studies examine effects of bank reforms on efficiency in transitional
economies (e.g., Bonin, Hasan and Wachtel, 2005, for transition countries in Eastern Europe;
Havrylchyk, 2006, for Poland; Yildirim and Philippatis, 2007, for transition countries in Eastern
Europe; Hasan and Marton, 2003, for Hungary). The empirical literature provides mixed
evidence regarding the impact of bank reforms on cost and profit efficiency of banks in emerging
markets. For example, Bonin, Hasan and Wachtel (2005) find that domestically owned private
banks are not significantly more efficient than government owned banks in Central and Eastern
European countries. In contrast, Yildirim and Philippataos (2007) report that domestically
owned private banks and state-owned banks are less cost efficient, but more profit efficient
relative to foreign banks in transition countries. El-Gamal and Inanoglu (2005) investigate efficiency
of Turkish banks over 1990-2000 period and find that efficiency of conventional banks are similar to
Islamic banks. Havrylchyk (2006) finds that foreign banks that acquired domestic banks do not
enhance efficiency. Berger, Hasan and Zhou (2010) and Lin and Zhang (2009) find that the Big
Four state-owned banks are less profit efficient.
However, the literature evaluating the effects of financial sector reforms on banking
efficiency in GCC countries is relatively scant. Darrat et al. (2003) estimate efficiency of banks
operating in Kuwait over the 1994-1997 period, using the Data Envelopment Analysis (DEA)
approach. Their study finds that the overall efficiency of banks in Kuwait is on average 68% and
9

the source of inefficiency is attributed to a combination of allocative and technical efficiency.
Grigorian and Manole (2005) examine the technical efficiency of four of six GCC countries:
Baharain, Kuwait, Qatar, and UAE relative to their Singapore counterparts. Their study finds that
bank in Bahrain on average are more technically efficient compared to GCC countries. Ariss,
Rezvanian, and Mehdian (2007) compare and contrast the cost efficiency, technological progress
and productivity growth of banks in GCC countries using a non-parametric frontier approach for
the 1999-2004 period. Their results show that bank in Oman on average, have been the most
efficient among GCC countries followed by banks from Bahrain and to a lesser extent by banks
from Kuwait.
4. Methodology
Although several methods are available to measure efficiency in banking, the Stochastic
Frontier (SF) approach introduced by Aigner, Lovell, and Schmidt (1977) and Meeusen and van
dan Broeck (1977) has received increased attention among researchers over the last two decades
(e.g., Cebenoyan, 1990; Ferrier and Lovell, 1990; Greene, 1993; LeCompte and Smith, 1990;
Bauer, 1990; Berger and Humphrey, 1991; Weiss, 1991; Berger, 1993; Mester, 1993; Allen and
Rai, 1996; Mester, 1996; Rai, 1996; Resti, 1997). Using the SF approach, we investigate the
effects of bank size, equity capital-to-asset ratio, types of banks (Islamic versus non-Islamic
10
banks) and ownership (private versus government) and credit quality of investment portfolios on
cost and profit efficiency of banks operating in six gulf countries.
We recognize that we need to use appropriate stochastic frontier models to estimate either
cost or profit efficiency of banks after allowing for differences in Islamic banks and conventional
banks operating in GCC countries. It is likely that Islamic banks may have different objectives
and operational characteristics from conventional banks. For example, the prohibition of
conventional interest bearing financial instruments and loans can limit certain banking activities
which may have an adverse effect on potential outputs and banking efficiency. In addition,
Islamic banks use the equity participation principle indicating that Islamic banks depend on
equity as a major source of funding. Following Abdul-Majid, Saal, and Battisti (2010), we
include equity-to-asset ratio as an input variable and we control for Islamic banking as a bank-
specific characteristic that may directly influence the estimated cost or profit inefficiency.
Next, we consider the specification of an appropriate SF model to estimate cross-country
banking efficiency. While some studies don’t control for any environmental variables (Allen and
Rai, 1996; and Altunbas et al., 2001), other studies do account for environmental factors (e.g.,
Bonin et al., 2005 and Carvallo and Kasman, 2005). Following Fries and Taci, 2005; and
Williams and Nguyen (2005), we argue that environmental variables are influenced by country-
specific regulatory environment and macro-economic conditions, including the level of
11

economic development across six countries. Thus, a common stochastic frontier without controls
for country-specific factors is likely to be misspecified due to varying degree of bank regulation
and the use of different banking technology.11 In this paper, we use country dummies in our
model to control for country-specific factors.
In the following section, we focus specifically on methodological approaches employed in
stochastic frontier analysis (SFA). The stochastic cost frontier model uses a parametric approach
which requires a separation of random errors from the systematic error component of a specified
cost function. This entails the specification of a particular distribution form. The basic model
assumes that a firm’s observed cost deviates from the optimal cost due to a random noise, vi ,
and an inefficiency component , ui . Thus, the cost function for N firms in the sample is written
as:
C i=f ( y i ,p i ; β )+ui+v i , i = 1……………..N, (1)
Where vi
is a two-sided error term representing the statistical noise and ui
is a one-sided error
11 Carvallo and Kasman (2005) document a wide range of estimates of inefficiency across countries. Bonin et al. (2005) find that country-specific factor is significant in explaining differences in inefficiency measures.
12

term that measures inefficiency of a firm that represents the individual firm’s deviation from the
efficient cost frontier. It serves as a proxy for both technical and allocative inefficiency. is the
logarithm of the observed cost of banks; is a vector of outputs; is a vector of input prices;β
is a vector of parameters. The predicted log cost function of a cost-minimizing firm, f (¿ )
is
assumed to be operating at output level and input prices . The basic SF model (1) assumes
that the noise term vi is independently and identically distributed and
ui is distributed
independently of vi
. Further, it is assumed that vi
is normally distributed with a mean zero and
constant variance, vit ~ N (0 , σ v
2 ), and the
ui is half-normally distributed, meaning the
ui is the
absolute value of a variable that is normally distributed with a mean zero and constant variance,
. With these distributional assumptions, the basic stochastic econometric cost
13

frontier model can be estimated using maximum likelihood techniques. Once the model is
estimated, inefficiency measures can be estimated using the conditional mean of the inefficiency
term,ui
, as proposed by Jondrow et al. (1982) or Greene (1993). A vast number of studies on
measuring efficiency in banking rely on the basic stochastic cost efficiency frontier model (1)
described above and use a “two-step” approach (see Murray and White, 1983; Mester, 1987 and
1993; Cebenoyan, 1990; LeCompte and Smith, 1990; Berger and Humphrey, 1991; Weiss, 1991;
Allen and Rai, 1996; Rai, 1996; Resti, 1997; among others) and document that estimated cost
efficiencies of banks are correlated with bank-specific as well as environmental factors.
There are several issues associated with estimates of standard stochastic econometric cost
frontier model (the basic SF model described above). First, the estimation based on model (1)
can lead to incorrect inferences because it doesn’t account for heteroskedasticity in the
inefficiency component of the error term, ui (e.g., Caudill and Ford (1993), Caudill, Ford, and
Gropper (1995) and Mester (1997). Second, it is likely that the inefficiency error term (ui )
depends on firm characteristics such as size, equity-to-asset ratio, type of banks (Islamic or
conventional banks), ownership (private versus public), loan quality, as well as country-specific
14

environmental factors. Third, prior studies that estimate cost or profit efficiency using a two-step
procedure12 are likely to have produced biased estimates (e.g., Huang and Liu, 1994; Battese and
Coelli, 1995; Wang and Schmidt, 2002).13
In the following section, we develop a generalized stochastic dynamic frontier model to
account for heteroskedasticity in the inefficiency component as well as the error term. Then we
use a single-step estimation strategy to circumvent the above-mentioned problems associated
with traditional SF models.
4.1 Heteroskedastic Stochastic Frontier Model for Estimating Cost Efficiency
In this study, we propose a two-equation generalized stochastic frontier model that
accounts for heteroskedasticity. Consistent with Battese and Coelli (1995) and Wang and
Schmidt (2002) studies we follow the single-step estimation of the parameters of the cost
function as follows:
12 For example, see Allen and Rai, 1996; Rai, 1996; Berger and DeYoung, 1997; Berger and Mester, 1997; Resti, 1997; DeYoung and Hasan, 1998; Lieu et al., 2005; Berger, Hasan, and Zhou, 2010, among others use two-step approach to estimate cost or profit efficiency.13 Wang and Schmidt (2002) show that the two-step estimation procedure can lead to biased results for two reasons. First, the model estimated in the first step is misspecified if input prices (e.g., cost of labor and cost of capital) and firm characteristics (e.g., size, ownership, and loan quality) are correlated. Second, they argue that if the dependence of inefficiency on firm characteristics is ignored, the estimated firm-level efficiencies are “spuriously under-dispersed”, which causes the second-step estimate of the effect of firm characteristics on inefficiency to be biased downward. Wang and Schmidt (2002) also provide Monte Carlo evidence showing that the bias related to the two-step estimation procedure can be very severe. For example, see Wang and Schmidt (2002) for a detailed discussion on “Why is the Two-Step Estimator Biased?”
15

C it=f ( y it ,p¿ ;β )+v it+u it , and (2.1)
uit ~ N + (μ ,σuit2) (2.2)
vit ~ N (0 , σvit2 ) (2.3)
μit=zit α (2.4)
σ uit2 =exp( zit ' ω ) (2.5)
σ vit2 =exp( z it ' θ ) (2.6)
Where zit is a broad set of bank-specific factors and α, ω and θ are corresponding coefficient
vectors.
Our generalized stochastic dynamic model, which aims at minimizing model mis-
specifications differs from Battese and Coelli (1995) and Wang and Schmidt (2002) in two ways.
First, we incorporate the firm-specific time effects in the model using a cross-sectional time
series or panel data. The zit vector in the Equation (2.4) represents a wide range of factors
including firm-specific factors (Mester, 1993; Allen and Rai, 1996; Rai, 996; Miller and Noulas,
16

1997; Shao and Lin, 2000).14 Second, we use a flexible distribution (see equations 2.2 to 2.6) for
the inefficiency component of the error term ( ) to account for heteroskedasticity in and vit .
While heteroskedasticity may only affect estimation efficiency in a linear regression model, it
leads to biased estimates in the SF model because part of the error term ( ) is asymmetrically
distributed (e.g., Caudill and Ford, 1993; Caudill, Ford, and Gropper, 1995). In our equation
(2.2), has a truncated normal distribution with a non-constant variance. The variance of is a
function of firm-specific variables and it varies with time. Thus, our model allows the variance
of to be observation-specific. The specification of our model based on equations (2.1) to
(2.6), represents an important and significant departure from the previous research. In particular,
our approach makes the inefficiency measure a dynamic and stochastic variable. The model
14 Kumbhakar and Hjalmarsson (1995) emphasize that the failure to include firm-specific
variables in the SF model is likely to bias the estimate of the one-sided error, , which is one of the important elements of the estimation process. The reason for the bias is that the measure of inefficiency is based on the composite error term, which in turn is influenced by the parameter estimates of the frontier model.
17
allows us to use panel data at the firm-level to study if and how the cost inefficiency responds to
the elements ofzit .
4.2 Heteroskedastic Stochastic Frontier Model for Estimating Profit Efficiency
In the case of the profit function, the selection of output price variables depends on whether
we assume the existence of market power of a bank in setting of output price (e.g., Berger and
Mester, 1997; and Akhavein, Berger, and , 1997). The standard profit frontier model assumes the
existence of perfect competition in the markets for outputs and inputs; and in principle, the
model requires information on the prices of the output vector, which in most cases is not
available. Hence, most studies estimate an alternative profit frontier similar to the one developed
by Berger et al. (2000). The alternative profit frontier model assumes that an imperfect
competition exists with a given quantity of outputs and price of inputs. The goal of the bank is to
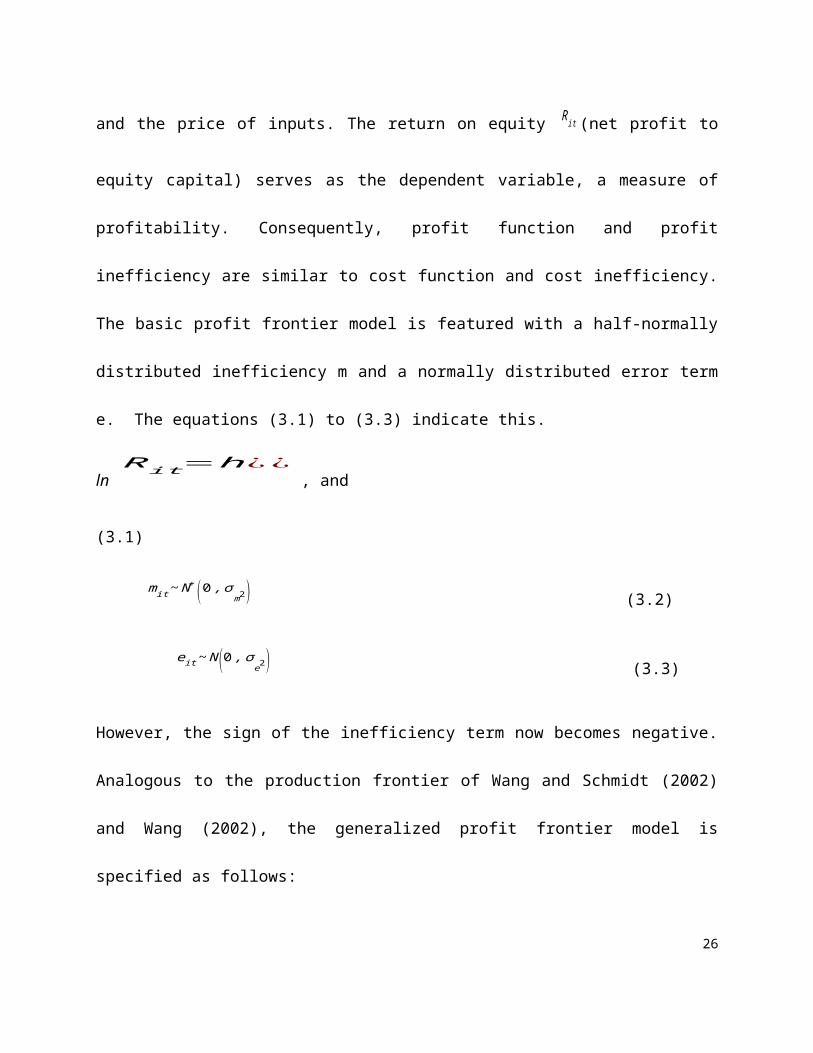
maximize profits by adjusting the quantity of outputs and the price of inputs. The return on
equity Rit (net profit to equity capital) serves as the dependent variable, a measure of
profitability. Consequently, profit function and profit inefficiency are similar to cost function and
cost inefficiency. The basic profit frontier model is featured with a half-normally distributed
inefficiency m and a normally distributed error term e. The equations (3.1) to (3.3) indicate this.
18

lnRit=h¿¿
, and (3.1)
mit ~ N+ (0 , σm2) (3.2)
e it ~ N (0 , σ
e2) (3.3)
However, the sign of the inefficiency term now becomes negative. Analogous to the production
frontier of Wang and Schmidt (2002) and Wang (2002), the generalized profit frontier model is
specified as follows:
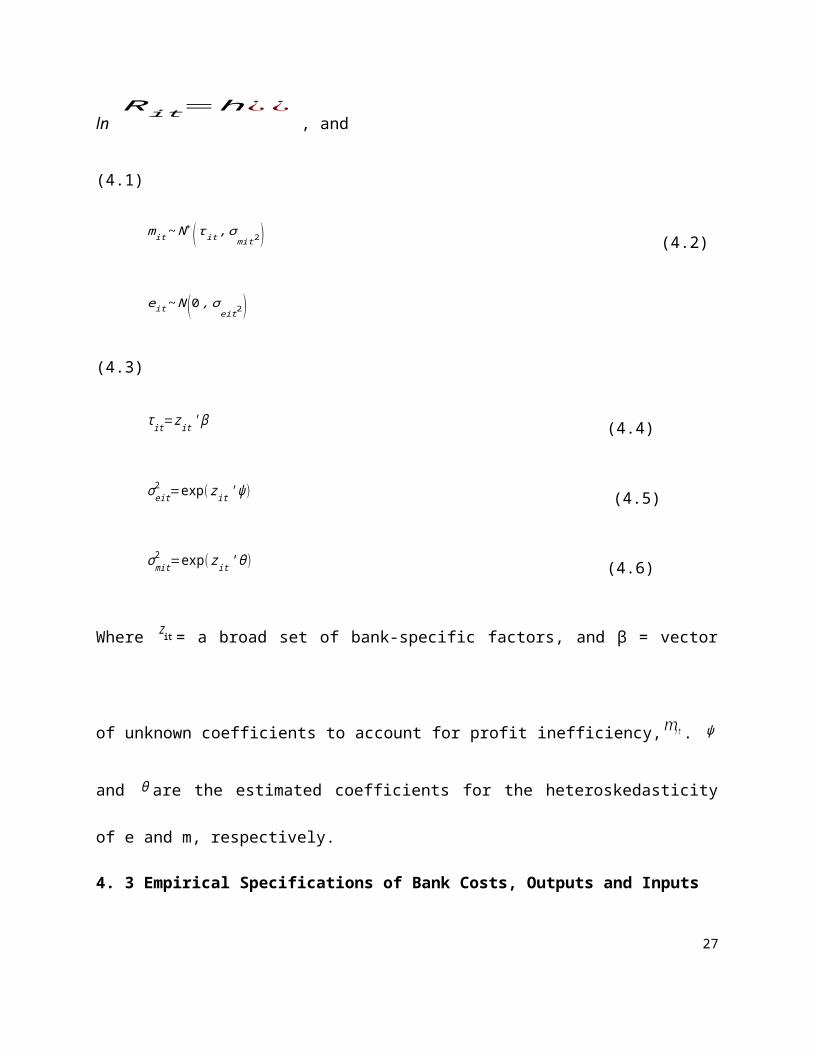
lnRit=h¿¿
, and (4.1)
mit ~ N+ ( τ it , σ mit2) (4.2)
e it ~ N (0 , σeit 2) (4.3)
τ it=zit ' β (4.4)
σ eit2 =exp( zit ' ψ ) (4.5)
σ mit2 =exp( zit ' ϑ ) (4.6)
19

Where zit = a broad set of bank-specific factors, and β = vector of unknown coefficients to
account for profit inefficiency, . ψ and ϑ are the estimated coefficients for the
heteroskedasticity of e and m, respectively.
4. 3 Empirical Specifications of Bank Costs, Outputs and Inputs
There is considerable disagreement in prior literature on the definition of cost, outputs, and
inputs for a bank. Two approaches have been suggested: an “intermediation approach” and a
“production approach”.15 We use the intermediation approach for several reasons. First,
commercial banks are considered financial intermediaries. Second, the intermediation approach
is relevant to the measurement of cost (profit) efficiency because an efficient bank would
minimize the total operating costs for any given output (maximize total profit for a given level of
total operating costs). Finally, the intermediation approach is consistent with Islamic banks
which rely on profit-sharing contracts (investments) via an equity participation principle with
depositors (savers). Therefore, an Islamic bank can be perceived as an intermediary by
transforming deposits made by savers into investment contracts.
The dependent variables for cost frontier and profit frontier are TC (total costs) and NI (Net
income). Three output variables Y1, Y2, and Y3 (net loans, security investments, and other
15 See Berger, Hanweck and Humphrey (1987) for a detailed discussion on the issue.20

earning assets respectively) are used in this study. Three input price variables p1, p2, and p3
(cost of funds, cost of labor, and cost of fixed costs respectively) are considered. To allow for
variation in the banking sector reform and related institutional developments across banks,
several firm-specific factors are included as control variables in our model. Following prior
literature, we use following firm-specific control variables: NPL (the ratio of non-performing
loans to total gross loans) as a proxy for credit risk, TIER1 (Tier-1 risk-based capital ratio) as
proxy for insolvency ratio, CAPITAL (the ratio of the total capital reserves to total loans),
ASSET (total assets) as a proxy for bank size, BORROW (total borrowed funds excluding
borrowing from banks) and EA (the total equity to total asset ratio) as proxy for leverage ratio
(e.g., Allen and Rai, 1996) as well as source of funding for Islamic banks. (e.g., Abdul-Majid,
Sall, and Battisti, 2010).
Seven dummy variables are used as proxies for environmental variables. The ISLAM
dummy equal to one indicates a bank fully or partially follows Islamic rules. Otherwise, ISLAM
equals zero. PRIVATE is one for a bank is classified as privately owned; otherwise, PRIVATE=0
(e.g., Altunbas, Evans, and Molyneux, 2001; Berger, Hasan, and Zhou, 2010); The dummies BR,
KU, OM, QA, and SA equal to one to represent the country (Bahrain, Kuwait, Omen, Qatar, and
Saudi Arabia) where a bank is located. When the all five country dummies equal zero for a bank,
the bank is located in the UAE (the base country). Similarly, the UAE serves as the base country
21

when we estimate our efficiency results based on stochastic frontier analysis.
In addition to country dummy variables, year dummy variables are included to control for
the economic impact attributed to different periods respectively. The cost function of equation
(2) takes a translog form, so the f-function is
f =β0+∑k=1
2
β1k ln pkit+∑s=1
3
β2s ln y sit+12 ∑
k=1
2
∑k '=1
2
β3kk' ln pkit ln pk ' it
+ 12∑s=1
3
∑s'=1
3
β4ss' ln ysit ln ys ' it+∑k=1
2
∑s=1
3
β5ks ln pkit ln ysit +α1 Dt . (5)
Where D is the year dummy variable.
Finally, cost inefficiency,uit , is not a good measure. Consistent with Berger et al. (1993),
this study calculates the cost efficiency (CEit ) via uit as follows:
CEit=cos t efficiency it=exp (u itmin−uit ) , (6)
Where uitmin
is the minimal uit and is used as the benchmark to calculate the comparative
efficiency for t=1, …, T (periods) and i= 1, …, N (banks). All estimates of the cost efficiency
calculated from equation (6) fall between zero and one. Similarly, the profit function can be
specified:
22

h=β0+∑k=1
2
β1k ln pkit+∑s=1
3
β2s ln ysit+12 ∑
k=1
2
∑k '=1
2
β3kk' ln pkit ln pk ' it
+ 12∑s=1
3
∑s'=1
3
β4ss' ln ysit ln ys ' it+∑k=1
2
∑s=1
3
β5ks ln pkit ln ysit+αD t . ... (7)
The specification (7) has been defined in Berger et al. (2000). Profit efficiency (PEit ) is
defined as: PEit = exp(-mit ). (8)
We pool cross-sectional and time-series data for our sample banks to measure cost and
profit efficiency of banks operating in six GCC countries. We estimate the generalized stochastic
cost frontier model (equations 2.1 to 2.6) and the profit frontier model (equations 4.1 to 4.6)
based on a “single-step” method using the LIMDEP program developed by Greene (1993) and
the STATA program developed by Wang and Schmidt (2002).
5. Data
Our sample includes data (ended at December 31 for each year) for 45 banks from six
GCC countries (Bahrain, Kuwait, Omen, Qatar, Saudi Arabia, and the United Emirates of Arab).
Annual bank-level data are collected from the BankScope database for the period 1999-2010
resulting in an unbalanced panel of 504 observations, with 42 of these observations being for
Islamic banks.16 However, the length of the time period for individual bank varies from bank to
16 BankScope database does not provide complete data for all Islamic banks operating in these six GCC countries. Hence those banks with incomplete information are dropped from our sample.
23

bank depending on the availability of data. Table 1 lists the sample distribution of banks by type
of bank (Islamic, conventional or mixed), and by type of ownership (private, government, or
mixed) for each of the six gulf countries. In our sample, only Bahrain Saudi Bank , Qatar
International Islamic Bank, Bank Al-Jazira, and National Commercial Bank are Islamic, while
National bank of Bahrain , Alahli Bank of Kuwait, Burgan Bank, Gulf Bank, National Bank of
Kuwait, Bank Dhofar , Bank Muscat, National Bank of Oman, Oman International Bank, Qatar
Development Bank, Arab Bank for Investment & Foreign Trade, and Bank of Sharjah are
conventional. All other banks are mixed with Islamic and conventional banks. Most banks in
our sample are privately owned except Qatar Development Bank. However, the governments
(local or central) are major owners for several banks in these countries. For instance, National
Bank of Abu Dhabi is featured with 70.6% government ownership, National Bank of Dubai
Public Joint Co. with 55.6%, National Bank of Fujairah with 54.41%, National Bank of Umm
Al-Qaiwain with 30%, according to Bankscope.
[Table 1 about here]
Table 2 lists dependent variables, input and output variables, bank-specific factors, and
dummy variables. The interaction terms in the translog functional form are provided in Table 2.
[Table 2 about here]
6. Empirical Results
24

We find that our sample banks operating in Gulf countries include conventional (i.e.,
Western style); Islamic or mixed banks. As mentioned earlier, the major difference between
Islamic banking and conventional banking is the application of the “usury law”. Typically,
conventional banks profit from interest spread between deposits and loans, which is forbidden in
the Islamic law. Islamic law allows banks to collect fees and make profit from the difference of
the purchase price and sale price of securities. But it prohibits them from earning money by
collecting interest on loans. Therefore, it is likely that characteristics of sample banks will vary
not only across countries within the Gulf region, but also between sample of Islamic banks and
non-Islamic banks.
Table 3 presents means and standard deviations of selected output and input variables,
input prices and bank-specific characteristics for all GCC banks as well as individual GCC
countries. The average size of banks measured by total assets differs considerably across GCC
countries. Saudi banks are the largest among GCC countries followed by Bahrain, and UAE. The
banks in Saudi Arabia are also largest among banks in our sample in terms of outputs and total
costs. They also enjoy lowest cost of funds (P1). The average cost of funds for Saudi banks is
2.68% while the average cost of funds for banks in Bahrain is 5.20%, highest among all GCC
countries. NPL(non-performing loan ratio) represents the credit risk of the loan assets. Banks in
Saudi Arabia also enjoys lowest NPL(5.07%) among six nations while Oman has highest NPL
25
(13.27%) followed by Bahrain (9.05%) indicating that on average, banks in Oman have the
highest level of credit risk exposure among six GCC countries.
Saudi Arabia also has highest EQUITY, BORROW and NI. These results indicate that the
bank size is correlated with higher level of equity participation, borrowed funds, net income.
Qatar is featured with highest CAPITAL and TIER1. These results suggest that on average, the
loan and securities portfolio held by banks in Qatar are the riskiest among all six countries.
Results reported in Table 3 suggest that on average, banks in Oman have the lowest loan loss
reserve ratio (CAPITAL) and the lowest tier1 risk-based capital ratio (TIER1) sample. Overall,
banks in Oman appear to be riskiest because they have the highest NPL with the least Tier1 risk-
based capital ratio and the least loan loss reserve ratio among all GCC countries.
[ Table 3 about here ]
The average size of banks in Oman is the smallest among six GCC countries. Oman has the
lowest mean of TC ($153.05 million) and the lowest mean of NI ($68.31 million). Also, output
variables (Y1, Y2 and Y3) for Oman are the smallest. Its ASSETS is $1377.16 million, which is
also the lowest across these six Gulf nations. The UAE is the “average” country in this study. Its
means of the output variables, TC, and input prices are very close to those variables for the
whole sample.
Table 3 also compares the differences between Islamic banks and non-Islamic banks. The
26
mean of TC for Islamic banks is $518 million over that for non-Islamic banks. For the three
output variables, the means of them in the Islamic bank group are more than those in the non-
Islamic bank group (Y1, 8467.01 vs. 4447.23; Y2, 8067.31 vs. 4786.12; and Y3, 5241.59 vs.
1518.37; all in million dollars). In addition, Islamic banks enjoy lower cost of funds, cost of
labor, and cost of fixed assets (P1, P2, and P3). For P1, Islamic bank claims lower cost at 3.53%
below the counter part of non-Islamic bank, 3.96%. Nevertheless, the standard deviations for
both bank groups are large and the difference of means between them is insignificant. The cost of
labor (p2) for the Islamic bank is in general lower (1.26% vs. 2.42%) than that of non-Islamic
banks.
The comparison between government-owned and non-government owned banks is also
displayed in Table 3. In terms of TC, Y1, Y2 and Y3, government-owned banks are smaller than
the non-government counterparts. In other words, in the GCC countries, non-government owned
banks may have on average higher total costs, total loans and security investments than the
government owned ones. Nevertheless, among government owned banks, the amounts of TC, Y1
and Y2 vary a lot when the standard deviations of these three variables are pretty large. Similarly,
the ASSET, BORROW and NI for government owned banks are smaller than those for non-
government owned ones. Overall, government-owned banks are smaller than non-government
owned banks in those variables.
27

In addition, the government owned banks are featured with higher NPL (8.20% vs. 7.47%)
and higher TIER1 and CAPITAL (32.40% and 33.46% vs. 16.07% and 18.67% for non-
government ones). That is, in comparison with non-government owned banks, government-
owned banks are likely to have higher proportion of non-performing loans, but they keep the
high capital reserves to buffer for the potential credit risks. This result is not surprising because
the objective function of government-owned banks is likely to be different from private on non-
government owned banks.
Table 4 presents a summary statistics of cost efficiency indices for each of the six GCC
countries in each year over the 1999-2010 period. Over the same period, the Table 4 also
displays the mean of cost efficiency indices for all six countries in the Gulf region for each year.
For example, the mean of overall efficiency scores for all banks in GCC countries in 1999 was
79.16%, while the same in 2010 was 73.56%, indicating that GCC banks on average could have
saved 26.44% of their actual total costs in the year 2010 had they have been operating on the
common efficient frontier. Cost efficiency scores reported in panel A of Table 4 suggest that cost
efficiency of banks vary across six countries and over time during 1999-2010. However, we do
not observe a discernible trend (upward or downward) in cost efficiency scores of any of the six
GCC countries over the 1999-2010 period.
[ Table 4 about here ]
28

In Panel B (Table 4), we also observe mixed patterns among Islamic, conventional, and
mixed bank groups. From 1999 to 2001 and 2006 to 2007, Islamic banks are more cost efficient
than the conventional and mixed banks. However, from 2008 to 2010, conventional banks
become the most cost-efficient among three groups. The results reported in Panel C of Table 4
show that government owned banks outperform non-government owned ones in terms of cost
efficiency except for the year 2000.
Table 5 displays the time varying patterns of profit efficiencies of banks for each country
and for the Gulf region. Cost efficiency indices reported in Table 5 (Panel A) indicate that banks
in Oman have been the most profit efficient among GCC countries during 1999-2010. Over the
same period, Saudi banks have been the least profit efficient among six Gulf nations.
[ Table 5 about here ]
Panel B in Table 5 depicts the differences among Islamic and conventional banks and mixed
banks. Conventional banks are the most profit efficient group among these three except for the
years 2006 and 2008. Most banks profitability as well as their profit efficiencies declined from
2007 to 2008 because of the occurrence and the spillover of the financial crisis from the US in
2008. As can be seen in Table 5 (Panel B), the profit efficiency of conventional banks fell
quickly from 94% to 41% between 2006 and 2008, and then recovered back to 90% during 2009-
2010. Both Islamic and mixed banks also suffered from the decline in lending due to global
29

financial crisis, but the profit efficiency bounced back during 2009-2010. Nevertheless, profit
efficiencies of Islamic banks did not fall as deeply as that of the conventional banks. Panel C in
Table 5 shows that government owned banks are more profit efficient than non-government
owned banks. It is worth noting that the profit efficiency of the non-government owned banks
dropped dramatically during 2007- 2008 crisis period from 87% to 63% while the profit
efficiency of the government owned banks are quite stable over the whole time period under
study.
Table 6 shows the single step heteroskedastic SF results. Since the estimation of frontiers is
sensitive to the specifications of the models, two different sets of variables in z are used with a
common stochastic frontier. Except for the constant terms, the lnP3 is the only common
significant estimator among output variables. That is, the total cost increases with an increase in
the amount of total loans. Generally speaking, even though the estimators from the first
specification differ from the second one, the directions of impact and statistical significance are
the same for the cost functions. The major differences between two specifications exist in the
country dummies and the z variables (i.e., components of the mean of u and components of the
variance of u).
[ Table 6 about here ]
30

In the first specification, EA (equity to asset ratio) is negatively related to the cost
inefficiency u. Hence, the higher EA a firm has, the less the cost efficiency a firm will enjoy. The
equity-to-asset ratio (EA) is also significantly positively related to variance of inefficiency, (u).
Among the country dummies, only SA (Saudi Arabia) is positively related to the variance of u,
indicating greater volatility of the cost inefficiency of Saudi banks. In addition, the size proxy is
negatively related to the variance of cost inefficiency (u), so larger firms more likely to enjoy
lower volatility in cost inefficiency.
The second specification shows ISLAM (proxy for Islamic banks) is positively related to
the mean of cost inefficiency (u) and it is significant at 1% level. While the use of Islamic
banking may lead to higher cost efficiency, it may not significantly increase its volatility of the
cost inefficiency. Moreover, SA (Saudi Arabia) is significantly negatively related to the mean of
u (at the 1% level) so the cost efficiency of the banks in SA may be higher than those from the
other five countries. Lambda and Sigma, both the main parameters of u, are also significant at
the 5% and 1% level of significance, which signals the cost inefficiency term u is well defined.
The profit frontiers and efficiencies are estimated via the single step heteroskedastic
stochastic frontier approach. The results are displayed in Table 7. In the first specification, we
observe that the mean of profit inefficiency (u) is negatively associated with equity-to-asset ratio
(EA) and positively related to the TIER1. That is, the higher EA helps increase the profit
31

efficiency and the core capital risk-based ratio (TIER1). Higher equity ratio can lead a bank to
achieve low leverage risk, and greater profit efficiency. NPL and SIZE variables are significantly
positively related to the variance of profit inefficiency, indicating that larger banks with higher
credit risk are more likely to experience high volatility in their profit inefficiency. On the other
hand, the equity-to-asset ratio is significantly negatively related to the variance of profit
inefficiency. This implies that banks with higher EA will have lower risk of insolvency.
[ Table 7 about here ]
Finally, we estimate cost efficiency and profit efficiency for each bank in GCC countries and
list the results in Table 8. The measure of cost efficiency ranges from 0.5645 (National Bank of
Dubai Public Joint Co.) to 0.9999 (Arab Bank of Investment & Foreign Trade). The estimation
of profit efficiency ranges between 0.3547 (Gulf Bank) and 0.9629 (Bank of Sharjah). We find
that most cost efficient banks don’t necessarily enjoy higher level of profit efficiency. Table 8
lists rankings of banks based on the cost efficiency (see column 3) as well as on the profit
efficiency (see column 5). For instance, Ahli United Bank BSC enjoys high profit efficiency
(0.9323) and is ranked No. 8; but it has much lower cost efficiency (0.7258) with a low rank (No.
41).
[ Table 8 about here ]
32

In contrast, Gulf bank which is ranked high (No. 4) in terms of cost efficiency is ranked the
lowest (No. 45) in terms of profit efficiency. Prior studies on bank efficiency suggest that it is
important to consider rankings of both cost and profit efficiencies (see Berger et al., 2008). For
example, some banks can be more profitable by providing financial services that are costly but
generate higher net revenue. The Column (6) in Table 8 shows the rankings of bank efficiency
based on the sum of ranks for the cost efficiency and the profit efficiency. As seen in Table 8,
considering both profit and cost efficiency, the most efficient bank in the Gulf region is the Bank
of Sharjah, a conventional bank located in the UAE with a combined rank of ‘6’ followed by
Arab Bank of Investment and Foreign trade, another conventional bank located in the UAE with
a combined rank of ‘10’.
7. Conclusion
We measure cost and profit efficiency of banks operating in six GCC countries (Bahrain,
Kuwait, Oman, Qatar, Saudi Arabia, and the United Arab Emirates) for the period of 1999-2010
using heteroskedastic stochastic frontier (HSF) models. We also estimate cost and profit
efficiency of Islamic banks, conventional banks, mixed banks, privately owned and government
owned banks operating in GCC countries. The results of our study show that there is no
discernible upward trend on cost or profit efficiency of banks over the 1999-2010 period. We
33

analyze the effects of size, equity capital-to-asset ratio, types of banks (Islamic versus non-
Islamic banks) and ownership structure on bank inefficiency after allowing for differences in the
inefficiency due to host countries’ regulatory and macro-environmental variables using country
dummies. We find that Islamic banks are likely to be less cost efficient but more profit efficient
than non-Islamic banks. Banks operating in Saudi Arabia and Bahrain are more cost efficient
than those that operate in Kuwait, Oman, Qatar, and the United Arab Emirates. We also report
rankings of both cost and profit efficiencies of our sample banks operating in the GCC countries
over the 1999-2010 period. From a policy perspective, this study highlights the importance of
enhancing cost and profit efficiency of banking industry as well as of individual banks in GCC
countries.
34

REFERENCES
Aigner, D. J., Lovell,C. A. K., Schmidt, P., 1977. Formulation and estimation of stochastic frontier production function models. Journal of Econometrics 6(1), 21-37.
Akhavein, J. D., Berger, A. N., Humphrey,D.B., 1997. A general method of driving the efficiencies of banks from a profit function. Journal of Productivity Analysis 8, 71-93.
Al-Muharrami, S., Matthews, K. & Khabari, Y., 2006 . Market structure and competitive conditions in
the Arab GCC banking system. Journal of Banking and Finance 30, 3487-3501.
Allen, L., Rai, A., 1996. Operating efficiency in banking: An international comparison. Journal of Banking and Finance 20, 655-672.
Altunbas, Y., Evans, L. and Molyneux, P., 2001. Ownership and efficiency in banking. Journal of Money, Credit and Banking 33 (4), 926-954.
Altunbas, Y., Liu, M., Molyneux, P., Seth R., 2000. Efficiency and risk in Japanese banking. Journal of Banking and Finance 24, 1605-1628.
Altunbas, Y., Gardener, E., Molyneux, P., Moore B., 2001. Efficiency in European banking. European Economic Review 45, 1931-1955.
Ariss, T., Rezvanian, R., and Mehdian, S., 2007. Cost efficiency, technological progress and productivity growth of banks in GCC countries. International Journal of Business 12 (4), 1083-4346.
Baltagi, B. H., Griffin, J.M., 1988. A general index of technical change. Journal of Political Economy 96, 20-41.
Battese, G. E., Coelli,T. J., 1995. A model for technical inefficiency effects in a stochastic frontier production function for panel data. Empirical Economics 20, 325-332.
Bauer, P. W., 1990. Recent developments in the econometric estimation of frontiers. Journal of Econometrics 46, 39-56.
Bauer, P.W., Beger, A. N., Ferrier, G. D., Humphrey, D. B., 1998. Consistency conditions for regulatory analysis of financial institutions: A comparision of frontier efficiency methods. Journal of Economics and Business 50, 85-114.
Berger, A. N., Humphrey, D.B., 1991. The dominance of inefficiencies over scale and product mix economies in banking. Journal of Monetary Economics 28, 117-148.
Berger, A. N., Strahan, P.E., 1998. The consolidation of the financial services industry: causes, consequences, and the implications for the future. Working paper,Federal Reserve Bank of New York.
Berger, A. N., Hasan, I., Zhou, M., 2010. Bank ownership and efficiency in China: what will happen in the world's largest nation? Journal of Banking and Finance 33 (1), 113-130.
35

Berger, A. N., DeYoung, R., Genay, H., Udell, G.F., 2000. Globalization of financial institutions: evidence from cross-border banking performance. R. E. Litan and A. Santomero (eds.), Brookings-Wharton Papers on Financial Services 3. Philadelphia, PA: The Wharton School, 23-158.
Berger, A. N., Hunter, W.C., Timme, S.G., 1993. The efficiency of financial institutions: a review and preview of research: Past, present, and future. Journal of Banking and Finance 17, 221-249.
Berger, A.N., 1993. Distribution-free estimates of efficiency in the U.S. banking industry and tests of the standard distributional assumptions. Journal of Productivity Analysis 4(3), 261-292.
Berger, A.N. Humphrey, D.B., 1997. Efficiency of financial institutions: international survey and directions for future research. European Journal of Operational Research 98, 175-212.
Berger, A.N., Mester, L.J., 1997. Inside the black box: What explains differences in the efficiencies of financial institutions? Journal of Banking and Finance 21, 895-947.
Berger, A. N., Leusner, J. H., Mingo, J. J., 1997. The efficiency of bank branches. Journal of Monetary Economics, Elsevier 40(1), 141-162.
Berger, A. N., DeYoung, R., 1997. Problem loans and cost efficiency in commercial banks. Journal of Banking and Finance 21, 849-70.
Berger, A.N., Hanweck, G. A., Humphrey, D. B., 1987. Competitive viability in banking: scale, scope, and product mix economies. Journal of Monetary Economics 20, 501-20.
Bhattacharya, A, Lovell, C.A.K., Sahay, P., 1997.The impact of liberalization on the productive efficiency of Indian commercial banks. European Journal of Operational Research 98 (2), 332-345.
Bonin, J. P., Hasan I., Wachtel, P. , 2005. Bank performance, efficiency, and ownership in transition countries. Journal of Banking and Finance 29 (1), 31-53.
Caudill, S. B., Ford, J. M., 1993. Biases in frontier estimation due to heteroscedasticity. Economics Letters, 41(1),17-20.
Caudill, S. B., Ford, J. M., Gropper, D. M., 1995. Frontier estimation and firm-specific inefficiency measures in the presence of heteroscedasticity. Journal of Business & Economic Statistics 13(1), 105-11.
Cebenoyan, A. S., 1990. ‘Scope economies in banking: the hybrid box-cox function’, The Financial Review 25, 115-125.
Coelli, T., Prasada R.D.S., and Battese, G.E., 1999. An introduction to efficiency and productivity
analysis. Kluwer Academic Publishers, USA.
36

Cornwell, C., Schmidt, P., Sickles, R.C., 1990. Production frontiers with cross-sectional and time-series
variation in efficiency levels. Journal of Econometrics 46, 185-200.
Darrat , F., Topuz, C., and Yosusef, T., 2003. Assessing bank efficiency of banks in an emerging market.
The Kuwaiti Experience in the 1990s. Studies in Economics and Finance 21, 1-21.
DeYoung, R., Hasan, I., 1998. The performance of de novo commercial banks: a profit efficiency approach. Journal of Banking and Finance 22, 565-587.
El-Gamal, M., & Inanoglu, H. , 2005. Inefficiency and heterogeneity in Turkish banking 1990-2000. Journal of Applied Econometrics 20, 641-664.Ferrier, G. D. and Lovell, C.A.K., 1990. Measuring cost efficiency in banking: econometric and
linear programming evidence. Journal of Econometrics 46, 229-245.Greene, W. H., 1993. Econometric Analysis, 2nd Edition. New York, N. Y.: Macmillan
Publishing Company.Grigorian, D. and Manole, V., 2005. A Cross-Country Nonparametric Analysis of Bahrain’s
Banking System, IMF Working paper, WP/05/107.Hasan, I., and Marton, K., 2003. Development and efficiency of banking sector in a transitional
economy: Hungarian banking experience. Journal of Banking and Finance 27, 2249- 2271.
Havrylchyk, O. , 2006. Efficiency of the Polish banking industry: foreign versus domestic banks. Journal of Banking and Finance 30 (7), 975-1996.
Huang, C. J., Liu, J.T., 1994. Estimation of a non-neutral stochastic production function. Journal of Productivity Analysis 5, 171-180.
Huang, T., 2000. Estimating X-Efficiency in Taiwanese banking using a translog shadow profit function. Journal of Productivity Analysis 14(3), 225-245.
Hughes, J.P. & Mester, L. J., 2008. "Efficiency in banking: theory, practice, and evidence," Working Papers 08-1, Federal Reserve Bank of Philadelphia.Jondrow, J., Lovell, C.A.K., Materov, I.S., Schmidt, P., 1982. On the estimation of technical
inefficiency in the stochastic frontier production function model. Journal of Econometrics 19, 233-238.
Kumbhakar, S. C.,1993. Production risk, technical efficiency and panel data. Economics Letters 41, 11-26.
Kumbhakar, S. C., Hjalmarsson, L., 1995. Labour-use efficiency in Swedish social insurance offices. Journal of Applied Econometrics 10(1), 33-47.
Lang, G., Welzel, P.. 1996. Efficiency and technical progress in banking empirical results for a panel of German cooperative banks. Journal of Banking and Finance, 20, 1003-1023.
37

LeCompte, R. L. B., Smith, S.D., 1990. Changes in the cost of intermediation: The case of savings and loans. Journal of Finance, 45, 1337-1346.
Lieu, P.T., Yeh, T.-L., Chiu, Y.-H.. 2005. Off-balance sheet activities and cost inefficiency in Taiwan's Banks. Service Industries Journal 25 (7), 925-944.
Lin, X., Zhang, Y., 2009. Bank ownership reform and bank performance in China. Journal of Banking and Finance, 33(1), 20-29.
Meeusen, W., Van Den Broeck, J., 1977. Efficiency estimation from Cobb-Douglas production functions with composed error. International Economic Review 18(2), 435-444
Mester, L. J., 1987. A multiproduct cost study of savings and loans. Journal of Finance 42, 423-445.
Mester, L. J., 1993. Efficiency in the savings and loan industry. Journal of Banking and Finance 17, 267-286.
Mester L.J., 1996. Measuring efficiency at U.S. banks: accounting for heterogeneity is important. Working Papers 96-11/R, Federal Reserve Bank of Philadelphia.
Mester, L. J., 1997. Measuring efficiency at U.S. banks: accounting for heterogeneity is important. European Journal of Operational Research 230-242.
Miller, S. M., Noulas, A. G., 1997. Portfolio mix and large-bank profitability in the USA. Applied Economics 29, 505-512.
Molyneux, P. and Iqbal, M., 2005. Banking and Financial System in the Arab World, Palgrave Macmillan, New York, USA.Murray, J. D., White, R.W., 1983. Economies of scale and economies of scope in multiproduct
financial institutions: a study of British Columbia credit unions. Journal of Finance 38, 887-902.
Pastor J. M., Perez, F. and Quesada, J.,1997. Efficiency analysis in banking firms: an international comparison. European Journal of Operational Research 98, 395-407.
Rai, A., 1996. Cost efficiency of international insurance firms. Journal of Financial Service Research 10, 213-233.
Resti, A., 1997. Evaluating the cost-efficiency of the Italian banking system: what can be learned from the joint application of parametric and non-Parametric techniques. Journal of Banking and Finance 21, 221-250.
Rezvanian R., Mehdian, S., 2002. An examination of cost structure and production performance of commercial banks in Singapore. Journal of Banking and Finance 26, 79-98.
Sathye, M., 2003, .Efficiency of banks in a developing economy: The case of India. European Journal of Operational Research, 148, 662-671.
38
Shao, B. B. M., Lin, W.T., 2000. Examining the determinants of production efficiency with IT as a production factor. Journal of Computer Information Systems 41, 25-30.
Wang, H., 2002. Heteroscedasticity and non-monotonic efficiency effects of a stochastic
frontier model. Journal of Productivity Analysis, 18, 241-253.
Wang, H., and Schmidt, P., 2002. One-step and two-step estimation of the effects of exogenous variables on technical efficiency levels. Journal of Productivity Analysis 18, 129-144.
Weiss, M. A., 1991. Efficiency in the property-liability insurance industry. Journal of Risk and Insurance 58, 452-479.
Yildirim, H.S., Philippatos, G.C., 2007. Efficiency of banks: recent evidence from the transition economies of Europe, 1993-2000. The European Journal of Finance, 13(2), 123-143.
39

Table 1. Sample of Banks by Country, by Types, and by Ownership (1999- 2010).
Bank Year obs Country Islamic ConventionalMixed Banks
Government PrivateMixed owned
BanksAhli United Bank 1999-2009 11 Bahrain Y YArab Banking 2002-2010 9 Bahrain Y YBahrain Saudi Bank BSC 2005-2010 6 Bahrain Y YBBK 2005-2010 6 Bahrain Y YGulf International Bank 1999-2010 12 Bahrain Y YNational bank of Bahrain 1999-2010 12 Bahrain Y YAlahli Bank of Kuwait 1999-2010 12 Kuwait Y YBurgan Bank 2000-2010 11 Kuwait Y YGulf Bank 1999-2010 12 Kuwait Y YNational Bank of Kuwait 2001-2010 10 Kuwait Y YCommercial Bank of Kuwait SAK
1999-2010 12 Kuwait Y Y
Bank Dhofar 1999-2010 12 Oman Y YBank Muscat 1999-2010 12 Oman Y YNational Bank of Oman 1999-2010 12 Oman Y YOman Arab Bank 1999-2010 12 Oman Y YOman International Bank 1999-2010 12 Oman Y YAhli Bank QSC 1999-2010 12 Qatar Y YCommercial bank of Qatar 1999-2010 12 Qatar Y Y
Table 1 (Contd.) Sample of Banks by Country, by Types, and by Ownership (1999- 2010)
40

Bank Year obs Country IslamicConventiona
lMixed Banks
Government
PrivateMixed owned
Banks
Doha Bank2001-2010
10 Qatar Y Y
International Bank of Qatar2002-2010
9 Qatar Y Y
Qatar Development Bank2000-2009
10 Qatar Y Y
Qatar National Bank1999-2010
12 Qatar Y Y
Qatar International Islamic Bank
1999-2010
12 Qatar Y Y
Arab National Bank1999-2010
12 Saudi Y Y
Bank Al-Jazira1999-2010
12 Saudi Y Y
Banque Saudi Fransi1999-2010
12 Saudi Y Y
National Commercial Bank1999-2010
12 Saudi Y Y
Riyad Bank1999-2010
12 Saudi Y Y
41

Samba Financial Group1999-2010
12 Saudi Y Y
Saudi British Bank1999-2010
12 Saudi Y Y
Saudi Hollandi Bank1999-2010
12 Saudi Y Y
Abu Dhabi Commercial Bank1999-2010
12 UAE Y Y
Arab Bank for Investment & Foreign Trade
1999-2010
12 UAE Y Y
Bank of Sharjah1999-2010
12 UAE Y Y
Commercial Bank of PSC1999-2010
12 UAE Y Y
Table 1 (Contd.) Sample of Banks by Country, by Types, and by Ownership (1999- 2010)
Bank Year obsCountr
yIslamic
Conventional
Mixed Banks
Government
PrivateMixed owned
Banks
Emirates Bank International1999-2008
10 UAE Y Y
First Gulf Bank1999-2010
12 UAE Y Y
Mashreq bank 1999- 12 UAE Y Y
42

2010
National Bank of Abu Dhabi1999-2010
12 UAE Y Y
National Bank of Dubai Public Joint Company
1999-2002
4 UAE Y Y
National Bank of Fujairah1999-2010
12 UAE Y Y
National Bank of Umm Al-Qaiwain
1999-2010
12 UAE Y Y
National Bank of Ras Al-Khaimah
1999-2010
12 UAE Y Y
Union National Bank1999-2010
12 UAE Y Y
United Arab Bank1999-2010
12 UAE Y Y
Total 45 banks 504
Table 2 Definitions of Variables and Cross-Product Terms
Variable Description
43

Dependent Variables
TC total costs=interest expenses, cost of premises and fixed cost in million US dollars.
NI Net income in million US dollars.
Output Variables
Y1 total amount of net loans in million US dollars.
Y2 total amount of security investments in million US dollars.
Y3 Other earning assets in million US dollars.
Input Prices
P1 cost of funds in percentage=ratio of interest expense to borrowed funds.
P2 cost of labor proxy=employee expenses/total assets in percentage.
P3 cost of fixed cost proxy=fixed cost/total Assets
Other Variables
EQUITY total amount of equities in million US dollars.
NPL non-performing loans/total gross loans in percentage.
TIER1 Basel II tier-1 capital/total loans in percentage.
CAPITAL capital ratio=total capital reserves/ total loans in percentage
ASSET the amount of total assets in million US dollars.
SIZE The proxy of the size of a bank. It is the natural logrithm of the amount of total assets in million US dollars.
BORROW borrowed funds in million US dollars.
EA The total equity to total asset ratio.
Table 2 (Contd.) Definitions of Variables and Cross-Product Terms
44

Dummy Variables
ISLAM The dummy variable indicates a bank fully or partially follows Islamic rules.
For Islamic banking, ISLAM=1; otherwise, ISLAM=0.
PRVATE The dummy variable indicates a bank is classified as private owned or not privately owned;
for fully or partially privately owned banks, PRIVATE=1; otherwise PRIVATE=0.
BR The dummy indicates a bank located in Bahrain. For a bank in Bahrain, BR=1; otherwise BR=0.
KU The dummy indicates a bank located in Kuwait. For a bank in Kuwait, KU=1; otherwise KU=0.
OM The dummy indicates a bank located in Omen. For a bank in Omen, OM=1; otherwise OM=0.
QA The dummy indicates a bank located in Qatar. For a bank in Qatar, QA=1; otherwise QA=0.
SA The dummy indicates a bank located in Saudi Arabia. For a bank in Saudi Arabia SA=1; otherwise SA=0.
Variables in FrontierslnP1 The natural logarithm of P1.
lnP2 The natural logarithm of P2.
lnP3 The natural logarithm of P3.
lnY1 The natural logarithm of Y1.
lnY2 The natural logarithm of Y2.
lnY3 The natural logarithm of Y3.
1/2*lnP1*lnP1 Squared LnP1 divided by 2.
1/2*lnP2*lnP2 Squared LnP2 divided by 2.
1/2*lnP3*lnP3 Squared LnP3 divided by 2.
45

lnP1*lnP2 The product of lnP1 and LnP2
lnP2*lnP3 The product of lnP2 and LnP3
lnY1*lnP1 The product of lnY1 and LnP1
lnY1*lnP2 The product of lnY1 and LnP2
lnY1*lnP3 The product of lnY1 and LnP3
lnY2*lnP1 The product of lnY2 and LnP1
lnY2*lnP2 The product of lnY2 and LnP2
lnY2*lnP3 The product of lnY2 and LnP3
lnY3*lnP1 The product of lnY3 and LnP1
lnY3*lnP2 The product of lnY3 and LnP2
lnY3*lnP3 The product of lnY3 and LnP3
lnY1*lnY2 The product of lnY1 and LnY2
lnY1*lnY3 The product of lnY1 and LnY3
lnY2*lnY3 The product of lnY2 and LnY3
1/2*lnY1*lnY1 Squared LnY1 divided by 2.
1/2*lnY2*lnY2 Squared LnY2 divided by 2.
1/2*lnY3*lnY3 Squared LnY3 divided by 2.
Table 3 Summary Statistics of Inputs and Outputs Variables by Country, by Bank Types, and by Ownership (1999-2010)
46

Variable Mean S.D. Mean S.D. Mean S.D. Mean S.D. Mean S.D. Mean S.D. Mean S.D.TC 446.86 509.88 499.46 458.22 503.61 398.85 153.05 126.76 268.38 405.89 838.01 580.66 482.58 505.55 Y1 7,358.38 9,468.40 6,197.60 5,669.54 8,487.95 8,044.82 2,668.93 2,832.01 4,786.71 8,386.10 13,418.70 10,613.10 7,652.56 8,909.12 Y2 7,162.38 9,593.90 3,009.03 2,519.99 9,572.32 9,874.03 3,193.88 3,519.73 4,786.29 8,386.02 13,283.80 10,509.30 7,368.64 9,110.65 Y3 4,214.75 5,928.13 4,533.94 4,517.98 3,069.35 2,237.51 328.45 292.96 2,609.50 3,978.96 10,559.10 8,658.86 4,806.83 6,519.07 P1 3.65 3.76 5.20 3.40 3.50 1.75 2.94 1.54 4.64 8.04 2.68 1.61 3.71 4.32 P2 1.58 1.09 1.77 1.32 2.20 0.49 3.69 0.80 0.92 0.45 1.06 0.27 1.79 1.21 P3 1.27 0.79 1.13 0.39 1.12 0.31 1.19 0.44 1.61 1.50 1.07 0.15 1.23 0.79 EQUITY 1,680.66 2,099.84 1,391.12 1,092.46 1,855.61 2,001.89 509.81 557.79 1,148.51 1,647.56 3,112.14 2,698.37 1,738.33 2,093.81 NPL 7.58 9.25 9.05 13.44 8.64 8.51 13.27 11.78 7.60 11.23 5.07 6.11 8.29 10.47 TIER1 18.23 14.64 17.04 8.00 14.64 3.17 14.42 3.15 27.79 32.58 16.56 4.62 18.26 15.99 CAPITAL 20.93 14.63 22.36 11.91 17.28 3.61 16.50 2.97 29.14 32.37 17.95 4.66 20.69 16.51 ASSET 9,653.92 12,765.40 11,234.70 10,742.90 3,603.10 2,842.33 1,377.16 1,608.83 6,513.48 10,691.00 21,779.10 15,190.10 10,143.00 13,042.50 BORROW 6,716.20 10,235.18 4,853.95 4,634.19 2,866.31 2,451.97 972.12 972.22 4,373.51 7,558.05 17,202.74 15,655.11 5,716.53 7,712.90NI 251.71 390.28 76.81 262.18 271.66 427.76 68.31 78.20 201.18 342.27 576.70 530.87 273.81 430.66
Variable Mean S.D. Mean S.D. Mean S.D. Mean S.D.TC 518.86 547.76 257.80 326.28 186.34 374.47 467.48 517.53Y1 8,467.01 10,222.60 4,447.23 6,272.08 3,647.05 8,017.19 8,079.54 9,567.74Y2 8,067.31 10,144.60 4,786.12 7,495.80 3,705.76 8,014.40 7,834.04 9,738.24Y3 5,241.59 6,581.42 1,518.37 1,931.14 1,651.45 3,704.21 4,712.83 6,149.74P1 3.53 2.14 3.96 6.27 4.56 7.98 3.47 2.11P2 1.26 0.91 2.42 1.08 1.39 1.03 1.62 1.10P3 1.25 0.70 1.31 1.01 1.42 1.27 1.23 0.66EQUITY 1,932.34 2,244.92 1,019.78 1,473.47 913.31 1,462.59 1,829.77 2,172.46NPL 7.31 9.52 8.34 8.45 8.20 9.03 7.47 9.30TIER1 16.43 5.64 22.61 25.17 32.40 35.00 16.07 5.31CAPITAL 19.14 7.43 25.78 24.79 33.46 30.96 18.67 6.93ASSET 12,443.60 13,953.40 2,270.95 2,341.91 4,591.66 10,235.40 10,618.60 12,992.20BORROW 8549.86 11376.35 1667.97 1965.73 3117.56 7393.33 7338.64 10538.84NI 294.90 414.01 138.29 291.85 138.75 324.26 273.66 398.48
Islamic Bank Government OwnedNon-Islamic Bank Non-Government Owned
UAEAll observations Bahrain Kuwait Oman Qatar Saudi Arabia
Table 4: Measures of Cost Efficiency of GCC banks for the 1999-2010 period.
47

Year 1999 2000 2001 2002 2003 2004 2005 2006 2007 2008 2009 2010 Panel A: All Banks Bahrain 0.7302 0.7395 0.7304 0.7162 0.8157 0.8029 0.8079 0.8559 0.7645 0.8558 0.7623 0.8018
Kuwait 0.8768 0.8292 0.7704 0.6857 0.6915 0.7866 0.8233 0.8423 0.7767 0.7633 0.8150 0.6480
Oman 0.7594 0.7824 0.6887 0.8799 0.7083 0.7716 0.7425 0.8275 0.6566 1.0000 0.8081 0.7538
Qatar 0.8221 0.7263 0.8367 0.7993 0.7950 0.7789 0.7465 0.8834 0.7152 0.7202 0.8067 0.7874
Saudi Arabia 0.8508 0.6625 0.7831 0.8082 0.8474 0.9391 0.9006 0.8273 0.8270 0.7182 0.7605 0.8428
UAE 0.7103 0.7453 0.6716 0.8060 0.7273 0.7093 0.8302 0.5518 0.5624 0.5565 0.5674 0.5796
All Bank 0.7916 0.7475 0.7468 0.7825 0.7642 0.7981 0.8085 0.7981 0.7171 0.7690 0.7533 0.7356 Panel B: Bank Type Islamic Bank 0.8159 0.8133 0.8301 0.7696 0.7871 0.8107 0.7975 0.9999 0.8595 0.8361 0.7735 0.8117
Conventional Bank 0.7612 0.7571 0.8201 0.8151 0.8765 0.8904 0.8919 0.8540 0.8373 0.9038 0.9042 0.8823
Mixed Bank 0.7775 0.7514 0.7652 0.7570 0.8241 0.8490 0.8653 0.8670 0.8649 0.8657 0.8242 0.7885 Panel C: Ownership Privately Owned 0.7873 0.7770 0.7881 0.7831 0.8382 0.8659 0.8709 0.8849 0.8669 0.8675 0.8335 0.8252
Government Owned 0.7985 0.7386 0.8496 0.8031 0.9084 0.9014 0.9309 0.9106 0.8910 0.9999 0.9710 0.8456
Table 5: Measures of Cost Efficiency of GCC banks for the 1999-2010 period
48
Year 1999 2000 2001 2002 2003 2004 2005 2006 2007 2008 2009 2010 Panel A: All Banks Bahrain 0.9057 0.9368 0.9171 0.8542 0.8789 0.9155 0.8936 0.8917 0.8079 0.7540 0.8339 0.8596
Kuwait 0.8923 0.9210 0.8918 0.8730 0.8779 0.9134 0.9440 0.9541 0.9747 0.7400 0.7948 0.8343
Oman 0.9387 0.9678 0.9505 0.9545 0.9153 0.9258 0.9456 0.9551 0.9515 0.9559 0.9394 0.9521
Qatar 0.9142 0.8849 0.9037 0.8353 0.8697 0.8732 0.8840 0.8915 0.8624 0.8705 0.8647 0.9000
Saudi Arabia 0.6746 0.7557 0.7583 0.7512 0.7533 0.7761 0.8557 0.9045 0.8185 0.7498 0.7392 0.7533
UAE 0.9093 0.9236 0.9191 0.9004 0.9017 0.9059 0.9533 0.9075 0.9053 0.8839 0.8437 0.8649
All Bank 0.8725 0.8983 0.8901 0.8614 0.8661 0.8850 0.9127 0.9174 0.8867 0.8257 0.8359 0.8607 Panel B: Bank Type Islamic Bank -- 0.8043 0.8404 0.8263 0.8350 0.8433 0.9288 0.9876 0.8888 0.7533 0.7073 0.7528
Conventional Bank 0.9343 0.9410 0.9225 0.8829 0.8887 0.9125 0.9378 0.9408 0.9402 0.4081 0.9018 0.9029
Mixed Bank 0.8586 0.8723 0.8677 0.8498 0.8537 0.8672 0.9028 0.8911 0.8421 0.8075 0.8082 0.8403 Panel C: Ownership Privately Owned 0.8051 0.8773 0.8747 0.8571 0.8604 0.8739 0.9118 0.9117 0.8652 0.6252 0.8035 0.8315
Government Owned 0.9126 0.9248 0.9143 0.8576 0.8711 0.8998 0.9294 0.9193 0.9092 0.9319 0.9308 0.9469
49

Table 6 Single-step Heteroskedastic SF estimates for Cost Efficiency
Variable Coefficient t-ratio Coefficient t-ratio Constant -3.7964 -11.02 *** -2.9944 -9.00 ***
lnP1 0.1251 1.50 -0.0766 -1.11
lnP2 0.2288 1.72 * 0.1376 1.05
lnP3 -0.1402 -0.90 -0.2129 -1.26
lnY1 1.0700 6.05 *** 0.5436 3.67 ***
lnY2 -0.0018 -0.01 0.0051 0.05
lnY3 0.1120 1.43 0.3937 5.03 ***
1/2*lnP1*lnP1 0.1575 7.74 *** 0.2201 13.21 ***
1/2*lnP2*lnP2 0.2168 4.00 *** 0.2613 5.82 ***
1/2*lnP3*lnP3 -0.0460 -0.86 -0.0298 -0.47
lnP1*lnP2 -0.0585 -1.94 * -0.0055 -0.21
lnP2*lnP3 -0.0133 -0.26 -0.0689 -1.36
lnY1*lnP1 0.1640 4.80 *** 0.1108 3.83 ***
lnY1*lnP2 -0.1330 -3.10 *** -0.1897 -4.46 ***
lnY1*lnP3 -0.0230 -0.34 0.0700 1.33
lnY2*lnP1 -0.0531 -1.81 * -0.0114 -0.47
lnY2*lnP2 0.1021 2.89 *** 0.1037 3.12 ***
lnY2*lnP3 0.0861 1.51 0.0061 0.13
lnY3*lnP1 -0.0842 -4.51 *** -0.0559 -3.27 ***
lnY3*lnP2 0.0467 2.63 *** 0.1123 5.37 ***
lnY3*lnP3 -0.0480 -1.16 -0.0527 -1.32
lnY1*lnY2 -0.0407 -1.21 -0.0372 -1.30
Variable Coefficient t-ratio Coefficient t-ratio lnY1*lnY3 -0.0999 -2.50 ** -0.1962 -5.18 ***
lnY2*lnY3 0.0303 0.83 0.0136 0.43
lnY1*lnY1 0.0538 0.82 0.2057 3.40 ***
lnY2*lnY2 0.0356 1.77 * 0.0394 2.74 ***
lnY3*lnY3 0.1044 4.86 *** 0.1893 9.60 ***
BR 0.0942 1.62 0.4268 7.36 ***
KU -0.0844 -1.52 0.3781 7.28 ***
OM -0.0988 -1.03 0.3926 6.64 ***
QA -0.0044 -0.13 -0.9494 0.00
SA 0.2102 4.76 *** 0.6574 13.23 ***
Components of the mean of u Components of the mean of u
50
NPL 0.0060 0.53 -0.0002 -1.67 *
TIER1 -0.0009 -1.41 0.0000 -0.93
EA 1.9778 1.89 * -- --
SIZE -0.3632 -1.22 -- --
PRIVATE -- -- -0.0519 -0.76
ISLAM -- -- 0.4951 5.53 ***
BR -2.2408 -0.37 -0.5517 -2.93 ***
KU -1.9272 -0.42 -0.9594 -1.53
OM -5.9606 -0.30 -1.2386 0.00
QA 0.8872 0.77 0.9355 0.00
SA 1.6683 1.52 -0.7543 -5.15 ***
Components of the variance of u Components of the variance of u
Constant -1.3966 -0.95 -7.1025 -3.78 ***
NPL 0.0299 1.19 -0.0002 -0.07
TIER1 -0.0004 -0.90 -0.0004 -1.42
EA 1.9795 2.79 *** -- --
SIZE -0.4138 -2.24 ** -- --
PRIVATE -- -- -1.2386 -1.26
ISLAM -- -- 2.5153 1.64
BR -4.7110 -1.02 -- --
KU -1.2896 -0.96 -- --
OM -57.5951 0.00 -- --
QA 0.5389 0.78 -- --
SA 2.3351 3.62 *** -- -- Lambda 4.5045 2.38 ** 2.5530 7.61 ***
Sigma 0.5675 2.50 ** 0.2222 22.14 ***
Table 7 Single-step Heteroskedastic SF estimates for Profit Efficiency
51

Variable Coefficient t-ratio Coefficient t-ratio Constant 8.4690 9.19 *** 9.4109 12.93 ***
lnP1 -0.3924 -1.63 0.2413 1.44
lnP2 -0.4787 -1.34 -0.4863 -1.37
lnP3 -0.1506 -0.34 -0.3329 -1.00
lnY1 -0.0740 -0.11 -0.1669 -0.35
lnY2 0.0583 0.09 -0.1195 -0.27
lnY3 -0.1919 -0.79 -0.3662 -2.06 ***
1/2*lnP1*lnP1 0.0255 0.35 -0.0851 -2.29 ***
1/2*lnP2*lnP2 -0.0719 -0.48 0.1862 1.21
1/2*lnP3*lnP3 0.1135 0.64 0.1070 0.87
lnP1*lnP2 0.0700 0.81 0.0244 0.41
lnP2*lnP3 0.0680 0.55 0.0665 0.55
lnY1*lnP1 -0.1522 -0.94 0.0597 0.52
lnY1*lnP2 0.2566 1.39 -0.0260 -0.23
lnY1*lnP3 -0.0024 -0.01 0.0685 0.35
lnY2*lnP1 0.1457 0.92 -0.0601 -0.54
lnY2*lnP2 -0.0636 -0.39 0.0534 0.51
lnY2*lnP3 -0.0441 -0.23 -0.0583 -0.30
lnY3*lnP1 0.0298 0.49 -0.0220 -0.54
lnY3*lnP2 -0.1879 -2.79 *** 0.0388 0.54
lnY3*lnP3 0.0506 0.44 0.0313 0.35
lnY1*lnY2 0.0240 0.19 -0.0670 -0.52
lnY1*lnY3 0.1390 0.85 -0.1276 -1.10
lnY2*lnY3 -0.1202 -0.80 0.1048 0.91
lnY1*lnY1 -0.1296 -0.50 0.2049 0.90
lnY2*lnY2 0.0704 1.20 -0.0055 -0.09
lnY3*lnY3 0.0015 0.02 0.0849 1.29
BR 0.1202 0.72 0.0356 0.27
KU 0.1401 0.79 0.2039 1.60
OM 0.0263 0.11 -0.0851 -0.47
QA 0.0372 0.18 -0.0035 -0.05
SA-0.0104 -0.07 0.0821 0.89
components of the mean of u components of the mean of u
NPL -0.0033 -1.11 0.0121 3.36 ***
TIER1 0.0026 1.65 * 0.0025 1.60
52

EA -18.7568 -4.51 *** -- --
SIZE 0.4597 0.67 -- --
PRIVATE -- -- 5.4624 1.15
ISLAM -- -- -11.6603 -3.02 ***
BR 0.8780 0.41 2.9627 0.59
KU 8.6128 2.47 ** 4.9358 1.05
OM 3.8498 1.09 -2.8071 -1.36
QA -2.8935 -0.51 -4.8702 -1.00
SA -2.6462 -0.94 4.8838 0.88
Components of the variance of u Components of the variance of u
Constant -19.7572 -9.74 *** -7.7299 -7.51 ***
NPL 0.0689 3.75 *** 0.1326 13.69 ***
TIER1 0.0001 0.22 0.0014 6.66 ***
EA -12.4924 -20.27 *** -- --
SIZE 1.7464 9.17 *** -- --
PRIVATE -- -- -6.1671 -6.08 ***
ISLAM -- -- -2.2364 -19.12 ***
BR 1.3628 4.03 *** -- --
KU 6.8068 14.55 *** -- --
OM 3.4008 3.05 *** -- --
QA 0.3385 0.55 -- --
SA 0.9943 2.88 *** -- -- Lambda 3.8120 3.64 *** 7.3902 8.05 ***
Sigma 1.4545 5.14 *** 1.3835 13.06 ***
Table 8 Ranking of banks based on cost efficiency, profit efficiency, and both
Bank Cost Eff Rank Profit Eff. Rank Sum of Ranks
Ahli United Bank BSC 0.7258 41 0.9323 8 49
Arab Banking 0.9189 6 0.6906 42 48
53

Bahrain Saudi Bank BSC 0.8386 24 0.7659 38 62
BBK 0.7911 33 0.9308 11 44
Gulf International Bank 0.8329 26 0.6448 43 69
National bank of Bahrain 0.8655 19 0.9213 15 34
Alahli Bank of Kuwiat 0.8765 14 0.9626 2 16
Burgan Bank 0.8797 13 0.8043 30 43
Gulf Bank 0.9220 4 0.3547 45 49
National Bank of Kuwait 0.9153 7 0.7915 34 41
Commercial Bank of Kuwait SAK 0.9095 9 0.8620 25 34
Bank Dhofar 0.9411 3 0.9101 18 21
Bank Muscat 0.7605 39 0.9324 7 46
National Bank of Oman 0.8016 30 0.9312 10 40
Oman Arab Bank 0.8726 17 0.8887 20 37
Oman International Bank 0.8682 18 0.8970 19 37
Ahli Bank QSC 0.7715 36 0.9330 6 42
Commercial bank of Qatar 0.8620 20 0.8787 23 43
Doha Bank 0.7939 32 0.8853 21 53
International Bank of Qatar 0.8347 25 0.9162 17 42
Qatar Development Bank 0.8823 11 0.8546 27 38
Qatar National Bank 0.8559 22 0.8657 24 46
Qatar International Islamic Bank 0.8809 12 0.9264 14 26
Arab National Bank 0.7794 34 0.7492 39 73
Bank Al-Jazira 0.6817 43 0.8519 28 71
Banque Saudi Fransi 0.7728 35 0.8321 29 64
National Commercial Bank 0.7690 38 0.5971 44 82
Riyad Bank 0.7970 31 0.7347 40 71
Samba Financial Group 0.8514 23 0.7861 36 59
Saudi British Bank 0.6519 44 0.8017 31 75
Saudi Hollandi Bank 0.7351 40 0.7918 33 73
Abu Dhabi Commercial Bank 0.9843 2 0.7883 35 37
Arab Bank for Investment &Foreign Trade 0.9999 1 0.9316 9 10
Bank of Sharjah 0.9199 5 0.9629 1 6
Commercial Bank of International PSC 0.7700 37 0.9480 4 41
Table 8 (Contd.)
Bank Cost Eff Rank Profit Eff. Rank Sum of Ranks
Emirates Bank International 0.8612 21 0.8551 26 47
54

First Gulf Bank 0.8765 15 0.9173 16 31
Mashreqbank 0.8199 27 0.7701 37 64
National Bank of Abu Dhabi 0.8750 16 0.7931 32 48
National Bank of Dubai Public Joint Co. 0.5645 45 0.7346 41 86
National Bank of Fujairah 0.8184 28 0.9489 3 31
National Bank of Umm Al-Qaiwain 0.9107 8 0.9301 12 20
National Bank of Ras Al-Khaimah 0.6847 42 0.9411 5 47
Union National Bank 0.8152 29 0.8845 22 51
United Arab Bank 0.8858 10 0.9272 13 23
Average 0.8317 0.8435
55