web view · 2012-03-08at walker elementary school, incoming kindergarten students who...
TRANSCRIPT
2011-2012 School Improvement Plan (SIP)-Form SIP-1
FLORIDA DEPARTMENT OF EDUCATION
School Improvement Plan (SIP)Form SIP-1
Proposed for 2011-2012
April 2011 1Rule 6A-1.099811Revised April 29, 2011
2011-2012 School Improvement Plan (SIP)-Form SIP-1
2011 – 2012 SCHOOL IMPROVEMENT PLAN
PART I: SCHOOL INFORMATION
School Name: Walker Elementary School District Name: Okaloosa
Principal: Jeanine Kirkland Superintendent: Alexis Tibbetts
SAC Chair: Alicia Humphrey Date of School Board Approval:
Student Achievement Data:
The following links will open in a separate browser window. .
School Grades Trend Data (Use this data to complete Sections 1-4 of the reading and mathematics goals and Sections 1 and 2 of the writing and science goals.)Adequate Yearly Progress (AYP) Trend Data (Use this data to complete Sections 5A-5D of the reading and mathematics goals and Section 3A-3D of the writing goals.)Florida Comprehensive Assessment Test (FCAT) Trend Data (Use this data to inform the problem-solving process when writing goals.)
Highly Qualified Administrators
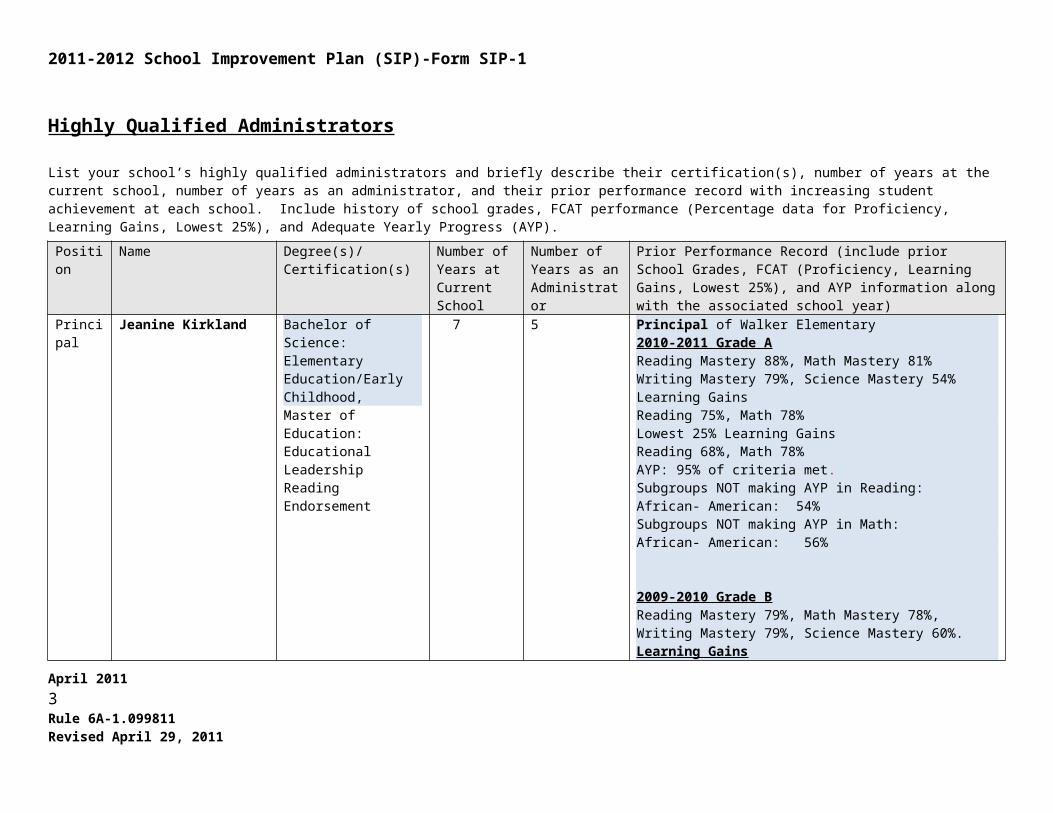
List your school’s highly qualified administrators and briefly describe their certification(s), number of years at the current school, number of years as an administrator, and their prior performance record with increasing student achievement at each school. Include history of school grades, FCAT performance (Percentage data for Proficiency, Learning Gains, Lowest 25%), and Adequate Yearly Progress (AYP).
Position Name Degree(s)/Certification(s)
Number of Years at Current School
Number of Years as an Administrator
Prior Performance Record (include prior School Grades, FCAT (Proficiency, Learning Gains, Lowest 25%), and AYP information along with the associated school year)
Principal Jeanine Kirkland Bachelor of Science: Elementary Education/Early Childhood,Master of Education: Educational
7 5 Principal of Walker Elementary2010-2011 Grade AReading Mastery 88%, Math Mastery 81%Writing Mastery 79%, Science Mastery 54%Learning GainsReading 75%, Math 78%
April 2011 2Rule 6A-1.099811Revised April 29, 2011
2011-2012 School Improvement Plan (SIP)-Form SIP-1Leadership Reading Endorsement
Lowest 25% Learning GainsReading 68%, Math 78%AYP: 95% of criteria met.Subgroups NOT making AYP in Reading:African- American: 54%Subgroups NOT making AYP in Math:African- American: 56%
2009-2010 Grade BReading Mastery 79%, Math Mastery 78%,Writing Mastery 79%, Science Mastery 60%.Learning GainsReading 59% Math 56%Lowest 25% Learning GainsReading 44%, Math 48%AYP: 90% of criteria met.Subgroups NOT making AYP in Reading: SWD and Economically DisadvantagedSubgroups NOT making AYP in Math:SWD and Economically Disadvantaged2008-2009 Grade AReading Mastery 84%, Math Mastery 78%,Writing Mastery 85%, Science Mastery 50%.Learning GainsReading 65% Math 64%Lowest 25% Learning GainsReading 64%, Math 68%AYP: 87% of criteria met.Subgroups NOT making AYP in Reading: SWD and African AmericansSubgroups NOT making AYP in Math:SWD, African Americans, Economically Disadvantaged
2007-2008 Grade AReading Mastery 86%, Math Mastery 82%,Writing Mastery 61%, Science Mastery 51%Learning GainsReading 65% Math 64%Lowest 25% Learning GainsReading 78%, Math 66%
April 2011 3Rule 6A-1.099811Revised April 29, 2011
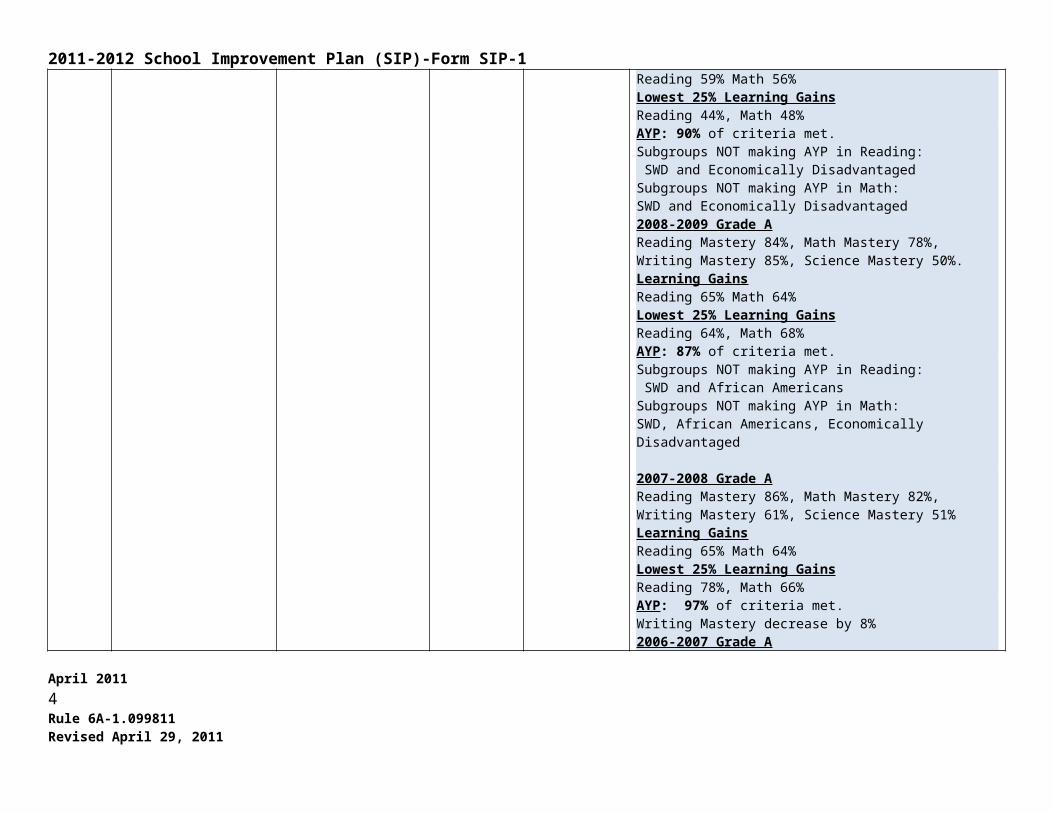
2011-2012 School Improvement Plan (SIP)-Form SIP-1AYP: 97% of criteria met.Writing Mastery decrease by 8%2006-2007 Grade AReading Mastery 88%, Math Mastery 77%,Writing Mastery 69%, Science Mastery 45%Learning GainsReading 77% Math 62%Lowest 25% Learning GainsReading 65%, Math 58%AYP: 100% of criteria met.
Assistant Principal
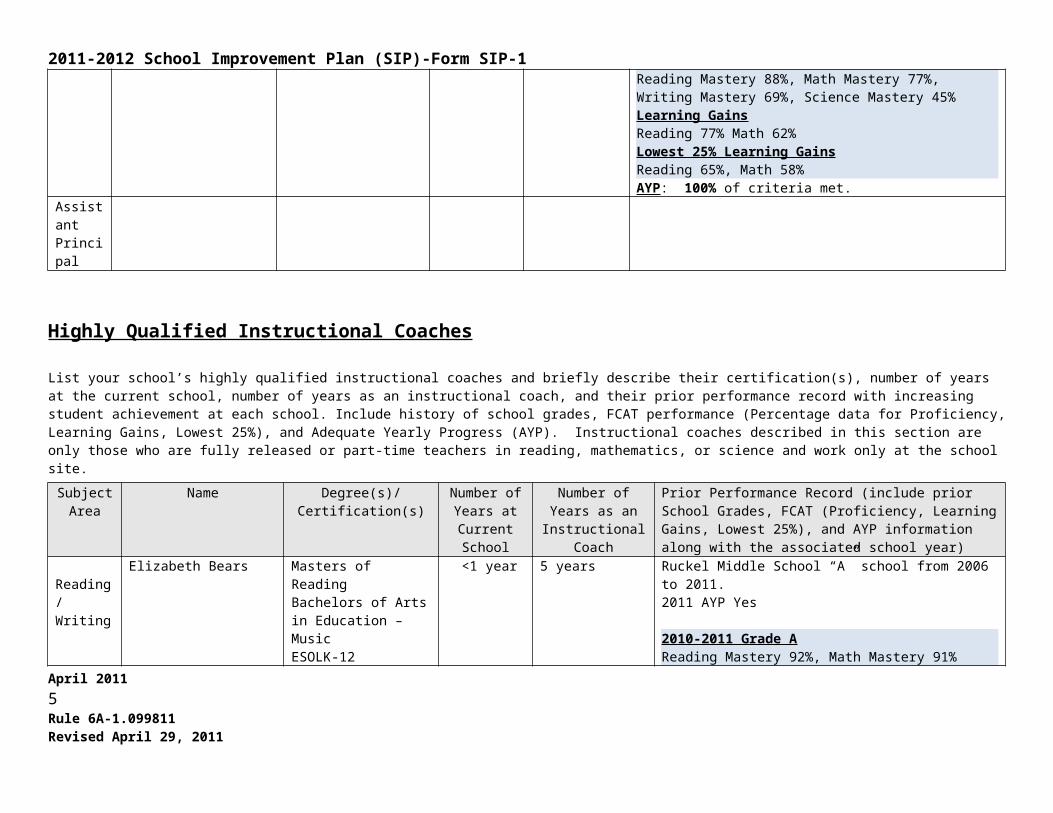
Highly Qualified Instructional Coaches
List your school’s highly qualified instructional coaches and briefly describe their certification(s), number of years at the current school, number of years as an instructional coach, and their prior performance record with increasing student achievement at each school. Include history of school grades, FCAT performance (Percentage data for Proficiency, Learning Gains, Lowest 25%), and Adequate Yearly Progress (AYP). Instructional coaches described in this section are only those who are fully released or part-time teachers in reading, mathematics, or science and work only at the school site.
SubjectArea
Name Degree(s)/Certification(s)
Number of Years at Current School
Number of Years as an
Instructional Coach
Prior Performance Record (include prior School Grades, FCAT (Proficiency, Learning Gains, Lowest 25%), and AYP information along with the associated school year)
Reading/ Writing
Elizabeth Bears Masters of ReadingBachelors of Arts in Education – MusicESOLK-12 EndorsementReading K-12 Certification
<1 year 5 years Ruckel Middle School “A” school from 2006 to 2011.2011 AYP Yes
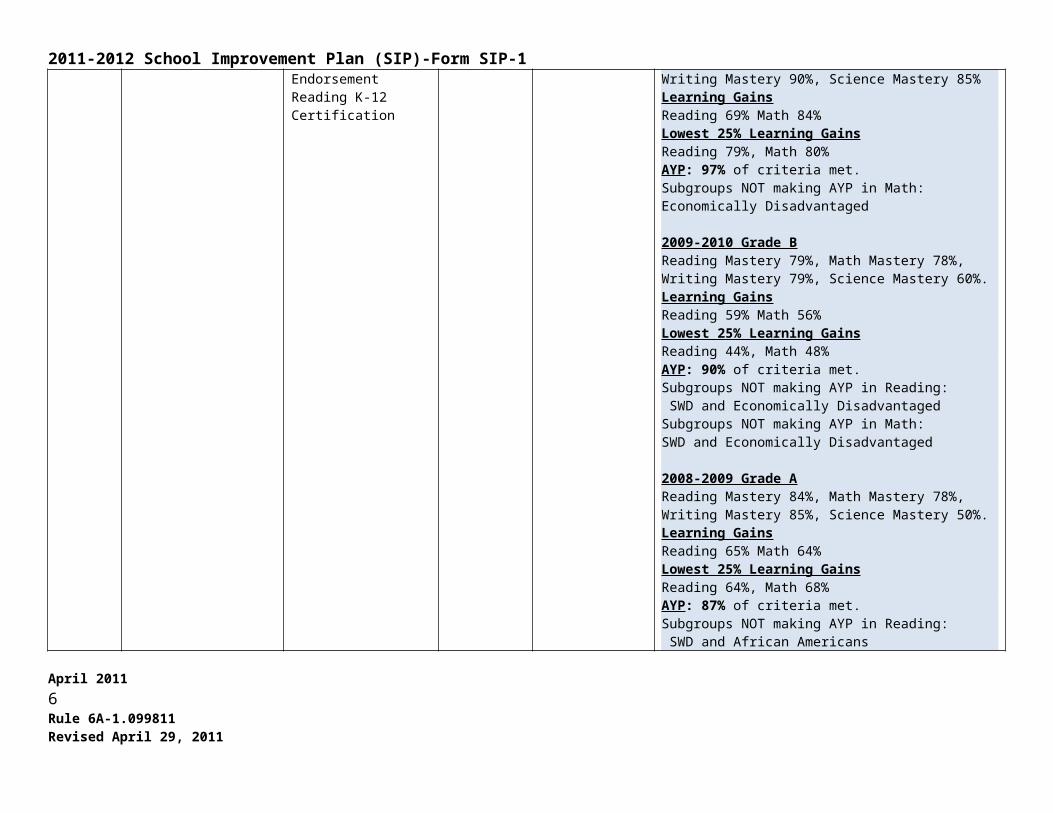
2010-2011 Grade AReading Mastery 92%, Math Mastery 91%Writing Mastery 90%, Science Mastery 85%Learning GainsReading 69% Math 84%Lowest 25% Learning GainsReading 79%, Math 80%AYP: 97% of criteria met.Subgroups NOT making AYP in Math:Economically Disadvantaged
2009-2010 Grade BApril 2011 4Rule 6A-1.099811Revised April 29, 2011
2011-2012 School Improvement Plan (SIP)-Form SIP-1Reading Mastery 79%, Math Mastery 78%,Writing Mastery 79%, Science Mastery 60%.Learning GainsReading 59% Math 56%Lowest 25% Learning GainsReading 44%, Math 48%AYP: 90% of criteria met.Subgroups NOT making AYP in Reading: SWD and Economically DisadvantagedSubgroups NOT making AYP in Math:SWD and Economically Disadvantaged
2008-2009 Grade AReading Mastery 84%, Math Mastery 78%,Writing Mastery 85%, Science Mastery 50%.Learning GainsReading 65% Math 64%Lowest 25% Learning GainsReading 64%, Math 68%AYP: 87% of criteria met.Subgroups NOT making AYP in Reading: SWD and African AmericansSubgroups NOT making AYP in Math:SWD, African Americans, Economically Disadvantaged
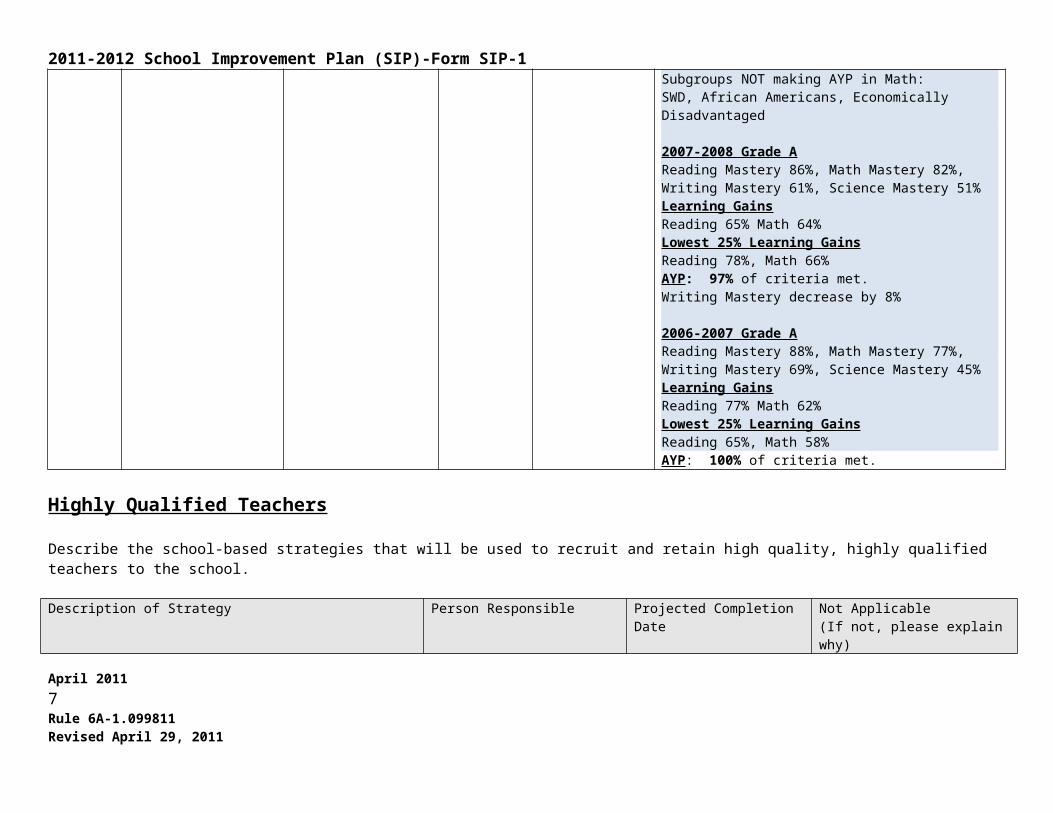
2007-2008 Grade AReading Mastery 86%, Math Mastery 82%,Writing Mastery 61%, Science Mastery 51%Learning GainsReading 65% Math 64%Lowest 25% Learning GainsReading 78%, Math 66%AYP: 97% of criteria met.Writing Mastery decrease by 8%
2006-2007 Grade AReading Mastery 88%, Math Mastery 77%,Writing Mastery 69%, Science Mastery 45%Learning GainsReading 77% Math 62%Lowest 25% Learning Gains
April 2011 5Rule 6A-1.099811Revised April 29, 2011
2011-2012 School Improvement Plan (SIP)-Form SIP-1Reading 65%, Math 58%AYP: 100% of criteria met.
Highly Qualified Teachers
Describe the school-based strategies that will be used to recruit and retain high quality, highly qualified teachers to the school.
Description of Strategy Person Responsible Projected Completion Date Not Applicable(If not, please explain why)
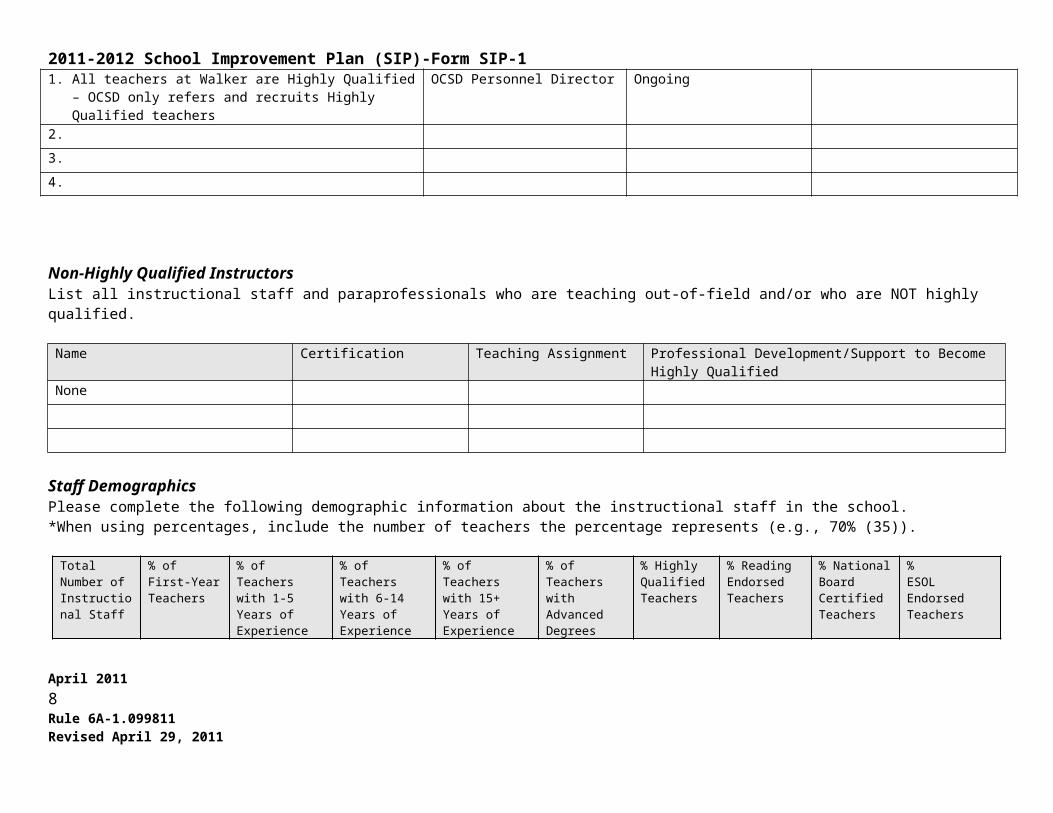
1. All teachers at Walker are Highly Qualified – OCSD only refers and recruits Highly Qualified teachers
OCSD Personnel Director Ongoing
2.
3.
4.
Non-Highly Qualified InstructorsList all instructional staff and paraprofessionals who are teaching out-of-field and/or who are NOT highly qualified.
Name Certification Teaching Assignment Professional Development/Support to Become Highly QualifiedNone
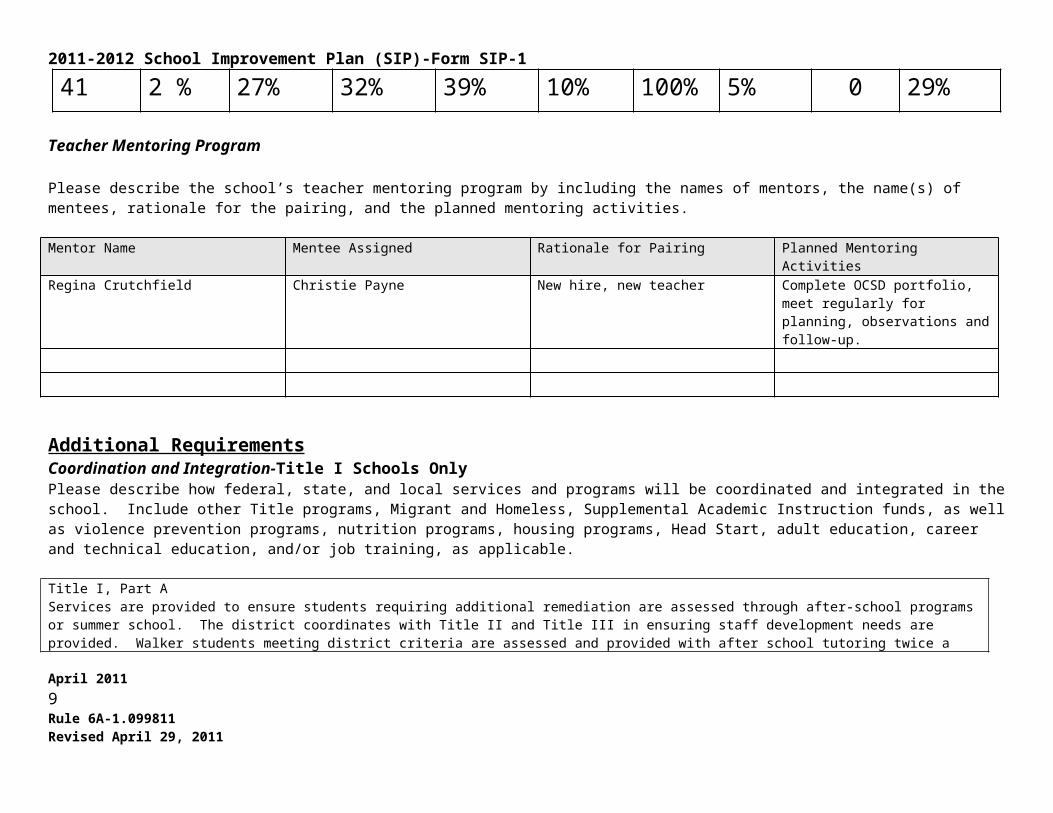
Staff DemographicsPlease complete the following demographic information about the instructional staff in the school. *When using percentages, include the number of teachers the percentage represents (e.g., 70% (35)).
Total Number of Instructional Staff
% of First-Year Teachers
% of Teachers with 1-5 Years of Experience
% of Teachers with 6-14 Years of Experience
% of Teachers with 15+ Years of Experience
% of Teachers with Advanced Degrees
% Highly Qualified Teachers
% Reading Endorsed Teachers
% National Board Certified Teachers
%ESOL EndorsedTeachers
April 2011 6Rule 6A-1.099811Revised April 29, 2011
2011-2012 School Improvement Plan (SIP)-Form SIP-1
41 2 % 27% 32% 39% 10% 100% 5% 0 29%
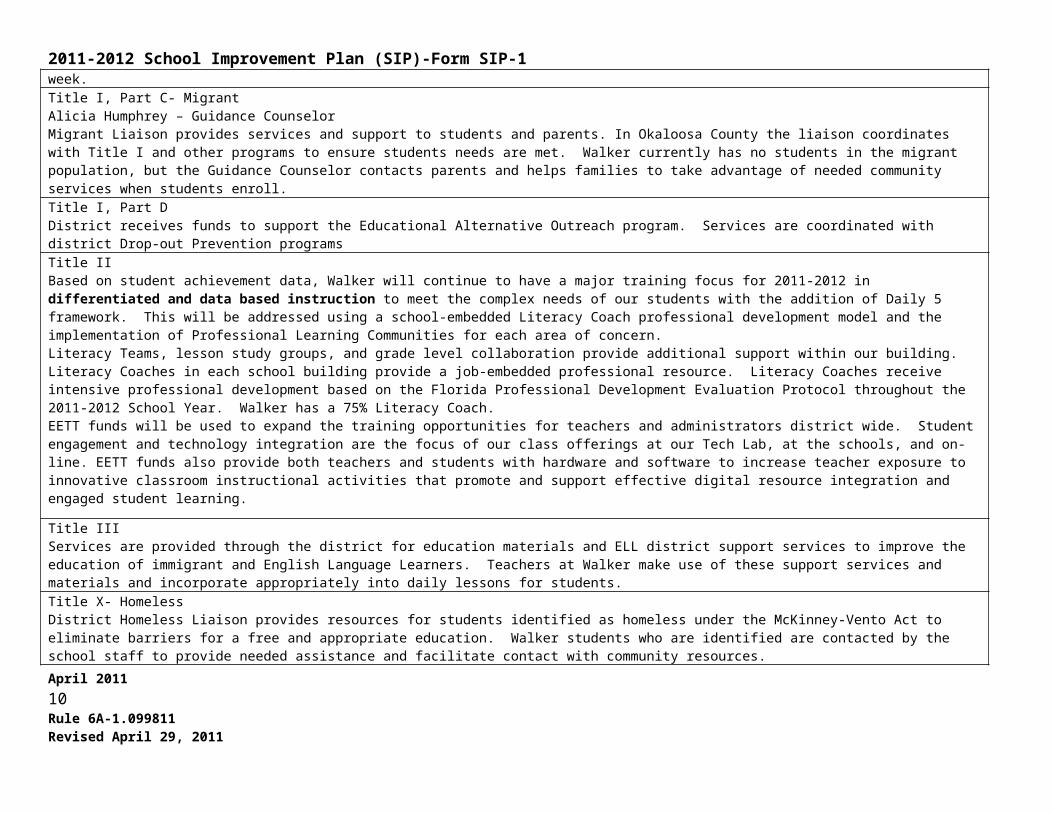
Teacher Mentoring Program
Please describe the school’s teacher mentoring program by including the names of mentors, the name(s) of mentees, rationale for the pairing, and the planned mentoring activities.
Mentor Name Mentee Assigned Rationale for Pairing Planned Mentoring Activities
Regina Crutchfield Christie Payne New hire, new teacher Complete OCSD portfolio, meet regularly for planning, observations and follow-up.
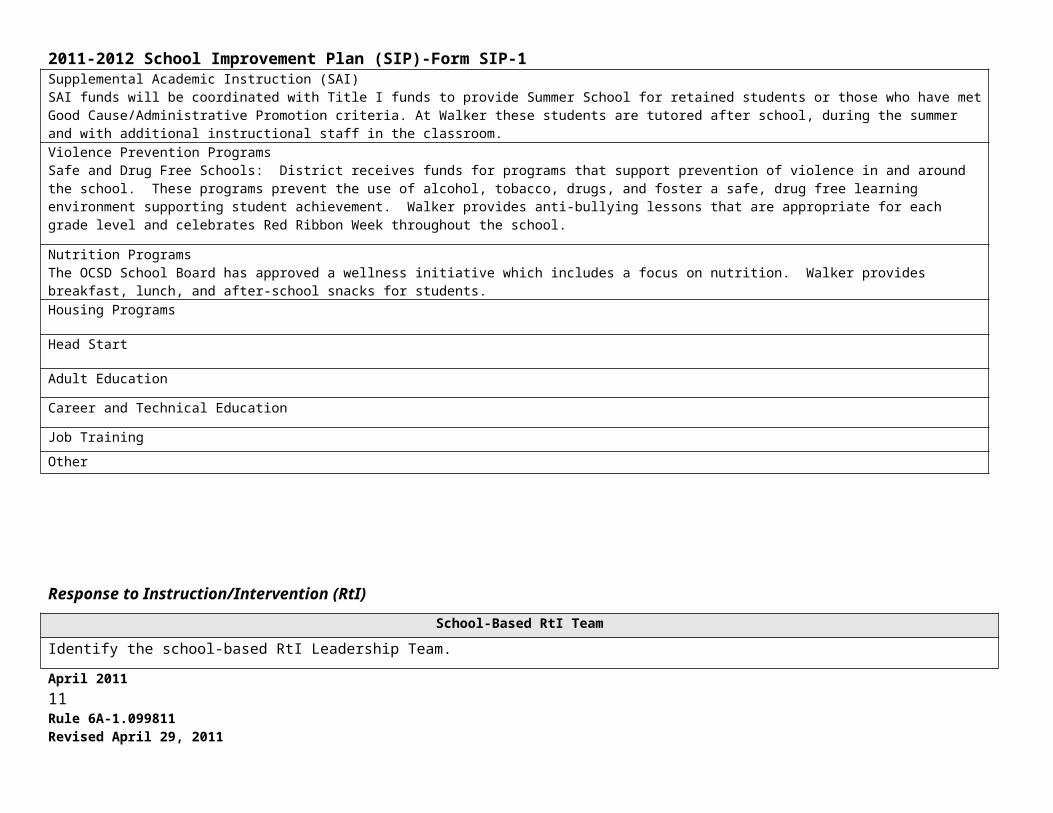
Additional RequirementsCoordination and Integration-Title I Schools Only Please describe how federal, state, and local services and programs will be coordinated and integrated in the school. Include other Title programs, Migrant and Homeless, Supplemental Academic Instruction funds, as well as violence prevention programs, nutrition programs, housing programs, Head Start, adult education, career and technical education, and/or job training, as applicable.
Title I, Part AServices are provided to ensure students requiring additional remediation are assessed through after-school programs or summer school. The district coordinates with Title II and Title III in ensuring staff development needs are provided. Walker students meeting district criteria are assessed and provided with after school tutoring twice a week.Title I, Part C- MigrantAlicia Humphrey – Guidance CounselorMigrant Liaison provides services and support to students and parents. In Okaloosa County the liaison coordinates with Title I and other programs to ensure students needs are met. Walker currently has no students in the migrant population, but the Guidance Counselor contacts parents and helps families to take advantage of needed community services when students enroll.Title I, Part DDistrict receives funds to support the Educational Alternative Outreach program. Services are coordinated with district Drop-out Prevention programsTitle IIBased on student achievement data, Walker will continue to have a major training focus for 2011-2012 in differentiated and data based instruction to meet
April 2011 7Rule 6A-1.099811Revised April 29, 2011
2011-2012 School Improvement Plan (SIP)-Form SIP-1the complex needs of our students with the addition of Daily 5 framework. This will be addressed using a school-embedded Literacy Coach professional development model and the implementation of Professional Learning Communities for each area of concern.Literacy Teams, lesson study groups, and grade level collaboration provide additional support within our building. Literacy Coaches in each school building provide a job-embedded professional resource. Literacy Coaches receive intensive professional development based on the Florida Professional Development Evaluation Protocol throughout the 2011-2012 School Year. Walker has a 75% Literacy Coach.EETT funds will be used to expand the training opportunities for teachers and administrators district wide. Student engagement and technology integration are the focus of our class offerings at our Tech Lab, at the schools, and on-line. EETT funds also provide both teachers and students with hardware and software to increase teacher exposure to innovative classroom instructional activities that promote and support effective digital resource integration and engaged student learning.
Title IIIServices are provided through the district for education materials and ELL district support services to improve the education of immigrant and English Language Learners. Teachers at Walker make use of these support services and materials and incorporate appropriately into daily lessons for students.Title X- HomelessDistrict Homeless Liaison provides resources for students identified as homeless under the McKinney-Vento Act to eliminate barriers for a free and appropriate education. Walker students who are identified are contacted by the school staff to provide needed assistance and facilitate contact with community resources.Supplemental Academic Instruction (SAI)SAI funds will be coordinated with Title I funds to provide Summer School for retained students or those who have met Good Cause/Administrative Promotion criteria. At Walker these students are tutored after school, during the summer and with additional instructional staff in the classroom.Violence Prevention ProgramsSafe and Drug Free Schools: District receives funds for programs that support prevention of violence in and around the school. These programs prevent the use of alcohol, tobacco, drugs, and foster a safe, drug free learning environment supporting student achievement. Walker provides anti-bullying lessons that are appropriate for each grade level and celebrates Red Ribbon Week throughout the school.
Nutrition ProgramsThe OCSD School Board has approved a wellness initiative which includes a focus on nutrition. Walker provides breakfast, lunch, and after-school snacks for students.Housing Programs
Head Start
Adult Education
Career and Technical Education
Job Training
Other
April 2011 8Rule 6A-1.099811Revised April 29, 2011
2011-2012 School Improvement Plan (SIP)-Form SIP-1
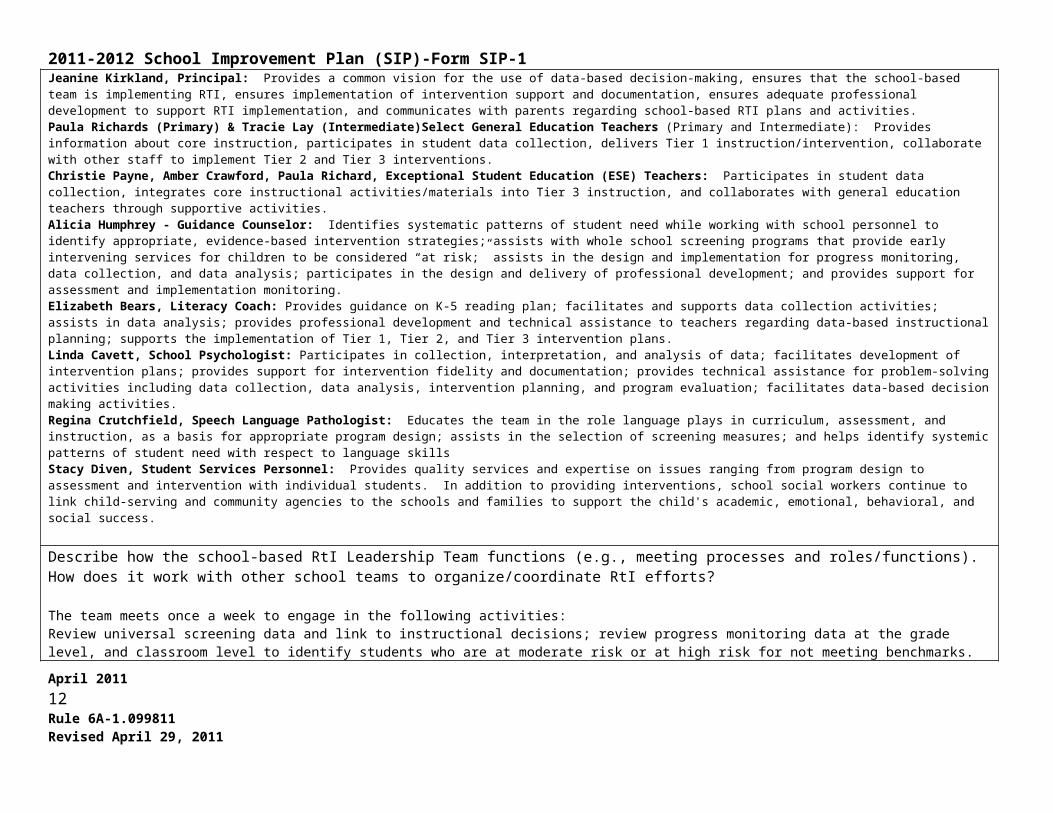
Response to Instruction/Intervention (RtI)School-Based RtI Team
Identify the school-based RtI Leadership Team.Jeanine Kirkland, Principal: Provides a common vision for the use of data-based decision-making, ensures that the school-based team is implementing RTI, ensures implementation of intervention support and documentation, ensures adequate professional development to support RTI implementation, and communicates with parents regarding school-based RTI plans and activities.Paula Richards (Primary) & Tracie Lay (Intermediate)Select General Education Teachers (Primary and Intermediate): Provides information about core instruction, participates in student data collection, delivers Tier 1 instruction/intervention, collaborate with other staff to implement Tier 2 and Tier 3 interventions.Christie Payne, Amber Crawford, Paula Richard, Exceptional Student Education (ESE) Teachers: Participates in student data collection, integrates core instructional activities/materials into Tier 3 instruction, and collaborates with general education teachers through supportive activities.Alicia Humphrey - Guidance Counselor: Identifies systematic patterns of student need while working with school personnel to identify appropriate, evidence-based intervention strategies; assists with whole school screening programs that provide early intervening services for children to be considered “at risk;” assists in the design and implementation for progress monitoring, data collection, and data analysis; participates in the design and delivery of professional development; and provides support for assessment and implementation monitoring.Elizabeth Bears, Literacy Coach: Provides guidance on K-5 reading plan; facilitates and supports data collection activities; assists in data analysis; provides professional development and technical assistance to teachers regarding data-based instructional planning; supports the implementation of Tier 1, Tier 2, and Tier 3 intervention plans.Linda Cavett, School Psychologist: Participates in collection, interpretation, and analysis of data; facilitates development of intervention plans; provides support for intervention fidelity and documentation; provides technical assistance for problem-solving activities including data collection, data analysis, intervention planning, and program evaluation; facilitates data-based decision making activities.Regina Crutchfield, Speech Language Pathologist: Educates the team in the role language plays in curriculum, assessment, and instruction, as a basis for appropriate program design; assists in the selection of screening measures; and helps identify systemic patterns of student need with respect to language skillsStacy Diven, Student Services Personnel: Provides quality services and expertise on issues ranging from program design to assessment and intervention with individual students. In addition to providing interventions, school social workers continue to link child-serving and community agencies to the schools and families to support the child's academic, emotional, behavioral, and social success.
Describe how the school-based RtI Leadership Team functions (e.g., meeting processes and roles/functions). How does it work with other school teams to organize/coordinate RtI efforts?
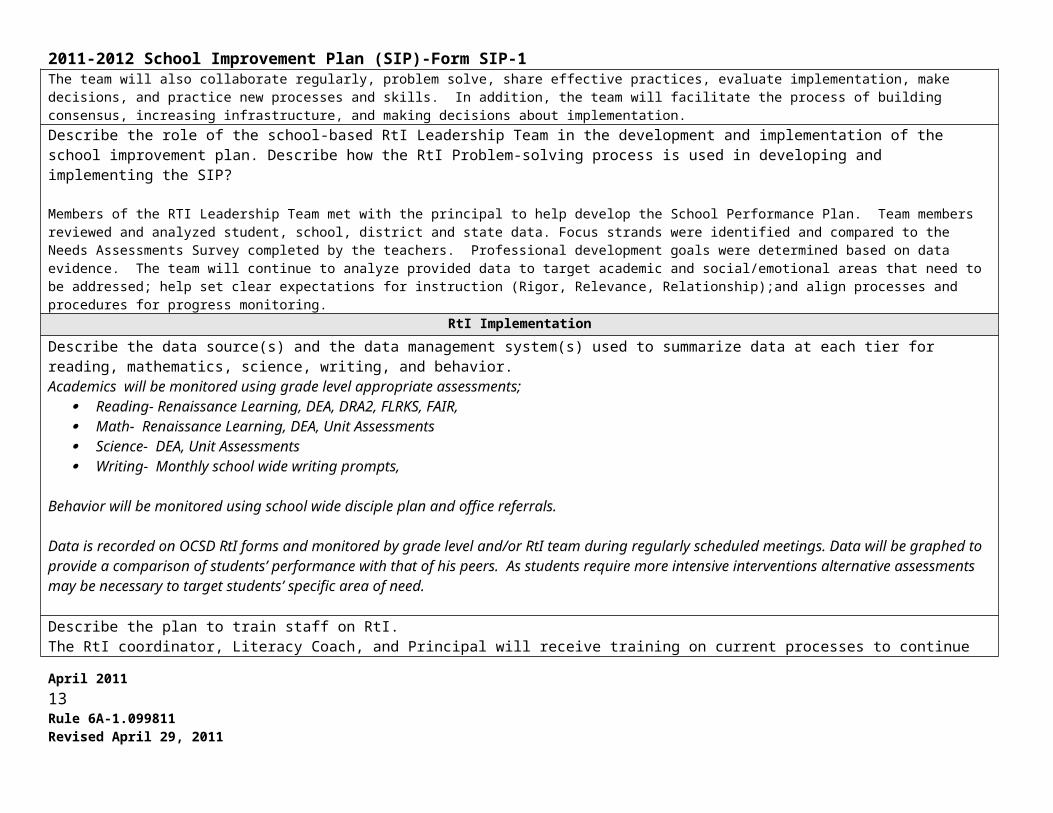
The team meets once a week to engage in the following activities:Review universal screening data and link to instructional decisions; review progress monitoring data at the grade level, and classroom level to identify students who are at moderate risk or at high risk for not meeting benchmarks. The team will also collaborate regularly, problem solve, share effective practices, evaluate implementation, make decisions, and practice new processes and skills. In addition, the team will facilitate the process of building consensus, increasing infrastructure, and making decisions about implementation.Describe the role of the school-based RtI Leadership Team in the development and implementation of the school improvement plan. Describe how the RtI Problem-solving process is used in developing and implementing the SIP?
Members of the RTI Leadership Team met with the principal to help develop the School Performance Plan. Team members reviewed and analyzed student,
April 2011 9Rule 6A-1.099811Revised April 29, 2011
2011-2012 School Improvement Plan (SIP)-Form SIP-1school, district and state data. Focus strands were identified and compared to the Needs Assessments Survey completed by the teachers. Professional development goals were determined based on data evidence. The team will continue to analyze provided data to target academic and social/emotional areas that need to be addressed; help set clear expectations for instruction (Rigor, Relevance, Relationship);and align processes and procedures for progress monitoring.
RtI Implementation
Describe the data source(s) and the data management system(s) used to summarize data at each tier for reading, mathematics, science, writing, and behavior.Academics will be monitored using grade level appropriate assessments;
Reading- Renaissance Learning, DEA, DRA2, FLRKS, FAIR, Math- Renaissance Learning, DEA, Unit Assessments Science- DEA, Unit Assessments Writing- Monthly school wide writing prompts,
Behavior will be monitored using school wide disciple plan and office referrals.
Data is recorded on OCSD RtI forms and monitored by grade level and/or RtI team during regularly scheduled meetings. Data will be graphed to provide a comparison of students’ performance with that of his peers. As students require more intensive interventions alternative assessments may be necessary to target students’ specific area of need.
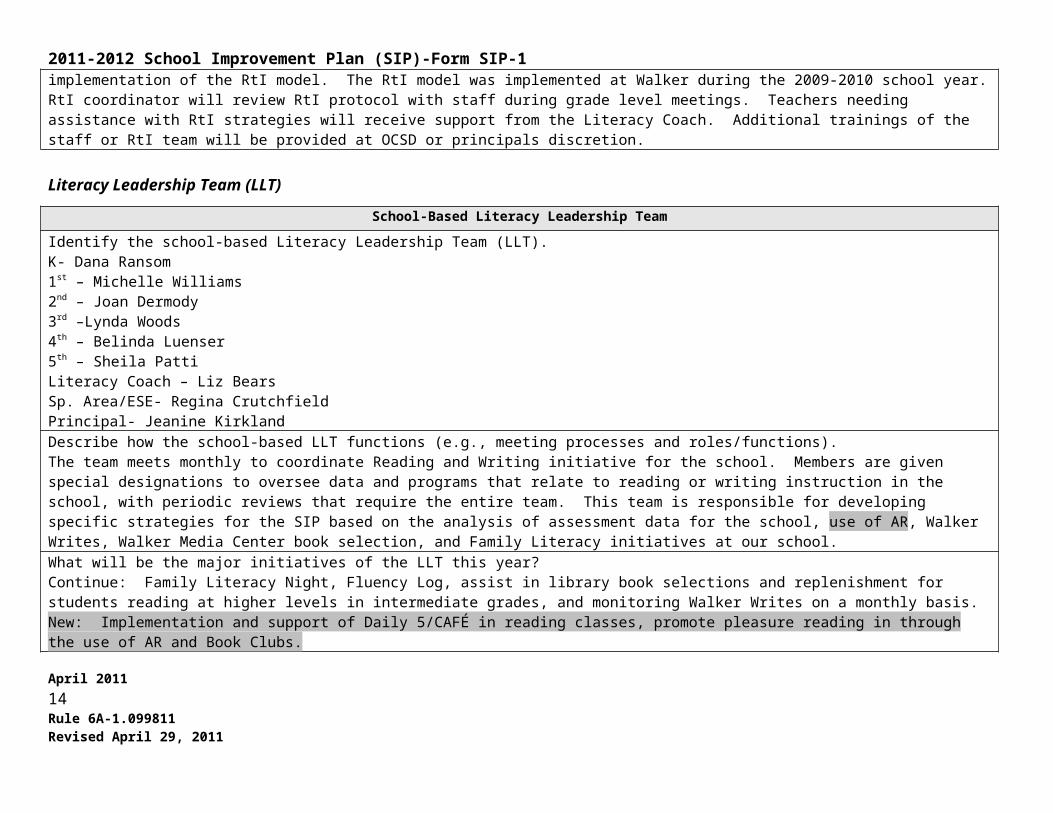
Describe the plan to train staff on RtI.The RtI coordinator, Literacy Coach, and Principal will receive training on current processes to continue implementation of the RtI model. The RtI model was implemented at Walker during the 2009-2010 school year. RtI coordinator will review RtI protocol with staff during grade level meetings. Teachers needing assistance with RtI strategies will receive support from the Literacy Coach. Additional trainings of the staff or RtI team will be provided at OCSD or principals discretion.
Literacy Leadership Team (LLT)
School-Based Literacy Leadership Team
Identify the school-based Literacy Leadership Team (LLT).K- Dana Ransom1st – Michelle Williams2nd – Joan Dermody3rd –Lynda Woods4th – Belinda Luenser5th – Sheila PattiLiteracy Coach – Liz BearsSp. Area/ESE- Regina CrutchfieldPrincipal- Jeanine KirklandApril 2011 10Rule 6A-1.099811Revised April 29, 2011
2011-2012 School Improvement Plan (SIP)-Form SIP-1Describe how the school-based LLT functions (e.g., meeting processes and roles/functions).The team meets monthly to coordinate Reading and Writing initiative for the school. Members are given special designations to oversee data and programs that relate to reading or writing instruction in the school, with periodic reviews that require the entire team. This team is responsible for developing specific strategies for the SIP based on the analysis of assessment data for the school, use of AR, Walker Writes, Walker Media Center book selection, and Family Literacy initiatives at our school.What will be the major initiatives of the LLT this year?Continue: Family Literacy Night, Fluency Log, assist in library book selections and replenishment for students reading at higher levels in intermediate grades, and monitoring Walker Writes on a monthly basis. New: Implementation and support of Daily 5/CAFÉ in reading classes, promote pleasure reading in through the use of AR and Book Clubs.
NCLB Public School Choice
Notification of School in Need of Improvement (SINI) Status Upload a copy of the Notification of SINI Status to Parents in the designated upload link on the “Upload” page.
Public School Choice with Transportation (CWT) NotificationUpload a copy of the CWT Notification to Parents in the designated upload link on the “Upload” page.
Supplemental Educational Services (SES) NotificationUpload a copy of the SES Notification to Parents in the designated upload link on the “Upload” page.
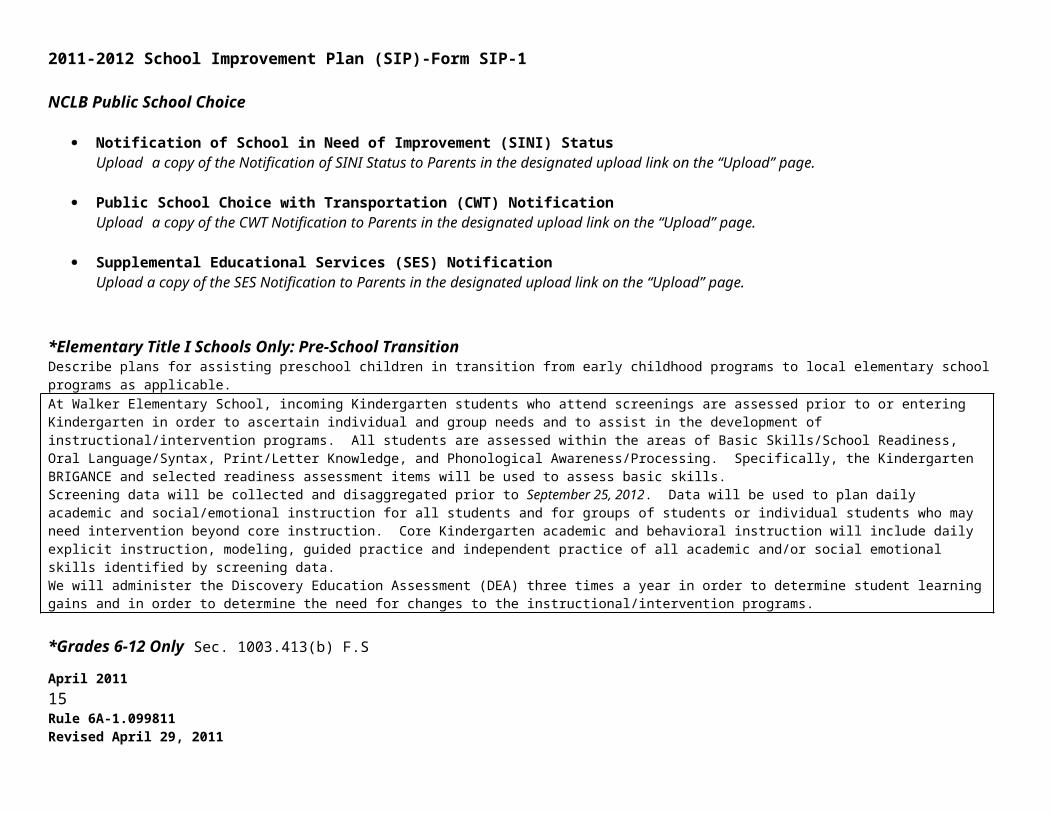
*Elementary Title I Schools Only: Pre-School TransitionDescribe plans for assisting preschool children in transition from early childhood programs to local elementary school programs as applicable.At Walker Elementary School, incoming Kindergarten students who attend screenings are assessed prior to or entering Kindergarten in order to ascertain individual and group needs and to assist in the development of instructional/intervention programs. All students are assessed within the areas of Basic Skills/School Readiness, Oral Language/Syntax, Print/Letter Knowledge, and Phonological Awareness/Processing. Specifically, the Kindergarten BRIGANCE and selected readiness assessment items will be used to assess basic skills.Screening data will be collected and disaggregated prior to September 25, 2012. Data will be used to plan daily academic and social/emotional instruction for all students and for groups of students or individual students who may need intervention beyond core instruction. Core Kindergarten academic and behavioral instruction will include daily explicit instruction, modeling, guided practice and independent practice of all academic and/or social emotional skills identified by screening data.We will administer the Discovery Education Assessment (DEA) three times a year in order to determine student learning gains and in order to determine the need for changes to the instructional/intervention programs.
*Grades 6-12 Only Sec. 1003.413(b) F.SFor schools with Grades 6-12, describe the plan to ensure that teaching reading strategies is the responsibility of every teacher.
April 2011 11Rule 6A-1.099811Revised April 29, 2011
2011-2012 School Improvement Plan (SIP)-Form SIP-1
*High Schools Only
Note: Required for High School- Sec. 1008.37(4), F.S., Sec. 1003.413(g)(j) F.S.How does the school incorporate applied and integrated courses to help students see the relationships between subjects and relevance to their future?
How does the school incorporate students’ academic and career planning, as well as promote student course selections, so that students’ course of study is personally meaningful?
Postsecondary Transition
Note: Required for High School- Sec. 1008.37(4), F.S. Describe strategies for improving student readiness for the public postsecondary level based on annual analysis of the High School Feedback Report.
April 2011 12Rule 6A-1.099811Revised April 29, 2011
2011-2012 School Improvement Plan (SIP)-Form SIP-1
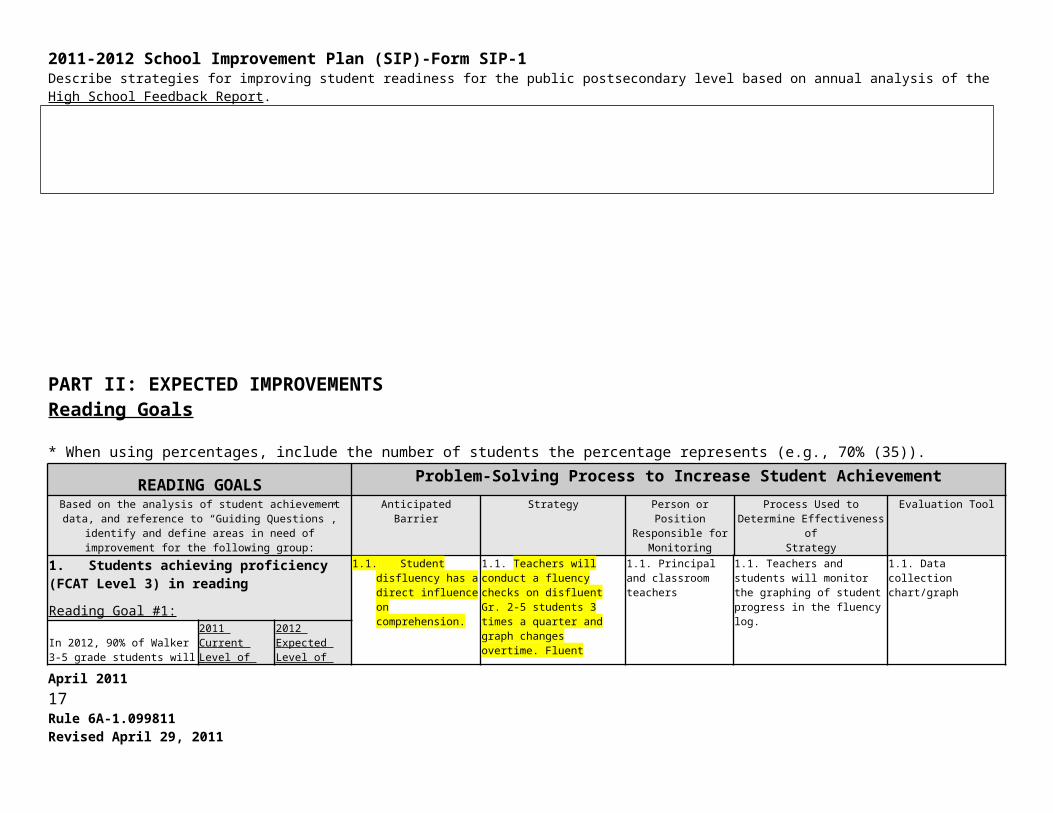
PART II: EXPECTED IMPROVEMENTSReading Goals
* When using percentages, include the number of students the percentage represents (e.g., 70% (35)).
READING GOALS Problem-Solving Process to Increase Student AchievementBased on the analysis of student achievement data, and reference to
“Guiding Questions”, identify and define areas in need of improvement for the following group:
Anticipated Barrier Strategy Person or Position Responsible for
Monitoring
Process Used to Determine Effectiveness of
Strategy
Evaluation Tool
1. Students achieving proficiency (FCAT Level 3) in reading
Reading Goal #1:
1.1. Student disfluency has a direct influence on comprehension.
1.1. Teachers will conduct a fluency checks on disfluent Gr. 2-5 students 3 times a quarter and graph changes overtime. Fluent students will be progress monitored through 2 fluency per quarter.
1.1. Principal and classroom teachers
1.1. Teachers and students will monitor the graphing of student progress in the fluency log.
1.1. Data collection chart/graph
In 2012, 90% of Walker 3-5 grade students will achieve a level 3 or above on FCAT.
2011 Current Level of Performance:*
2012 Expected Level of Performance:*
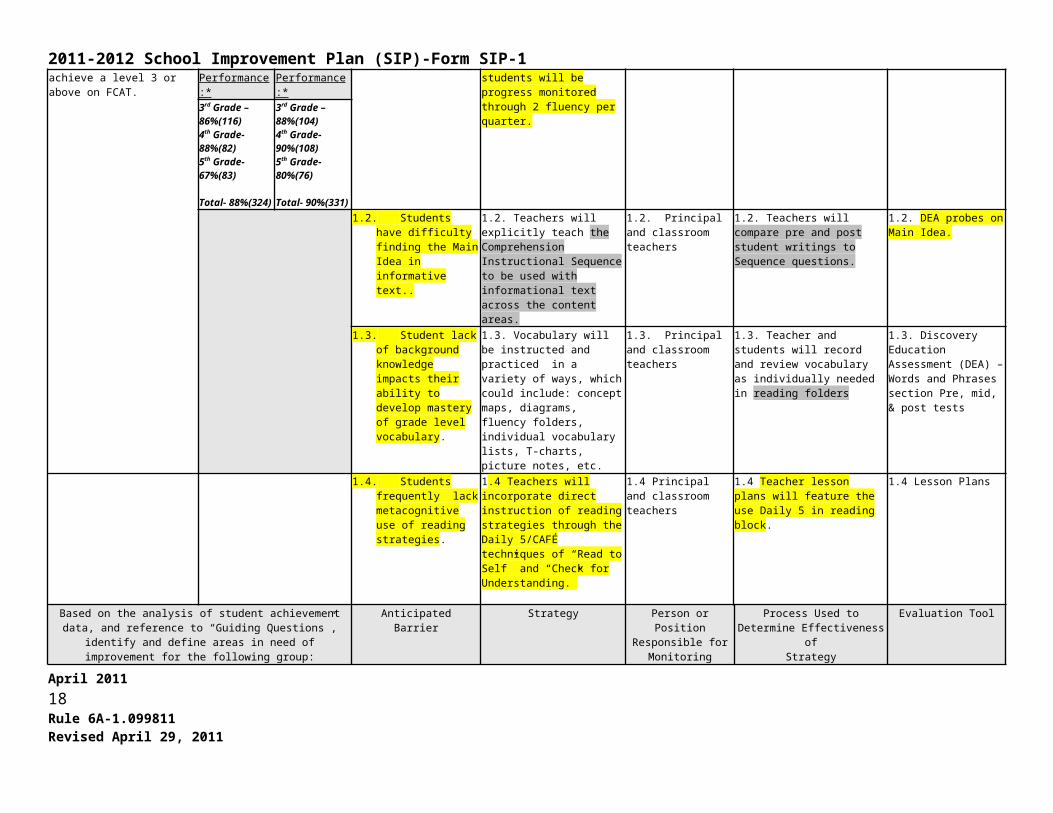
3rd Grade – 86%(116)4th Grade- 88%(82)5th Grade- 67%(83)
Total- 88%(324)
3rd Grade –88%(104)4th Grade- 90%(108)5th Grade- 80%(76)
Total- 90%(331)
1.2. Students have difficulty finding the Main Idea in informative text..
1.2. Teachers will explicitly teach the Comprehension Instructional Sequence to be used with informational text across the content areas.
1.2. Principal and classroom teachers
1.2. Teachers will compare pre and post student writings to Sequence questions.
1.2. DEA probes on Main Idea.
1.3. Student lack of background knowledge impacts their ability to develop mastery of grade level vocabulary.
1.3. Vocabulary will be instructed and practiced in a variety of ways, which could include: concept maps, diagrams, fluency folders, individual vocabulary lists, T-charts, picture notes, etc.
1.3. Principal and classroom teachers
1.3. Teacher and students will record and review vocabulary as individually needed in reading folders
1.3. Discovery Education Assessment (DEA) – Words and Phrases section Pre, mid, & post tests
1.4. Students frequently lack metacognitive use of reading strategies.
1.4 Teachers will incorporate direct instruction of reading strategies through the Daily 5/CAFÉ techniques of “Read to Self” and “Check for Understanding.”
1.4 Principal and classroom teachers
1.4 Teacher lesson plans will feature the use Daily 5 in reading block.
1.4 Lesson Plans
April 2011 13Rule 6A-1.099811Revised April 29, 2011
2011-2012 School Improvement Plan (SIP)-Form SIP-1
Based on the analysis of student achievement data, and reference to “Guiding Questions”, identify and define areas in need of
improvement for the following group:
Anticipated Barrier Strategy Person or Position Responsible for
Monitoring
Process Used to Determine Effectiveness of
Strategy
Evaluation Tool
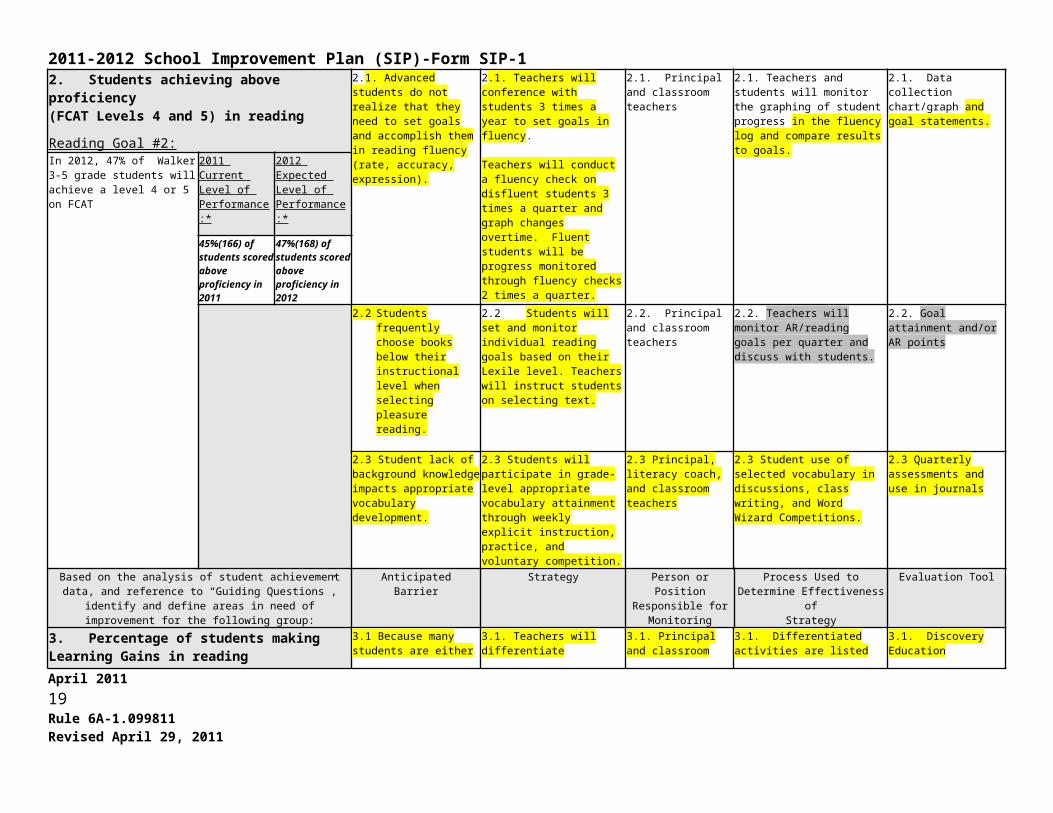
2. Students achieving above proficiency(FCAT Levels 4 and 5) in reading
Reading Goal #2:
2.1. Advanced students do not realize that they need to set goals and accomplish them in reading fluency (rate, accuracy, expression).
2.1. Teachers will conference with students 3 times a year to set goals in fluency.
Teachers will conduct a fluency check on disfluent students 3 times a quarter and graph changes overtime. Fluent students will be progress monitored through fluency checks 2 times a quarter.
2.1. Principal and classroom teachers
2.1. Teachers and students will monitor the graphing of student progress in the fluency log and compare results to goals.
2.1. Data collection chart/graph and goal statements.
In 2012, 47% of Walker 3-5 grade students will achieve a level 4 or 5 on FCAT
2011 Current Level of Performance:*
2012 Expected Level of Performance:*
45%(166) of students scored above proficiency in 2011
47%(168) of students scored above proficiency in 2012
2.2 Students frequently choose books below their instructional level when selecting pleasure reading.
2.2 Students will set and monitor individual reading goals based on their Lexile level. Teachers will instruct students on selecting text.
2.2. Principal and classroom teachers
2.2. Teachers will monitor AR/reading goals per quarter and discuss with students.
2.2. Goal attainment and/or AR points
2.3 Student lack of background knowledge impacts appropriate vocabulary development.
2.3 Students will participate in grade-level appropriate vocabulary attainment through weekly explicit instruction, practice, and voluntary competition.
2.3 Principal, literacy coach, and classroom teachers
2.3 Student use of selected vocabulary in discussions, class writing, and Word Wizard Competitions.
2.3 Quarterly assessments and use in journals
Based on the analysis of student achievement data, and reference to “Guiding Questions”, identify and define areas in need of
improvement for the following group:
Anticipated Barrier Strategy Person or Position Responsible for
Monitoring
Process Used to Determine Effectiveness of
Strategy
Evaluation Tool
3. Percentage of students making Learning Gains in reading
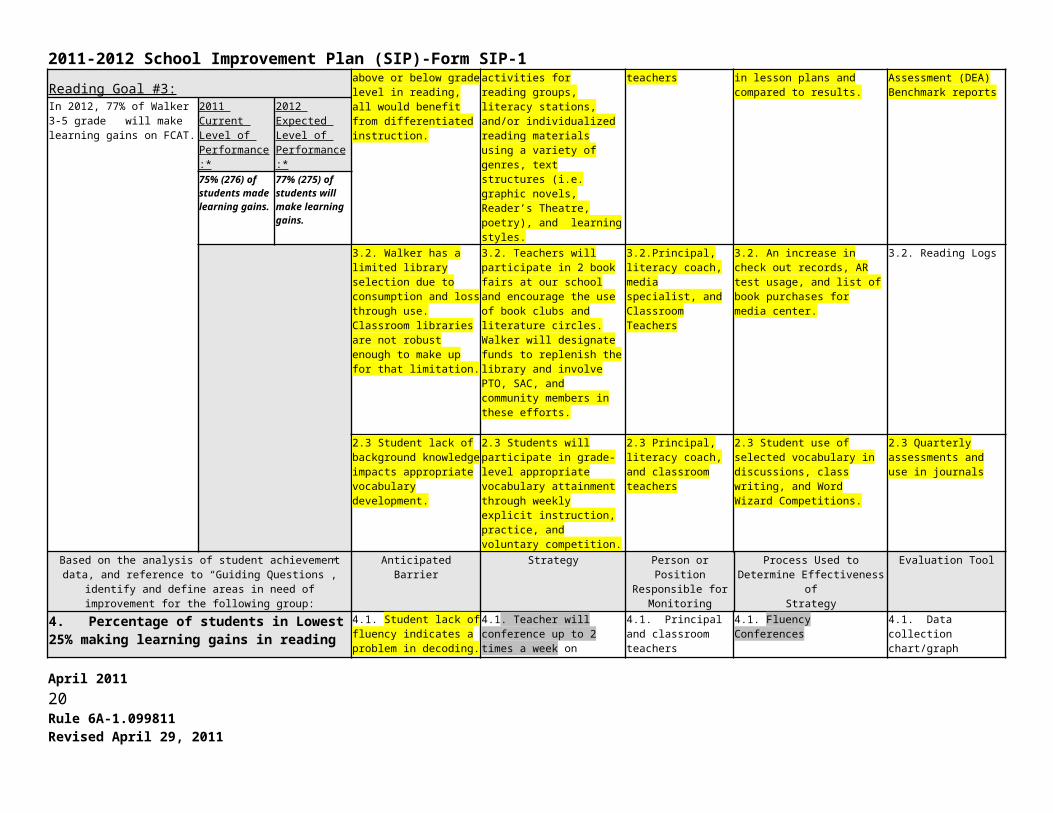
Reading Goal #3:
3.1 Because many students are either above or below grade level in reading, all would benefit from differentiated instruction.
3.1. Teachers will differentiate activities for reading groups, literacy stations, and/or individualized reading materials using a variety of genres, text structures (i.e. graphic novels, Reader’s Theatre, poetry), and learning styles.
3.1. Principal and classroom teachers
3.1. Differentiated activities are listed in lesson plans and compared to results.
3.1. Discovery Education Assessment (DEA) Benchmark reports
In 2012, 77% of Walker 3-5 grade will make learning gains on FCAT.
2011 Current Level of Performance:*
2012 Expected Level of Performance:*
75% (276) of students made learning gains.
77% (275) of students will make learning gains.
3.2. Walker has a limited library selection due to consumption and loss through use. Classroom
3.2. Teachers will participate in 2 book fairs at our school and encourage the use of book clubs and literature circles. Walker will
3.2.Principal, literacy coach, media specialist, and Classroom Teachers
3.2. An increase in check out records, AR test usage, and list of book purchases for media center.
3.2. Reading Logs
April 2011 14Rule 6A-1.099811Revised April 29, 2011
2011-2012 School Improvement Plan (SIP)-Form SIP-1libraries are not robust enough to make up for that limitation.
designate funds to replenish the library and involve PTO, SAC, and community members in these efforts.
2.3 Student lack of background knowledge impacts appropriate vocabulary development.
2.3 Students will participate in grade-level appropriate vocabulary attainment through weekly explicit instruction, practice, and voluntary competition.
2.3 Principal, literacy coach, and classroom teachers
2.3 Student use of selected vocabulary in discussions, class writing, and Word Wizard Competitions.
2.3 Quarterly assessments and use in journals
Based on the analysis of student achievement data, and reference to “Guiding Questions”, identify and define areas in need of
improvement for the following group:
Anticipated Barrier Strategy Person or Position Responsible for
Monitoring
Process Used to Determine Effectiveness of
Strategy
Evaluation Tool
4. Percentage of students in Lowest 25% making learning gains in reading
Reading Goal #4:
4.1. Student lack of fluency indicates a problem in decoding.
Lack of fluency impacts acquisition of vocabulary and comprehension.
4.1. Teacher will conference up to 2 times a week on students as needed and graph changes in fluency over time.
4.1. Principal and classroom teachers
4.1. Fluency Conferences 4.1. Data collection chart/graph
In 2012, 70% of Walker’s lowest 25% 3-5 grade students will make learning gains on FCAT.
2011 Current Level of Performance:*
2012 Expected Level of Performance:*
68% (60) of Walker’s lowest 25% 3-5 grade students made learning gains.
70% (62) of Walker’s lowest 25% 3-5 grade students will make learning gains.
4.2 Teacher incorporation of a variety of informative texts at student lexile level.
4.2. Teachers will explicitly teach the Comprehension Instructional Sequence to be used with informational text across the content areas.
4.2. Principal and classroom teachers
4.2. Teachers will compare pre and post student writings to comprehension prompts or questions.
4.2. Grades on comprehension prompts.
4.3 Vocabulary development to facilitate reading comprehension
4.3 Students will participate in grade-level appropriate vocabulary attainment through weekly explicit instruction and practice.
4.3 Principal, Literacy Coach, and Classroom Teacher
4.3 Quarterly Evaluations 4.3 DEA and Grades
4.4 Student response to interventions during the school day
4.4 Students will be provided specific, targeted instruction.Students will have an opportunity to attend before, during and/or after school tutoring.Students will be instructed and progress monitored by Title I teachers.Students not responding to the above interventions will be reviewed by the RtI and/or
4.4 Principal, Title I teachers and classroom teacher
4.4 Classroom teachers, Title I teachers and students will monitor students performance on weekly assessments, reading logs, and grades.
4.4 Classroom grades and AR
April 2011 15Rule 6A-1.099811Revised April 29, 2011
2011-2012 School Improvement Plan (SIP)-Form SIP-1Literacy Leadership team for redirection of instructional focus.
Based on the analysis of student achievement data, and reference to “Guiding Questions”, identify and define areas in need of
improvement for the applicable subgroup(s):
Anticipated Barrier Strategy Person or Position Responsible for
Monitoring
Process Used to Determine Effectiveness of
Strategy
Evaluation Tool
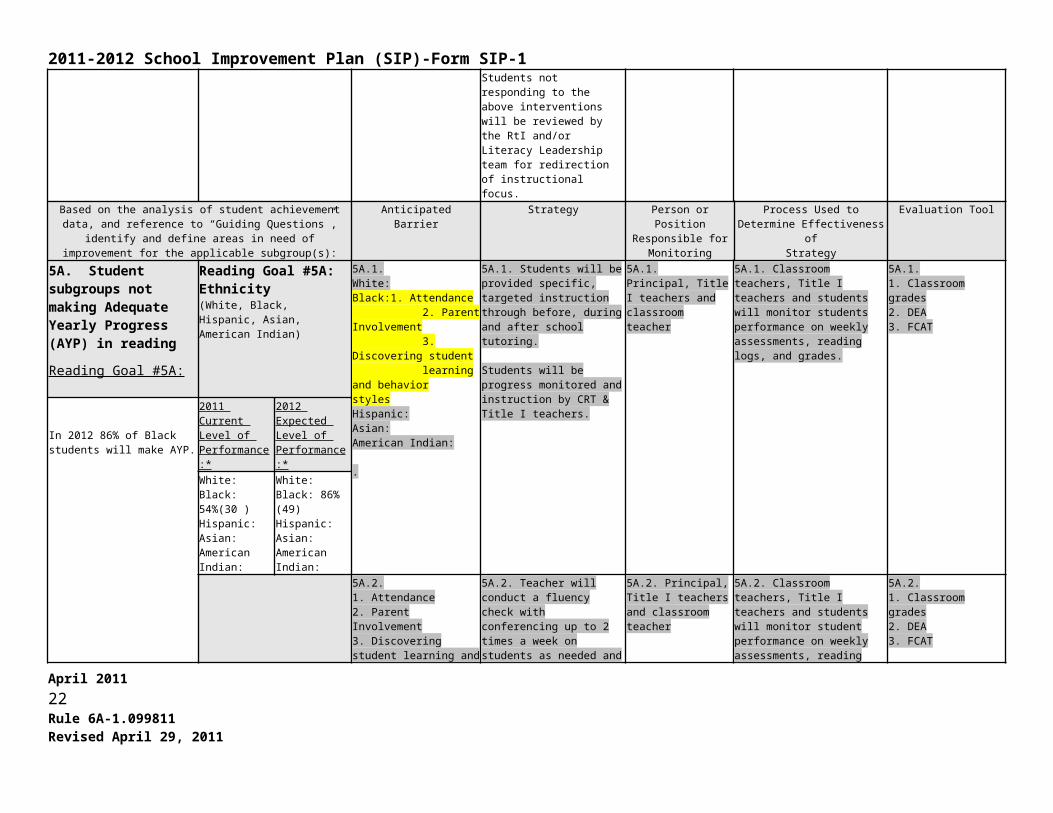
5A. Student subgroups not making Adequate Yearly Progress (AYP) in reading
Reading Goal #5A:
Reading Goal #5A:Ethnicity(White, Black, Hispanic, Asian,American Indian)
5A.1.White:Black:1. Attendance 2. Parent Involvement 3. Discovering student learning and behavior stylesHispanic:Asian:American Indian:
.
5A.1. Students will be provided specific, targeted instruction through before, during and after school tutoring.
Students will be progress monitored and instruction by CRT & Title I teachers.
5A.1. Principal, Title I teachers and classroom teacher
5A.1. Classroom teachers, Title I teachers and students will monitor students performance on weekly assessments, reading logs, and grades.
5A.1.1. Classroom grades2. DEA3. FCAT
In 2012 86% of Black students will make AYP.
2011 Current Level of Performance:*
2012 Expected Level of Performance:*
White:Black: 54%(30 )Hispanic:Asian:American Indian:
White:Black: 86% (49)Hispanic:Asian:American Indian:
5A.2.1. Attendance2. Parent Involvement3. Discovering student learning and behavior styles.
5A.2. Teacher will conduct a fluency check with conferencing up to 2 times a week on students as needed and graph changes overtime.
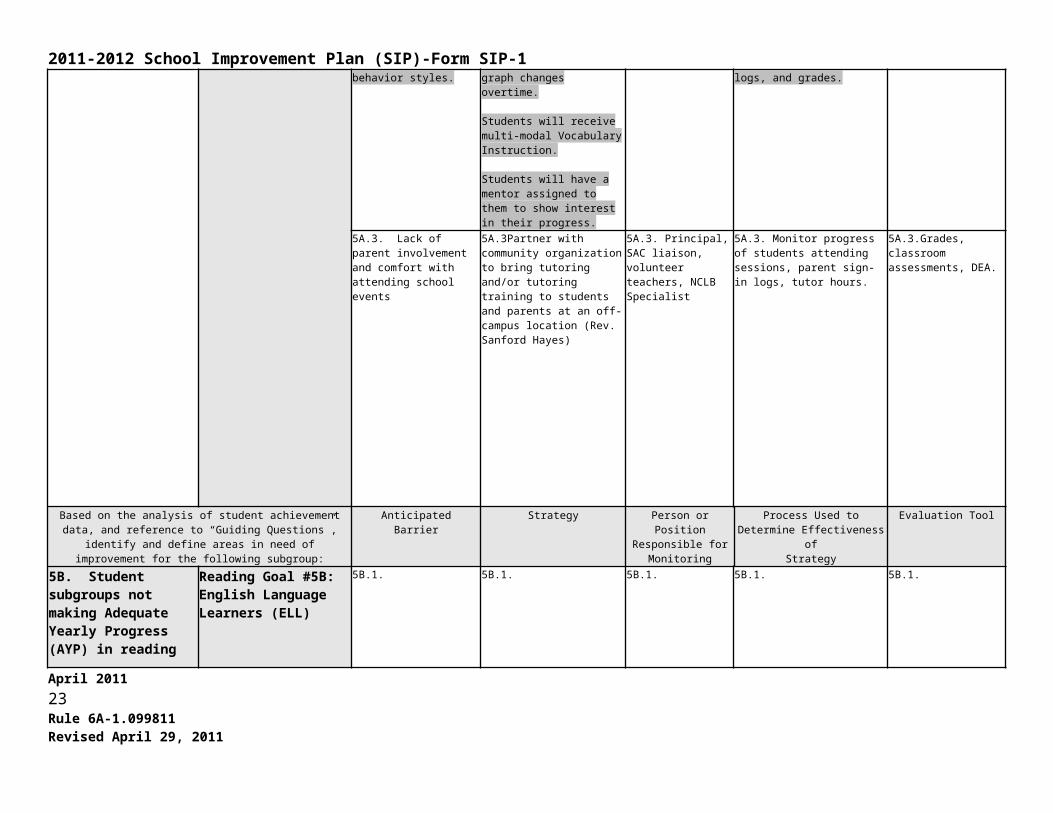
Students will receive multi-modal Vocabulary Instruction.
Students will have a mentor assigned to them to show interest in their progress.
5A.2. Principal, Title I teachers and classroom teacher
5A.2. Classroom teachers, Title I teachers and students will monitor student performance on weekly assessments, reading logs, and grades.
5A.2.1. Classroom grades2. DEA3. FCAT
5A.3. Lack of parent involvement and comfort with attending school events
5A.3Partner with community organization to bring tutoring and/or tutoring training to students and parents at an off-campus location (Rev. Sanford Hayes)
5A.3. Principal, SAC liaison, volunteer teachers, NCLB Specialist
5A.3. Monitor progress of students attending sessions, parent sign-in logs, tutor hours.
5A.3.Grades, classroom assessments, DEA.
April 2011 16Rule 6A-1.099811Revised April 29, 2011
2011-2012 School Improvement Plan (SIP)-Form SIP-1Based on the analysis of student achievement data, and reference to
“Guiding Questions”, identify and define areas in need of improvement for the following subgroup:
Anticipated Barrier Strategy Person or Position Responsible for
Monitoring
Process Used to Determine Effectiveness of
Strategy
Evaluation Tool
5B. Student subgroups not making Adequate Yearly Progress (AYP) in reading
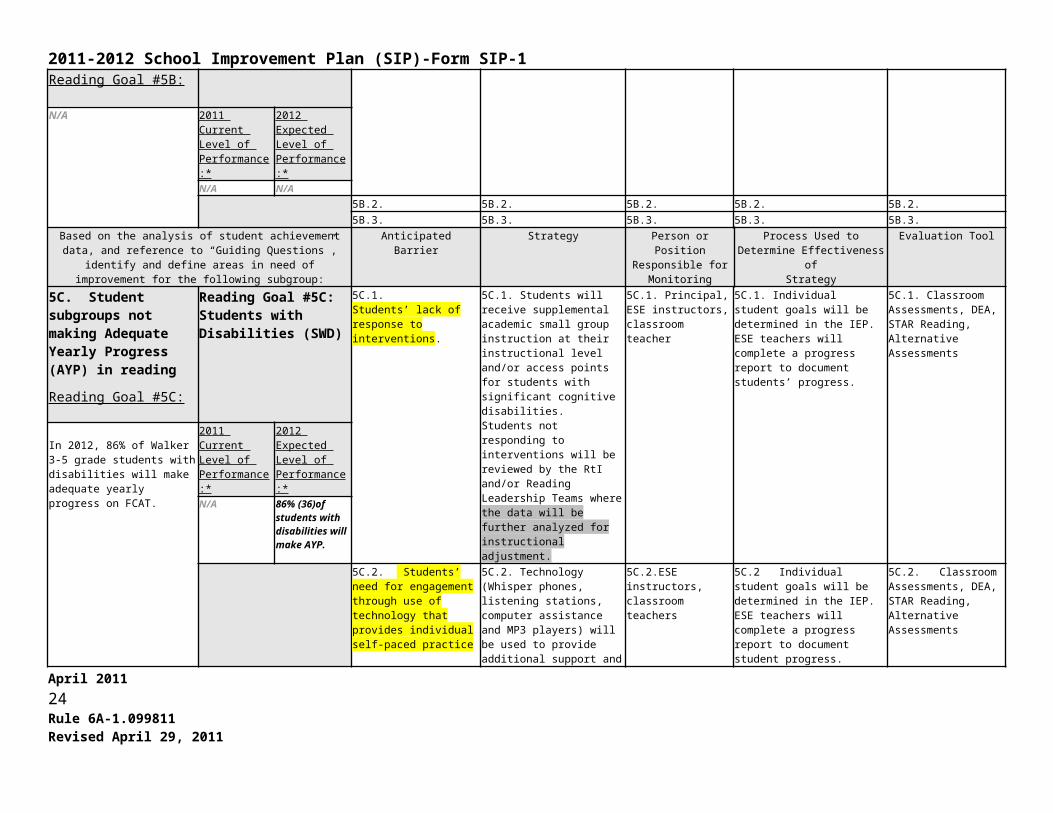
Reading Goal #5B:
Reading Goal #5B:English Language Learners (ELL)
5B.1. 5B.1. 5B.1. 5B.1. 5B.1.
N/A 2011 Current Level of Performance:*
2012 Expected Level of Performance:*
N/A N/A5B.2. 5B.2. 5B.2. 5B.2. 5B.2.5B.3. 5B.3. 5B.3. 5B.3. 5B.3.
Based on the analysis of student achievement data, and reference to “Guiding Questions”, identify and define areas in need of
improvement for the following subgroup:
Anticipated Barrier Strategy Person or Position Responsible for
Monitoring
Process Used to Determine Effectiveness of
Strategy
Evaluation Tool
5C. Student subgroups not making Adequate Yearly Progress (AYP) in reading
Reading Goal #5C:
Reading Goal #5C:Students with Disabilities (SWD)
5C.1.Students’ lack of response to interventions.
5C.1. Students will receive supplemental academic small group instruction at their instructional level and/or access points for students with significant cognitive disabilities. Students not responding to interventions will be reviewed by the RtI and/or Reading Leadership Teams where the data will be further analyzed for instructional adjustment.
5C.1. Principal, ESE instructors, classroom teacher
5C.1. Individual student goals will be determined in the IEP. ESE teachers will complete a progress report to document students’ progress.
5C.1. Classroom Assessments, DEA, STAR Reading, Alternative Assessments
In 2012, 86% of Walker 3-5 grade students with disabilities will make adequate yearly progress on FCAT.
2011 Current Level of Performance:*
2012 Expected Level of Performance:*
N/A 86% (36)of students with disabilities will make AYP.
5C.2. Students’ need for engagement through use of technology that provides individual self-paced practice
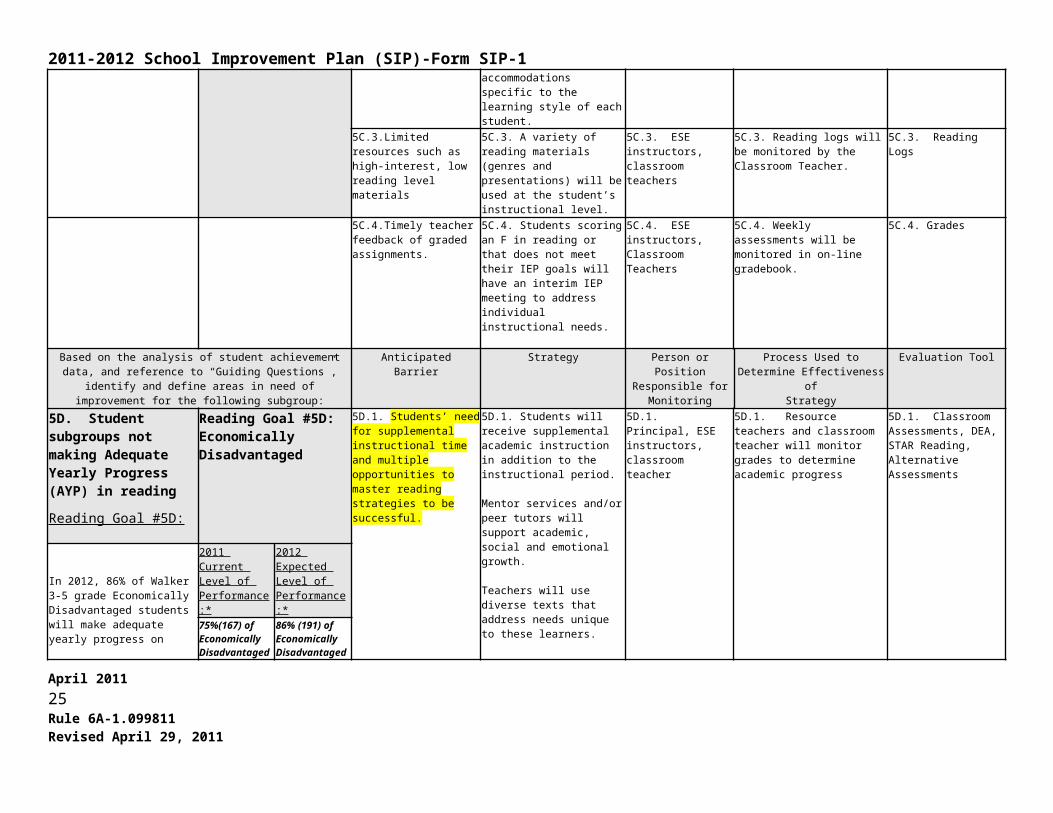
5C.2. Technology (Whisper phones, listening stations, computer assistance and MP3 players) will be used to provide additional support and accommodations specific to the learning style of each student.
5C.2.ESE instructors, classroom teachers
5C.2 Individual student goals will be determined in the IEP. ESE teachers will complete a progress report to document student progress.
5C.2. Classroom Assessments, DEA, STAR Reading, Alternative Assessments
5C.3.Limited resources such as high-interest, low reading level materials
5C.3. A variety of reading materials (genres and presentations) will be used at the student’s instructional level.
5C.3. ESE instructors, classroom teachers
5C.3. Reading logs will be monitored by the Classroom Teacher.
5C.3. Reading Logs
5C.4.Timely teacher feedback of graded assignments.
5C.4. Students scoring an F in reading or that does not meet their IEP goals will have an
5C.4. ESE instructors, Classroom Teachers
5C.4. Weekly assessments will be monitored in on-line gradebook.
5C.4. Grades
April 2011 17Rule 6A-1.099811Revised April 29, 2011
2011-2012 School Improvement Plan (SIP)-Form SIP-1interim IEP meeting to address individual instructional needs.
Based on the analysis of student achievement data, and reference to “Guiding Questions”, identify and define areas in need of
improvement for the following subgroup:
Anticipated Barrier Strategy Person or Position Responsible for
Monitoring
Process Used to Determine Effectiveness of
Strategy
Evaluation Tool
5D. Student subgroups not making Adequate Yearly Progress (AYP) in reading
Reading Goal #5D:
Reading Goal #5D:Economically Disadvantaged
5D.1. Students’ need for supplemental instructional time and multiple opportunities to master reading strategies to be successful.
5D.1. Students will receive supplemental academic instruction in addition to the instructional period.
Mentor services and/or peer tutors will support academic, social and emotional growth.
Teachers will use diverse texts that address needs unique to these learners.
5D.1. Principal, ESE instructors, classroom teacher
5D.1. Resource teachers and classroom teacher will monitor grades to determine academic progress
5D.1. Classroom Assessments, DEA, STAR Reading, Alternative Assessments
In 2012, 86% of Walker 3-5 grade Economically Disadvantaged students will make adequate yearly progress on FCAT..
2011 Current Level of Performance:*
2012 Expected Level of Performance:*
75%(167) of Economically Disadvantaged Students made AYP.
86% (191) of Economically Disadvantaged Students will make AYP.
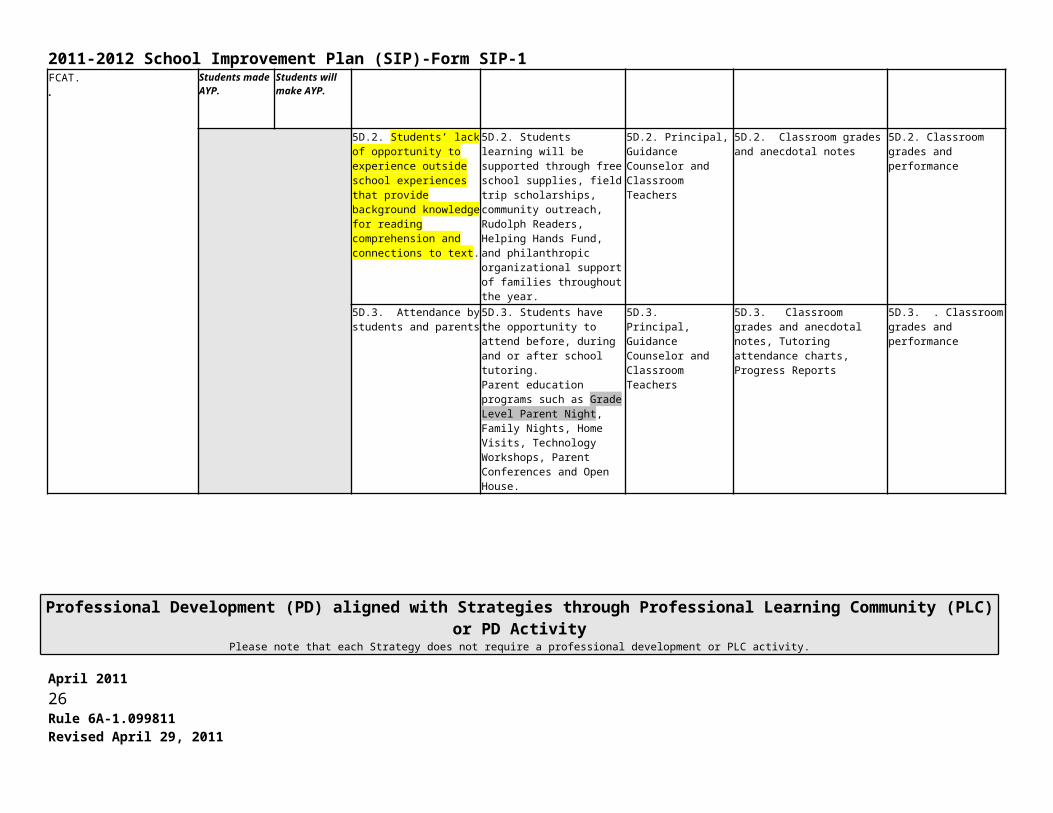
5D.2. Students’ lack of opportunity to experience outside school experiences that provide background knowledge for reading comprehension and connections to text.
5D.2. Students learning will be supported through free school supplies, field trip scholarships, community outreach, Rudolph Readers, Helping Hands Fund, and philanthropic organizational support of families throughout the year.
5D.2. Principal, Guidance Counselor and Classroom Teachers
5D.2. Classroom grades and anecdotal notes
5D.2. Classroom grades and performance
5D.3. Attendance by students and parents
5D.3. Students have the opportunity to attend before, during and or after school tutoring.Parent education programs such as Grade Level Parent Night, Family Nights, Home Visits, Technology Workshops, Parent Conferences and Open House.
5D.3. Principal, Guidance Counselor and Classroom Teachers
5D.3. Classroom grades and anecdotal notes, Tutoring attendance charts, Progress Reports
5D.3. . Classroom grades and performance
Professional Development (PD) aligned with Strategies through Professional Learning Community (PLC) or PD ActivityApril 2011 18Rule 6A-1.099811Revised April 29, 2011
2011-2012 School Improvement Plan (SIP)-Form SIP-1Please note that each Strategy does not require a professional development or PLC activity.
PD Content /Topicand/or PLC Focus Grade
Level/Subject
PD Facilitatorand/or
PLC Leader
PD Participants(e.g. , PLC, subject, grade level, or
school-wide)
Target Dates and Schedules(e.g. , Early Release) and
Schedules (e.g., frequency of meetings)
Strategy for Follow-up/Monitoring Person or Position Responsible for Monitoring
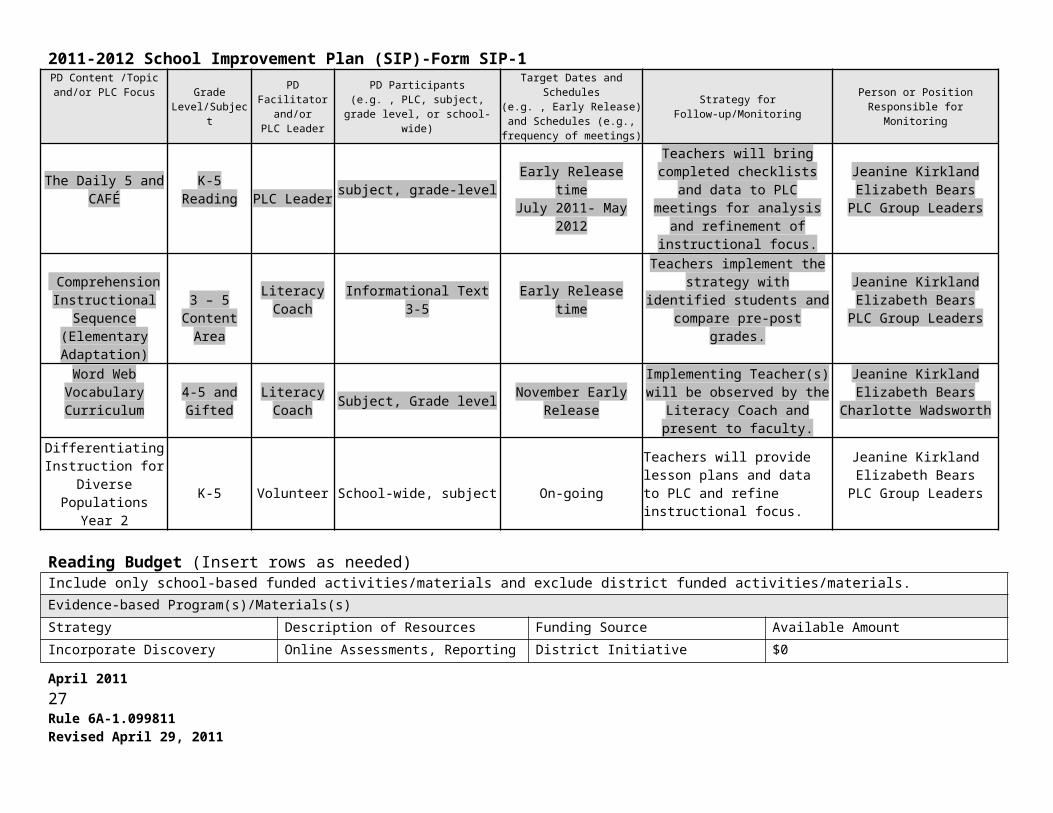
The Daily 5 and CAFÉ K-5 Reading PLC Leader subject, grade-level Early Release time
July 2011- May 2012
Teachers will bring completed checklists and data to PLC meetings for analysis and
refinement of instructional focus.
Jeanine KirklandElizabeth Bears
PLC Group Leaders
Comprehension Instructional Sequence
(Elementary Adaptation)
3 – 5 Content Area
Literacy Coach
Informational Text3-5 Early Release time
Teachers implement the strategy with identified students and compare pre-post grades.
Jeanine KirklandElizabeth Bears
PLC Group Leaders
Word Web Vocabulary Curriculum
4-5 and Gifted
Literacy Coach Subject, Grade level November Early Release
Implementing Teacher(s) will be observed by the Literacy Coach
and present to faculty.
Jeanine KirklandElizabeth Bears
Charlotte Wadsworth
Differentiating Instruction for
Diverse PopulationsYear 2
K-5 Volunteer School-wide, subject On-going
Teachers will provide lesson plans and data to PLC and refine instructional focus.
Jeanine KirklandElizabeth Bears
PLC Group Leaders
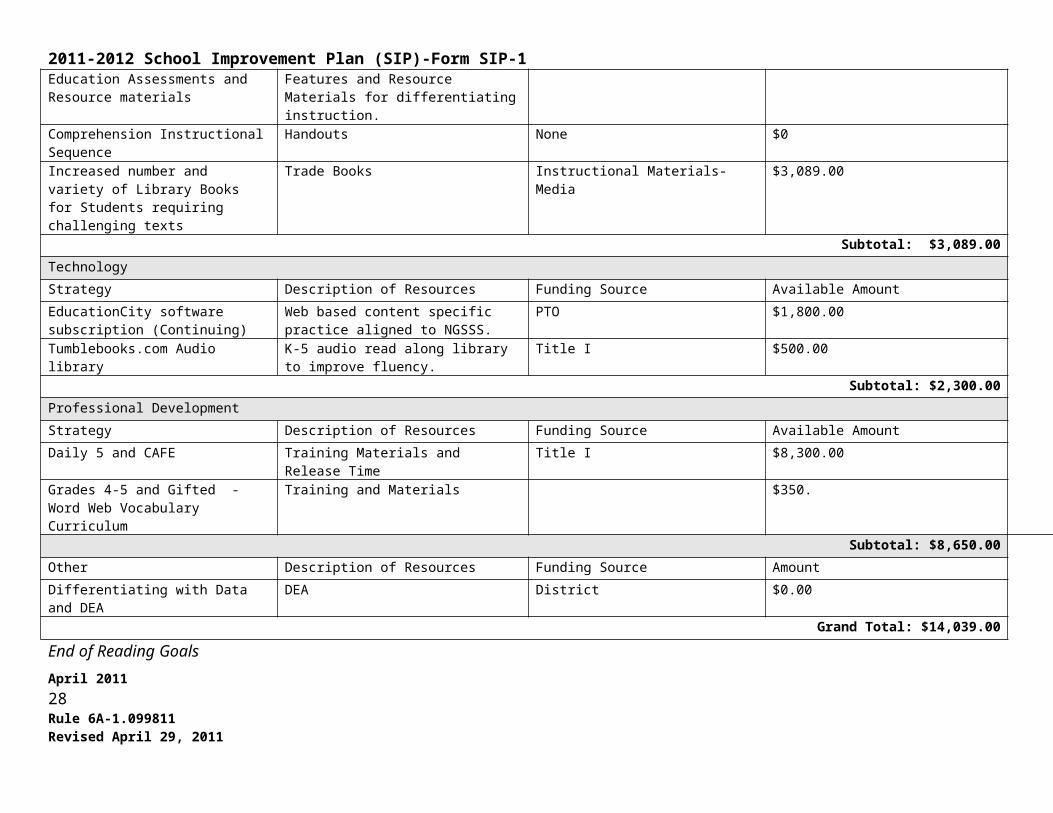
Reading Budget (Insert rows as needed)Include only school-based funded activities/materials and exclude district funded activities/materials.Evidence-based Program(s)/Materials(s)Strategy Description of Resources Funding Source Available AmountIncorporate Discovery Education Assessments and Resource materials
Online Assessments, Reporting Features and Resource Materials for differentiating instruction.
District Initiative $0
Comprehension Instructional Sequence Handouts None $0Increased number and variety of Library Books for Students requiring challenging texts
Trade Books Instructional Materials-Media $3,089.00
Subtotal: $3,089.00TechnologyStrategy Description of Resources Funding Source Available AmountEducationCity software subscription Web based content specific practice aligned PTO $1,800.00
April 2011 19Rule 6A-1.099811Revised April 29, 2011
2011-2012 School Improvement Plan (SIP)-Form SIP-1(Continuing) to NGSSS.Tumblebooks.com Audio library K-5 audio read along library to improve
fluency.Title I $500.00
Subtotal: $2,300.00Professional DevelopmentStrategy Description of Resources Funding Source Available AmountDaily 5 and CAFE Training Materials and Release Time Title I $8,300.00Grades 4-5 and Gifted - Word Web Vocabulary Curriculum
Training and Materials $350.
Subtotal: $8,650.00Other Description of Resources Funding Source AmountDifferentiating with Data and DEA DEA District $0.00
Grand Total: $14,039.00End of Reading Goals
April 2011 20Rule 6A-1.099811Revised April 29, 2011

2011-2012 School Improvement Plan (SIP)-Form SIP-1Mathematics Goals
MATHEMATICS GOALS Problem-Solving Process to Increase Student AchievementBased on the analysis of student achievement data, and reference to
“Guiding Questions”, identify and define areas in need of improvement for the following group:
Anticipated Barrier Strategy Person or Position Responsible for
Monitoring
Process Used to Determine Effectiveness of
Strategy
Evaluation Tool
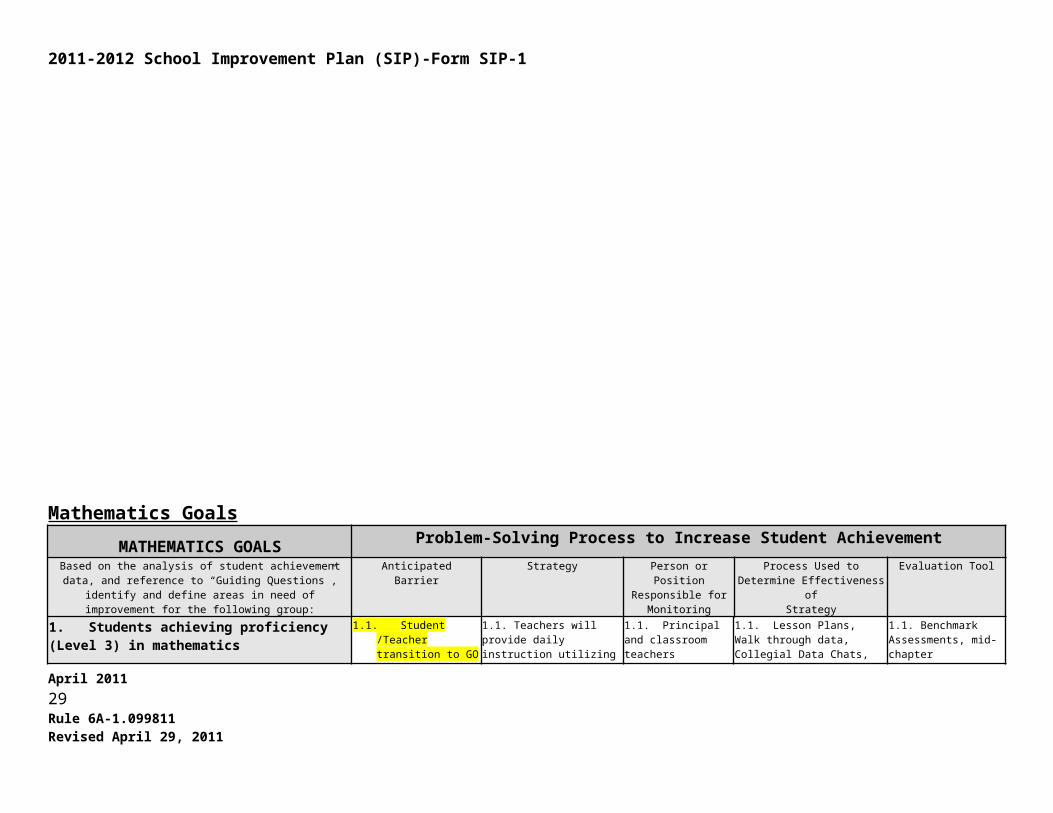
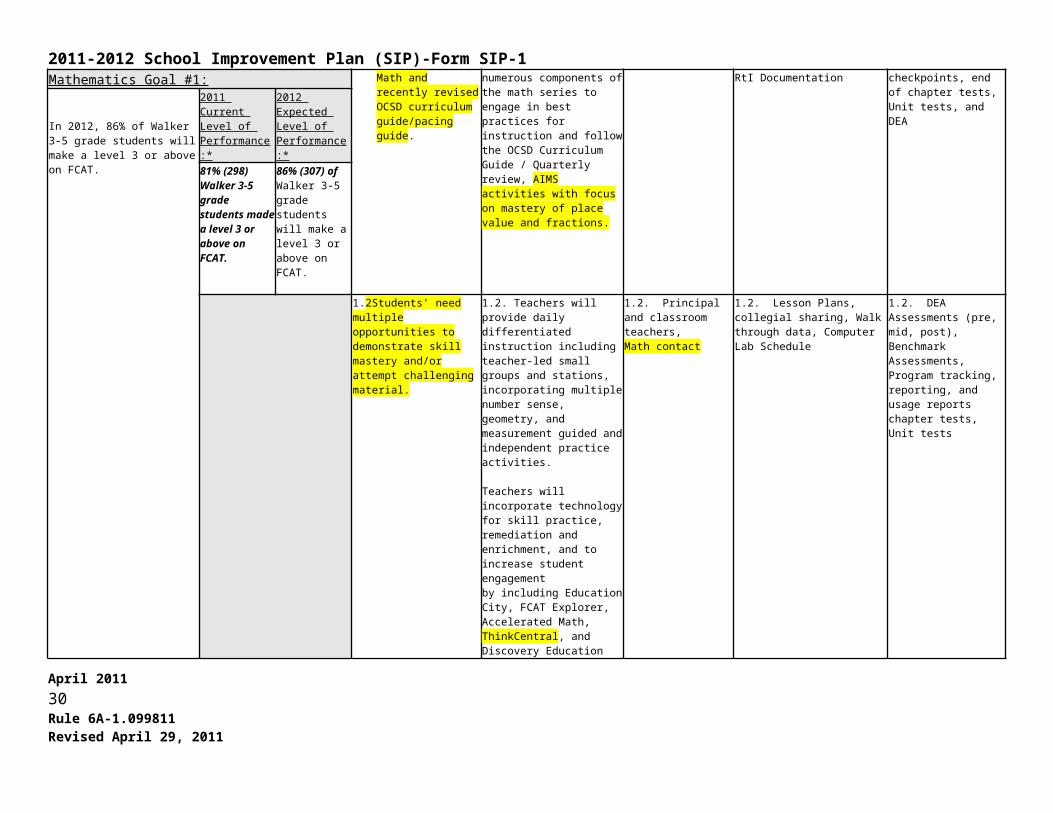
1. Students achieving proficiency (Level 3) in mathematics
Mathematics Goal #1:
1.1. Student /Teacher transition to GO Math and recently revised OCSD curriculum guide/pacing guide.
1.1. Teachers will provide daily instruction utilizing numerous components of the math series to engage in best practices for instruction and follow the OCSD Curriculum Guide / Quarterly review, AIMS activities with focus on mastery of place value and fractions.
1.1. Principal and classroom teachers
1.1. Lesson Plans, Walk through data, Collegial Data Chats, RtI Documentation
1.1. Benchmark Assessments, mid-chapter checkpoints, end of chapter tests, Unit tests, and DEA
In 2012, 86% of Walker 3-5 grade students will make a level 3 or above on FCAT.
2011 Current Level of Performance:*
2012 Expected Level of Performance:*
81% (298) Walker 3-5 grade students made a level 3 or above on FCAT.
86% (307) of Walker 3-5 grade students will make a level 3 or above on FCAT.
1.2Students’ need multiple opportunities to demonstrate skill mastery and/or attempt challenging material.
1.2. Teachers will provide daily differentiated instruction including teacher-led small groups and stations, incorporating multiple number sense, geometry, and measurement guided and independent practice activities.
Teachers will incorporate technology for skill practice, remediation and enrichment, and to increase student engagementby including Education City, FCAT Explorer, Accelerated Math, ThinkCentral, and Discovery Education resources.
1.2. Principal and classroom teachers,Math contact
1.2. Lesson Plans, collegial sharing, Walk through data, Computer Lab Schedule
1.2. DEA Assessments (pre, mid, post), Benchmark Assessments, Program tracking, reporting, and usage reports chapter tests, Unit tests
April 2011 21Rule 6A-1.099811Revised April 29, 2011
2011-2012 School Improvement Plan (SIP)-Form SIP-1Based on the analysis of student achievement data, and reference to
“Guiding Questions”, identify and define areas in need of improvement for the following group:
Anticipated Barrier Strategy Person or Position Responsible for
Monitoring
Process Used to Determine Effectiveness of
Strategy
Evaluation Tool
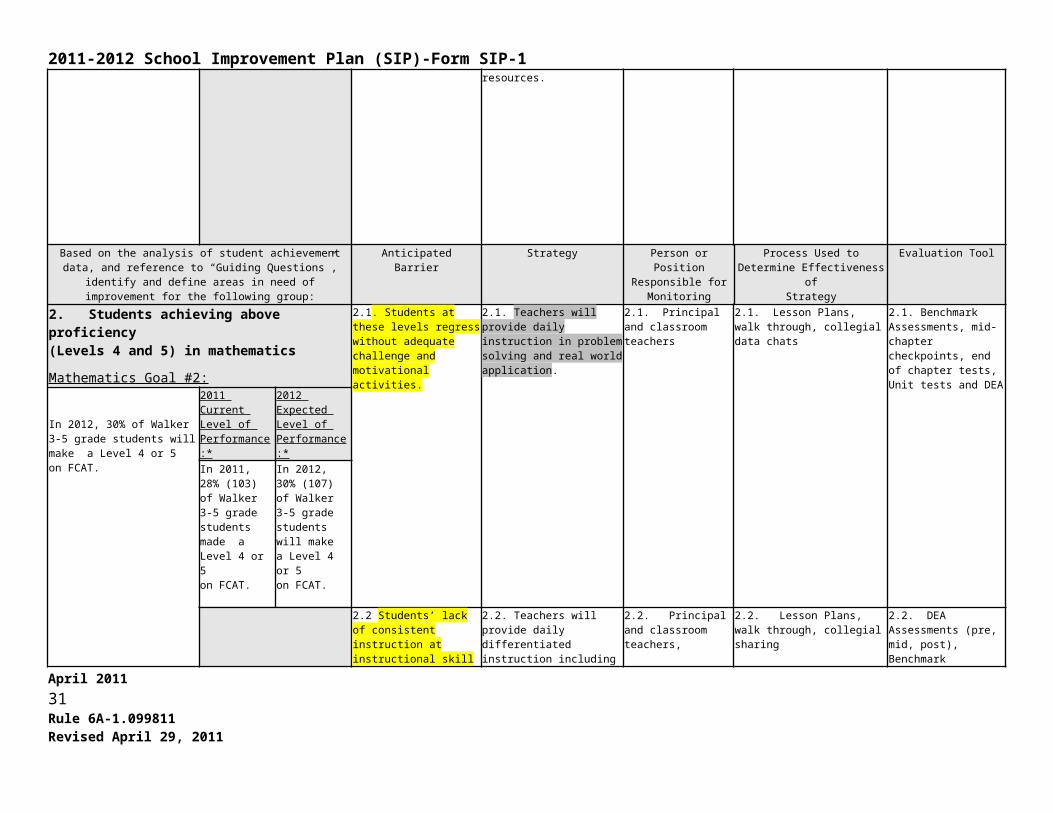
2. Students achieving above proficiency(Levels 4 and 5) in mathematics
Mathematics Goal #2:
2.1. Students at these levels regress without adequate challenge and motivational activities.
2.1. Teachers will provide daily instruction in problem solving and real world application.
2.1. Principal and classroom teachers
2.1. Lesson Plans, walk through, collegial data chats
2.1. Benchmark Assessments, mid-chapter checkpoints, end of chapter tests, Unit tests and DEA
In 2012, 30% of Walker 3-5 grade students will make a Level 4 or 5on FCAT.
2011 Current Level of Performance:*
2012 Expected Level of Performance:*
In 2011, 28% (103) of Walker 3-5 grade students made a Level 4 or 5on FCAT.
In 2012, 30% (107) of Walker 3-5 grade students will make a Level 4 or 5on FCAT.
2.2 Students’ lack of consistent instruction at instructional skill level
2.2. Teachers will provide daily differentiated instruction including teacher-led small groups and stations, incorporating multiple number sense, geometry, and measurement activities.
2.2. Principal and classroom teachers,
2.2. Lesson Plans, walk through, collegial sharing
2.2. DEA Assessments (pre, mid, post), Benchmark Assessments, chapter tests, Unit tests
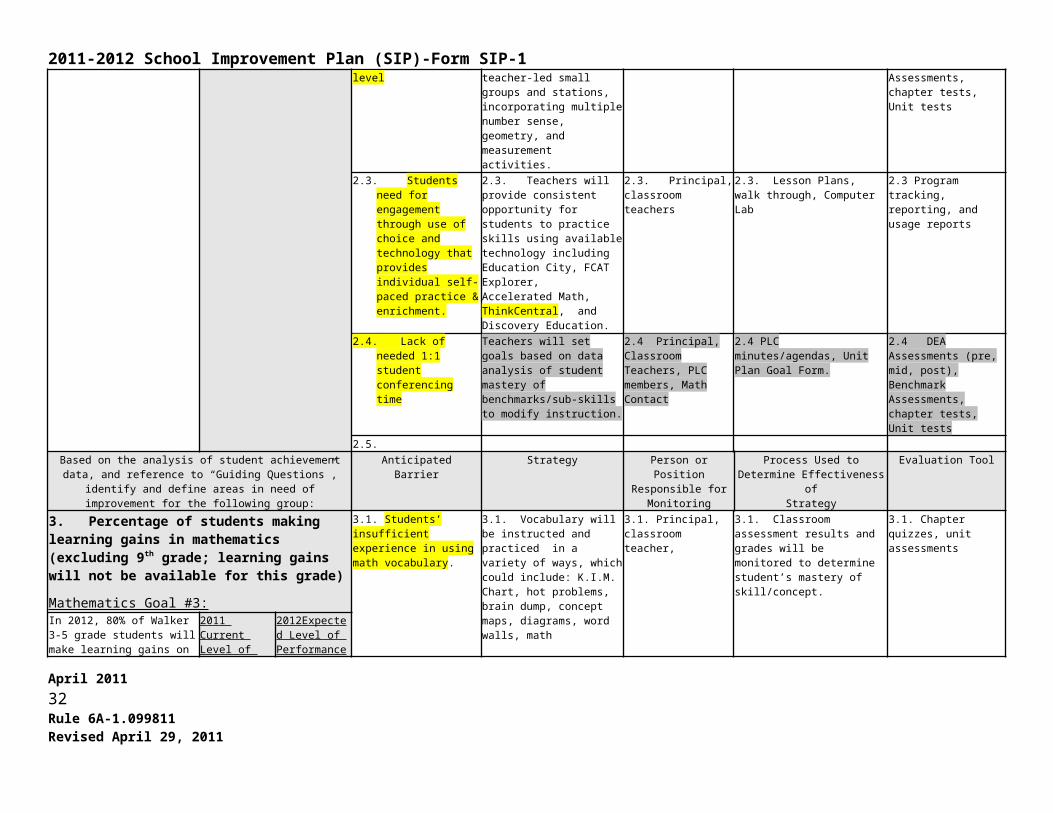
2.3. Students need for engagement through use of choice and technology that provides individual self-paced practice & enrichment.
2.3. Teachers will provide consistent opportunity for students to practice skills using available technology including Education City, FCAT Explorer, Accelerated Math, ThinkCentral, and Discovery Education.
2.3. Principal, classroom teachers
2.3. Lesson Plans, walk through, Computer Lab
2.3 Program tracking, reporting, and usage reports
2.4. Lack of needed 1:1 student conferencing time
Teachers will set goals based on data analysis of student mastery of benchmarks/sub-skills to modify instruction.
2.4 Principal, Classroom Teachers, PLC members, Math Contact
2.4 PLC minutes/agendas, Unit Plan Goal Form.
2.4 DEA Assessments (pre, mid, post), Benchmark Assessments, chapter tests, Unit tests
2.5.Based on the analysis of student achievement data, and reference to
“Guiding Questions”, identify and define areas in need of improvement for the following group:
Anticipated Barrier Strategy Person or Position Responsible for
Monitoring
Process Used to Determine Effectiveness of
Strategy
Evaluation Tool
3. Percentage of students making learning gains in mathematics (excluding 9th grade; learning gains will not be available for this grade)
Mathematics Goal #3:
3.1. Students’ insufficient experience in using math vocabulary.
3.1. Vocabulary will be instructed and practiced in a variety of ways, which could include: K.I.M. Chart, hot problems, brain dump, concept maps, diagrams, word walls, math journals/notebooks,T-charts, picture notes, etc.
3.1. Principal, classroom teacher,
3.1. Classroom assessment results and grades will be monitored to determine student’s mastery of skill/concept.
3.1. Chapter quizzes, unit assessments
In 2012, 80% of Walker 3-5 grade students will make learning gains on FCAT.
2011 Current Level of Performance:*
2012Expected Level of Performance:*
April 2011 22Rule 6A-1.099811Revised April 29, 2011
2011-2012 School Improvement Plan (SIP)-Form SIP-1
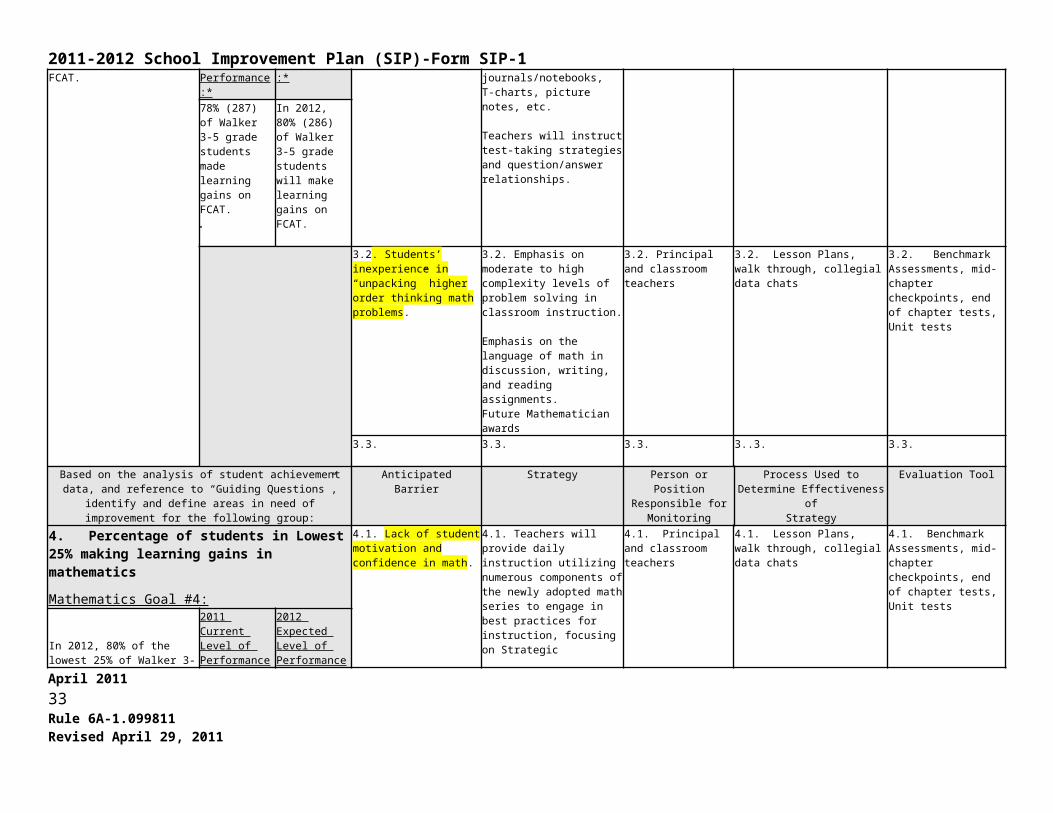
Teachers will instruct test-taking strategies and question/answer relationships.
78% (287) of Walker 3-5 grade students made learning gains on FCAT..
In 2012, 80% (286) of Walker 3-5 grade students will make learning gains on FCAT.
3.2. Students’ inexperience in “unpacking” higher order thinking math problems.
3.2. Emphasis on moderate to high complexity levels of problem solving in classroom instruction.
Emphasis on the language of math in discussion, writing, and reading assignments.Future Mathematician awards
3.2. Principal and classroom teachers
3.2. Lesson Plans, walk through, collegial data chats
3.2. Benchmark Assessments, mid-chapter checkpoints, end of chapter tests, Unit tests
3.3. 3.3. 3.3. 3..3. 3.3.
Based on the analysis of student achievement data, and reference to “Guiding Questions”, identify and define areas in need of
improvement for the following group:
Anticipated Barrier Strategy Person or Position Responsible for
Monitoring
Process Used to Determine Effectiveness of
Strategy
Evaluation Tool
4. Percentage of students in Lowest 25% making learning gains in mathematics
Mathematics Goal #4:
4.1. Lack of student motivation and confidence in math.
4.1. Teachers will provide daily instruction utilizing numerous components of the newly adopted math series to engage in best practices for instruction, focusing on Strategic Intervention and Intensive Intervention provided in the resources of the math series.
4.1. Principal and classroom teachers
4.1. Lesson Plans, walk through, collegial data chats
4.1. Benchmark Assessments, mid-chapter checkpoints, end of chapter tests, Unit tests
In 2012, 80% of the lowest 25% of Walker 3-5 grade students will make learning gains.
2011 Current Level of Performance:*
2012 Expected Level of Performance:*
78% (72) of the lowest 25% (92) of Walker 3-5 grade students made learning gains.
80% (70) of the lowest 25% (88) of Walker 3-5 grade students will make learning gains.
4.2. Students have not had sufficient practice in basic skills or access to technology/computers.
4.2. Teachers will provide daily differentiated instruction including teacher-led small groups and stations, incorporating multiple number sense, geometry, and measurement activities.
Teachers will provide consistent opportunity for students to practice skills using available technology including Soar to Success, iTools, Education City, Accelerated Math, ThinkCentral, and Discovery Education.
4.2. Principal and classroom teachers,
4.2. Lesson Plans, walk through, collegial sharing, Computer Lab
4.2. DEA Assessments (pre, mid, post), Benchmark Assessments, chapter tests, Unit testsProgram tracking, reporting, and usage reports
April 2011 23Rule 6A-1.099811Revised April 29, 2011
2011-2012 School Improvement Plan (SIP)-Form SIP-14.3Students’ inability to study effectively and gauge progress.
4.4 Teachers will set goals based on data analysis of student mastery of benchmarks/subskills to modify instruction.
4.4 Principal, Classroom Teachers, PLC members, Math Contact
4.4 PLC minutes/agendas, Unit Plan Goal Form.
4.4 DEA Assessments (pre, mid, post), Benchmark Assessments, chapter tests, Unit tests
Based on the analysis of student achievement data, and reference to “Guiding Questions”, identify and define areas in need of
improvement for the applicable subgroup(s):
Anticipated Barrier Strategy Person or Position Responsible for
Monitoring
Process Used to Determine Effectiveness of
Strategy
Evaluation Tool
5A. Student subgroups not making Adequate Yearly Progress (AYP) in mathematics
Mathematics Goal #5A:
Mathematics Goal #5A:Ethnicity(White, Black, Hispanic, Asian,American Indian)
5A.1. Students have not had sufficient practice with basic computational skills & vocabulary.
5A.1. Teachers will provide daily instruction utilizing a variety of components from the math series to engage in best practices for instruction based on student needs.
Teachers will conference with students on a regular basis to provide individual strategy instruction. Vocabulary practice will be provided in a variety of ways.
5A.1. Principal and classroom teachers
5A.1. Unit Plans, walk through, gradebook
5A.1. DEA Assessments (pre, mid, post), Benchmark Assessments, mid-chapter checkpoints, end of chapter tests, Unit tests
In 2012, 86 % of Black students will make AYP.
2011 Current Level of Performance:*
2012 Expected Level of Performance:*
White:Black: 56% (31)Hispanic:Asian:American Indian:
White:Black: 86% (98)Hispanic:Asian:American Indian:
5A.2. Lack of student motivation and confidence in math.
5A.2. Teachers will provide daily differentiated instruction including teacher-led small groups and stations, incorporating multiple number sense, geometry, and measurement activities.
5A.2. Principal and classroom teachers
5A.2. Lesson Plans, walk through, Collegial sharing.
5A.2. DEA Assessments (pre, mid, post), Benchmark Assessments, chapter tests, Unit tests
5A.3White:Black:1. Attendance 2. Parent Involvement 3. Discovering student learning and behavior stylesHispanic:Asian:American Indian:
5A.3. Students will be provided specific, targeted instruction through before, during and after school tutoring.
Students will be progress monitored and instruction by CRT & Title I teachers .
5A.3. Principal, Title I teachers and classroom teacher
Classroom teachers, Title I teachers and students will monitor student performance on weekly assessments, and grades.
5A.3 DEA Assessments (pre, mid, post), Benchmark Assessments, chapter tests, Unit tests, Accelerated Math
5A.4. Availability of computers /technology.
5A.3. Teachers will provide consistent opportunity for students to practice skills using available technology including Soar to Success, iTools, Education City, Accelerated Math, ThinkCentral, and Discovery Education.
5A.3. Principal and classroom teachers
5A.3. Lesson Plans, walk through, Computer Lab
5A.3. Program tracking, reporting, and usage reports
5.A.4 Students’ inability to 5.4 Teachers will set goals based 5.4 Principal, Classroom 5.4 PLC minutes/agendas, Unit 5.4 DEA Assessments
April 2011 24Rule 6A-1.099811Revised April 29, 2011
2011-2012 School Improvement Plan (SIP)-Form SIP-1study effectively. on data analysis of student
mastery of benchmarks/sub-skills to modify instruction.
Teachers, PLC members, Math Contact
Plan Goal Form. (pre, mid, post), Benchmark Assessments, chapter tests, Unit tests
5A.5. Lack of parent involvement and comfort with attending school events
5A.5Partner with community organization to bring tutoring and/or tutoring training to students and parents at an off-campus location (Rev. Sanford Hayes)
5A.5. Principal, SAC liaison, volunteer teachers, NCLB Specialist
5A.5. Monitor progress of students attending sessions, parent sign-in logs, tutor hours.
5A.5.Grades, classroom assessments, DEA.
Based on the analysis of student achievement data, and reference to “Guiding Questions”, identify and define areas in need of
improvement for the following subgroup:
Anticipated Barrier Strategy Person or Position Responsible for
Monitoring
Process Used to Determine Effectiveness of
Strategy
Evaluation Tool
5B. Student subgroups not making Adequate Yearly Progress (AYP) in mathematics
Mathematics Goal #5B:
Mathematics Goal #5B:English Language Learners (ELL)
5B.1. 5B.1. 5B.1. 5B.1. 5B.1.
N/A 2011 Current Level of Performance:*
2012 Expected Level of Performance:*
N/ N/A5B.2. 5B.2. 5B.2. 5B.2. 5B.2.
5B.3 5B.3. 5B.3. 5B.3. 5B.3.
Based on the analysis of student achievement data, and reference to “Guiding Questions”, identify and define areas in need of
improvement for the following subgroup:
Anticipated Barrier Strategy Person or Position Responsible for
Monitoring
Process Used to Determine Effectiveness of
Strategy
Evaluation Tool
5C. Student subgroups not making Adequate Yearly Progress (AYP) in mathematics
Mathematics Goal #5C:
Mathematics Goal #5C:Students with Disabilities (SWD)
5C.1.SWD require a variety of presentation methods that allow for instructional needs
5C.1.Teachers will assess and instruct students at present skill levels with modifications and accommodations according to Individual Education Plans
5C.1. Principal, ESE instructors, classroom teacher
5C.1. Teacher s will assess students weekly for 5 consecutive weeks and then progress monitor monthly to develop and monitor trendline using STAR math
5C.1. STAR Math Report
In 2012, 86% of Walker 3-5 grade students with disabilities will make adequate yearly progress on FCAT.
2011 Current Level of Performance:*
2012 Expected Level of Performance:*
N/A 86% (36) of Walker 3-5 grade students with disabilities will make adequate yearly progress on
April 2011 25Rule 6A-1.099811Revised April 29, 2011
2011-2012 School Improvement Plan (SIP)-Form SIP-1FCAT.
5C.2. Students’ need for alternative strategies in math practice.
5C.2. Teachers will instruct using multiple strategies of mathematical applications to address student learning styles. Teachers will provide guided practice in hands-on or pictorial representation of mathematical concepts.
5C.2. Principal, classroom teacher, ESE instructor
5C.2. Classroom assessment results and grades will be monitored to determine student’s mastery of skill/concept.
5C.2. Go Math: benchmark assessments, chapter assessments, mid-chapter checkpoints, and unit tests.DEA, STAR Math, Alternative Assessments
5C.3.Limited access to computers, accessories and student comfort level with assistive technology.
5C.3. Students will participate in math fact fluency (Math Facts in a Flash, Clickers, Games, and Stations) to increase automaticity.
5C.3. Principal, classroom teacher, ESE instructor
5C.3. Individual student goals will be determined in the IEP. ESE teachers will complete a progress report to document students’ progress
5C.3. Classroom Assessments, DEA, STAR Math, Alternative Assessments
5C.4. Students’ attaining & maintaining grade level benchmark mastery.
5C.4. Students scoring an F in math or not meeting their IEP goals will have an interim IEP meeting to address individual instructional needs
5C.4. Principal, classroom teacher, ESE instructor
5C.4. Individual student goals will be determined in the IEP. ESE teachers will complete a progress report to document students’ progress
5C.4. Classroom Assessments, DEA, STAR Math, Alternative Assessments
Based on the analysis of student achievement data, and reference to “Guiding Questions”, identify and define areas in need of
improvement for the following subgroup:
Anticipated Barrier Strategy Person or Position Responsible for
Monitoring
Process Used to Determine Effectiveness of
Strategy
Evaluation Tool
5D. Student subgroups not making Adequate Yearly Progress (AYP) in mathematics
Mathematics Goal #5D:
Mathematics Goal #5D:Economically Disadvantaged
5D.1. Lack of relevance to daily lives of students.
5D.1. Teachers instruct using real world applications of math concepts/skills.
Hands-on activities will be implemented in small group instruction.
Students will develop their own word problems using content that is meaningful to them.
5D.1. Principal, classroom teacher
5D.1. Classroom assessment results and grades will be monitored to determine student’s mastery of skill/concept.
5D.1. Go Math: benchmark assessments, chapter assessments, mid-chapter checkpoints, and unit test, DEA
In 2012, 86% of Walker 3-5 grade Economically Disadvantage students will make adequate yearly progress on FCAT.
2011 Current Level of Performance:*
2012 Expected Level of Performance:*
71% (158) of Walker 3-5 grade Economically Disadvantage students made adequate yearly progress on FCAT.
86% (191) of Walker 3-5 grade Economically Disadvantage students will make adequate yearly progress on FCAT.
5D.2. Variety of student modalities
5D.2. Lessons will be developed and presented using a variety of modalities.
5D.2. Classroom Teachers
5D.2. Lesson plans and Walkthroughs
5D.2. . Go Math: benchmark assessments, chapter assessments, mid-chapter checkpoints, and unit test, DEA
5D.3. Student lack of command of math language
5D.3. Math vocabulary will be explicitly taught and practiced through Think-Pair-Share activities and math journals.
5D.3.Classroom Teachers
5D.3.Lesson plans and Walkthroughs
5D.3. . Go Math: benchmark assessments, chapter assessments, mid-chapter checkpoints, and unit test, DEA
April 2011 26Rule 6A-1.099811Revised April 29, 2011
2011-2012 School Improvement Plan (SIP)-Form SIP-1
* When using percentages, include the number of students the percentage represents (e.g. 70% (35)).
Professional Development (PD) aligned with Strategies through Professional Learning Community (PLC) or PD ActivityPlease note that each Strategy does not require a professional development or PLC activity.
PD Content /Topicand/or PLC Focus Grade
Level/Subject
PD Facilitatorand/or
PLC Leader
PD Participants(e.g. , PLC, subject, grade level, or
school-wide)
Target Dates and Schedules(e.g. , Early Release) and
Schedules (e.g., frequency of meetings)
Strategy for Follow-up/Monitoring Person or Position Responsible for Monitoring
Differentiated Math Instruction for Diverse Populations K-5 PLC Leader PLC Members
Monthly Early ReleaseTeachers will review current data
and student artifacts at each meeting. Teachers will develop a unit of study based upon results.
Jeanine KirklandElizabeth Bears
PLC Group Leaders
Lesson Study in Math K-5 PLC Leader Math/subject Monthly Early Release
Teachers will increase the complexity level of daily math
instruction through Lesson Study.
Jeanine KirklandElizabeth Bears
PLC Group LeadersTechnology to support Math
Instruction K-5 Volunteer Math/subject TBA Early Release
Teachers will explore ThinkCentral Tutorial from Math Series, specifically; Destination Math Mega Math and use one
or more in a unit of study.
Jeanine KirklandElizabeth Bears
PLC Group Leaders
Mathematics Budget (Insert rows as needed)Include only school-based funded activities/materials and exclude district funded activities /materials.Evidence-based Program(s)/Materials(s)Strategy Description of Resources Funding Source Amount
Subtotal:TechnologyStrategy Description of Resources Funding Source AmountClickers Electronic Response System Title I Supplies, PTO $2500Netbooks (COW) Computers on Wheels Pilot Program OCSD $0
April 2011 27Rule 6A-1.099811Revised April 29, 2011
2011-2012 School Improvement Plan (SIP)-Form SIP-1Subtotal:$2500
Professional DevelopmentStrategy Description of Resources Funding Source AmountClicker Training Digital Educators will conduct voluntary
workshops.Title I PD $800
Netbook Training Workshop provided by District Tech Specialist
OCSD $0
Subtotal:$800OtherStrategy Description of Resources Funding Source AmountDEA Resource Exploration DEA website OCSD $0
Subtotal: Total: $3,300.00
End of Mathematics Goals
April 2011 28Rule 6A-1.099811Revised April 29, 2011
2011-2012 School Improvement Plan (SIP)-Form SIP-1Science Goals
* When using percentages, include the number of students the percentage represents next to the percentage (e.g. 70% (35)).
SCIENCE GOALS Problem-Solving Process to Increase Student AchievementBased on the analysis of student achievement data, and reference to
“Guiding Questions”, identify and define areas in need of improvement for the following group:
Anticipated Barrier Strategy Person or Position Responsible for
Monitoring
Process Used to Determine Effectiveness of
Strategy
Evaluation Tool
1. Students achieving proficiency (FCAT Level 3) in science
Science Goal #1:
1.1.Differentiated instruction in small groups.
Lack of PD and teacher expertise to improve instruction in Scientific Method
1.1.Teachers will model the scientific method in classroom demonstrations to small groups (grades 1-5) or whole classes (Kindergarten) quarterly for Science Fair type projects or processes (backboard is optional).Each class will create science fair projects with backboards in small group(grades 1-5) or whole class (kindergarten).
1.1.Principal and teacher
1.1.One completed group Science project per nine weeks
1.1.Lesson plans and 4 submitted Science Fair Projects per classroom
In 2012, 65% of Walker 5th grade students will make a level 3 or above on FCAT.
2011 Current Level of Performance:*
2012 Expected Level of Performance:*
54% (74) of Walker 5th grade students made a level 3 or above on FCAT.
65% (89) of Walker 5th grade students will make a level 3 or above on FCAT.
1.2.Students’ ability to apply scientific method while performing experiments.
1.2.Hands-on lab in partnership with Emerald Coast Science Center. Address the lowest strand from 5th grade FCAT (4th and 5th grades only).
Fourth grade students will engage in a hands-on science field trip to the Biophilia Center
All Walker teachers will participate in monthly Science Days using the ACE Curriculum sponsored by the Civil Air Patrol.
1.2.Principal and teachers
4th grade teachers
1.2.Teachers will review student journals and lab notebooks.
1.2.Chapter Assessments, DEA
1.3.Previous textbook and primary source of instruction did not match NGSSS.
1.3.Teachers will follow the OCSD Curriculum Guide and Florida Standards document assessment dates and implement new textbook.
1.3.Principal & teachers
1.3.Small group instruction, whole group instruction, differentiated stations, hands-on demonstrations
End of Quarter ExamsLesson PlansCollegial Conversations in Weekly Planning meetings
1.4Students’ lack of use of Science vocabulary.
1.4Create and use graphic organizers, notebooks, and/or concept maps etc. to develop a science vocabulary.
1.4Principal & teachers
1.4Students will complete word maps, focused on vocabulary being used in unit of study. The cards are to be shared and referenced in class
1.4Student created science vocabulary cards. Vocabulary use in journals, discussions, and
April 2011 29Rule 6A-1.099811Revised April 29, 2011
2011-2012 School Improvement Plan (SIP)-Form SIP-1work and discussion. assessments.
Based on the analysis of student achievement data, and reference to “Guiding Questions”, identify and define areas in need of
improvement for the following group:
Anticipated Barrier Strategy Person or Position Responsible for
Monitoring
Process Used to Determine Effectiveness of
Strategy
Evaluation Tool
2. Students achieving above proficiency(FCAT Levels 4 and 5) in science
Science Goal #2:
2.1.Students need for engagement through use of choice and technology that provides individual self-paced practice & enrichment
2.1.Differentiated instruction in small groups with use of technology such as Education City, FCAT Explorer, and levelized books, group projects.
2.1.Principal and teacher
2.1.Lesson plans, walk through and computer lab scheduling
2.1.Program tracking, reporting, and usage reports
In 2012, 20% of Walker 5th grade students will make a level 4 or 5 on FCAT.
2011 Current Level of Performance:*
2012 Expected Level of Performance:*
18% (18) of Walker 5th grade made a level 4 or 5 on FCAT.
20% (26) of Walker 5th grade students will make a level 4 or 5 on FCAT.
2.2.Students having materials available to complete project
2.2. Students have the opportunity to complete an individual science fair project for submission in the school science fair competition.
2.2.Teacher and Science Committee
2.2. Increased amount of participation
2.2.Science fair rubric
2.3 2.3 2.3 2.3 2.3
Professional Development (PD) aligned with Strategies through Professional Learning Community (PLC) or PD ActivityPlease note that each Strategy does not require a professional development or PLC activity.
PD Content /Topicand/or PLC Focus Grade
Level/Subject
PD Facilitatorand/or
PLC Leader
PD Participants(e.g. , PLC, subject, grade level, or
school-wide)
Target Dates and Schedules(e.g. , Early Release) and
Schedules (e.g., frequency of meetings)
Strategy for Follow-up/Monitoring Person or Position Responsible for Monitoring
ACE Curriculum K-5 PLC Leaders School-wide Early Release Days Lesson Plans Principal
Science Budget (Insert rows as needed)Include only school-based funded activities/materials and exclude district funded activities/materials.Evidence-based Program(s)/Materials(s)Strategy Description of Resources Funding Source AmountHands on Learning ACE Curriculum, Civil Air Patrol General Internal Funds $800
Subtotal:$800
April 2011 30Rule 6A-1.099811Revised April 29, 2011
2011-2012 School Improvement Plan (SIP)-Form SIP-1TechnologyStrategy Description of Resources Funding Source Amount
Subtotal:Professional DevelopmentStrategy Description of Resources Funding Source AmountContinue with AIMS Science and hands on materials
Teacher resource and activity books NA $0
Subtotal:$0OtherStrategy Description of Resources Funding Source AmountModeled Science Fair Projects Supplies for projects and display materials Discretionary $1500.Emerald Coast Science Center FCAT Lessons (4th & 5th Grade)
Hands-on lessons, demonstrations, and follow-up lessons for classroom
Discretionary $1300.
Subtotal: $2800.00 Grand Total:$3600.00
End of Science Goals
April 2011 31Rule 6A-1.099811Revised April 29, 2011
2011-2012 School Improvement Plan (SIP)-Form SIP-1Writing Goals
* When using percentages, include the number of students the percentage represents next to the percentage (e.g. 70% (35)). WRITING GOALS Problem-Solving Process to Increase Student Achievement
Based on the analysis of student achievement data, and reference to “Guiding Questions”, identify and define areas in need of
improvement for the following group:
Anticipated Barrier Strategy Person or Position Responsible for
Monitoring
Process Used to Determine Effectiveness of
Strategy
Evaluation Tool
1. Students achieving Adequate Yearly Progress(FCAT Level 3.0 and higher) in writing
Writing Goal #1:
1.1. Adequate turn-around time for conferencing and for students to respond to teacher feedback.
1.1. Students will write monthly to separate school wide prompts for K-2 and 3-5.
Performance will be used for progress monitoring, student conferencing as an instructional tool. Teachers will conference with each student monthly and set an individual goal.
1.1. Classroom Teacher,Principal, Peer scoring partner
1.1. Teacher will administer and score monthly prompts a long with a peer teacher. Scores will be recorded and monitored.
1.1. Monthly prompt and data collection sheet
In 2012, 81% of Walker 4th
grade students will be proficient on FCAT Writes.
2011 Current Level of Performance:*
2012 Expected Level of Performance:*
79% (104) of Walker 4th grade students were proficient on FCAT Writes.
81% (92) of Walker 4th grade students will be proficient on FCAT Writes.
1.2. Student “habits of mind “ and reluctance to respond in writing to learned material.
1.2. Teachers will incorporate writing within all content area instruction (including civics) using notebooks, journals, extended responses, CRISS strategies, etc.
1.2. Classroom Teacher, Principal
1.2. Classroom assessment results and grades will be monitored to determine student’s mastery of skill/concept.
1.2. Short responses included in Chapter Quizzes, Unit Assessments,
1.3. Assessment tools to measure and determine growth in application of vocabulary and student command of language.
1.3. Students will be instructed in using word choice, vocabulary ideas, focus, conventions and spelling in written form.
Practice will be provided in a variety of ways, which could include: word walls, journals/notebooks, individual dictionaries, read alouds, familiar reads, T-charts, picture notes, etc
1.3. Classroom Teacher, Principal
1.3. Teacher will administer and score monthly prompts along with a peer teacher. Scores will be recorded and monitored.
1.3. Monthly prompt and data collection sheet
1.4Time and resources to build the library and limited faculty expertise in use of mentor texts.
1.4 Teachers will use mentor texts for instruction in writing (especially grammar).
1.4 Classroom TeacherPrincipal
1.4 Teacher will administer and score monthly prompts along with a peer teacher. Scores will be monitored to determine student’s mastery of skill/concept.
1.4 Monthly prompt and data collection sheet.
April 2011 32Rule 6A-1.099811Revised April 29, 2011
2011-2012 School Improvement Plan (SIP)-Form SIP-11.5 Money to fund before and after school tutors
1.5 Teachers in grades 4 and 5 will hold a Writing Boot Camp before FL Writes! to immerse students in the skills and mindset for writing well.
1.5 Classroom TeacherPrincipal
1.5 Pre-boot camp prompt average will be compared to post-boot camp prompt average in student conferences.
1.5 Monthly prompt and data collection sheet.
Based on the analysis of student achievement data, and reference to “Guiding Questions”, identify and define areas in need of
improvement for the following group:
Anticipated Barrier Strategy Person or Position Responsible for
Monitoring
Process Used to Determine Effectiveness of
Strategy
Evaluation Tool
2A. Student subgroups not making Adequate Yearly Progress (AYP) in writing
Writing Goal #2A:
Writing Goal #2A:Ethnicity(White, Black, Hispanic, Asian,American Indian)
2A.1.White:Black:Hispanic:Asian:American Indian:
2A.1. 2A.1. 2A.1. 2A.1.
N/A
2011 Current Level of Performance:*
2012 Expected Level of Performance:*
N/AWhite:Black:Hispanic:Asian:American Indian:
N/AWhite:Black:Hispanic:Asian:American Indian:
2A.2. 2A.2. 2A.2. 2A.2. 2A.2.
2A.3. 2A.3. 2A.3. 2A.3. 2A.3.Based on the analysis of student achievement data, and reference to
“Guiding Questions”, identify and define areas in need of improvement for the following subgroup:
Anticipated Barrier Strategy Person or Position Responsible for
Monitoring
Process Used to Determine Effectiveness of
Strategy
Evaluation Tool
2B. Student subgroups not making Adequate Yearly Progress (AYP) in writing
Writing Goal #2B:
Writing Goal #2B:English Language Learners (ELL)
2B.1. 3B.1. 2B.1. 2B.1. 2B.1.
N/A2011 Current Level of Performance:*
2012 Expected Level of Performance:*
N/A N/A
2B.2. 2B.2. 2B.2. 2B.2. 2B.2.
2B.3. 2B.3. 2B.3. 2B.3. 2B.3.
April 2011 33Rule 6A-1.099811Revised April 29, 2011
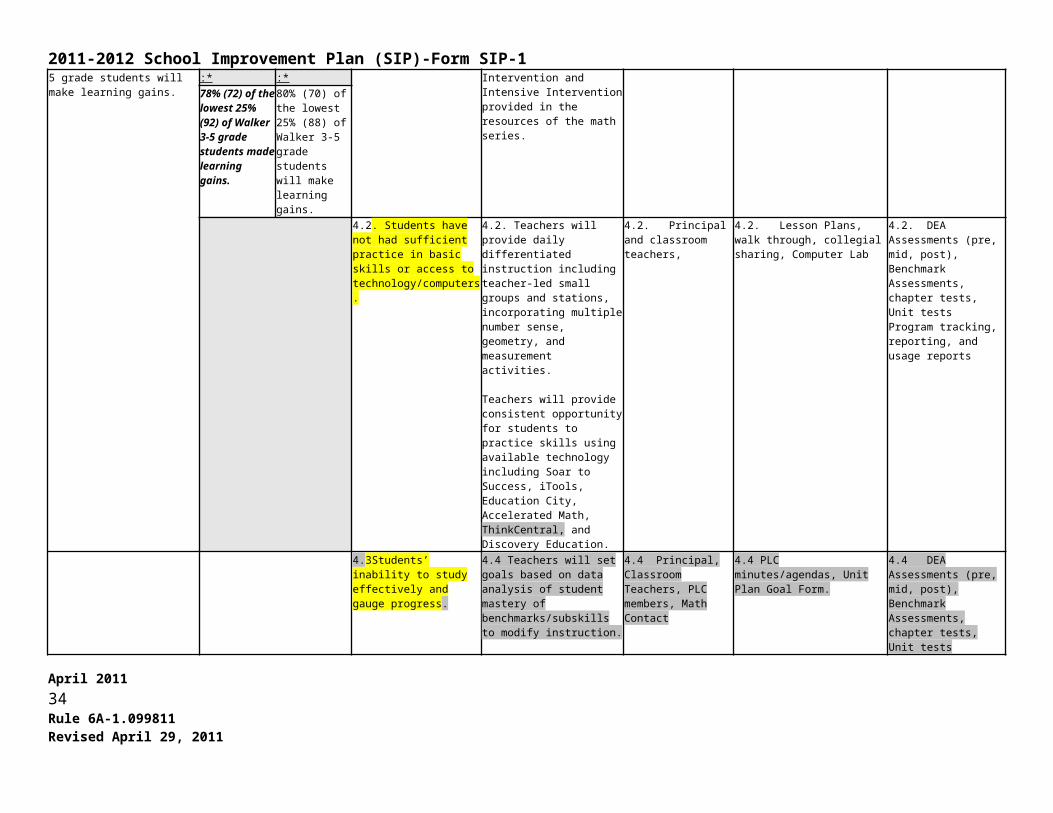
2011-2012 School Improvement Plan (SIP)-Form SIP-1Based on the analysis of student achievement data, and reference to
“Guiding Questions”, identify and define areas in need of improvement for the following subgroup:
Anticipated Barrier Strategy Person or Position Responsible for
Monitoring
Process Used to Determine Effectiveness of
Strategy
Evaluation Tool
2C. Student subgroups not making Adequate Yearly Progress (AYP) in writing
Writing Goal #2C:
Writing Goal #2C:Students with Disabilities (SWD)
2C.1. 2C.1. 2C.1. 2C.1. 2C.1.
N/A2011 Current Level of Performance:*
2012 Expected Level of Performance:*
N/A N/A
2C.2. 2C.2. 2C.2. 2C.2. 2C.2.
2C.3. 2C.3. 2C.3. 2C.3. 2C.3.
Based on the analysis of student achievement data, and reference to “Guiding Questions”, identify and define areas in need of
improvement for the following subgroup:
Anticipated Barrier Strategy Person or Position Responsible for
Monitoring
Process Used to Determine Effectiveness of
Strategy
Evaluation Tool
2D. Student subgroups not making Adequate Yearly Progress (AYP) in writing
Writing Goal #2D:
Writing Goal #2D:Economically Disadvantaged
2D.1. 2D.1. 2D.1. 2D.1. 2D.1.
N/A
2011 Current Level of Performance:*
2012 Expected Level of Performance:*
N/A N/A2D.2. 2D.2. 2D.2. 2D.2. 2D.2.
2D.3. 2D.3. 2D.3. 2D.3. 2D.3.
Professional Development (PD) aligned with Strategies through Professional Learning Community (PLC) or PD ActivityPlease note that each Strategy does not require a professional development or PLC activity.
PD Content /Topicand/or PLC Focus Grade
Level/Subject
PD Facilitatorand/or
PLC Leader
PD Participants(e.g. , PLC, subject, grade level, or
school-wide)
Target Dates and Schedules(e.g. , Early Release) and
Schedules (e.g., frequency of meetings)
Strategy for Follow-up/Monitoring Person or Position Responsible for Monitoring
Embracing the Language of Writers(Continued in Year 2)
K-5 Volunteer subject TBA Teachers will collaborate and share their implementation plan and
follow-up at the beginning of the
April 2011 34Rule 6A-1.099811Revised April 29, 2011
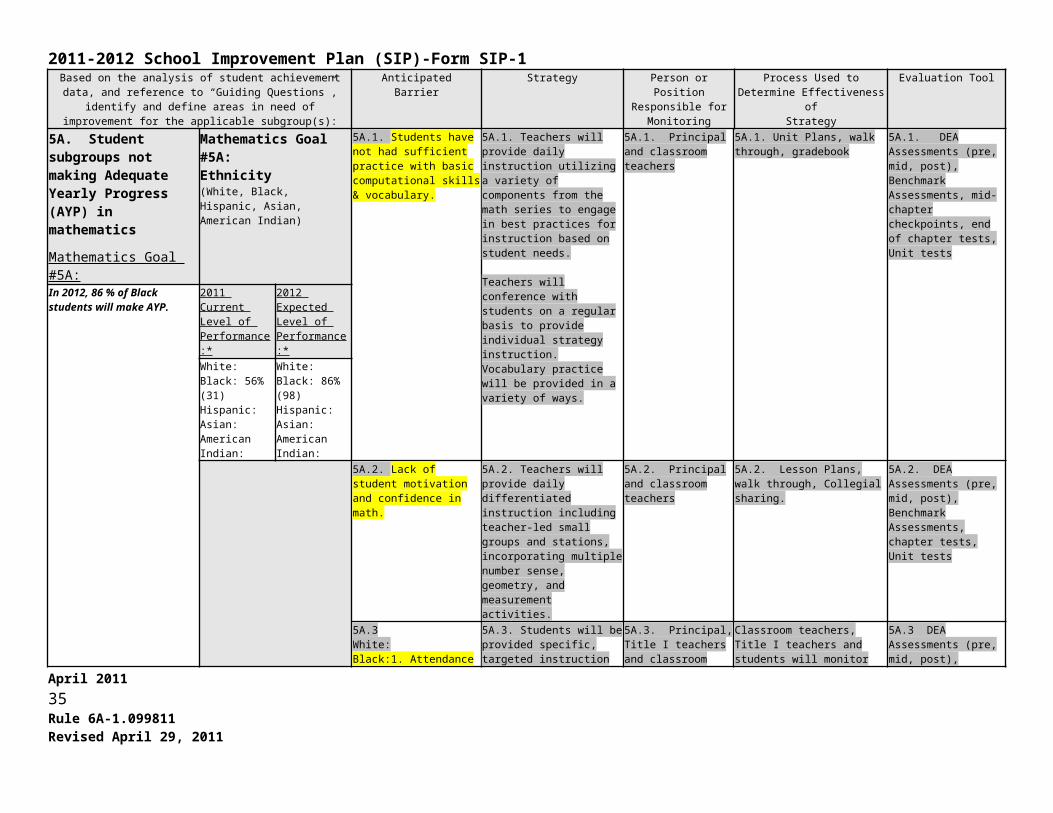
2011-2012 School Improvement Plan (SIP)-Form SIP-1school year.
Using Model Sentences, Leveled
and Tiered Vocabulary
1-5
Liz BearsJeff Anderson Book Study subject
September-October Teachers will conference with individual students and collaborate
with peer teachers to set goals.
PLC Writing
K-5 PLC Leader subject October-May Early Release
Teachers will review current data and student artifacts at each
meeting. Teachers will develop a unit of study for area of weakness.
Writing Budget (Insert rows as needed)Include only school-based funded activities/materials and exclude district funded activities/materials.Evidence-based Program(s)/Materials(s)Strategy Description of Resources Funding Source Available AmountWriters Boot Camp Tutors Title 1 $1200.00Mentor Text Library 50 books Title 1 $500.00
Subtotal:$1,700.00TechnologyStrategy Description of Resources Funding Source Available Amount
Subtotal: $0Professional DevelopmentStrategy Description of Resources Funding Source Available AmountJeff Anderson Book Study – Ten things every writer needs to know
Books for up to 6 teachers Title I PD $120.00
Word Web Curriculum Books for up to 6 teachers Title I PD $120.00Day by Day by Ruth Ayers and Stacey Shubitz
Books for up to 6 teachers Title I PD $120.00
Subtotal: $360.00Strategy Description of Resources Funding Source AmountConference with students and goal setting
Carbon sheets for teacher and student record
Discretionary $250.00
Grand Total: $2,060.00End of Writing Goals
April 2011 35Rule 6A-1.099811Revised April 29, 2011
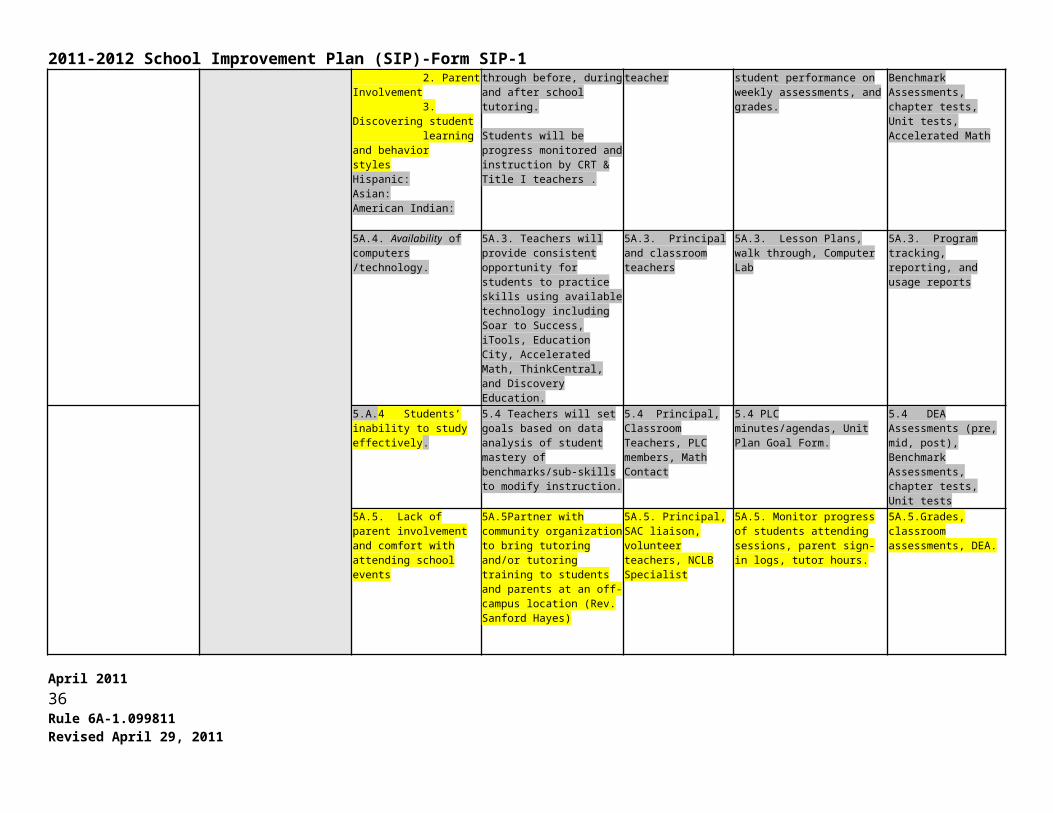
2011-2012 School Improvement Plan (SIP)-Form SIP-1Attendance Goal(s)
* When using percentages, include the number of students the percentage represents next to the percentage (e.g. 70% (35)).
ATTENDANCE GOAL(S) Problem-solving Process to Increase AttendanceBased on the analysis of attendance data, and reference to “Guiding
Questions”, identify and define areas in need of improvement:Anticipated Barrier Strategy Person or Position
Responsible for Monitoring
Process Used to Determine Effectiveness of
Strategy
Evaluation Tool
1. AttendanceAttendance Goal #1:
1.1.Parent support of attendance &/or student proclivity to illness
1.1. Ongoing communication with parents to keep them informed of absences/ tardies before they become excessive.
1.1.Principal, Classroom Teacher, Attendance Secretary
1.1. Phone calls and letters to parent when a student is absent for 5 days.
1.1.Attendance card and PAWS attendance history
Walker students have maintained an average attendance rate of 95.14% (687).
The number of students with excessive absences in 2011 was 266. In 2012, excessive absences will decrease by 10%.
2011 Current Attendance Rate:*
2012 Expected Attendance Rate:*
An average of 95.14 (687) students were in attendance during the 2011 school year.
An average attendance rate of 96% of students will be in attendance for the 2012 school year.
2011 Current Number of Students with Excessive Absences (10 or more)
2012 Expected Number of Students with Excessive Absences(10 or more)
266 Excessive Absences
242 Excessive Absences
2011 Current Number of Students with Excessive Tardies (10 or more)
2012 Expected Number ofStudents with Excessive Tardies (10 or more)
92 Excessive Tardies 81 Excessive Tardies
1.2. Parent support of attendance.
1.2. School wide weekly attendance reward from Mrs. Kirkland for each grade level.
1.2. Principal, Classroom Teacher, Attendance Secretary
1.2.Monitor the monthly absences. 1.2. Attendance card and PAWS history.
1.3. Parent support of attendance.
1.3. Phone conferences with parents of children with excessive tardies or absences.
1.3. Principal, Classroom Teacher, Attendance Secretary
1.3. Monitor the monthly absences 1.3. Attendance card and PAWS history.
1.4 Parent support of attendance.
1.4 Automated phone system contact whenever student is absent.
1.4 Principal, Classroom Teacher, Attendance Secretary
1.4 Monitor the monthly absences 1.4 Attendance card and PAWS history.
April 2011 36Rule 6A-1.099811Revised April 29, 2011
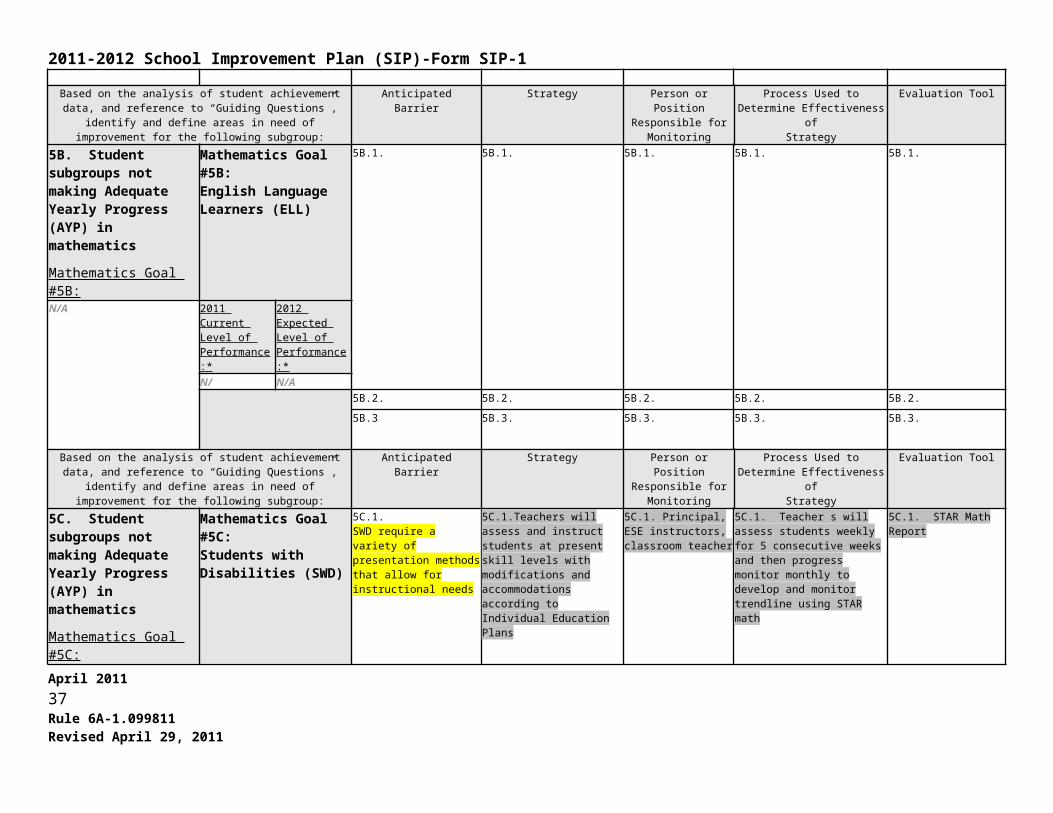
2011-2012 School Improvement Plan (SIP)-Form SIP-1
Professional Development (PD) aligned with Strategies through Professional Learning Community (PLC) or PD ActivityPlease note that each Strategy does not require a professional development or PLC activity.
PD Content /Topicand/or PLC Focus Grade
Level/Subject
PD Facilitatorand/or
PLC Leader
PD Participants(e.g. , PLC, subject, grade level, or
school-wide)
Target Dates and Schedules(e.g. , Early Release) and
Schedules (e.g., frequency of meetings)
Strategy for Follow-up/Monitoring Person or Position Responsible for Monitoring
Attendance Budget (Insert rows as needed)Include only school-based funded activities/materials and exclude district funded activities /materials.Evidence-based Program(s)/Materials(s)Strategy Description of Resources Funding Source Amount
Subtotal:TechnologyStrategy Description of Resources Funding Source Amount
Subtotal:Professional DevelopmentStrategy Description of Resources Funding Source Amount
Subtotal:OtherStrategy Description of Resources Funding Source Amount
Subtotal: Total:
End of Attendance GoalsSuspension Goal(s)April 2011 37Rule 6A-1.099811Revised April 29, 2011
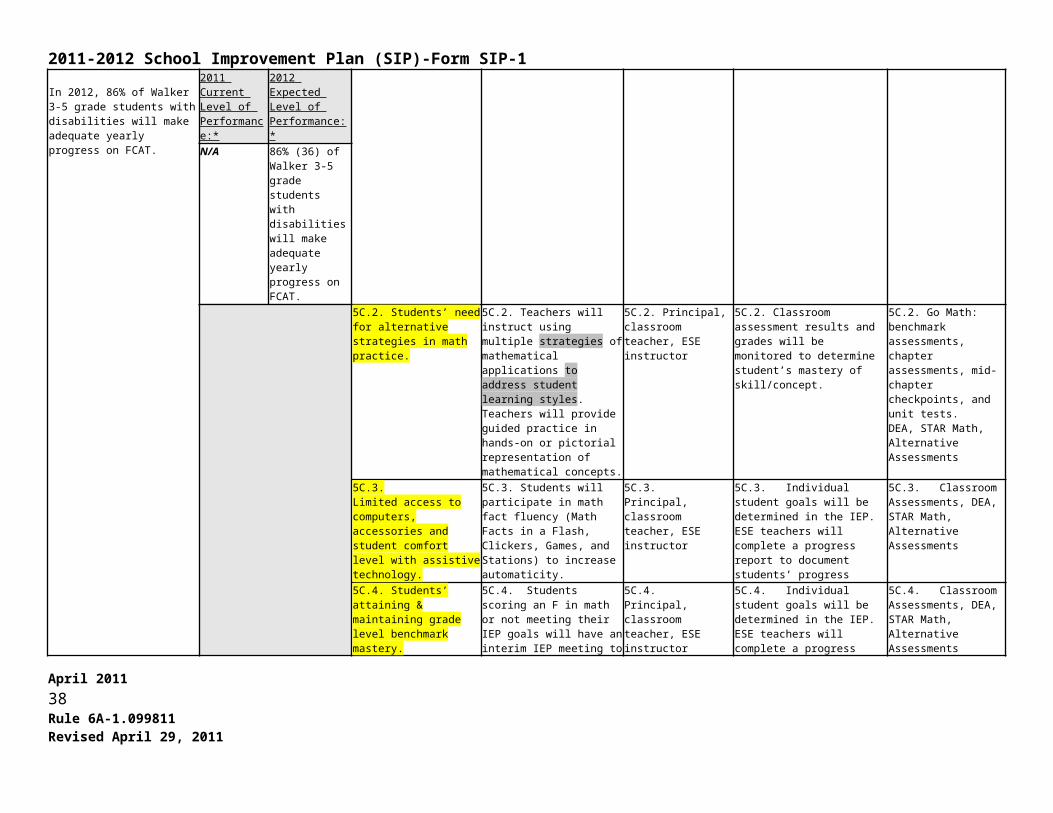
2011-2012 School Improvement Plan (SIP)-Form SIP-1
* When using percentages, include the number of students the percentage represents next to the percentage (e.g. 70% (35)).
SUSPENSION GOAL(S) Problem-solving Process to Decrease SuspensionBased on the analysis of suspension data, and reference to “Guiding
Questions”, identify and define areas in need of improvement:Anticipated Barrier Strategy Person or Position
Responsible for Monitoring
Process Used to Determine Effectiveness of
Strategy
Evaluation Tool
1. SuspensionSuspension Goal #1:
1.1.Unexpected student reactions/behaviors and student ownership of responsibility.
1.1. School-wide rules modeled and explicitly taught in order to encourage students to be responsible learners and community members.
1.1. Principal and Teachers
1.1. Reduced amount of referrals resulting in out of school suspension.
1.1. discipline referrals
Walker student out-of-school suspensions increased from 28 in 2010 to 41 in 2011.The number of out of school suspensions will decrease to 37 or less.Increased student ownership of responsibility, respect, and readiness to learn is the vehicle to attain this goal.
2011 Total Number ofIn –School Suspensions
2012 Expected Number ofIn- School Suspensions
13 Total Number of In-School Suspensions
10 In-school Suspensions
2011 Total Number of Students SuspendedIn-School
2012 Expected Number of Students SuspendedIn -School
6 Students suspended in-School
3 Student suspended In-School
2011 Number of Out-of-School Suspensions
2012 Expected Number ofOut-of-School Suspensions
41 out of school suspensions
37 out of school suspensions
2011 Total Number of Students SuspendedOut- of- School
2012 Expected Number of Students SuspendedOut- of-School
16 Students suspended out of school
13 Students suspended out of school
1.2. Unexpected student reactions/behaviors
1.2. Automated phone contacts for positive behaviors and
1.2. Principal and Teachers
1.2. Reduced amount of referrals resulting in out of school suspension.
1.2. discipline referrals
1.3. Unexpected student reactions/behaviors
1.3. Classroom Student of the Week. Caught being a W.I.S.E. Walker Owl. (Wonderful, Innovative, Studious, Excellent)
1.3. Principal and Teachers
1.3. Reduced amount of referrals resulting in out of school suspension.
1.3. discipline referrals
1.4 Student disabilities and teacher expertise and implementation of strategies.
1.4Teacher in the EBD classroom and assistants will implement de-escalation methods and instruct students to recognize anger triggers to anticipate and defuse aggressive behaviors
1.4Principal, Discipline Team, EBD Teacher, Assistants,
1.4 Number of referrals for aggressive behavior will be monitored monthly.
1.4Discipline referrals
April 2011 38Rule 6A-1.099811Revised April 29, 2011
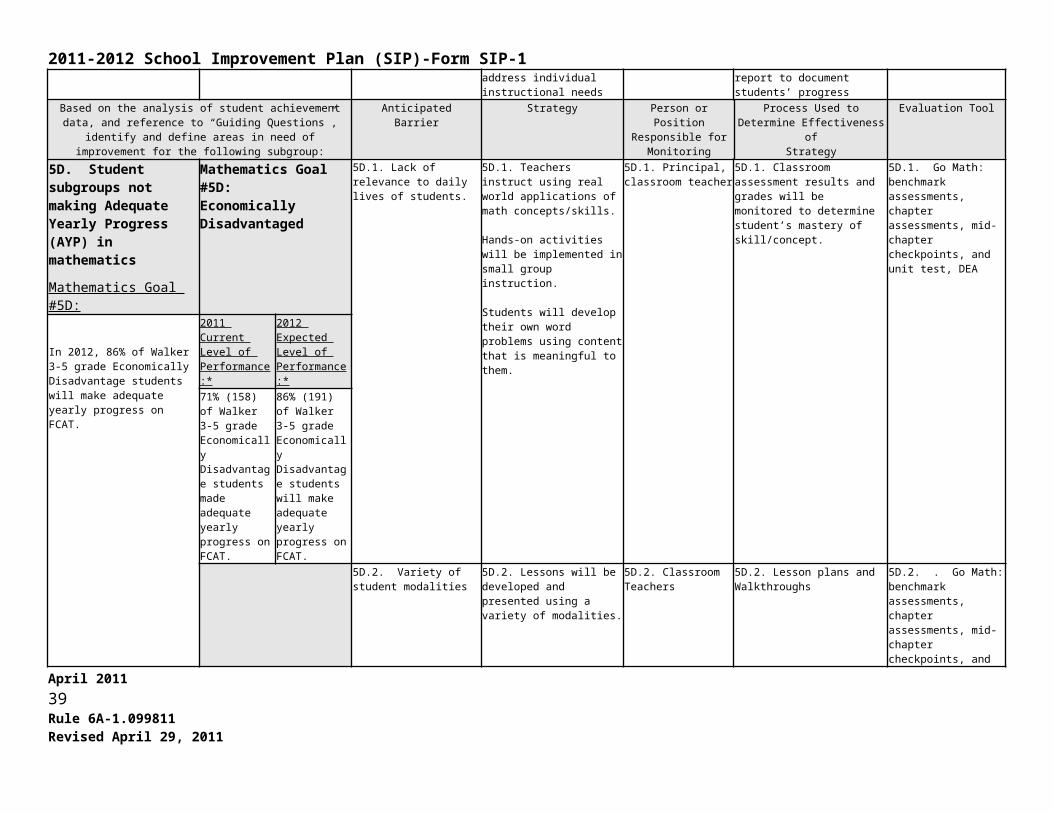
2011-2012 School Improvement Plan (SIP)-Form SIP-1
Professional Development (PD) aligned with Strategies through Professional Learning Community (PLC) or PD ActivityPlease note that each Strategy does not require a professional development or PLC activity.
PD Content /Topicand/or PLC Focus Grade
Level/Subject
PD Facilitatorand/or
PLC Leader
PD Participants(e.g. , PLC, subject, grade level, or
school-wide)
Target Dates and Schedules(e.g. , Early Release) and
Schedules (e.g., frequency of meetings)
Strategy for Follow-up/Monitoring Person or Position Responsible for Monitoring
Classroom Management Strategies for Challenging Behaviors
3-5Lois Handzo, Dr. Sylvia Rockwell
Principal, EBD Teacher, Classroom Assistants
8/31/11, 10/14/11, 12/01/11, 1/5/12, 3/1/12, 5/3/12
Site visit from Dr. Rockwell,Monitoring of Referral, Classroom Walk-thoughs
Principal, EBD Teacher, Discipline Committee
Suspension Budget (Insert rows as needed)Include only school-based funded activities/materials and exclude district funded activities /materials.Evidence-based Program(s)/Materials(s)Strategy Description of Resources Funding Source Amount
Subtotal:TechnologyStrategy Description of Resources Funding Source Amount
Subtotal:Professional DevelopmentStrategy Description of Resources Funding Source Amount
Subtotal:OtherStrategy Description of Resources Funding Source Amount
April 2011 39Rule 6A-1.099811Revised April 29, 2011
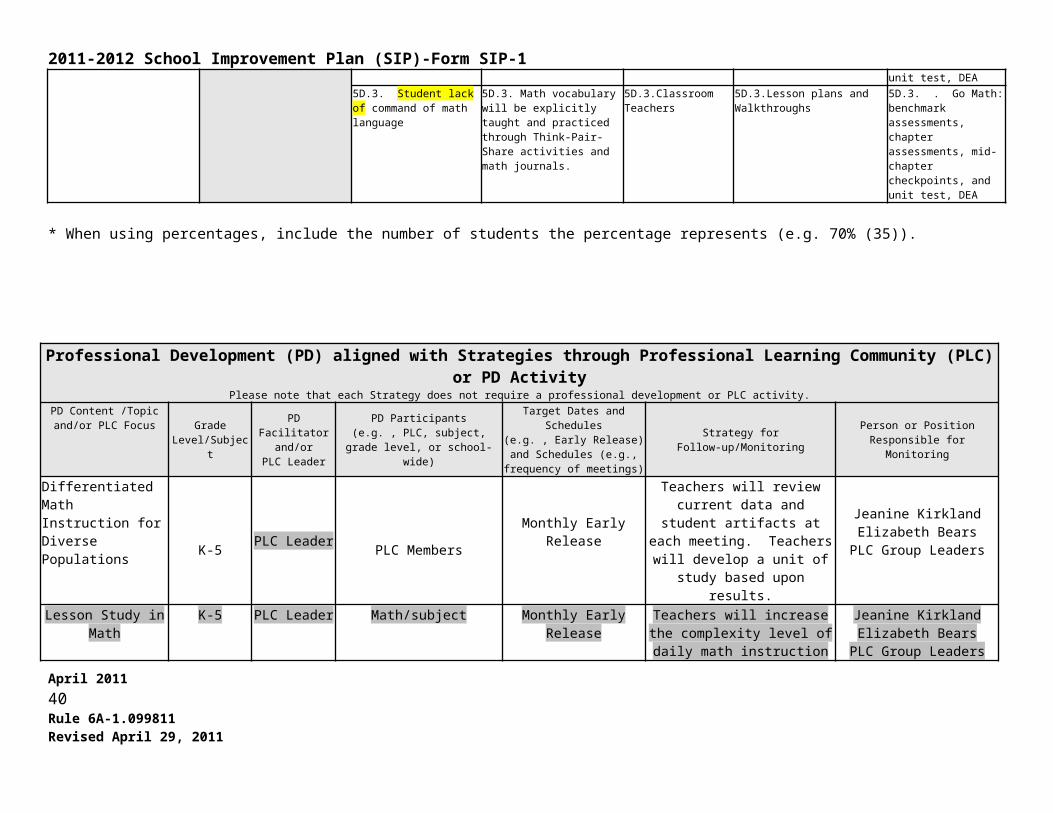
2011-2012 School Improvement Plan (SIP)-Form SIP-1Subtotal:
Total:End of Suspension Goals
Dropout Prevention Goal(s) Note: Required for High School- F.S., Sec. 1003.53
* When using percentages, include the number of students the percentage represents next to the percentage (e.g. 70% (35)).
DROPOUT PREVENTION GOAL(S) Problem-solving Process to Dropout PreventionBased on the analysis of parent involvement data, and reference to
“Guiding Questions”, identify and define areas in need of improvement:
Anticipated Barrier Strategy Person or Position Responsible for
Monitoring
Process Used to Determine Effectiveness of
Strategy
Evaluation Tool
1. Dropout Prevention
Dropout Prevention Goal #1:*Please refer to the percentage of students who dropped out during the 2010-2011 school year.
Enter narrative for the goal in this box.
2011 Current Dropout Rate:*
2012 Expected Dropout Rate:*
Enter numerical data for dropout rate in this box.
Enter numerical data for expected dropout rate in this box.
2011 Current Graduation Rate:*
2012 Expected Graduation Rate:*
Enter numerical data for graduation rate in this box.
Enter numerical data for expected graduation rate in this box.
1.2. 1.2. 1.2. 1.2. 1.2.
1.3. 1.3. 1.3. 1.3. 1.3.
Professional Development (PD) aligned with Strategies through Professional Learning Community (PLC) or PD ActivityPlease note that each Strategy does not require a professional development or PLC activity.
PD Content /Topicand/or PLC Focus Grade
Level/Subject
PD Facilitatorand/or
PLC Leader
PD Participants(e.g. , PLC, subject, grade level, or
school-wide)
Target Dates and Schedules(e.g. , Early Release) and
Schedules (e.g., frequency of meetings)
Strategy for Follow-up/Monitoring Person or Position Responsible for Monitoring
April 2011 40Rule 6A-1.099811Revised April 29, 2011
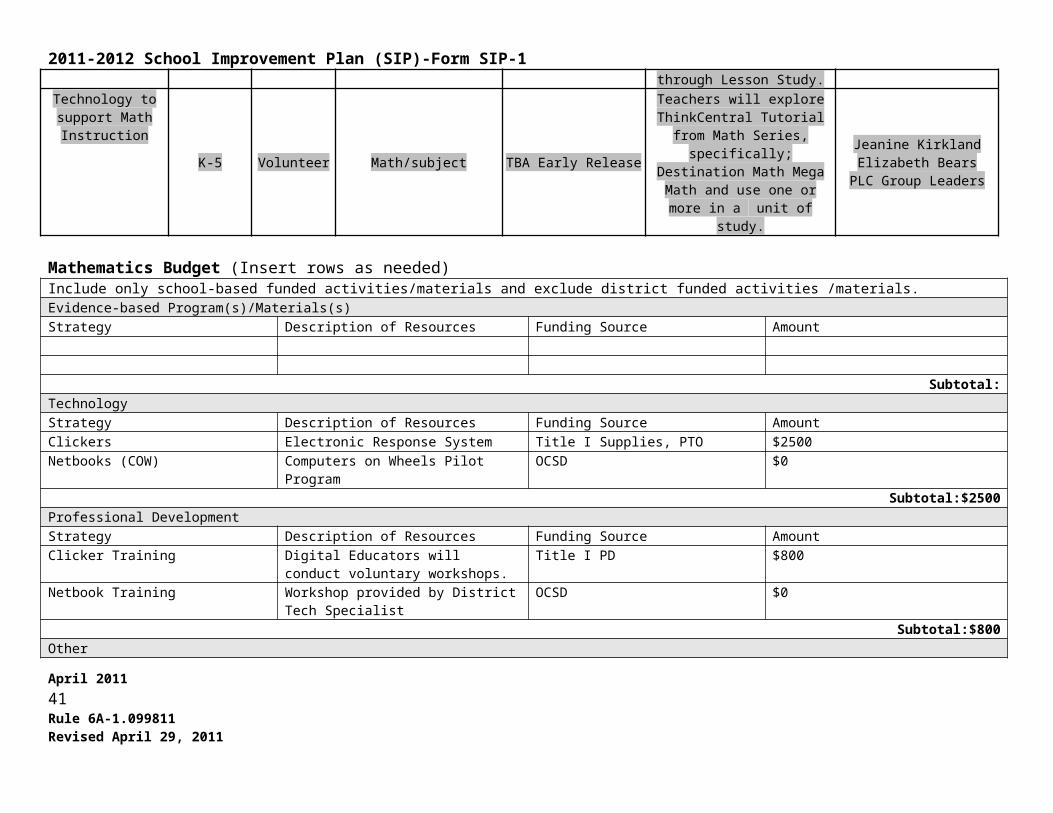
2011-2012 School Improvement Plan (SIP)-Form SIP-1
Dropout Prevention Budget (Insert rows as needed)Include only school-based funded activities/materials and exclude district funded activities /materials.Evidence-based Program(s)/Materials(s)Strategy Description of Resources Funding Source Amount
Subtotal:TechnologyStrategy Description of Resources Funding Source Amount
Subtotal:Professional DevelopmentStrategy Description of Resources Funding Source Amount
Subtotal:OtherStrategy Description of Resources Funding Source Amount
Subtotal:Total:
End of Dropout Prevention Goal(s)
Parent Involvement Goal(s)
April 2011 41Rule 6A-1.099811Revised April 29, 2011
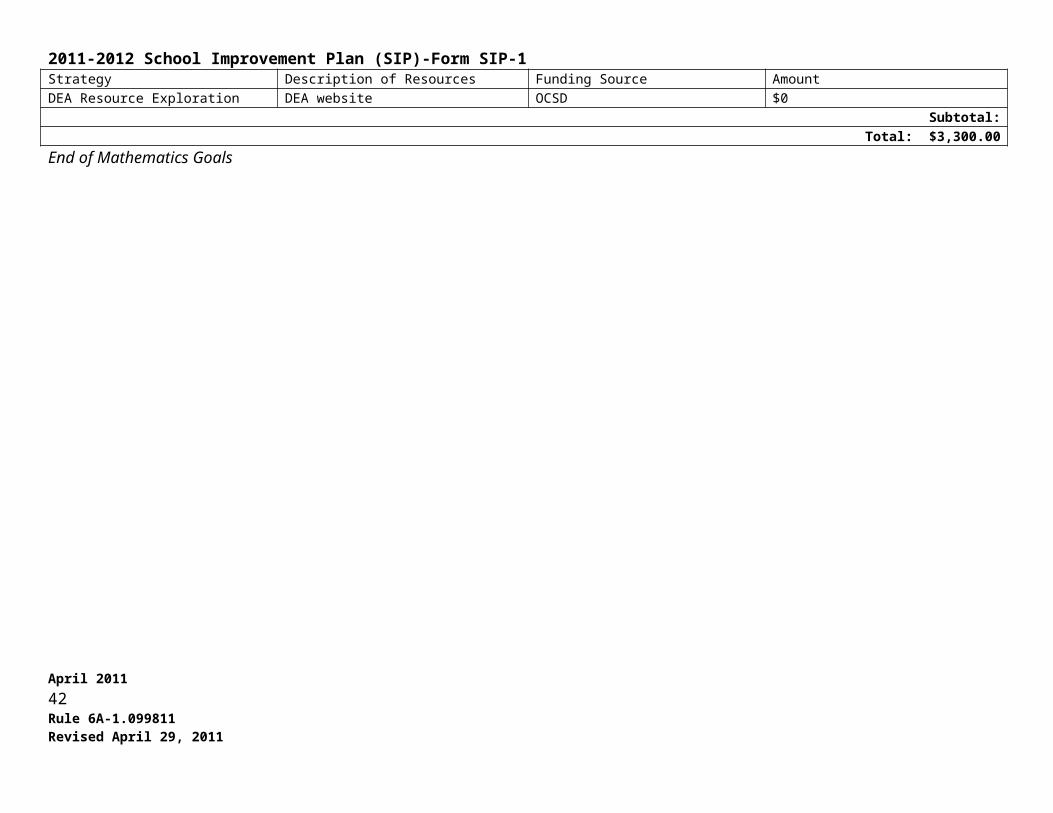
2011-2012 School Improvement Plan (SIP)-Form SIP-1* When using percentages, include the number of students the percentage represents next to the percentage (e.g. 70% (35)).
PARENT INVOLVEMENT GOAL(S) Problem-solving Process to Parent InvolvementBased on the analysis of parent involvement data, and reference to
“Guiding Questions”, identify and define areas in need of improvement:
Anticipated Barrier Strategy Person or Position Responsible for
Monitoring
Process Used to Determine Effectiveness of
Strategy
Evaluation Tool
1. Parent Involvement
Parent Involvement Goal #1:*Please refer to the percentage of parents who participated in school activities, duplicated or unduplicated.
1.1. Not all parents will be able to attend.78% of parents responded that they were not knowledgeable about grade level skills or FCAT requirements on the Climate Survey.
1.1. Grade Levels will conduct information meetings for parents and/or those interested from each grade level during the fall of the year.
1.1. Principal & Teachers 1.1. Parent participation in discussion and parent suggestions for improvement of the program at Walker.
1.1. Sign-in sheets and suggestion forms.
Walker Elementary provides multiple opportunities for parents to participate in their student’s education. 498 parents accompanied students to Orientation.
Walker earns the Golden School Award for parent volunteer hours with 495 active volunteers.
2011 Current level of Parent Involvement:*
2012 Expected level of Parent Involvement:*
Open House 204 parentsOrientation 498Golden school Award
Open House 250Orientation 650Golden School Award
1.2. Cluster Parent Workshops for Departmentalized grade levels
1.2. Teachers will provide information on homework, classroom expectations, and grade-level specific assessments & promotion criteria.
1.2. Classroom Teachers 1.2. % of parents attending Workshops will be monitored throughout the year.
1.2.Student Grades and signed agenda books.
1.3. 1.3. 1.3. 1.3. 1.3.
Professional Development (PD) aligned with Strategies through Professional Learning Community (PLC) or PD ActivityPlease note that each Strategy does not require a professional development or PLC activity.
PD Content /Topicand/or PLC Focus
Grade Level/Subject
PD Facilitatorand/or
PLC Leader
PD Participants(e.g. , PLC, subject, grade level, or
school-wide)
Target Dates and Schedules(e.g. , Early Release) and
Schedules (e.g., frequency of
Strategy for Follow-up/Monitoring Person or Position Responsible for Monitoring
April 2011 42Rule 6A-1.099811Revised April 29, 2011
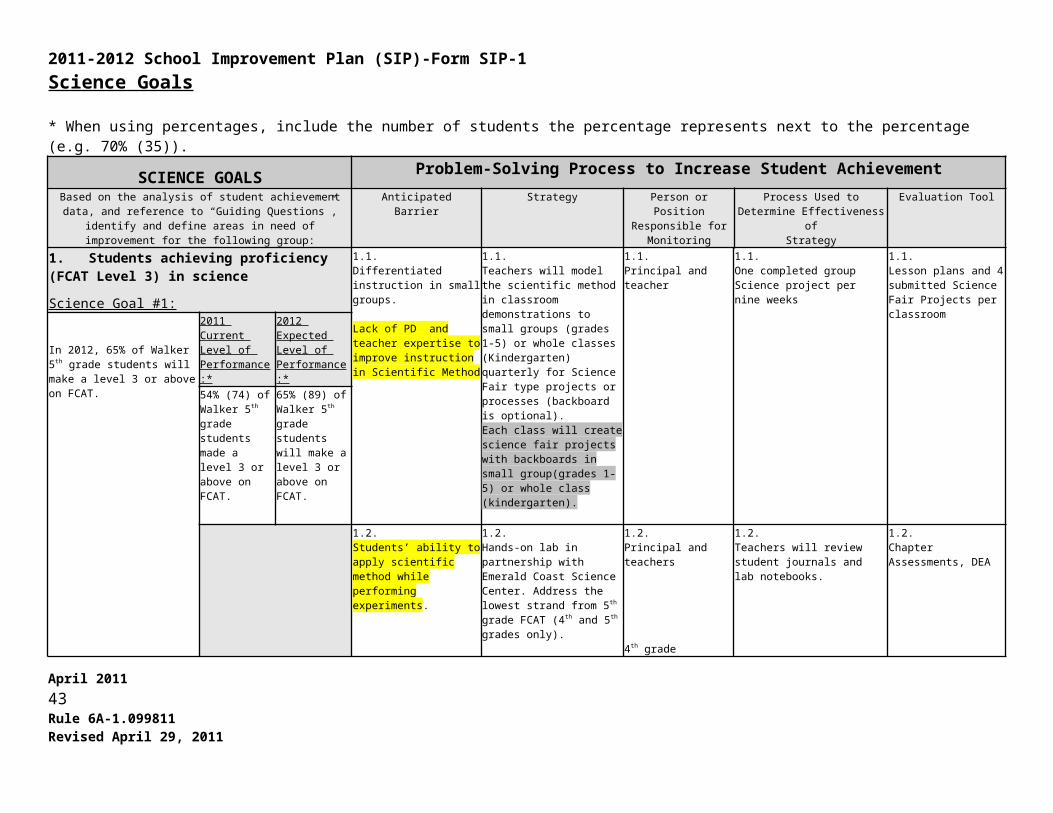
2011-2012 School Improvement Plan (SIP)-Form SIP-1meetings)
Parent Involvement Budget
* Please ensure that items included in the Parental Involvement Policy/Plan (PIP) are outlined in the following budget section.Include only school-based funded activities/materials and exclude district funded activities /materials.Evidence-based Program(s)/Materials(s)Strategy Description of Resources Funding Source AmountGrade-level Expectations Parent Workshops
Refreshments Title I $300
Parent Workshops Speaker & Printed Materials Title I $1100Subtotal:$1400.00
TechnologyStrategy Description of Resources Funding Source Available Amount
Subtotal:Professional DevelopmentStrategy Description of Resources Funding Source Amount
Subtotal:OtherStrategy Description of Resources Funding Source Amount
Subtotal:Total:
End of Parent Involvement Goal(s)
April 2011 43Rule 6A-1.099811Revised April 29, 2011
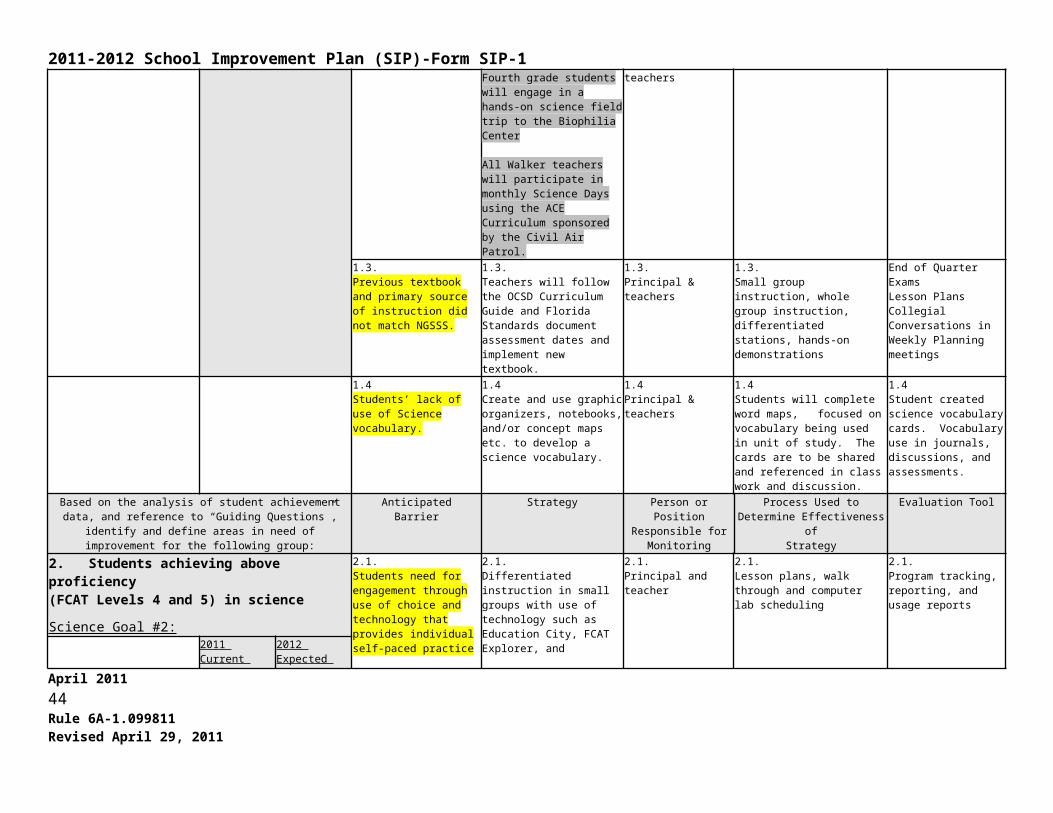
2011-2012 School Improvement Plan (SIP)-Form SIP-1
FINAL BUDGET (Insert rows as needed)Please provide the total budget from each section.Reading Budget
Total: $13,739.00Mathematics Budget
Total: $3,300.00Science Budget
Total: $3,600.00Writing Budget
Total: $2,060.00Attendance Budget
Total:Suspension Budget
Total:Dropout Prevention Budget
Total:Parent Involvement Budget
Total: $1,400.00Additional Goals
Total:
Grand Total: $27,699.00
Differentiated Accountability
School-level Differentiated Accountability (DA) Compliance
April 2011 44Rule 6A-1.099811Revised April 29, 2011
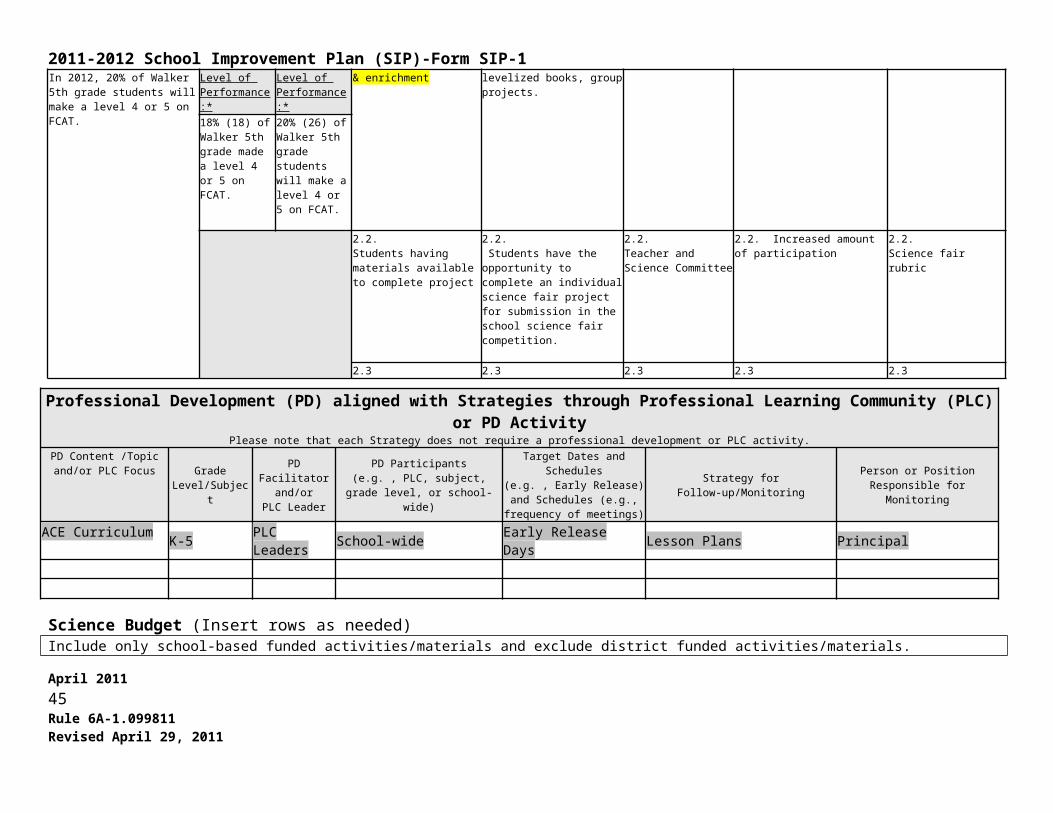
2011-2012 School Improvement Plan (SIP)-Form SIP-1Please choose the school’s DA Status. (To activate the checkbox: 1. double click the desired box; 2.when the menu pops up, select “checked” under “Default Value” header; 3. Select “OK”, this will place an “x” in the box.)School Differentiated Accountability Status
Intervene Correct II Prevent II Correct I Prevent I N/A
Upload a copy of the Differentiated Accountability Checklist in the designated upload link on the “Upload” page
School Advisory CouncilSchool Advisory Council (SAC) Membership ComplianceThe majority of the SAC members are not employed by the school district. The SAC is composed of the principal and an appropriately balanced number of teachers, education support employees, students (for middle and high school only), parents, and other business and community citizens who are representative of the ethnic, racial, and economic community served by the school. Please verify the statement above by selecting “Yes” or “No” below.
Yes No
If No, describe measures being taken to comply with SAC requirement.
Ethnicities that reflect our school are not evident on our SAC. Minorities are encouraged and invited to be part of the committee. Efforts to enlist parents and community members are ongoing.Describe the activities of the School Advisory Council for the upcoming year.
Train new SAC MembersProvide input and review the School Improvement Plan for 2011-12Provide representatives to serve on the Parent Leadership Council on the district levelInform parents concerning state and local initiatives (Class size, New Teacher Evaluation, etc.)Support Family Night activitiesPromote the 5 Star School Award for Walker
Describe projected use of SAC funds. AmountPurchase Library Books to support Reading strategies for Walker Students $2041.
Walker Elementary Data2008 – 2011
April 2011 45Rule 6A-1.099811Revised April 29, 2011
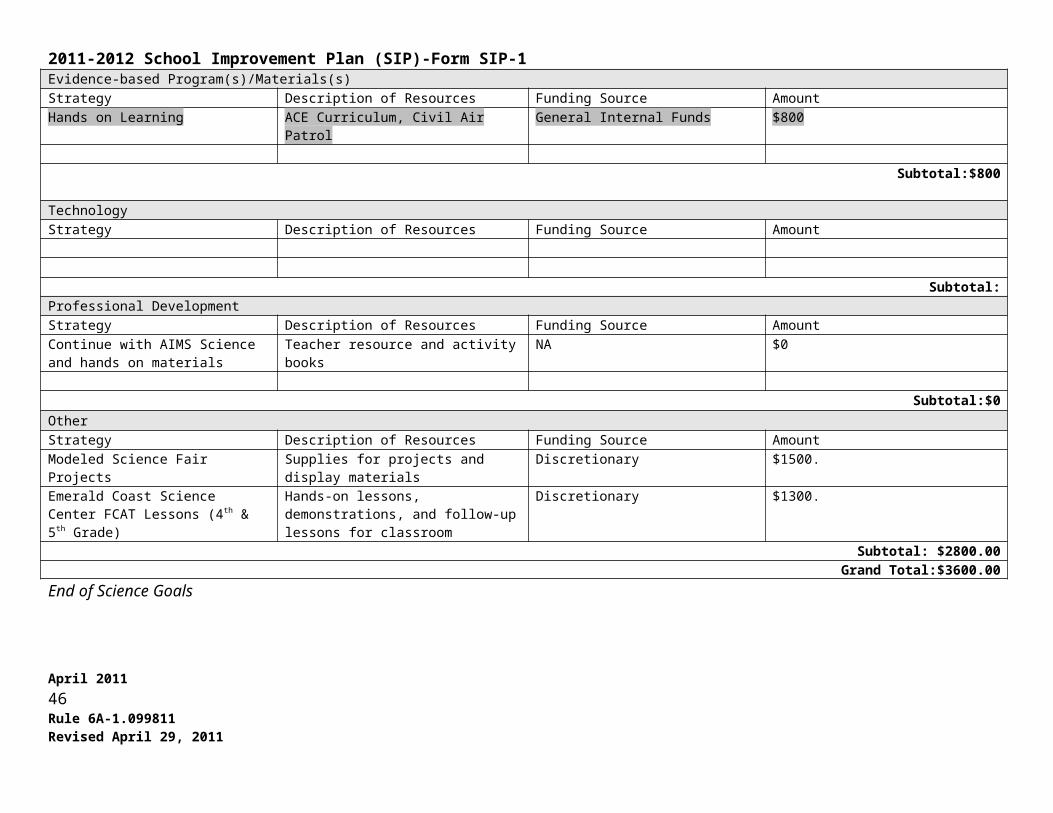
2011-2012 School Improvement Plan (SIP)-Form SIP-1Year Reading
% Level 3 & AboveMath
% Level 3 & AboveWriting
% Level 4 & AboveScience
% Level 3 & Above2011 88 81 79 542010 79 78 79 (3.5 & Above) 63.52009 84 78 85 (3.5 & Above) 502008 86 82 61 (3.5 & Above) 51
Year Reading% Learning Gains
Math% Learning Gains
Reading% of Lowest 25% Making
Learning Gains
Math% of Lowest 25% Making
Learning Gains2011 75 78 68 782010 59 56 44 482009 65 64 65 642008 65 64 78 66
Year Subgroups Reading% At or Above Grade Level
Math% At or Above Grade Level
Writing
2011 WhiteAfrican AmericanEc. Disadvantaged
SWD
85%54%75%NA
80%56%71%NA
2010 WhiteAfrican AmericanEc. Disadvantaged
SWD
79%NA68%45%
74%NA66%55%
NA94%NA
2009 WhiteAfrican AmericanEc. Disadvantaged
SWD
79%60%73%56%
74%52%67%59%
NA94%NA
2008 WhiteAfrican AmericanEc. Disadvantaged
SWD
89%67%81%79%
82%63%73%62%
81%NA85%NA
April 2011 46Rule 6A-1.099811Revised April 29, 2011