frontierwealth.com€¦ · web viewinvestor needs have become increasingly complex over the last...
TRANSCRIPT

PREPARED FOR John Doe03/26/2013

TABLE OF CONTENTS
Table of Contents.......................................................................................................................2 Investment Proposal Introduction..............................................................................................3 About Frontier Wealth Management.........................................................................................4 Investment Management Team.................................................................................................5 The Frontier Process: From Client Profiling to Portfolio Management.......................................6 Investment Profile Considerations..............................................................................................7 Proposed Investment Profile......................................................................................................8 Asset Allocation..........................................................................................................................9 The Callan Periodic Table of Investment Returns.....................................................................10 Proposed Asset Distribution.....................................................................................................11 Proposed Asset Allocation........................................................................................................12 Portfolio Construction and Implementation: A Core-Satellite Approach.................................13 Proposed Investments..............................................................................................................15 Multiple Stress Tests.................................................................................................................16 Beyond Product and Portfolios: Introducing the Unified Managed Household.......................18 Investment Policy Statement....................................................................................................22 Questionnaire...........................................................................................................................24

PREPARED BY: FRONTIER WEALTH MANAGEMENT 03/26/2013
INVESTMENT PROPOSAL INTRODUCTIONBUILDING UPON THE INFORMATION YOU PROVIDED IN THE INVESTMENT QUESTIONNAIRE, WE HAVE CRAFTED AN INVESTMENT PROPOSAL THAT ALSO INCORPORATES THE LATEST ECONOMIC TRENDS AND FINANCIAL RESEARCH AVAILABLE. BECAUSE THE ECONOMIC AND INVESTMENT LANDSCAPE CHANGES, WE HAVE DESIGNED YOUR PORTFOLIO TO ADAPT TO THOSE CHANGES. AS YOUR NEEDS CHANGE, WE CAN MAKE THE ADJUSTMENTS NECESSARY TO ENSURE YOUR PORTFOLIO MEETS THEM.
This investment proposal document provides details about your optimal investment strategy specifically tailored to your risk profile, investment objective and time horizon. Through a questionnaire we have created a suitable asset allocation followed by the most appropriate method of implementation which includes a variety of investment products and vehicles.
One of the important purposes of this Proposal is to establish a clear understanding between the Investor and the Advisor as to the investment goals, objectives and management policies applicable to the Investor's investment portfolio.
While this proposal is a suggested action plan, it is not a contract. Rather, it summarizes your goals and sets forth an investment philosophy, strategy and implementation plan to help you reach them. We will review your portfolio on a regular and consistent basis, and make adjustments as required to be certain it reflects any changes in your financial situation.
3
PREPARED BY: FRONTIER WEALTH MANAGEMENT 03/26/2013
ABOUT FRONTIER WEALTH MANAGEMENTONE SIZE DOES NOT FIT ALL. THAT’S WHY FRONTIER WEALTH MANAGEMENT LOOKS AT YOU AND YOUR SPECIFIC NEEDS WITH A DIFFERENT AND CRITICAL EYE. WE BELIEVE INDIVIDUAL PARTS AND ELEMENTS ARE JUST THAT – INDIVIDUAL. BUT WHEN THEY ALL COME TOGETHER, THE RESULT IS AN INSPIRING SOLUTION THAT TURNS YOUR VISION INTO REALITY.
Our diverse team of experts is skilled in helping you meet your goals while uncovering opportunities. Together, we will assess, simplify, and coordinate all of your financial affairs. We look at the big picture to define your entire financial landscape and then leverage our in-house wealth management philosophy and a proprietary Asset Management Platform powered by GeoWealth to efficiently build, manage, monitor and control every aspect of your portfolios, while appropriately balancing your goals and risk tolerance.
The result is a holistic wealth management solution that combines boutique level client services, institutional caliber portfolio management, and leading edge technology to help you achieve all of your long term goals.
UNIQUE ADVANTAGES: INVESTMENT VEHICLES:
Unified Managed Household Capability
Optimized Personal Strategic Asset Allocation
Diversification in 18 Separate Asset Classes
Tax-efficient Core- Satellite Portfolio Implementation
In-house Institutional-caliber Portfolio Managers
Proprietary ETF Selection Methodology
Proven Systematic Equity Strategies
Fresh-start Personalized Portfolios (not pooled)
Individual Securities
Exchange-Traded Funds (ETFs)
Broad Index Funds
Hedge Funds
Private Equity Investments
Real Estate Investments
Life Insurance
4

PREPARED BY: FRONTIER WEALTH MANAGEMENT 03/26/2013
INVESTMENT MANAGEMENT TEAM
IVO IVANOV
Prior to joining GeoWealth Management in 2010, Mr. Ivanov was a Portfolio Manager and Director at TD Ameritrade. There, he oversaw $2 billion of assets under management and also spearheaded the design and development of Amerivest, an online investment advisory platform. Prior to that, Ivo Ivanov was a Vice President and Director of Research at Bear Stearns Asset Management and O’Shaughnessy Capital Management where he designed and implemented various investment strategies and financial products for high-net-worth and institutional clients with $1.5 billion of assets under management. Mr. Ivanov received a Bachelor of Science Degree in Economics in Sofia, Bulgaria, a Master’s Degree in Mathematics and Statistics from Southern Illinois University in 1995 and an MBA from Thunderbird – The Garvin School of Management in 1997. Ivo Ivanov also obtained the CFA designation in 2001. He is married with two sons.
DIMITAR HRISTOV
Dimitar Hristov joined GeoWealth in 2002 as a Portfolio Manager and Investment Strategist and has been a key member of the firm’s Investment Management Committee, evaluating Private Equity opportunities and designing systematic investment strategies. Mr. Hristov has also led the business development of the leading-edge GeoWealth Turnkey Asset Management Platform. Before joining GeoWealth, Dimitar was a Portfolio Manager at O’Shaughnessy Capital Management where he designed and implemented investment strategies for institutional and individual clients with $1.5 billion of assets under management. Prior to that, Dimitar Hristov worked at First Princeton Asset Management as an Assistant Portfolio Manager, conducting investment research for the firm’s clients’ portfolios with approximately $300 million of assets under management. In 1998, Dimitar was part of the Investment Strategy team of Merrill Lynch & Co. in New York City, covering Emerging Markets/Latin America. Mr. Hristov obtained a Bachelor of Science Degree in Finance with a minor in Mathematics from Rutgers University, School of Business and has passed Level I of the CFA exam. He is married with a seven-year-old daughter.
COLIN RUTHVEN
Colin Ruthven is the Chief Technology Officer of GeoWealth Management LLC. and is the leader of the team responsible for the development of the GeoWealth Asset Management Platform. He has more than thirty years of international experience developing business systems across a broad variety of industries. Prior to joining GeoWealth, Colin was Director of Development Services at Barclays Capital primarily involved with Fixed Income systems development. Colin also served as a lead technologist responsible for the design and construction of Smith Barney’s award winning “Access” website providing online trading and customer service to their retail brokerage clients and developed their first business intelligence system. Colin has consulted independently developing Business Intelligence systems in Retail Banking, Consumer Packaged Goods, Brokerage, Insurance, Media and Investment Banking. Colin was Senior Consultant at business intelligence pioneer Metaphor Computer Systems and managed a nationwide team. At a boutique software consultancy in Australia, he developed systems ranging from core business to one used for live television coverage of the annual James Hardie 1000 car race. He designed and wrote the “Datacat” compiler and runtime interpreter product marketed in US, Australia and New Zealand. He has a Bachelor of Science degree in Computer Science from the University of Sydney in Sydney, Australia. Mr. Ruthven is married with no children.
5
Our Investment Management Team has extensive experience creating investment solutions for high net worth individuals and major institutions.

Periodically review changes in your investment objectivesContinually evaluate progress towards financial goals Modify portfolio in accordance with your changing circumstances
Deliver cost effective implementation and best trading executionRebalance regularly according to strategy calendarMonitor changing trends and market conditionsPeriodically re-align your portfolio with changing market conditions
Conduct security and investment fund researchIdentify suitable mix of investment options Combine securities and funds in optimized proportionsConsider further customization to accommodate additional needsConstruct a diversified portfolio
Identify suitable asset classes for portfolioGenerate optimal Strategic Asset AllocationSelect appropriate performance benchmarksCreate an Investment Policy Statement
Identify investment objectiveIdentify time horizonAssess risk tolerance Identify liquidity needsEstablish income targetsIdentify return objectives and ranges of volatility Create client profile
CREATE YOUR INVESTMENT STRATEGY
CONSTRUCT YOUR PORTFOLIOIMPLEMENT AND MANAGE YOUR PORTFOLIO
EVALUATE AND REVIEW
DEFINE YOUR FINANCIAL OBJECTIVES
THE FRONTIER PROCESS: FROM CLIENT PROFILING TO PORTFOLIO MANAGEMENTFRONTIER WEALTH MANAGEMENT’S PROCESS IS DYNAMIC, RATHER THAN STATIC. IN A WORLD THAT CHANGES CONSTANTLY, IT MAKES SENSE THAT YOU AND YOUR NEEDS WILL, TOO. THAT IS WHY WE HAVE DESIGNED OUR PROCESS TO ADAPT QUICKLY TO THOSE CHANGES.

PREPARED BY: FRONTIER WEALTH MANAGEMENT 03/26/2013
INVESTMENT PROFILE CONSIDERATIONSWE HAVE LISTENED TO YOUR NEEDS AND CONCERNS, AND HAVE DESIGNED A STRATEGIC PORTFOLIO TO ADDRESS THEM. WE HAVE CONSIDERED YOUR TIME HORIZON, RISK TOLERANCE, INVESTMENT OBJECTIVE, LIQUIDITY REQUIREMENTS, PARTICULAR CIRCUMSTANCES AND OTHER UNIQUE CONSIDERATIONS.
Investment Profile Considerations Your Strategy
INVESTMENT OBJECTIVE
Your objective is determined by whether your investment priority is to generate current income or to achieve capital growth.
INVESTMENT OBJECTIVE
Growth of Capital
TIME HORIZON
We define this as that period of time between now and when you make significant withdrawals that could require modifying your portfolio, or how long the portfolio we have designed for you will remain intact. Because asset values fluctuate, especially over shorter time periods, you recognize that the possibility of capital loss exists. This risk is mitigated over longer time periods.
TIME HORIZON
Up to 15 years
RISK TOLERANCE
This measures your willingness to tolerate a decline in the portfolio’s value over a period of time.
RISK TOLERANCE
Moderately High
LIQUIDITY REQUIREMENTS
Liquidity needs may impact your profile.
LIQUIDITY REQUIREMENTS
n/a
INVESTOR PROFILE Combines the above factors to determine whether your profile is Conservative, Stable, Balance, Growth or Aggressive.
INVESTOR PROFILE
Growth
SPECIAL CIRCUMSTANCES/SPECIAL CONSIDERATIONS
Knowledge of investments, stock restrictions, and socially conscious investment preferences may serve to further tailor your portfolio.
SPECIAL CIRCUMSTANCES/SPECIAL CONSIDERATIONS
n/a
REVIEW PREFERENCES
How frequently you would like to review your investment strategy.
REVIEW PREFERENCES
You have indicated you prefer one, in-depth annual review.
7

PREPARED BY: FRONTIER WEALTH MANAGEMENT 03/26/2013
8

PREPARED BY: FRONTIER WEALTH MANAGEMENT 03/26/2013
PROPOSED INVESTMENT PROFILETHE BAR CHART BELOW ILLUSTRATES THE APPROPRIATE RISK LEVEL WE HAVE ASSUMED BASED ON OUR INFORMATION GATHERING PROCESS AND IT WILL DRIVE THE ASSET CLASSES SELECTED FOR YOUR PORTFOLIO.
We have designed our models around five levels of risk: conservative, stable, balanced, growth and aggressive. We have calculated your risk profile based on the answers you have provided to our questionnaire, which evaluates your risk tolerance, investment objectives and time horizon among other factors.
There is a tradeoff between risk and reward, and the most common method for measuring it is standard deviation, a statistical measurement of how much variance there is from the mean of portfolio returns. The risk of any portfolio is computed from the standard deviation of the expected returns of the underlying asset classes.
A great way to illustrate risk/return tradeoff is through the Efficient Frontier. The chart below shows various levels of return and the standard deviation of each.
You will note that the returns are plotted on the left (Y) axis, and the variability, or standard deviation, is plotted on the bottom (X) axis). It is evident that as the return increases, the curve extends to the right to indicate an increase in additional risk.
If there are discrepancies between the proposed risk level and that of your existing portfolio, your advisor will address them in regular reviews with you.
9
We structure our recommendations to utilize the best mix of assets that will seek an optimum amount of return for your given risk profile.
A more aggressive profile indicates that you are willing to tolerate greater volatility (risk) in order to achieve higher returns.
The longer you stay invested in a strategy consistent with your profile, the smaller the impact this volatility is likely to have on your long term portfolio performance. The reverse is also true.

PREPARED BY: FRONTIER WEALTH MANAGEMENT 03/26/2013
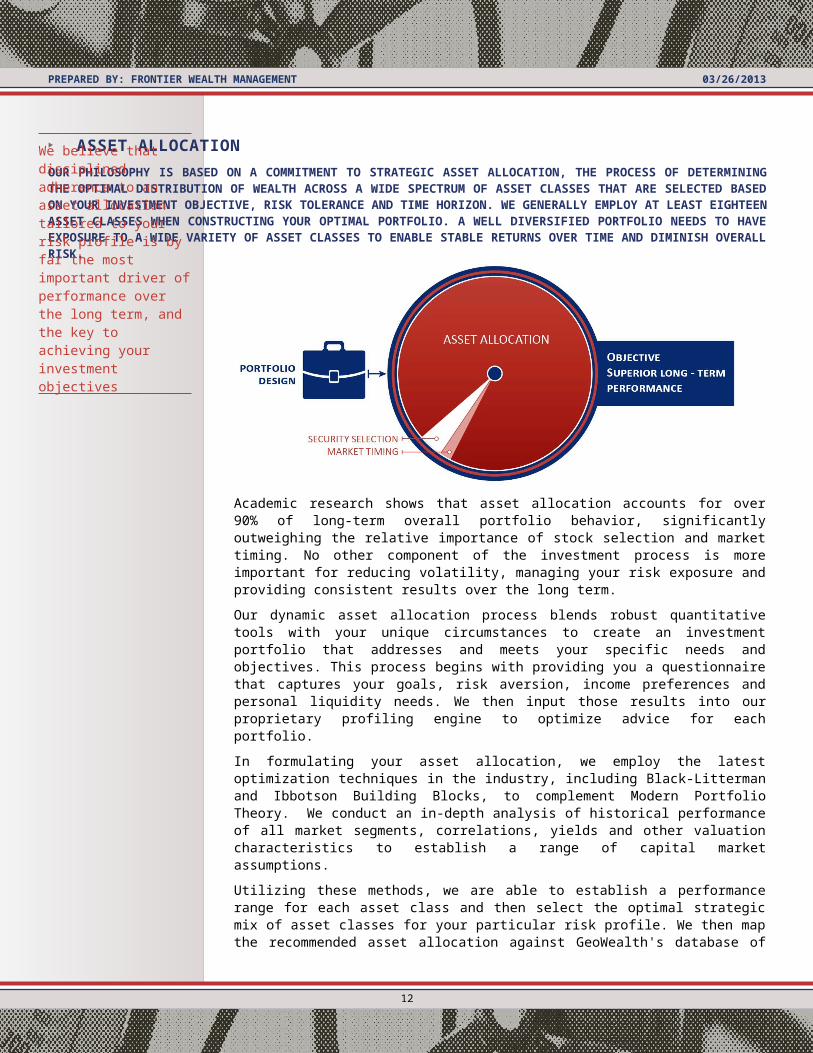
ASSET ALLOCATIONOUR PHILOSOPHY IS BASED ON A COMMITMENT TO STRATEGIC ASSET ALLOCATION, THE PROCESS OF DETERMINING THE OPTIMAL DISTRIBUTION OF WEALTH ACROSS A WIDE SPECTRUM OF ASSET CLASSES THAT ARE SELECTED BASED ON YOUR INVESTMENT OBJECTIVE, RISK TOLERANCE AND TIME HORIZON. WE GENERALLY EMPLOY AT LEAST EIGHTEEN ASSET CLASSES WHEN CONSTRUCTING YOUR OPTIMAL PORTFOLIO. A WELL DIVERSIFIED PORTFOLIO NEEDS TO HAVE EXPOSURE TO A WIDE VARIETY OF ASSET CLASSES TO ENABLE STABLE RETURNS OVER TIME AND DIMINISH OVERALL RISK.
Academic research shows that asset allocation accounts for over 90% of long-term overall portfolio behavior, significantly outweighing the relative importance of stock selection and market timing. No other component of the investment process is more important for reducing volatility, managing your risk exposure and providing consistent results over the long term.
Our dynamic asset allocation process blends robust quantitative tools with your unique circumstances to create an investment portfolio that addresses and meets your specific needs and objectives. This process begins with providing you a questionnaire that captures your goals, risk aversion, income preferences and personal liquidity needs. We then input those results into our proprietary profiling engine to optimize advice for each portfolio.
In formulating your asset allocation, we employ the latest optimization techniques in the industry, including Black-Litterman and Ibbotson Building Blocks, to complement Modern Portfolio Theory. We conduct an in-depth analysis of historical performance of all market segments, correlations, yields and other valuation characteristics to establish a range of capital market assumptions.
Utilizing these methods, we are able to establish a performance range for each asset class and then select the optimal strategic mix of asset classes for your particular risk profile. We then map the recommended asset allocation against GeoWealth's database of investment strategies, in order to tailor a core-satellite portfolio designed to meet your specific investment goals.
Our portfolio managers continuously assess portfolios in light of current economic and market conditions, and may introduce new asset classes or investment vehicles to enhance diversification over time. We can also incorporate your existing holdings
into the mix to optimally position them among other investment options. In addition, our proprietary technology platform helps our managers actively monitor portfolios to ensure that they adhere to their allocations and avoid style drift.
The result is a personalized, client-specific asset allocation that as a whole provides a minimum expected volatility for a given target return or a maximum return for a given target volatility.
THE CALLAN PERIODIC TABLE OF INVESTMENT RETURNS
10
We believe that disciplined adherence to an asset allocation tailored to your risk profile is by far the most important driver of performance over the long term, and the key to achieving your investment objectives

PREPARED BY: FRONTIER WEALTH MANAGEMENT 03/26/2013
ANNUAL RETURNS FOR KEY INDICES (1991-2010) RANKED IN ORDER OF PERFORMANCE
No asset class performs the same way at all times. Market fluctuations, coupled with changes in economic trends, result in different returns for the various asset classes. The chart below illustrates the significant volatility (risk) that individual asset classes experience from year to year.
Well diversified portfolios can reduce this risk and smooth out investment returns. For this reason, Frontier Wealth Management constructs portfolios that combine a mix of asset classes with varying returns and risk components in order to provide you with the best risk-adjusted return over the long run.
11
PREPARED BY: FRONTIER WEALTH MANAGEMENT 03/26/2013
PROPOSED ASSET DISTRIBUTION
Proposed Investments Breakdown
GeoWealth Growth Diversified ModelGeoWealth Stable Return Model
Proposed Investments Breakdown
GeoWealth Growth Diversified Model $ 500,000.00 66.67 %
GeoWealth Stable Return Model $ 250,000.00 33.33 %
TOTAL $ 750,000.00 100%
12
The Asset Distribution represents an overall breakdown of proposed investments for your household. It includes portfolios and funds which are supplemental to the main Asset Allocation-based portfolio driven by your Investment Profile.

PREPARED BY: FRONTIER WEALTH MANAGEMENT 03/26/2013
PROPOSED ASSET ALLOCATION
Proposed
CashCommoditiesReal EstateInternational Fixed IncomeHigh YieldMBSDomestic Fixed IncomeInternational EquitiesDomestic Equities
Proposed
DOMESTIC EQUITIES $ 199,999.80 40.00 %
Domestic Large Cap Growth Equities $ 34,999.97 7.00 %
Domestic Large Cap Value Equities $ 39,999.96 8.00 %
Domestic Mid Cap Growth Equities $ 29,999.97 6.00 %
Domestic Mid Cap Value Equities $ 34,999.97 7.00 %
Domestic Small Cap Growth Equities $ 19,999.98 4.00 %
Domestic Small Cap Value Equities $ 24,999.98 5.00 %
Domestic Micro Cap Equities $ 14,999.99 3.00 %
INTERNATIONAL EQUITIES $ 94,999.91 19.00 %
Developed Markets $ 59,999.94 12.00 %
Emerging Markets $ 34,999.97 7.00 %
DOMESTIC FIXED INCOME $ 74,999.93 15.00 %
Short Term Fixed Income $ 19,999.98 4.00 %
Intermediate Term Fixed Income $ 24,999.98 5.00 %
Long Term Fixed Income $ 29,999.97 6.00 %
MBS $ 24,999.98 5.00 %
MBS $ 24,999.98 5.00 %
HIGH YIELD $ 24,999.98 5.00 %
High Yield $ 24,999.98 5.00 %
INTERNATIONAL FIXED INCOME $ 39,999.96 8.00 %
International Fixed Income $ 19,999.98 4.00 %
Emerging Markets Fixed Income $ 19,999.98 4.00 %
REAL ESTATE $ 19,999.98 4.00 %
Real Estate $ 19,999.98 4.00 %
COMMODITIES $ 14,999.99 3.00 %
Commodities $ 14,999.99 3.00 %
CASH $ 5,000.00 1.00 %
Cash $ 5,000.00 1.00 %
TOTAL $ 499,999.50 100.00 %
13
The Proposed Asset Allocation is based on comprehensive research done by our Portfolio Management team. The latest optimization techniques have been employed to ensure efficient diversification for your portfolio across the most suitable combination of asset classes. This allocation is tailored to fit your Investment Profile, which is based on your Investment objective, Time Horizon and Risk Tolerance.

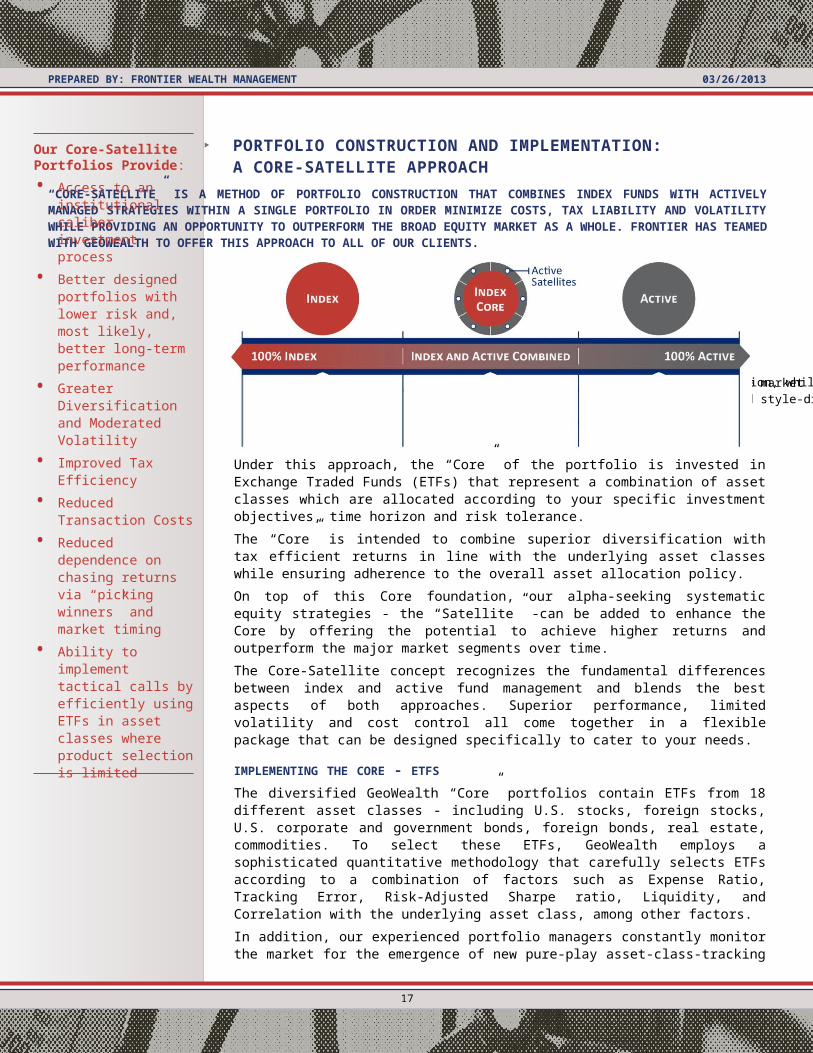
Seeks market performance (beta) using ETFsLower costHigh potential tax efficiency
ETF-based “Core” ensures optimal asset allocation, while alpha generating “Satellites” add opportunity to outperformSeeks to outperform the market (alpha)Offers concentrated and style-driven strategies
PREPARED BY: FRONTIER WEALTH MANAGEMENT 03/26/2013
PORTFOLIO CONSTRUCTION AND IMPLEMENTATION: A CORE-SATELLITE APPROACH
“CORE-SATELLITE” IS A METHOD OF PORTFOLIO CONSTRUCTION THAT COMBINES INDEX FUNDS WITH ACTIVELY MANAGED STRATEGIES WITHIN A SINGLE PORTFOLIO IN ORDER MINIMIZE COSTS, TAX LIABILITY AND VOLATILITY WHILE PROVIDING AN OPPORTUNITY TO OUTPERFORM THE BROAD EQUITY MARKET AS A WHOLE. FRONTIER HAS TEAMED WITH GEOWEALTH TO OFFER THIS APPROACH TO ALL OF OUR CLIENTS.
Under this approach, the “Core” of the portfolio is invested in Exchange Traded Funds (ETFs) that represent a combination of asset classes which are allocated according to your specific investment objectives, time horizon and risk tolerance.
The “Core” is intended to combine superior diversification with tax efficient returns in line with the underlying asset classes while ensuring adherence to the overall asset allocation policy.
On top of this Core foundation, our alpha-seeking systematic equity strategies - the “Satellite” -can be added to enhance the Core by offering the potential to achieve higher returns and outperform the major market segments over time.
The Core-Satellite concept recognizes the fundamental differences between index and active fund management and blends the best aspects of both approaches. Superior performance, limited volatility and cost control all come together in a flexible package that can be designed specifically to cater to your needs.
IMPLEMENTING THE CORE - ETFS
The diversified GeoWealth “Core” portfolios contain ETFs from 18 different asset classes - including U.S. stocks, foreign stocks, U.S. corporate and government bonds, foreign bonds, real estate, commodities. To select these ETFs, GeoWealth employs a sophisticated quantitative methodology that carefully selects ETFs according to a combination of factors such as Expense Ratio, Tracking Error, Risk-Adjusted Sharpe ratio, Liquidity, and Correlation with the underlying asset class, among other factors.
In addition, our experienced portfolio managers constantly monitor the market for the emergence of new pure-play asset-class-tracking Exchange-Traded Funds on the market in consideration for future selection.
Our ETF-based asset allocation approach has a proven track record. GeoWealth Portfolio Manager Mr. Ivo Ivanov oversaw $2 Billion in ETF allocations while serving as Chief Portfolio Strategist for Amerivest and Director at TD Ameritrade.
14
Our Core-Satellite Portfolios Provide:
• Access to an institutional caliber investment process
• Better designed portfolios with lower risk and, most likely, better long-term performance
• Greater Diversification and Moderated Volatility
• Improved Tax Efficiency
• Reduced Transaction Costs
• Reduced dependence on chasing returns via “picking winners” and market timing
• Ability to implement tactical calls by efficiently using ETFs in asset classes where product selection is limited
• Ability to refine rebalancing opportunities by allocating between index and active investments

PREPARED BY: FRONTIER WEALTH MANAGEMENT 03/26/2013
IMPLEMENTING THE SATELLITE: PROPRIETARY AND PROVEN SYSTEMATIC STRATEGIES
GeoWealth offers a comprehensive suite of equity strategies that includes over 12 systematic models, covering the large-cap growth, large-cap value, mid-cap and small-cap equity classes.
Each strategy has been formulated, analyzed and time-tested (for up to 30 years) using S&P COMPUSTAT - the richest financial database containing both fundamental and price-related data for US and Canadian Equities. The strategies incorporate hierarchical and multi-factor screens, combining fundamental and technical factors which our research has shown to be most successful in selecting best-of-breed equities in a given asset class over the long term.
Equity recommendations for each strategy are generated anew on each trading day, and historical performance of all existing strategies is updated from COMPUSTAT on a monthly basis. Our portfolio managers further screen the list of recommendations for anomalies or other indications that particular recommendation may be inappropriate for a portfolio.
A number of these strategies were first developed at O'Shaughnessy Capital Management by quantitative pioneer Jim O'Shaughnessy and a team of portfolio managers led by GeoWealth's Ivo Ivanov and Dimitar Hristov. Subsequently, these same models have been licensed and/or used by major institutions and advisory firms such as Royal Bank of Canada, Bears Stearns, O’Shaughnessy Asset Management and Hennessy Advisors to manage over $10 Billion in assets.
INCOME GENERATION – GEOWEALTH STABLE RETURN MODEL
Clients with high liquidity needs, low risk tolerance, or a desire for consistent returns may be ideally suited for GeoWealth’s Stable Return Model. This actively managed income generation product is based on a proprietary systematic model and invests largely in income-producing asset classes and is implemented via ETFs. Rebalanced monthly and very liquid, this product can also be part of an overall household portfolio with its low volatility and attractive stable return behavior.
ALTERNATIVE INVESTMENTS
Frontier’s experience and resources in the Alternative Investment space allow us provide access to an additional layer of investments in the form of private equity, hedge funds, and real estate. Alternatives can provide exposure to investment opportunities that cannot otherwise be accessed through traditional equity and fixed income markets. Qualified investors with long time horizons and greater tolerance for illiquidity may wish to consider allocating portions of their portfolio into alternative strategies. In addition to attractive risk adjusted return potential, alternatives may provide diversification benefits.
15

PREPARED BY: FRONTIER WEALTH MANAGEMENT 03/26/2013
PROPOSED INVESTMENTS
WITH THE EXCEPTION OF CASH, WE WILL IMPLEMENT THE ASSET ALLOCATION USING THE FOLLOWING INDEX FUND SECURITIES:
Symbol Name $ %
AIG AMERICAN INTERNATIONAL GROUP ORD 7,999.99 1.60 %AXLL AXIALL ORD 2,500.00 0.50 %$CASH CASH 5,000.00 1.00 %FDM FIRST TRUST DJ SEL MICROCAP INDX ETF 14,999.99 3.00 %GME GAMESTOP CL A ORD 7,999.99 1.60 %GNCMA GENERAL COMMUNICATIONS CL A ORD 2,500.00 0.50 %HGR HANGER ORD 2,500.00 0.50 %MBB ISHARES BARCLAYS MBS FIXED RATE ETF 24,999.98 5.00 %IWS ISHARES RUSSELL MIDCAP VALUE IND ETF 34,999.97 7.00 %IGOV ISHARES S&P/CITIGROUP INTER TRE ETF 19,999.98 4.00 %EMB ISHS JPMRGN USD EMRG MRKTS BOND ETF 19,999.98 4.00 %MDR MCDERMOTT INTERNATIONAL ORD 2,500.00 0.50 %PHH PHH ORD 2,500.00 0.50 %PPC PILGRIMS PRIDE ORD 2,500.00 0.50 %DBC POWERSHARES DB CMMDTY IDX TRCKNG ETF 14,999.99 3.00 %SWY SAFEWAY ORD 7,999.99 1.60 %SCHE SCHWAB EMERGING MARKETS EQUITY ETF 34,999.97 7.00 %SCHF SCHWAB INTERNATIONAL EQUITY ETF 59,999.94 12.00 %SCHG SCHWAB US LARGE CAP GROWTH ETF 34,999.97 7.00 %STX SEAGATE TECHNOLOGY ORD 7,999.99 1.60 %SKYW SKYWEST ORD 2,500.00 0.50 %JNK SPDR BARCLAYS HIGH YIELD BOND ETF 24,999.98 5.00 %TEN TENNECO ORD 2,500.00 0.50 %UIL UIL HOLDINGS ORD 2,500.00 0.50 %UIS UNISYS ORD 2,500.00 0.50 %BIV VANGUARD INTERMEDIATE TERM BOND ETF 24,999.98 5.00 %BLV VANGUARD LONG TERM BOND ETF 29,999.97 6.00 %VOT VANGUARD MID CAP GROWTH ETF 29,999.97 6.00 %VNQ VANGUARD REIT ETF 19,999.98 4.00 %BSV VANGUARD SHORT-TERM BOND ETF 19,999.98 4.00 %VBK VANGUARD SMALL CAP GROWTH ETF 19,999.98 4.00 %WYNN WYNN RESORTS ORD 7,999.99 1.60 %
Total 500,000.00 100%
16
PREPARED BY: FRONTIER WEALTH MANAGEMENT 03/26/2013
MULTIPLE STRESS TESTSWE HAVE USED ANOTHER TOOL TO DESIGN YOUR ASSET ALLOCATION: MULTIPLE STRESS TESTS. WE HAVE MEASURED YOUR PROPOSED ASSET ALLOCATION AGAINST THE HISTORICAL PERFORMANCE DURING VARIOUS MARKET CRISES, AND WE HAVE USED SEVERAL INDICES FOR COMPARISON: US S&P 500 LARGE-CAP; MSCI-EAFE (INTERNATIONAL DEVELOPED MARKETS); THE RUSSELL 2000 SMALL-CAP; AND THE US AGGREGATE BOND INDEX.
During the European Economic Crisis of 1990, your proposed asset allocation would have outperformed all major benchmarks except BarCap US Aggregate Bond Index. During this period, European nations had sluggish economic growth, and their currency declined. While efforts were undertaken to establish a single European currency, those efforts were thwarted until 1999.
In the Gulf War of 1990-1991, your proposed asset allocation again would have outperformed the domestic equity markets, but it would have underperformed the international equities and bond indexes. This crisis occurred with Iraq’s invasion of Kuwait and the US’s sending troops into Saudi Arabia. Iraqi oil shipments were blockaded, the US declared war on Iraq, and coalition forces began Operation Desert Storm. In February 1991, Iraq withdrew from Kuwait.
During the Mexican Peso Crisis in December of 1994, your proposed asset allocation would have outperformed both the BarCap US Aggregate Bond Index and the MSCI EAFE Free Index, but it would have underperformed the S&P 500 and Russell 2000 indexes. Mexico’s plummeting international reserves and growing deficit caused Mexicans to move money out of the country, resulting in the balsa’s and peso’s drop in value. The US put together a $53 Billion rescue package to help alleviate the problem, but the peso continued to fall.
During the 1998 Russian Debt Crisis (that triggered the demise of Long-Term Capital Management), your proposed asset allocation would have outperformed all segments of the capital markets except bonds.
During the Tech Bubble Burst in 2000, your proposed asset allocation would have significantly outperformed each of the indexes except for bonds. In this crisis, the technology sector experienced significant growth and a bubble followed by a 500-point swing in the Dow Jones Industrial Average in a single day, and a 40% drop in the NASDAQ from its peak.
In September of 2001, your proposed portfolio would have underperformed the bond index, but outperformed the other indexes. This crisis occurred when 4 passenger planes were hijacked, and 3 crashed into NYC’s World Trade Center and the Pentagon. Passengers diverted the 4th plane into a field near Pittsburgh, PA.
During the 2007-2009 Financial Crisis, your proposed asset allocation would have underperformed the pure bond index, but at the same time it would have significantly outperformed all equity markets where losses mounted over 50%. In this crisis, promulgated by bursting of the housing-induced bubble, a liquidity shortfall in the US banking system led to a collapse of the financial system and quickly spread to encompass a selloff in global markets.
17

PREPARED BY: FRONTIER WEALTH MANAGEMENT 03/26/2013
Expected Results for Proposed Allocation—Aggregate1
Proposed Allocation
U.S.–S&P 500
MSCI–EAFE
Russell 2000 Index
Barclays Capital U.S.
Agg Bond Index
European Economic Crisis (12/89-9/90) -7.60% -8.94% -28.34% -23.07% 3.99%
Gulf War Crisis (5/90-10/90) -3.67% -6.37% 0.94% -23.90% 6.85%
Mexican Peso Crisis (12/94) 0.70% 1.48% 0.62% 2.69% 0.69%
Russian Debt Crisis (7/98-9/98) -8.76% -9.95% -14.12% -20.15% 4.23%
Tech Bubble Burst (8/00-9/02) -15.88% -41.30% -41.77% -25.34% 25.22%
September 11th (9/01) -7.15% -8.08% -10.11% -13.46% 1.16%
Financial Crisis (10/07-2/09) -38.16% -50.17% -54.68% -50.67% 7.04%
1 See “Important Information Regarding Hypothetical Projections”. This chart is for illustrative purposes and not intended to be representative of any specific investment vehicle. Stress Test – A simulation technique used on asset and liability portfolios to determine portfolio reaction to difference financial situations.
18

PREPARED BY: FRONTIER WEALTH MANAGEMENT 03/26/2013
BEYOND PRODUCT AND PORTFOLIOS: INTRODUCING THE UNIFIED MANAGED HOUSEHOLD INVESTOR NEEDS HAVE BECOME INCREASINGLY COMPLEX OVER THE LAST FEW DECADES, WITH INDIVIDUAL HOUSEHOLDS MORE FREQUENTLY HAVING MULTIPLE GOALS, PORTFOLIOS AND REGISTRATIONS THAT SPAN A BROAD SPECTRUM OF FINANCIAL CHALLENGES THAT INCLUDE EDUCATION, RETIREMENT AND ESTATE PLANNING.
Achieving investor objectives has therefore grown beyond the capacity of any individual product or portfolio and managing assets at the household level requires an unprecedented level of coordination and planning. Unfortunately, delivering true household-level coordination that is efficient and scalable to all clients is simply beyond the capability of most advisory firms.
That is why Frontier is proud to team with GeoWealth to offer Unified Managed Household capability to all of our clients. Our UMH platform represents the latest in wealth management innovation and provides a sophisticated solution for holistically managing investable assets across an entire household.
19

PREPARED BY: FRONTIER WEALTH MANAGEMENT 03/26/2013
A BRIEF HISTORY OF PORTFOLIO SOLUTIONS
MUTUAL FUNDS Mutual Funds were the first investment vehicle to offer investors a basket of diversified and professionally managed securities. However, as pooled investments, Mutual Fund products have inherent limitations (including tax inefficiency and style drift), which negatively impact overall portfolio performance.
SEPARATELY MANAGED ACCOUNTS (SMA) Although subject to higher account minimums, Separately Managed Accounts (SMAs) offer investors the advantage of personal ownership of the underlying securities selected by money managers. As the name suggests, a separate brokerage account must be set up for each manager, a limitation that can burden the overall portfolio with cumbersome implementation and rebalancing, limited customization, and complex paperwork.
MULTIPLE STYLE PORTFOLIOS (MSP)Some firms have introduced Multiple Style Portfolios (MSPs) in order to address the limitations of SMAs. MSPs build upon the SMA model by placing an "Overlay Manager" between the financial advisor and money managers. Overlay managers can coordinate the implementation of multiple separate account strategies, engineer better asset allocation, improve tax management, and consolidate reporting. However, MSPs have limitations of their own, including a lack of product diversity within individual accounts and limited functional awareness of household assets.
UNIFIED MANAGED ACCOUNTS (UMA) Recent advances in financial services technology have paved the way for emergence of the Unified Managed Account (UMA) – a powerful enhancement of customization and tax management capabilities provided by the MSP. UMA platforms make it possible to combine multiple investment products within a single account (i.e., individual securities, ETFs, SMAs, and Mutual Funds). This capability reduces accounts and paperwork while improving the ability of overlaymanagers to diversify, customize, and tax-optimize client portfolios.
20
PRODUCT RETURNS DON’T TELL THE WHOLE STORY….
Just a few examples of hidden costs and benefits associated with various solutions:
Mutual Funds with 100% turnover can generate capital gains distributions that may reduce after-tax returns by as much as 250 bps, according to Vanguard’s J. Bogle
Overlay Management (MSP, UMA, UMH) may enhance after-tax returns by 200 bps annually over 10 years according to a study by Stein and McIntire in the Journal of Wealth Management
Asset Location (UMH) may enhance after-tax returns by 30 bps according to a study by Daryanani and Cordaro in the Journal of Financial Planning

PREPARED BY: FRONTIER WEALTH MANAGEMENT 03/26/2013
UNIFIED MANAGED HOUSEHOLDS: A MORE HOLISTIC APPROACH
Our UMH platform offers you the highest level of managed account integration by aggregating multiple accounts with multiple registrations across multiple financial organizations, allowing for a holistic coordination of assets within and across accounts – including brokerage, IRA, 401K, trust, etc.
This capability enables our advisors to coordinate the implementation of multiple goals, consolidate paperwork and performance reporting, and provide automated rebalancing and tax management at the household level. For example, income-generating securities (e.g. bonds) may be strategically located in your tax-deferred account while others (e.g. equities) may be located in a taxable account in order to improve your after-tax returns.
Historically, the UMH approach has been available only to ultra-high-net-worth clients and family offices with sufficient assets (greater than $25m) to compensate bank trust departments or private client service divisions for the labor intensive process necessary to deliver this level of service.
Providing operationally scalable customization capability with an active tax-managed overlay across an entire household requires a fully integrated system of technology. By partnering with GeoWealth, Frontier has leveraged the latest in managed account technology to provide UMH services to all of our clients.
Mutual Fund SMA MSP UMA UMH
Portfolio Diversification
Individual Security Ownership X
Eliminates Style Drift X X
Tax Efficient Portfolio management X X
Personalized Investment Portfolio X SOMETIMES
Customization Ability X SOMETIMES SOMETIMES
Consolidated Account Reporting X
Product Diversification within Individual Accounts X X X
Holistic Asset Allocation Across Multiple accounts X X X X
Multiple Goals within a Household X X X X
Tax Efficient Asset Location (Qualified vs. Non-qualified Accounts)
X X X LIMITED
Automated Rebalancing Across the Household X X X LIMITED
Consolidated Household Reporting X X X LIMITED
21
THE BOTTOM LINE FOR THE INVESTOR…
While any of these solutions could play a part in your portfolio, only the UMH coordinates rebalancing, tax management, and asset location across multiple custodians, qualified and non-qualified accounts and your entire family household.
The UMH builds on the UMA, leveraging technology to aggregate accounts and value added services at a level previously available only to ultrahigh net worth clients.

PREPARED BY: FRONTIER WEALTH MANAGEMENT 03/26/2013
22

PREPARED BY: FRONTIER WEALTH MANAGEMENT 03/26/2013
INVESTMENT POLICY STATEMENT
SUMMARY
This Investment Policy Statement (IPS) summarizes the understanding between you and Frontier Wealth Management (FWM) of the investment objectives, goals and guidelines for your investment management accounts. The IPS serves as guidance for management of your assets and is designed to be flexible to respond to changing business and market conditions.
FWM will manage your assets to meet the objectives outlined in this document. We will provide you with timely reporting of current holdings and portfolio performance. You should review this document periodically and promptly discuss any modifications with FWM.
DUTIES AND RESPONSIBILITIES
FWM will make investments consistent with the safeguards and diversification standards to which a prudent investor would adhere. To the extent provided in the Investment Management Agreement (IMA), FWM and GeoWealth Management have full investment discretion consistent with your investment objectives and guidelines. Any sub-manager, such as GeoWealth Management, shall have full discretion to purchase and sell securities and to maintain and deploy cash to assure full flexibility in the management of your assets.
ADVISOR RESPONSIBILITIES
1. Designing and implementing an appropriate asset allocation plan consistent with the investment objectives, time horizon, risk profile, guidelines and constraints outlined in this IPS.
2. Recommending an appropriate custodian to safeguard your assets.
3. Advising you about the selection and the allocation of asset categories.
4. Identifying specific assets and investment vehicles within each asset category.
5. Ensuring that the custodian provides you with a current prospectus, where applicable, for each investment proposed for your portfolio.
6. Monitoring the performance of all selected assets.
7. Recommending changes to this investment proposal.
8. Reviewing periodically the suitability of the investments for you.
9. Exercising proxy-voting rights.
10. Being available to discuss your comments and concerns, at your request, within reasonable periods.
YOUR RESPONSIBILITIES
1. Oversee your portfolio
2. Define your portfolio objectives and policies and communicate them to your advisor.
3. Direct your Advisor to make changes in the investment proposal.
4. Oversee and either approve or disapprove your Advisor’s recommendations regarding policy, guidelines and objectives, and to communicate these on a timely basis.
5. Provide your Advisor with all relevant information on your financial condition and risk tolerance, and promptly notify your Advisor of any changes to this information.
6. Read and understand the information contained in the prospectus for each applicable investment.
MULTIPLE STRATEGIES
Because of the complex nature of today’s financial marketplace, Frontier Wealth Management and GeoWealth Management maintain that using multiple investment strategies is vital in consistently achieving steady, long-term results. The combination of different investment styles, geographic focus and capitalization segments allows you to benefit from market strengths while protecting you from the negative effects of market weaknesses.
ALTERNATIVE INVESTMENTS
Alternative investments are speculative and involve a high degree of risk. Alternative investment risk factors will be evaluated for each investment, and these investments are appropriate only for accredited investors who have substantial financial resources and no need for near-term liquidity in the investment.
23

PREPARED BY: FRONTIER WEALTH MANAGEMENT 03/26/2013
INVESTMENT REPORTING AND REVIEW
Your investment performance results will be measured quarterly. Each investment strategy within the portfolio typically will be compared to a commonly accepted index of
performance. We will measure the extent to which your investment results are consistent with your objectives and goals as defined in this IPS.
In addition, your Advisor will meet with you at least annually to review and explain your portfolio’s investment results and to discuss any related issues.
Please immediately inform your Advisor, in writing, of any material changes in your financial situation and/or investment objectives, which could affect the investment of your assets.
FEES
The IMA sets for the Program Fee for each strategy in your investment portfolio. In addition, mutual funds and index funds charge separate fees for investing. Please see the applicable prospectus or related disclosure document for information regarding these fees.
Advisory fees may change over time to reflect changes in Sub-Managers (if applicable), the amount of assets in your portfolio, the amount allocated to particular Sub-Managers (if applicable) and investment performance.
IMPORTANT DISCLOSURES AND REMINDERS
1. IMPORTANT: The projections or other information contained in this proposal or other documents provided to you regarding the likelihood of various investment outcomes are hypothetical in nature, do not reflect actual investment results and are not guarantees of future results.
2. Different types of investments involve carrying degrees of risk, and past performance may not be indicative of future results.
3. You should not assume that future performance of any specific investment or investment strategy (including recommendations in this proposal) will be profitable.
4. Results may vary over time and from client to client, with each use of each investment or with each mix of investments.
5. Historical performance results for investment indices and/or categories are provided for general comparison purposes only, and generally do not reflect the deduction
of transaction and/or custodial charges, investment management fees, or the impact of taxes, all of which would have the effect of decreasing historical performance results. You should not assume that your account holdings will correspond directly to any of the indices.
6. There may be other investments not considered in either the analysis or recommendations of this proposal that may have characteristics similar or superior to those we have analyzed.
7. Please remember to contact your advisor immediately, in writing, if there are any changes in your financial situation or investment objectives, or if you wish to impose, add or modify any reasonable restrictions to your investment management services.
ACKNOWLEDGMENT
I hereby affirm that the information contained in this Investment Proposal accurately reflects and describes my/our investment objectives and goals. I further acknowledge that I have thoroughly reviewed the investor profile information, and that the information is correct.
I have reviewed the risk factors and the written disclosure and acknowledgment of the speculative nature, lack of liquidity and potential conflicts of interest related to alternative investments.
It is my intention to review these policies formally with my Advisor at least annually to reaffirm their continued relevancy, or to revise them as appropriate. Either the Advisor or I may suggest revisions at any time if it is in my best interests.
With my signature below, I acknowledge that I have received the Investment Management Agreement, which I have agreed to, and that I approve the terms and conditions within that agreement. I approve of these policies, and I understand that my Advisor approves of them, as well.
24

PREPARED BY: FRONTIER WEALTH MANAGEMENT 03/26/2013
QUESTIONNAIRE
INVESTMENT OBJECTIVE: GROWTH OF CAPITALGROWTH OF CAPITAL [EXTENDED] WITH PRODUCTS
QUESTION 1 OF 15: WHAT IS YOUR INITIAL INVESTMENT AMOUNT(THE MINIMUM INVESTMENT IS $2,000) Answer: $750,000.00
QUESTION 2 OF 15: WHAT IS YOUR INVESTMENT TIME HORIZON?○ 1. Up to 2 years.
○ 2. Up to 4 years.
○ 3. Up to 7 years.
○ 4. Up to 10 years.
● 5. Up to 15 years.
○ 6. More than 15 years.
QUESTION 3 OF 15: HOW LIKELY WILL YOU NEED TO WITHDRAW A SIGNIFICANT PORTION OF THESE ASSETS TO PAY FOR ONGOING LIVING EXPENSES PRIOR TO THE INVESTMENT TIME HORIZON?○ 1. Likely
● 2. Unlikely
QUESTION 4 OF 15: WHAT IS YOUR EMPLOYMENT SITUATION?● 1. Employed
○ 2. Student
○ 3. Retired
○ 4. Unemployed
QUESTION 5 OF 15: WHAT IS YOUR APPROXIMATE NET WORTH?○ 1. Up to $24,999.99
○ 2. Between $25,000.00 and $49,999.99
○ 3. Between $50,000.00 and $99,999.99
○ 4. Between $100,000.00 and $249,999.99
○ 5. Between $250,000.00 and $499,999.99
○ 6. Between $500,000.00 and $999,999.99
○ 7. Between $1,000,000.00 and $1,999,999.99
● 8. More than $2,000,000.00
QUESTION 6 OF 15: WHAT IS YOUR LIQUID NET WORTH?○ 1. Up to $24,999.99
○ 2. Between $25,000.00 and $49,999.99
○ 3. Between $50,000.00 and $99,999.99
○ 4. Between $100,000.00 and $249,999.99
○ 5. Between $250,000.00 and $499,999.99
○ 6. Between $500,000.00 and $999,999.99
○ 7. Between $1,000,000.00 and $1,999,999.99
● 8. More than $2,000,000.00 (8)
QUESTION 7 OF 15: WHAT IS THE LEVEL OF YOUR ANNUAL INCOME?○ 1. Up to $24,999.99
○ 2. Between $25,000.00 and $49,999.99
○ 3. Between $50,000.00 and $99,999.99
○ 4. Between $100,000.00 and $249,999.99
● 5. More than $250,000.00
QUESTION 8 OF 15: WHAT IS YOUR BIRTH DATE?Answer: 01/01/1960
QUESTION 9 OF 15: CONSIDERING THE RISK / RETURN TRADE-OFF FOR AN INVESTMENT, WHAT SCENARIO BEST DESCRIBES YOU?○ 1. The risk is the most important factor.
○ 2. The risk is more important than the potential rate of return (ROR).
○ 3. The risk and the potential ROR are equally important.
● 4 The potential ROR is more important than risk.
○ 5. ROR is the most important factor.
QUESTION 10 OF 15: IF THE STOCK MARKET WERE TO DROP 25% IN VALUE OVER 3 MONTHS, AND ONE OF YOUR STOCKS DID THE SAME, WHAT WOULD YOU DO WITH YOUR SHARES?○ 1. Sell them immediately.
○ 2. Sell a portion of them.
○ 3. Hold them, the market and my stock value will turn around soon.
● 4. Consider additional purchase.
○ 5. Definitely purchase more shares.
25

PREPARED BY: FRONTIER WEALTH MANAGEMENT 03/26/2013
QUESTION 11 OF 15: THE FOLLOWING GRAPH ILLUSTRATES 5 HYPOTHETICAL PORTFOLIOS AND THEIR RANGE OF PROBABLE RORS OVER ONE YEAR PERIOD. WHICH PORTFOLIO WOULD YOU BE MOST COMFORTABLE INVESTING IN?
○ 1. Portfolio A.
○ 2. Portfolio B.
○ 3. Portfolio C.
● 4. Portfolio D.
○ 5. Portfolio E.
QUESTION 12 OF 15: WHAT DEVIATIONS IN THE PERFORMANCE OF YOUR INVESTMENTS COMPARED TO AN APPROPRIATE BENCHMARK ARE ACCEPTABLE FOR YOU?○ 1. Even the smallest deviations are bothersome for me
○ 2. Infrequent and small deviations would be tolerable.
● 3. Some deviations would be tolerable as long as such deviations are acceptable for the type of investment.
○ 4. Frequent material deviations would be tolerable as long as such deviations are acceptable for the type of investment.
○ 5. Even big deviations would not bother me as long as such deviations are acceptable for the type of investment.
QUESTION 13 OF 15: HOW OFTEN WOULD YOU REVIEW YOUR INVESTMENTS?○ 1. Frequently regardless of market conditions.
○ 2. I would monitor them closely during market turmoil.
○ 3. Sometimes when time permits.
● 4. Seldom.
○ 5. Only when a review is scheduled and initiated by the financial advisor.
QUESTION 14 OF 15: HAVE YOU EVER INVESTED IN INDIVIDUAL STOCKS, BONDS OR MUTUAL FUNDS?○ 1. No, because I feel uncomfortable with the risk.
○ 2. No, but I am comfortable to do so.
● 3. Yes, I have a little experience investing, but risk makes me uncomfortable.
○ 4. Yes, I have a little experience investing, and I am comfortable with the risk.
○ 5. Yes, I have a lot of experience investing in the market.
QUESTION 15 OF 15: EXTRA PRODUCTS
Product Investment Amount
GeoWealth Stable Return Model $250,000.00
26