web tables—public career and technical education high
TRANSCRIPT
WEB TABLES U.S. DEPARTMENT OF EDUCATION JUNE 2012 NCES 2012-250
Public Career and Technical Education
High Schools, Principals, and Teachers in 2008
This report was prepared for the National Center for Education Statistics under Contract No. ED-07-CO-0104 with MPR Associates, Inc. Mention of trade names, commercial products, or organizations does not imply endorsement by the U.S. Government. These Web Tables were authored by Xianglei Chen and Joanna Wu of MPR Associates, Inc. The NCES Project Officer was Matthew Soldner. For questions about content or to view this report online, go to http://nces.ed.gov/pubsearch/pubsinfo.asp?pubid=2012250.
Career and technical education (CTE) is
a part of most public high school stu
dents’ educational experiences in the
United States. The vast majority of U.S.
public high schools offer their students
at least one CTE program or course, and
nearly all public school graduates take
at least one CTE course either in their
school, at an area/regional CTE school,
or in a full-time CTE school1 (Levesque
et al. 2008). As of 2008, some 36 states
included some CTE education in their
high school graduation requirements,
and 12 states offered students the
opportunity to earn a career/technical
diploma or endorsement.2
The National Center for Education Sta
tistics (NCES) has published numerous
reports describing CTE offerings and
students’ participation in high school
(e.g., Hudson and Laird 2009; Levesque
2003; Levesque et al. 2008; Levesque,
Wun, and Green 2010). In addition,
NCES has published a series of Web
Tables presenting the latest data on
the condition of CTE nationwide, in
cluding information on the CTE
delivery system and its offerings,
trends in CTE coursetaking, characteris
tics of CTE participants, and the
teachers who deliver the CTE curricu
lum in grades 9–12.3 Using data from
the 2007−08 Schools and Staffing
Survey (SASS:08), the Web Tables pre
sented here expand previous NCES
Web Tables on CTE by providing new
information on CTE high schools, job
satisfaction of principals and teachers
in CTE schools, their views on working
conditions, and CTE teachers’ profes
sional development needs. The
following summarizes the information
presented in each of the 12 Web Tables.
Tables 1 to 7 compare CTE high schools
with other types of public high schools
in terms of the school’s class organiza
tion, student composition, locale,
special admission policies, occupation
al preparation opportunities, and
student-to-counselor ratios. Specifical
ly, table 1 indicates the percentage of
all public high schools that are CTE
schools. In addition, it provides infor
mation about whether the school is a
charter school and whether the entire
school serves dropouts or potential
dropouts. Table 2 examines various
methods that schools use to organize
their classes and students. Tables 3 and
4 present information about student-
body composition and school locale;
table 5 presents data on special re
quirements that schools use for
admission; table 6 looks at the occupa
tional preparation opportunities schools
offer their students; and table 7 shows
the ratios of students to counselors.
Table 8 provides principals’ satisfaction
with their job, faculty, and school dis
trict. Tables 9 to 12 focus on public
school teachers in grades 9–12, group
ing them based on their main teaching
assignment: those who primarily
taught occupational education, those
who taught academic subjects, and
those who taught enrichment or other
subjects. Occupational education
teachers consist of teachers who pri
marily taught any of the following
occupational subjects: agriculture and
natural resources; business; communi
cations and design; computer and
information sciences; construction,
architecture, and engineering technol
ogies; consumer, culinary, and public
services; health sciences; manufactur
ing; marketing; and repair and
transportation.4
Specifically, table 9 presents the distri
bution of occupational education,
academic, and enrichment/other
teachers in different types of public
high schools. Tables 10 and 11 show
the professional development priori
ties of occupational education,
academic, and enrichment/other
teachers, the extent to which they par
ticipate in professional development
on the subject(s) they teach, the length
of such participation, and how useful
they think this professional training is.
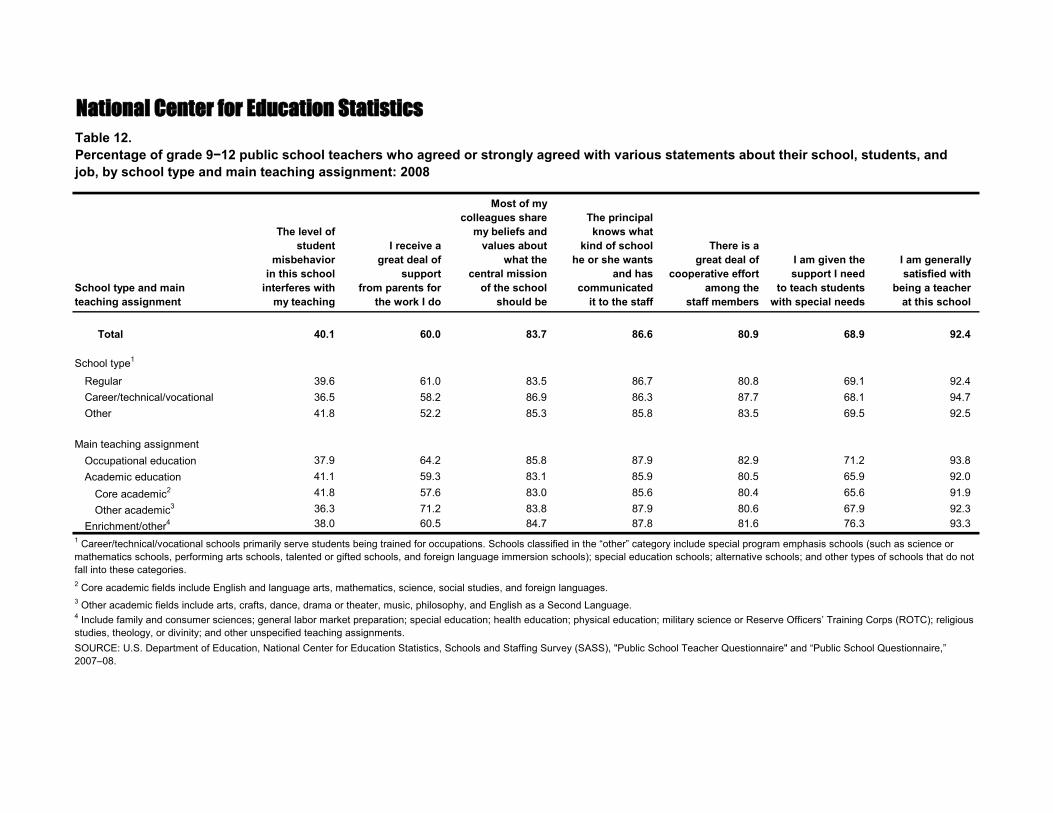
Table 12 presents occupational educa
tion, academic, and enrichment/other
teachers’ views on school conditions
and their overall satisfaction with
teaching at their school.
RELATED NCES REPORTS Web Tables—Public High School
Teachers of Career and Technical
Education in 2007−08 (NCES 2011-235).
http://nces.ed.gov/pubsearch/
pubsinfo.asp?pubid=2011235
DATA The estimates presented in these ta
bles were generated from the NCES
2007–08 Schools and Staffing Survey
(SASS:08). SASS:08 is a nationally repre
sentative sample survey of public,
private, and Bureau of Indian Educa
tion (BIE)-funded K–12 schools,
principals, and teachers in the 50 states
and the District of Columbia. These ta
bles use data from public high schools,
principals, and grade 9–12 teachers.
The SASS:08 public school sample is a
stratified probability-proportionate-to
size (PPS) sample, which allows ana
lysts to produce national-, regional-,
and state-level elementary, secondary,
and combined public school estimates.
The target population of the public
school sample includes all regular;
nonregular (special education, alterna
tive, vocational/technical); public
charter; and BIE schools. The SASS:08
public school sample consists of about
9,800 public schools (including both
traditional public and public charter
schools) and 180 BIE schools. BIE
schools were excluded from the data
analyses to produce these Web Tables.
About 3,500 public high schools (iden
tified by having grade 12) and 3,300
public high school principals were in
the data analyses for these Web Tables.
The SASS:08 teacher sample was drawn
from teacher rosters at sampled
schools. The target population of the
teacher sample includes all staff who
teach regularly scheduled classes to
students in any of grades K–12. Ap
proximately 47,400 teachers were
sampled from public schools, and
about 20,500 public school grade 9–12
teachers were included in the data
analyses for these Web Tables.
For an overview of the survey
methodology used, see Documentation
for the 2007–08 Schools and Staffing
Survey (http://nces.ed.gov/pubsearch/
pubsinfo.asp?pubid=2010332).
2
3
Continued on next page.
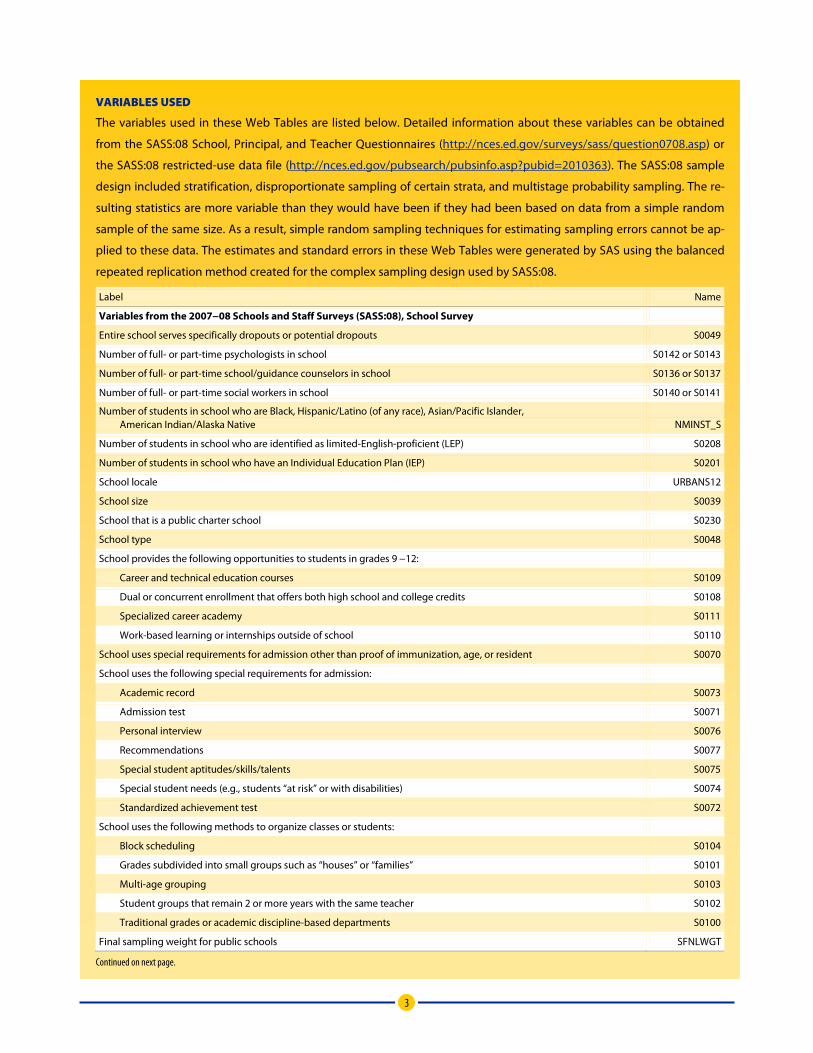
VARIABLES USED
The variables used in these Web Tables are listed below. Detailed information about these variables can be obtained
from the SASS:08 School, Principal, and Teacher Questionnaires (http://nces.ed.gov/surveys/sass/question0708.asp) or
the SASS:08 restricted-use data file (http://nces.ed.gov/pubsearch/pubsinfo.asp?pubid=2010363). The SASS:08 sample
design included stratification, disproportionate sampling of certain strata, and multistage probability sampling. The re
sulting statistics are more variable than they would have been if they had been based on data from a simple random
sample of the same size. As a result, simple random sampling techniques for estimating sampling errors cannot be ap
plied to these data. The estimates and standard errors in these Web Tables were generated by SAS using the balanced
repeated replication method created for the complex sampling design used by SASS:08.
Label Name
Variables from the 2007−08 Schools and Staff Surveys (SASS:08), School Survey
Entire school serves specifically dropouts or potential dropouts S0049
Number of full- or part-time psychologists in school S0142 or S0143
Number of full- or part-time school/guidance counselors in school S0136 or S0137
Number of full- or part-time social workers in school S0140 or S0141
Number of students in school who are Black, Hispanic/Latino (of any race), Asian/Pacific Islander, American Indian/Alaska Native NMINST_S
Number of students in school who are identified as limited-English-proficient (LEP) S0208
Number of students in school who have an Individual Education Plan (IEP) S0201
School locale URBANS12
School size S0039
School that is a public charter school S0230
School type S0048
School provides the following opportunities to students in grades 9 −12:
Career and technical education courses S0109
Dual or concurrent enrollment that offers both high school and college credits S0108
Specialized career academy S0111
Work-based learning or internships outside of school S0110
School uses special requirements for admission other than proof of immunization, age, or resident S0070
School uses the following special requirements for admission:
Academic record S0073
Admission test S0071
Personal interview S0076
Recommendations S0077
Special student aptitudes/skills/talents S0075
Special student needs (e.g., students “at risk” or with disabilities) S0074
Standardized achievement test S0072
School uses the following methods to organize classes or students:
Block scheduling S0104
Grades subdivided into small groups such as “houses” or “families” S0101
Multi-age grouping S0103
Student groups that remain 2 or more years with the same teacher S0102
Traditional grades or academic disc ipline-based departments S0100
Final sampling weight for public schools SFNLWGT

VARIABLES USED—Continued
Label Name
Variables from the 2007−08 Schools and Staff Surveys (SASS:08), Principal Survey
To what extent do you agree or disagree with each of the following statements:
I do not seem to have as much enthusiasm now as I did when I began my career as a principal A0234
I like the way things are run in this district A0231
I think about staying home from school because I am just too tired to go A0235
I think about transferring to another school A0233
If I could get a higher paying job, I’d leave education as soon as possible A0232
The faculty and staff at this school like being here; I would describe them as a satisfied group A0230
The stress and disappointment involved in serving as principal at this school are not worth it A0229
Final sampling weight for public school principals AFNLWGT
Variables from the 2007−08 Schools and Staff Surveys (SASS:08), Teacher Survey
To what extent do you agree or disagree with each of the following statements:
I am generally satisfied with being a teacher at this school T0302
I am given the support I need to teach students with special needs T0300
I receive a great deal of support from parents for the work I do T0289
Most of my colleagues share my beliefs and values about the central mission of the school T0294
The level of student misbehavior in this school interferes with my teaching T0288
The principal knows what kind of school he/she wants and has communicated it to the staff T0295
There is a great deal of cooperative effort among the staff members T0296
First priority for future professional development T0231
Length of participation in professional development in subject area T0235
Main teaching assignment T0067
Participation in professional development in subject area in past 12 months T0234
Usefulness of professional development in subject area T0236
Final sampling weight for public school teachers TFNLWGT
REFERENCES Hudson, L., and Laird, J. (2009). New Indi
cators of High School Career/Technical Education Coursetaking: Class of 2005 (NCES 2009-038). National Center for Education Statistics, Institute of Education Sciences, U.S. Department of Education. Washington, DC.
Levesque, K. (2003). Trends in High School Vocational/Technical Coursetaking: 1982–1998 (NCES 2003-025). National Center for Education Statistics, Institute of Education Sciences, U.S. Department of Education. Washington, DC.
Levesque, K., Laird, J., Hensley, E., Choy, S.P., Cataldi, E.F., and Hudson, L. (2008). Career/Technical Education in the United States: 1990 to 2005 (NCES 2008-035). National Center for Education Statistics, Institute of Education Sciences, U.S. Department of Education. Washington, DC.
Levesque, K., Wun, J., and Green, C. (2010). Science Achievement and Occupational Career/Technical Education Coursetaking in High School: The Class of 2005 (NCES 2010-021). National Center for Education Statistics, Institute
of Education Sciences, U.S. Department of Education. Washington, DC.
Silverberg, M., Warner, E., Fong, M., and Goodwin, D. (2004). National Assessment of Vocational Education: Final Report to Congress. U.S. Department of Education. Washington, DC: Office of the Under Secretary, Policy and Program Studies Service.
A Section 508-compliant version of
these Web Tables is available at
http://nces.ed.gov/pubsearch/
pubsinfo.asp?pubid=2012250.
4

ENDNOTES 1 Career and technical education is typically provided in three main settings at the high school level: comprehensive high schools, full-time CTE high schools, and area or regional CTE schools serving multiple high schools (Silverberg et al. 2004). Comprehensive high schools typically have an academic focus, but also offer CTE either on or off site, the latter often at an area CTE school. Full-time CTE high schools emphasize CTE but also offer academic coursework; students typically spend their entire school day at the school. Area CTE schools provide CTE part time to students who receive all or most of their academic instruction at their home high school (Levesque et al. 2008).
2 These states have one or more of the following CTE-related components in their graduation requirements: (1) CTE courses are a required option for all students (i.e., students must choose between CTE and another course option [usually foreign language or arts] to meet graduation requirements); (2) students may substitute an approved CTE course for a standard core course to meet high school graduation requirements; and (3) all students must complete a career concentration/ major/sequence. The complete list of states that had CTE-related requirements for high school graduation in 2008 is available on the Education Commission of the States website at http://mb2.ecs.org/reports/Report.aspx?id=1898.
3 These Web Tables are available on the NCES CTE Statistics website at http://nces.ed.gov/surveys/ctes/tables/ index.asp?LEVEL=SECONDARY. 4 In past NCES reports, CTE teachers generally included three groups: those who taught family and consumer sciences education (which focuses on preparing students for adult roles outside the paid labor market); those who taught general labor market preparation (which focuses on general employment skills used across a wide range of occupational areas, such as keyboarding and word processing); and those who taught occupational education (which focuses on skills required in a specific occupation or occupational cluster). This set of Web Tables focuses on occupational education teachers and combines those who taught family/consumer sciences education and general labor market preparation with enrichment/other teachers.
5

National Center for Education Statistics Table 1. Percentage distribution of various types of public high schools, and percentage of public high schools that were charter schools or that served entirely dropouts or potential dropouts, by school type: 2008
Public high school that Was a charter Served entirely dropouts
School type Total school or potential dropouts1
Total 100.0 5.6 13.0
School type2
Regular 67.5 2.7 1.2 Career/technical/vocational 3.7 ‡ ‡ Other 28.7 12.7 42.3
‡ Reporting standards not met. 1 Potential dropouts are those who have been suspended, expelled, or referred for behavioral or adjustment problems. 2 Career/technical/vocational schools primarily serve students being trained for occupations. Schools classified in the “other” category include special program emphasis schools (such as science or mathematics schools, performing arts schools, talented or gifted schools, and foreign language immersion schools); special education schools; alternative schools; and other types of schools that do not fall into these categories. NOTE: Detail in the first column may not sum to total because of rounding. High schools are defined as those that have grade 12 or those with no grade lower than 7 and at least one grade higher than 8 if they do not have grade 12. SOURCE: U.S. Department of Education, National Center for Education Statistics, Schools and Staffing Survey (SASS), “Public School Questionnaire,” 2007–08.
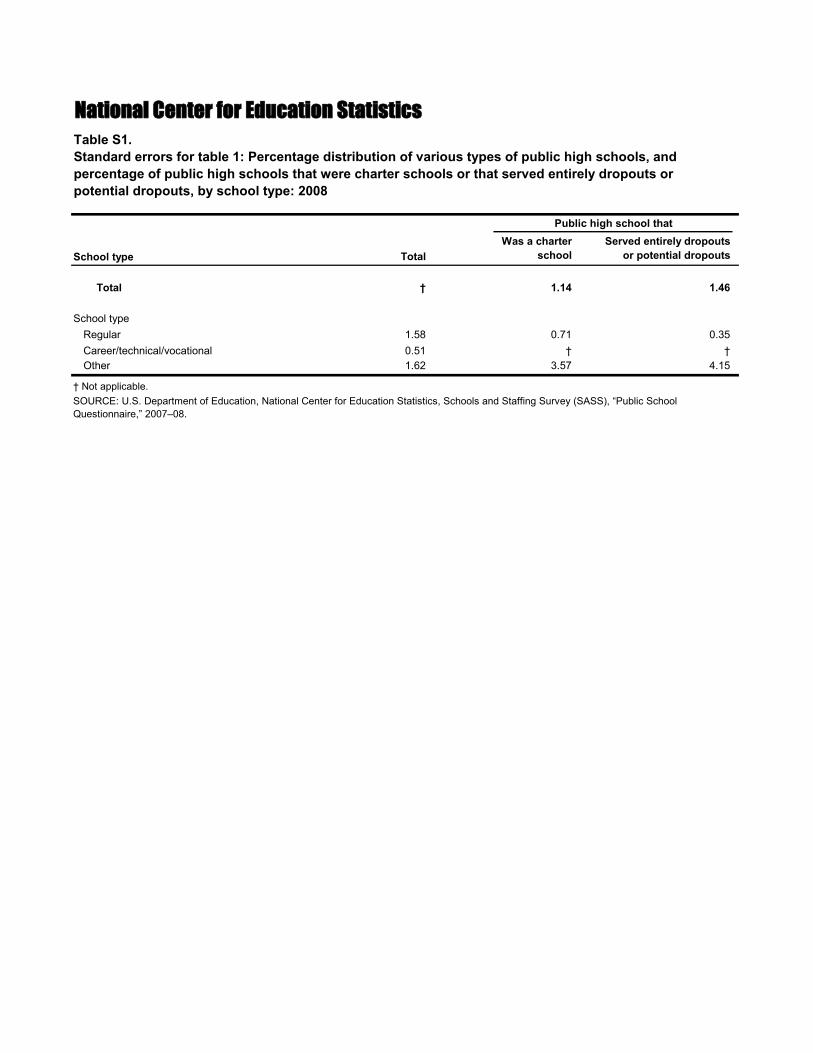
National Center for Education Statistics Table S1. Standard errors for table 1: Percentage distribution of various types of public high schools, and percentage of public high schools that were charter schools or that served entirely dropouts or potential dropouts, by school type: 2008
Public high school that Was a charter Served entirely dropouts
School type Total school or potential dropouts
Total † 1.14 1.46
School type Regular 1.58 0.71 0.35 Career/technical/vocational 0.51 † † Other 1.62 3.57 4.15
† Not applicable. SOURCE: U.S. Department of Education, National Center for Education Statistics, Schools and Staffing Survey (SASS), “Public School Questionnaire,” 2007–08.
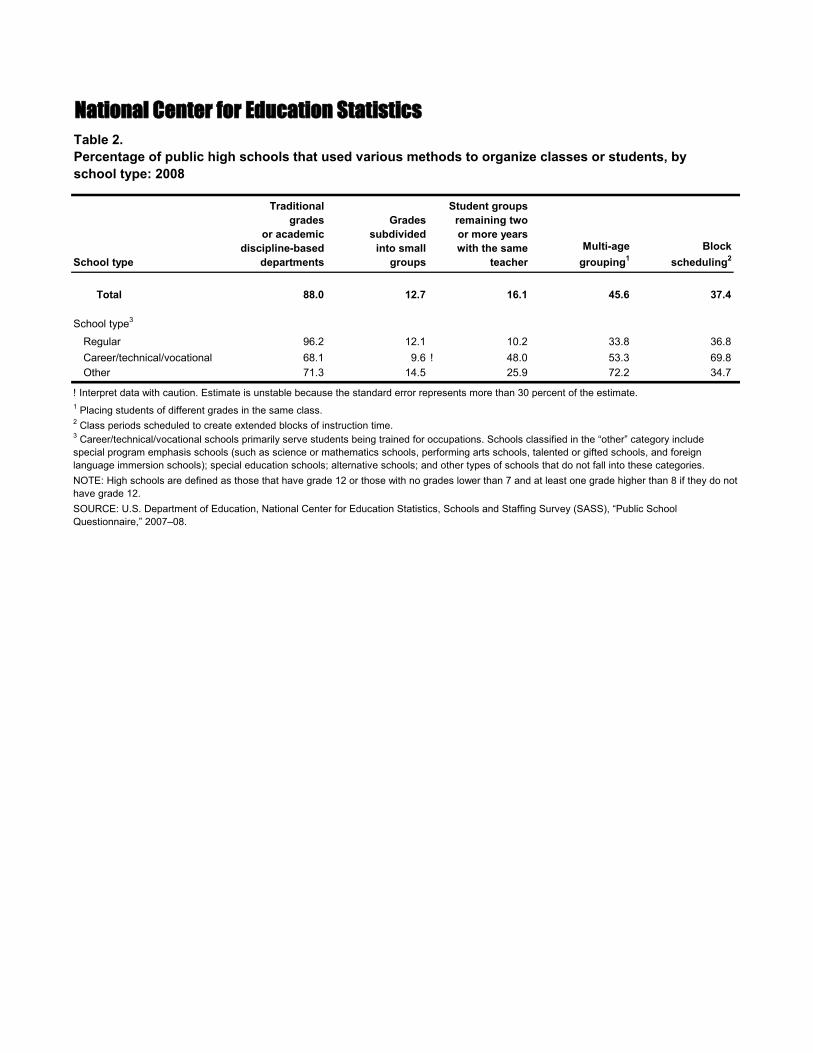
National Center for Education Statistics Table 2. Percentage of public high schools that used various methods to organize classes or students, by school type: 2008
School type
Traditional grades
or academic discipline-based
departments
Grades subdivided
into small groups
Student groups remaining two or more years with the same
teacher Multi-age
grouping1 Block
scheduling2
Total 88.0 12.7 16.1 45.6 37.4
School type3
Regular Career/technical/vocational Other
96.2 68.1 71.3
12.1 9.6 !
14.5
10.2 48.0 25.9
33.8 53.3 72.2
36.8 69.8 34.7
! Interpret data with caution. Estimate is unstable because the standard error represents more than 30 percent of the estimate. 1 Placing students of different grades in the same class. 2 Class periods scheduled to create extended blocks of instruction time. 3 Career/technical/vocational schools primarily serve students being trained for occupations. Schools classified in the “other” category include special program emphasis schools (such as science or mathematics schools, performing arts schools, talented or gifted schools, and foreign language immersion schools); special education schools; alternative schools; and other types of schools that do not fall into these categories. NOTE: High schools are defined as those that have grade 12 or those with no grades lower than 7 and at least one grade higher than 8 if they do not have grade 12. SOURCE: U.S. Department of Education, National Center for Education Statistics, Schools and Staffing Survey (SASS), “Public School Questionnaire,” 2007–08.
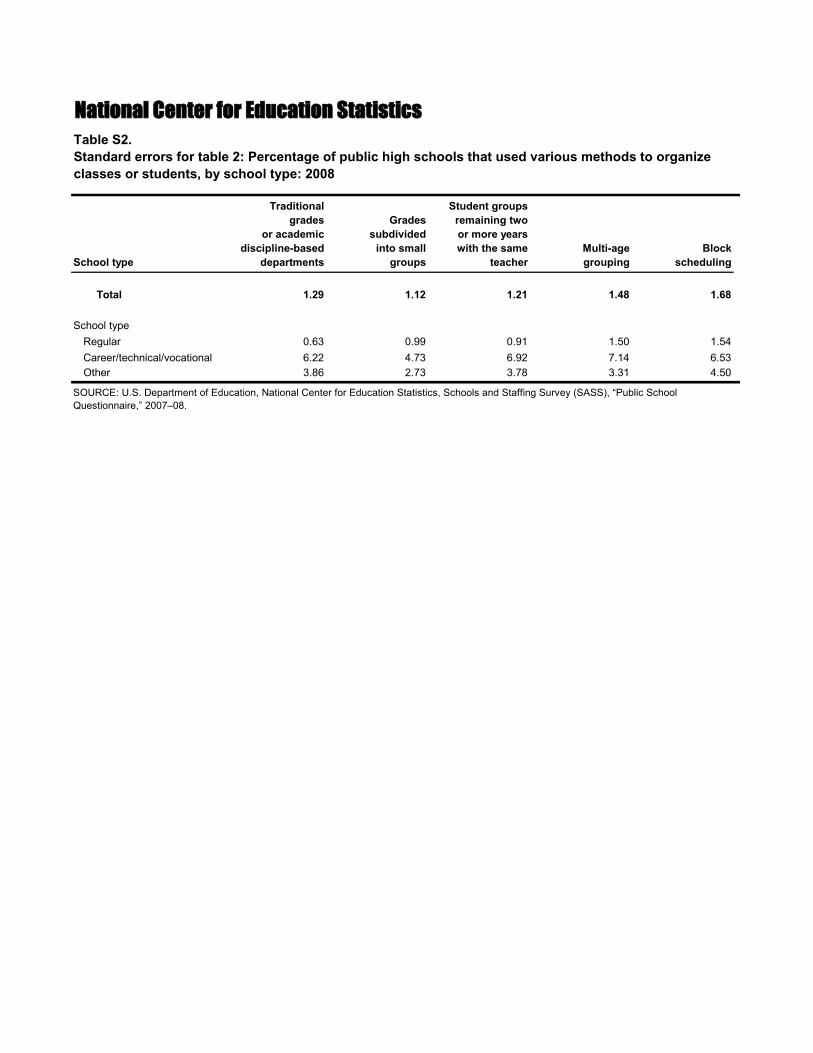
National Center for Education Statistics Table S2. Standard errors for table 2: Percentage of public high schools that used various methods to organize classes or students, by school type: 2008
School type
Traditional grades
or academic discipline-based
departments
Grades subdivided
into small groups
Student groups remaining two or more years with the same
teacher Multi-age grouping
Block scheduling
Total 1.29 1.12 1.21 1.48 1.68
School type Regular Career/technical/vocational Other
0.63 6.22 3.86
0.99 4.73 2.73
0.91 6.92 3.78
1.50 7.14 3.31
1.54 6.53 4.50
SOURCE: U.S. Department of Education, National Center for Education Statistics, Schools and Staffing Survey (SASS), “Public School Questionnaire,” 2007–08.
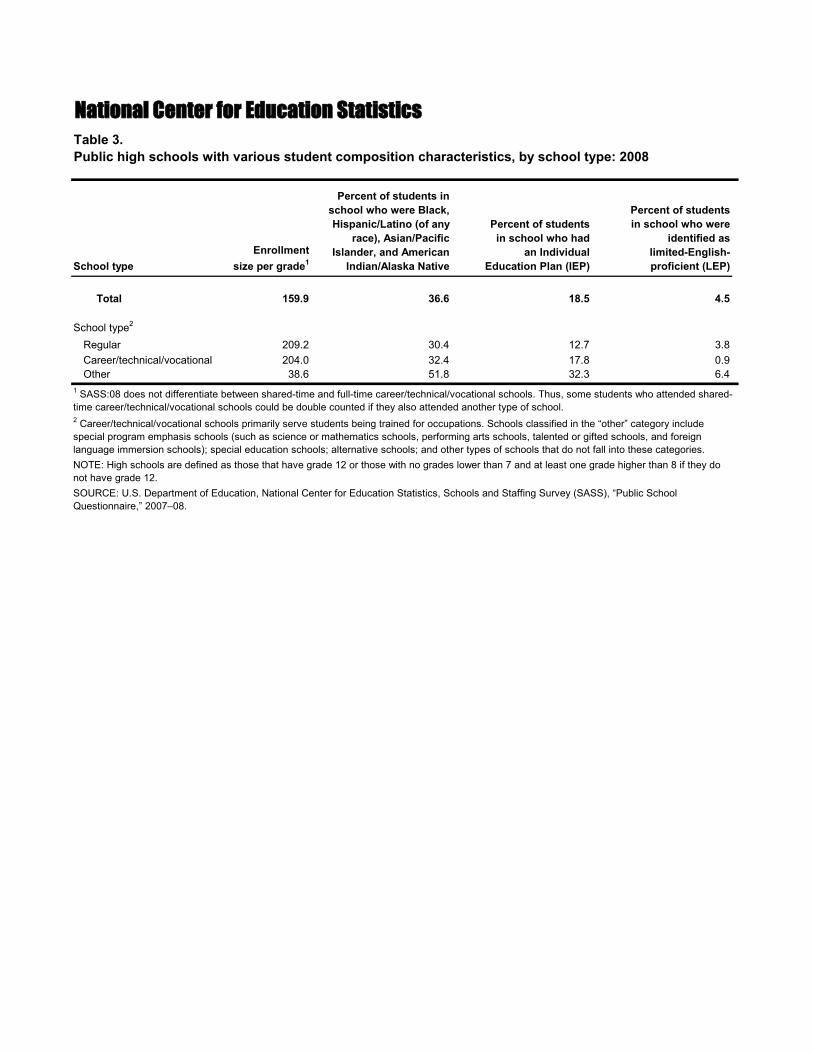
National Center for Education Statistics Table 3. Public high schools with various student composition characteristics, by school type: 2008
School type Enrollment
size per grade1
Percent of students in school who were Black, Hispanic/Latino (of any
race), Asian/Pacific Islander, and American
Indian/Alaska Native
Percent of students in school who had
an Individual Education Plan (IEP)
Percent of students in school who were
identified as limited-English-proficient (LEP)
Total 159.9 36.6 18.5 4.5
School type2
Regular Career/technical/vocational Other
209.2 204.0 38.6
30.4 32.4 51.8
12.7 17.8 32.3
3.8 0.9 6.4
1 SASS:08 does not differentiate between shared-time and full-time career/technical/vocational schools. Thus, some students who attended shared-time career/technical/vocational schools could be double counted if they also attended another type of school. 2 Career/technical/vocational schools primarily serve students being trained for occupations. Schools classified in the “other” category include special program emphasis schools (such as science or mathematics schools, performing arts schools, talented or gifted schools, and foreign language immersion schools); special education schools; alternative schools; and other types of schools that do not fall into these categories. NOTE: High schools are defined as those that have grade 12 or those with no grades lower than 7 and at least one grade higher than 8 if they do not have grade 12. SOURCE: U.S. Department of Education, National Center for Education Statistics, Schools and Staffing Survey (SASS), “Public School Questionnaire,” 2007–08.

National Center for Education Statistics Table S3. Standard errors for table 3: Public high schools with various student composition characteristics, by school type: 2008
School type Enrollment
size per grade
Percent of students in school who were Black, Hispanic/Latino (of any
race), Asian/Pacific Islander, and American
Indian/Alaska Native
Percent of students in school who had
an Individual Education Plan (IEP)
Percent of students in school who were
identified as limited-English-proficient (LEP)
Total 5.20 1.01 0.86 0.49
School type Regular Career/technical/vocational Other
5.35 28.52
5.34
1.04 4.15 2.70
0.27 2.09 2.71
0.40 0.21 1.41
SOURCE: U.S. Department of Education, National Center for Education Statistics, Schools and Staffing Survey (SASS), “Public School Questionnaire,” 2007–08.

National Center for Education Statistics Table 4. Percentage distribution of public high schools, by locale and school type: 2008
School type City Suburb/town Rural
Total 20.2 39.1 40.8
School type1
Regular 14.0 35.8 50.3 Career/technical/vocational 21.0 47.6 31.4 Other 34.6 45.7 19.7
1 Career/technical/vocational schools primarily serve students being trained for occupations. Schools classified in the “other” category include special program emphasis schools (such as science or mathematics schools, performing arts schools, talented or gifted schools, and foreign language immersion schools); special education schools; alternative schools; and other types of schools that do not fall into these categories. NOTE: Detail may not sum to totals because of rounding. High schools are defined as those that have grade 12 or those with no grades lower than 7 and at least one grade higher than 8 if they do not have grade 12. SOURCE: U.S. Department of Education, National Center for Education Statistics, Schools and Staffing Survey (SASS), “Public School Questionnaire,” 2007–08.
2008
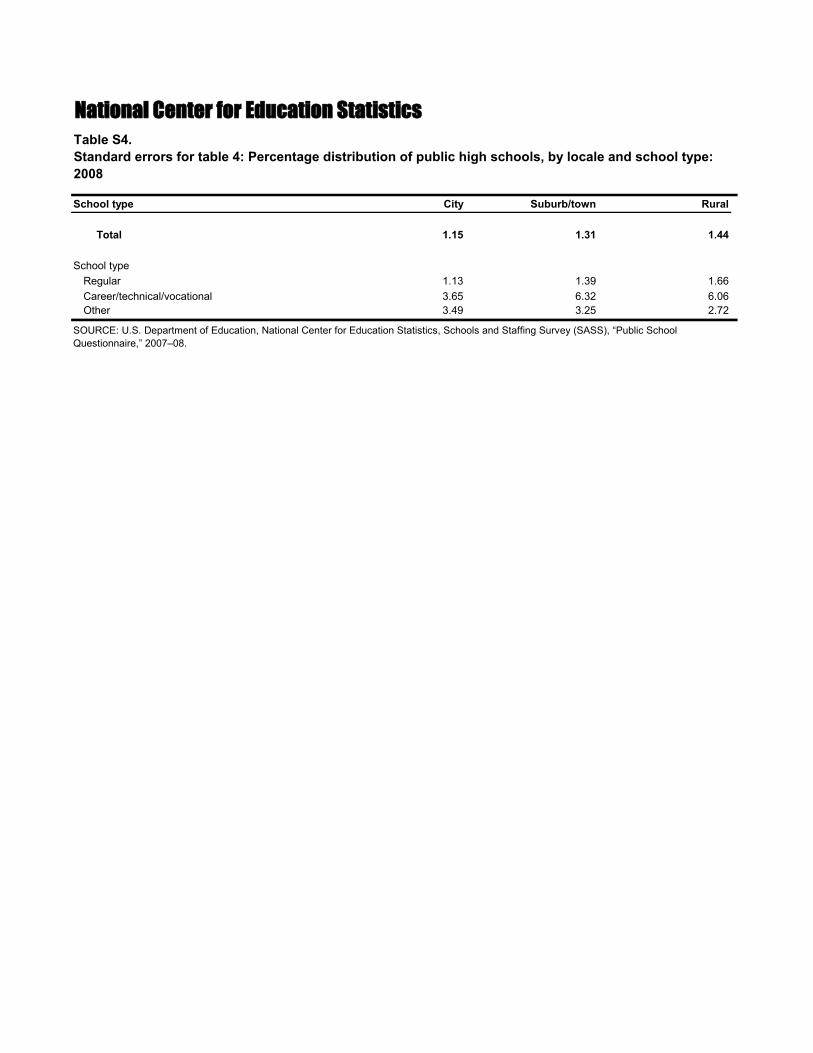
National Center for Education Statistics Table S4. Standard errors for table 4: Percentage distribution of public high schools, by locale and school type:
School type City Suburb/town Rural
Total 1.15 1.31 1.44
School type Regular 1.13 1.39 1.66 Career/technical/vocational 3.65 6.32 6.06 Other 3.49 3.25 2.72
SOURCE: U.S. Department of Education, National Center for Education Statistics, Schools and Staffing Survey (SASS), “Public School Questionnaire,” 2007–08.

National Center for Education Statistics Table 5. Percentage of public high schools that had special requirements for admission, by school type: 2008
Percent of schools requiring each of the following for admission Percent of Special
School type
schools with special admission
requirements1 Admission
test
Standardized achievement
test Academic
record Special student
needs2
aptitudes/ skills/
talents Personal interview
Recommen-dations
Total 31.5 2.5 3.8 16.9 18.7 5.2 11.6 12.9
School type3
Regular 14.3 0.9 ! 2.1 11.6 8.0 2.6 3.4 1.7 Career/technical/vocational 59.2 13.9 12.9 48.1 20.8 19.5 27.6 31.3 Other 68.2 4.8 6.5 25.2 43.5 9.7 28.7 36.9
! Interpret data with caution. Estimate is unstable because the standard error represents more than 30 percent of the estimate. 1 Requirements other than proof of immunization, age, or residence. 2 In SASS:08, students with special needs refer to those “at risk” or with mental, physical, or learning disabilities. 3 Career/technical/vocational schools primarily serve students being trained for occupations. Schools classified in the “other” category include special program emphasis schools (such as science or mathematics schools, performing arts schools, talented or gifted schools, and foreign language immersion schools); special education schools; alternative schools; and other types of schools that do not fall into these categories. NOTE: High schools are defined as those that have grade 12 or those with no grades lower than 7 and at least one grade higher than 8 if they do not have grade 12. SOURCE: U.S. Department of Education, National Center for Education Statistics, Schools and Staffing Survey (SASS), “Public School Questionnaire,” 2007–08.

National Center for Education Statistics Table S5. Standard errors for table 5: Percentage of public high schools that had special requirements for admission, by school type: 2008
School type
Percent of schools with
special admission requirements
Admission test
Percent of schools requiring each of the following for admission
Standardized achievement
test Academic
record Special student
needs
Special aptitudes/
skills/ talents
Personal interview
Recommen-dations
Total 1.39 0.50 0.63 1.02 1.22 0.69 1.18 1.10
School type Regular Career/technical/vocational Other
1.04 6.47 4.18
0.40 3.91 1.40
0.60 3.21 1.65
0.97 7.00 3.29
0.76 4.36 4.03
0.47 5.23 2.05
0.62 6.20 3.98
0.50 6.67 3.87
SOURCE: U.S. Department of Education, National Center for Education Statistics, Schools and Staffing Survey (SASS), “Public School Questionnaire,” 2007–08.
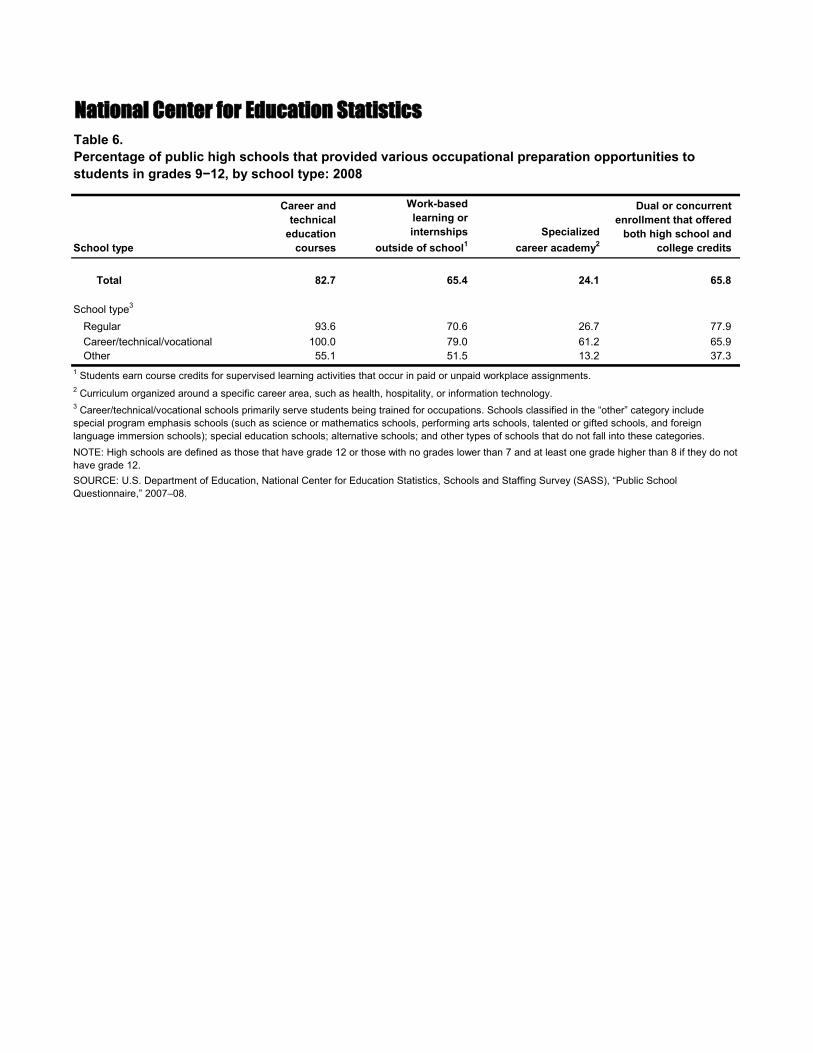
National Center for Education Statistics Table 6. Percentage of public high schools that provided various occupational preparation opportunities to students in grades 9−12, by school type: 2008
Career and Work-based Dual or concurrent technical learning or enrollment that offered
School type education
courses internships
outside of school1 Specialized
career academy2 both high school and
college credits
Total 82.7 65.4 24.1 65.8
School type3
Regular 93.6 70.6 26.7 77.9 Career/technical/vocational 100.0 79.0 61.2 65.9 Other 55.1 51.5 13.2 37.3
1 Students earn course credits for supervised learning activities that occur in paid or unpaid workplace assignments. 2 Curriculum organized around a specific career area, such as health, hospitality, or information technology. 3 Career/technical/vocational schools primarily serve students being trained for occupations. Schools classified in the “other” category include special program emphasis schools (such as science or mathematics schools, performing arts schools, talented or gifted schools, and foreign language immersion schools); special education schools; alternative schools; and other types of schools that do not fall into these categories. NOTE: High schools are defined as those that have grade 12 or those with no grades lower than 7 and at least one grade higher than 8 if they do not have grade 12. SOURCE: U.S. Department of Education, National Center for Education Statistics, Schools and Staffing Survey (SASS), “Public School Questionnaire,” 2007–08.
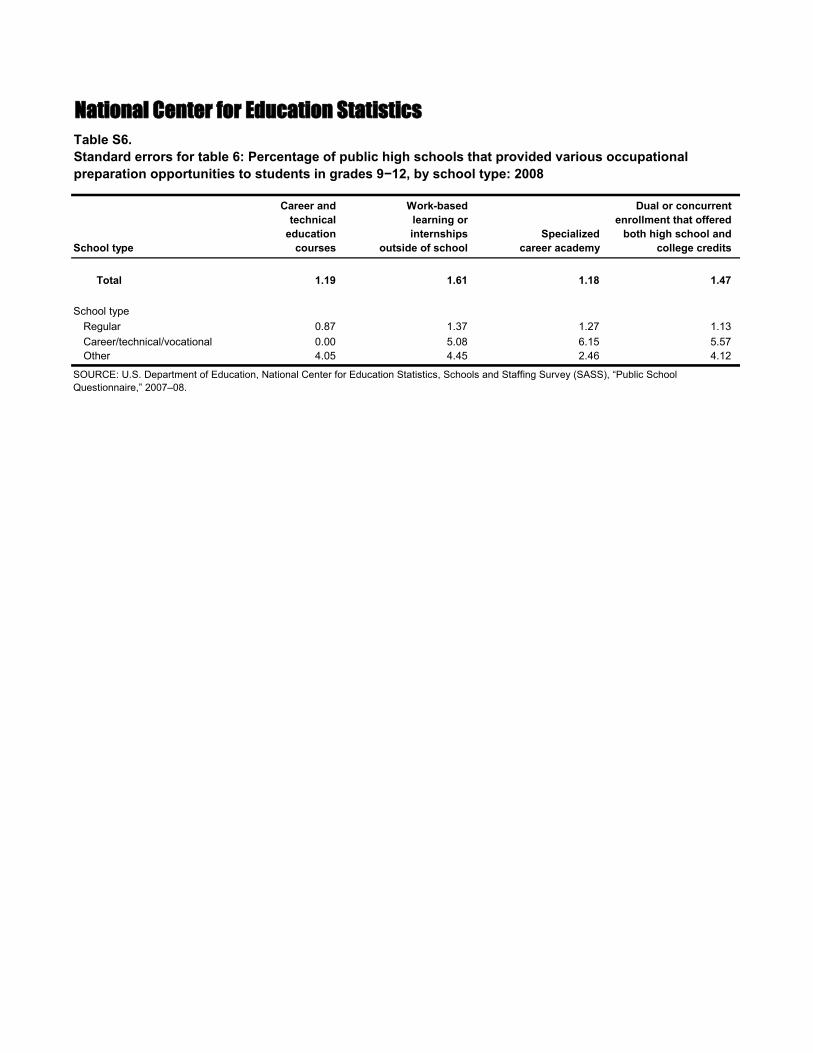
National Center for Education Statistics Table S6. Standard errors for table 6: Percentage of public high schools that provided various occupational preparation opportunities to students in grades 9−12, by school type: 2008
Career and Work-based Dual or concurrent technical learning or enrollment that offered
education internships Specialized both high school and School type courses outside of school career academy college credits
Total 1.19 1.61 1.18 1.47
School type Regular 0.87 1.37 1.27 1.13 Career/technical/vocational 0.00 5.08 6.15 5.57 Other 4.05 4.45 2.46 4.12
SOURCE: U.S. Department of Education, National Center for Education Statistics, Schools and Staffing Survey (SASS), “Public School Questionnaire,” 2007–08.

National Center for Education Statistics Table 7. Percentage of public high schools that had school or guidance counselors, and among these schools, the student-to-counselor ratio, by school type and school characteristics: 2008
Excluding psychologists and social workers
Including psychologists and social workers
School type and school characteristics
Percent of schools that had school
or guidance counselors
Student-to-counselor
ratio
Percent of schools that had school
or guidance counselors
Student-to-counselor
ratio
Total 82.5 292.2 88.8 204.7
School type1
Regular Career/technical/vocational Other
95.0 85.2 52.9
323.0 368.6 146.1
96.0 85.8 72.3
235.6 333.4 88.4
Percent of students in school who were Black, Hispanic/Latino (of any race), Asian/Pacific Islander, and American Indian/Alaska Native
10 or less 11–30 31–50 More than 50
89.6 81.6 75.4 79.3
317.8 292.0 287.1 264.0
91.9 87.4 86.3 87.7
219.2 206.9 207.8 185.5
Percent of students in school who were approved for free or reduced-price lunch2
10 or less 11–30 31–50 More than 50
95.7 91.0 91.2 76.2
338.5 311.7 313.0 249.7
97.1 93.0 94.9 84.0
247.7 222.3 222.9 174.1
School locale City Suburb or town Rural
82.0 79.9 85.3
274.8 292.9 299.7
89.3 89.1 88.3
194.5 198.3 216.0
School size 1–599 600–1,199 1,200–1,999 2,000 or more
72.5 98.4 97.3 97.4
220.9 370.5 373.6 377.5
82.6 98.7 97.3 98.5
146.0 267.0 276.7 328.3
1 Career/technical/vocational schools primarily serve students being trained for occupations. Schools classified in the “other” category include special program emphasis schools (such as science or mathematics schools, performing arts schools, talented or gifted schools, and foreign language immersion schools); special education schools; alternative schools; and other types of schools that do not fall into these categories. 2 In 2007–08, 93.5 percent of public high schools participated in the National School Lunch Program. NOTE: High schools are defined as those that have grade 12 or those with no grades lower than 7 and at least one grade higher than 8 if they do not have grade 12. SOURCE: U.S. Department of Education, National Center for Education Statistics, Schools and Staffing Survey (SASS), “Public School Questionnaire,” 2007–08.
2008
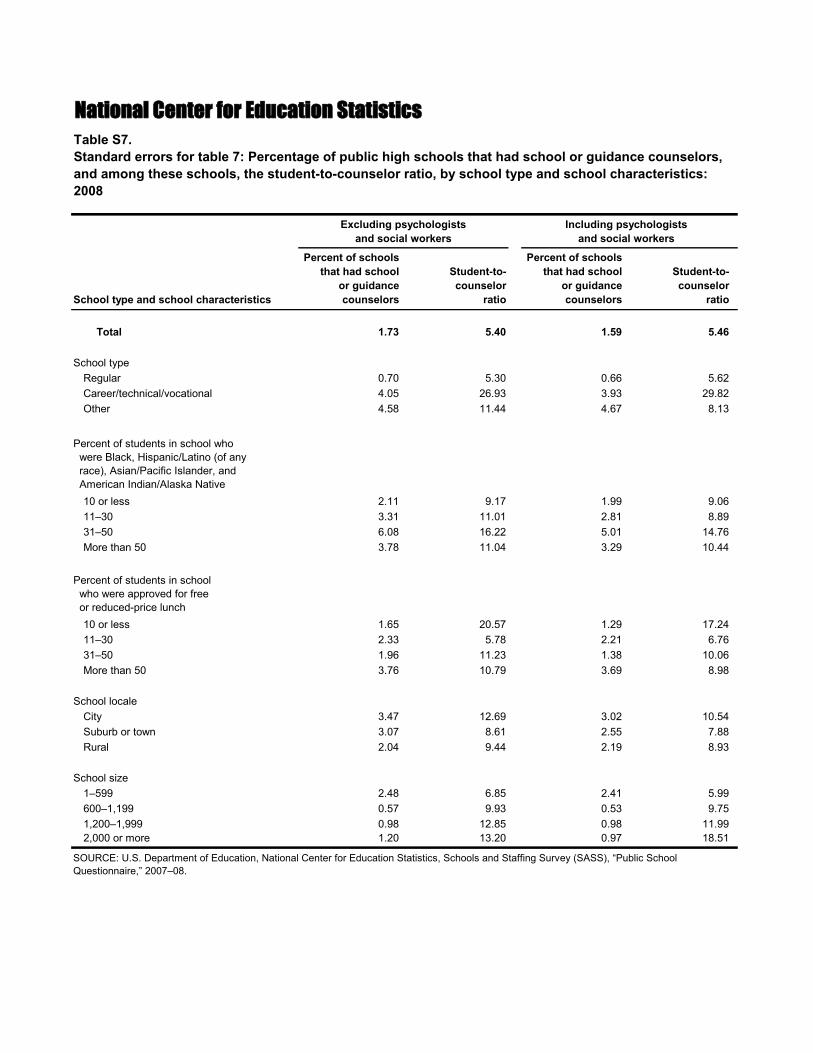
National Center for Education Statistics Table S7. Standard errors for table 7: Percentage of public high schools that had school or guidance counselors, and among these schools, the student-to-counselor ratio, by school type and school characteristics:
Excluding psychologists and social workers
Including psychologists and social workers
School type and school characteristics
Percent of schools that had school
or guidance counselors
Student-to-counselor
ratio
Percent of schools that had school
or guidance counselors
Student-to-counselor
ratio
Total 1.73 5.40 1.59 5.46
School type Regular 0.70 5.30 0.66 5.62 Career/technical/vocational 4.05 26.93 3.93 29.82 Other 4.58 11.44 4.67 8.13
Percent of students in school who were Black, Hispanic/Latino (of any race), Asian/Pacific Islander, and American Indian/Alaska Native
10 or less 2.11 9.17 1.99 9.06 11–30 3.31 11.01 2.81 8.89 31–50 6.08 16.22 5.01 14.76 More than 50 3.78 11.04 3.29 10.44
Percent of students in school who were approved for free or reduced-price lunch
10 or less 1.65 20.57 1.29 17.24 11–30 2.33 5.78 2.21 6.76 31–50 1.96 11.23 1.38 10.06 More than 50 3.76 10.79 3.69 8.98
School locale City 3.47 12.69 3.02 10.54 Suburb or town 3.07 8.61 2.55 7.88 Rural 2.04 9.44 2.19 8.93
School size 1–599 2.48 6.85 2.41 5.99 600–1,199 0.57 9.93 0.53 9.75 1,200–1,999 0.98 12.85 0.98 11.99 2,000 or more 1.20 13.20 0.97 18.51
SOURCE: U.S. Department of Education, National Center for Education Statistics, Schools and Staffing Survey (SASS), “Public School Questionnaire,” 2007–08.
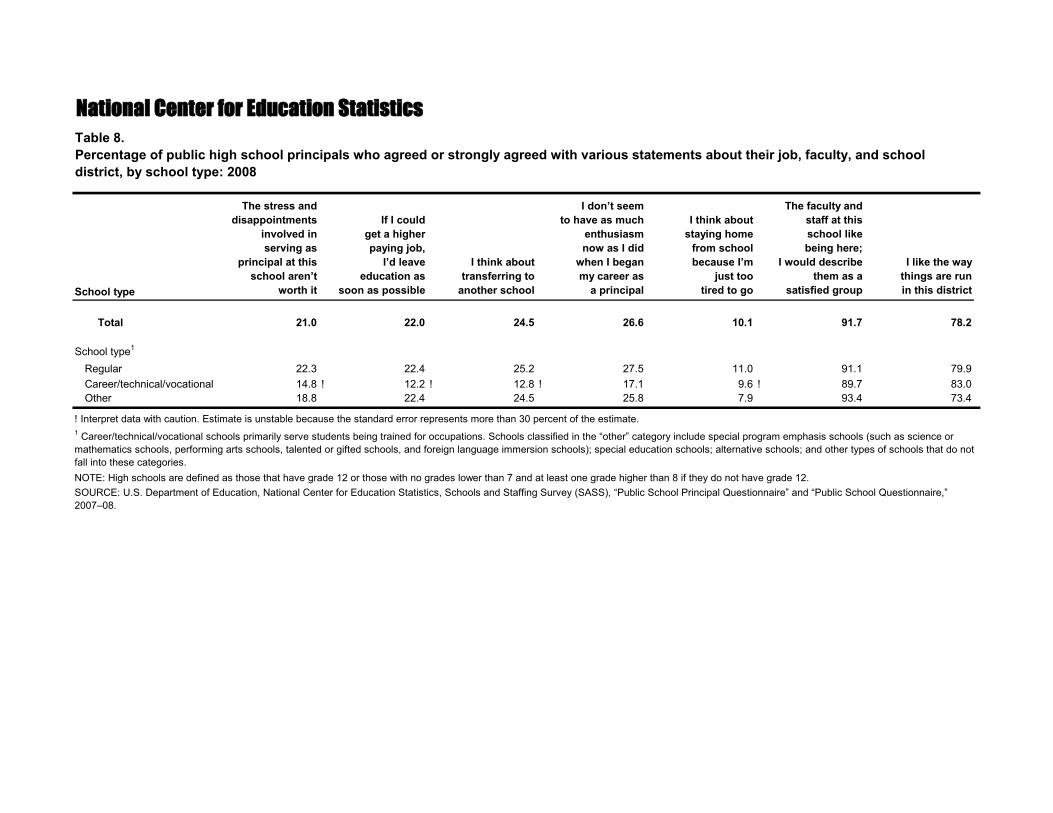
National Center for Education Statistics Table 8. Percentage of public high school principals who agreed or strongly agreed with various statements about their job, faculty, and school district, by school type: 2008
School type
The stress and disappointments
involved in serving as
principal at this school aren’t
worth it
If I could get a higher paying job,
I’d leave education as
soon as possible
I think about transferring to
another school
I don’t seem to have as much
enthusiasm now as I did
when I began my career as
a principal
I think about staying home
from school because I’m
just too tired to go
The faculty and staff at this school like being here;
I would describe them as a
satisfied group
I like the way things are run in this district
Total 21.0 22.0 24.5 26.6 10.1 91.7 78.2
School type1
Regular 22.3 22.4 25.2 27.5 11.0 91.1 79.9 Career/technical/vocational Other
14.8 ! 18.8
12.2 ! 22.4
12.8 ! 24.5
17.1 25.8
9.6 ! 7.9
89.7 93.4
83.0 73.4
! Interpret data with caution. Estimate is unstable because the standard error represents more than 30 percent of the estimate. 1 Career/technical/vocational schools primarily serve students being trained for occupations. Schools classified in the “other” category include special program emphasis schools (such as science or mathematics schools, performing arts schools, talented or gifted schools, and foreign language immersion schools); special education schools; alternative schools; and other types of schools that do not fall into these categories. NOTE: High schools are defined as those that have grade 12 or those with no grades lower than 7 and at least one grade higher than 8 if they do not have grade 12. SOURCE: U.S. Department of Education, National Center for Education Statistics, Schools and Staffing Survey (SASS), “Public School Principal Questionnaire” and “Public School Questionnaire,” 2007–08.
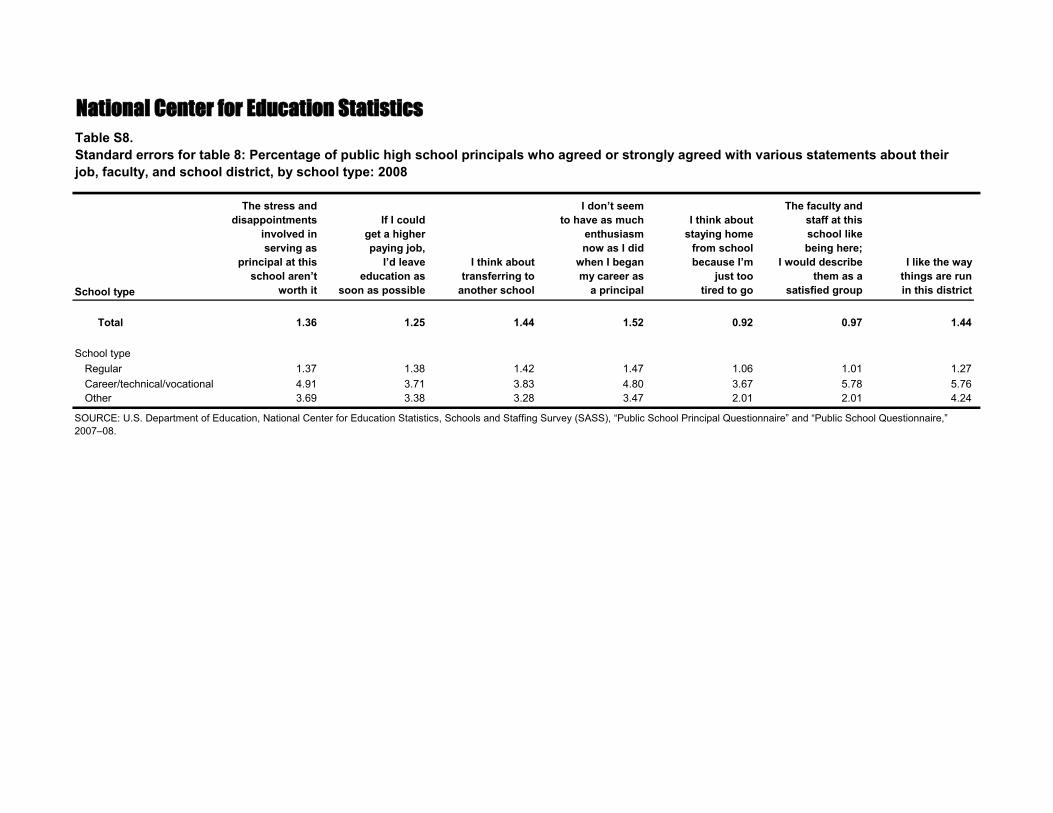
National Center for Education Statistics Table S8. Standard errors for table 8: Percentage of public high school principals who agreed or strongly agreed with various statements about their job, faculty, and school district, by school type: 2008
School type
The stress and disappointments
involved in serving as
principal at this school aren’t
worth it
If I could get a higher paying job,
I’d leave education as
soon as possible
I think about transferring to
another school
I don’t seem to have as much
enthusiasm now as I did
when I began my career as
a principal
I think about staying home
from school because I’m
just too tired to go
The faculty and staff at this school like being here;
I would describe them as a
satisfied group
I like the way things are run in this district
Total 1.36 1.25 1.44 1.52 0.92 0.97 1.44
School type Regular 1.37 1.38 1.42 1.47 1.06 1.01 1.27 Career/technical/vocational Other
4.91 3.69
3.71 3.38
3.83 3.28
4.80 3.47
3.67 2.01
5.78 2.01
5.76 4.24
SOURCE: U.S. Department of Education, National Center for Education Statistics, Schools and Staffing Survey (SASS), “Public School Principal Questionnaire” and “Public School Questionnaire,” 2007–08.

National Center for Education Statistics Table 9. Percentage distribution of grade 9−12 public school teachers’ main teaching assignment, by schooltype: 2008
School type1
Career/ technical/
Main teaching assignment Total Regular vocational Other
Total 100.0 100.0 100.0 100.0
Occupational education, total 7.7 7.0 39.3 4.6 Agriculture and natural resources 1.1 1.2 ‡ ‡ Business 2.1 2.2 4.3 ! 0.9 ! Communications and design 0.9 0.8 3.8 0.6 ! Computer and information sciences 0.6 0.5 1.9 ! 1.0 ! Construction, architecture, and engineering technologies 0.9 0.7 7.7 ‡ Consumer, culinary, and public services 0.6 0.4 4.1 0.6 ! Health sciences 0.4 0.3 4.2 ! ‡ Manufacturing 0.3 0.2 3.3 ‡ Marketing 0.4 0.3 ‡ ‡ Repair and transportation 0.5 0.4 6.4 ‡
Academic education, total 67.1 67.9 34.0 70.1 English and language arts 15.9 15.8 7.9 18.5 Mathematics 13.5 13.4 8.2 14.6 Sciences 11.7 12.0 7.0 11.3 Social sciences 11.7 11.7 7.2 14.2 Foreign languages 6.0 6.4 2.1 ! 3.4 Other academic2 8.4 8.7 1.6 ! 8.1
Enrichment/other, total 25.1 25.2 26.7 25.3 Family and consumer sciences 2.3 2.5 2.4 ! 0.9 ! General labor market preparation 3.9 3.7 14.6 2.4 Other3
18.9 19.0 9.7 22.1
! Interpret data with caution. Estimate is unstable because the standard error represents more than 30 percent of the estimate. ‡ Reporting standards not met. 1 Career/technical/vocational schools primarily serve students being trained for occupations. Schools classified in the “other” category include special program emphasis schools (such as science or mathematics schools, performing arts schools, talented or gifted schools, and foreign language immersion schools); special education schools; alternative schools; and other types of schools that do not fall into these categories. 2 Other academic fields include arts, crafts, dance, drama or theater, music, philosophy, and English as a Second Language. 3 Includes special education; health education; physical education; military science or Reserve Officers’ Training Corps (ROTC); religious studies, theology, or divinity; and other unspecified teaching assignments. NOTE: Detail may not sum to total because of rounding. SOURCE: U.S. Department of Education, National Center for Education Statistics, Schools and Staffing Survey (SASS), “Public School Teacher Questionnaire” and “Public School Questionnaire,” 2007–08.

National Center for Education Statistics Table S9. Standard errors for table 9: Percentage distribution of grade 9−12 public school teachers’ main teaching assignment, by school type: 2008
School type Career/
technical/ Main teaching assignment Total Regular vocational Other
Total † † † †
Occupational education, total 0.31 0.27 3.71 0.80 Agriculture and natural resources 0.12 0.13 † † Business 0.15 0.16 1.50 0.31 Communications and design 0.11 0.12 1.09 0.23 Computer and information sciences 0.08 0.08 0.91 0.40 Construction, architecture, and engineering technologies 0.10 0.10 1.71 † Consumer, culinary, and public services 0.08 0.06 0.98 0.26 Health sciences 0.07 0.06 1.34 † Manufacturing 0.04 0.04 0.93 † Marketing 0.05 0.05 † † Repair and transportation 0.08 0.07 1.53 †
Academic education, total 0.79 0.73 3.39 2.38 English and language arts 0.45 0.50 1.85 1.60 Mathematics 0.32 0.31 2.02 1.09 Sciences 0.38 0.37 1.64 1.05 Social sciences 0.33 0.32 2.04 1.39 Foreign languages 0.32 0.37 0.96 0.65 Other academic 0.29 0.32 0.60 1.23
Enrichment/other, total 0.66 0.70 2.01 2.20 Family and consumer sciences 0.14 0.17 1.06 0.33 General labor market preparation 0.22 0.21 1.61 0.54 Other 0.63 0.67 1.71 2.01
† Not applicable. SOURCE: U.S. Department of Education, National Center for Education Statistics, Schools and Staffing Survey (SASS), “Public School Teacher Questionnaire” and “Public School Questionnaire,” 2007–08.
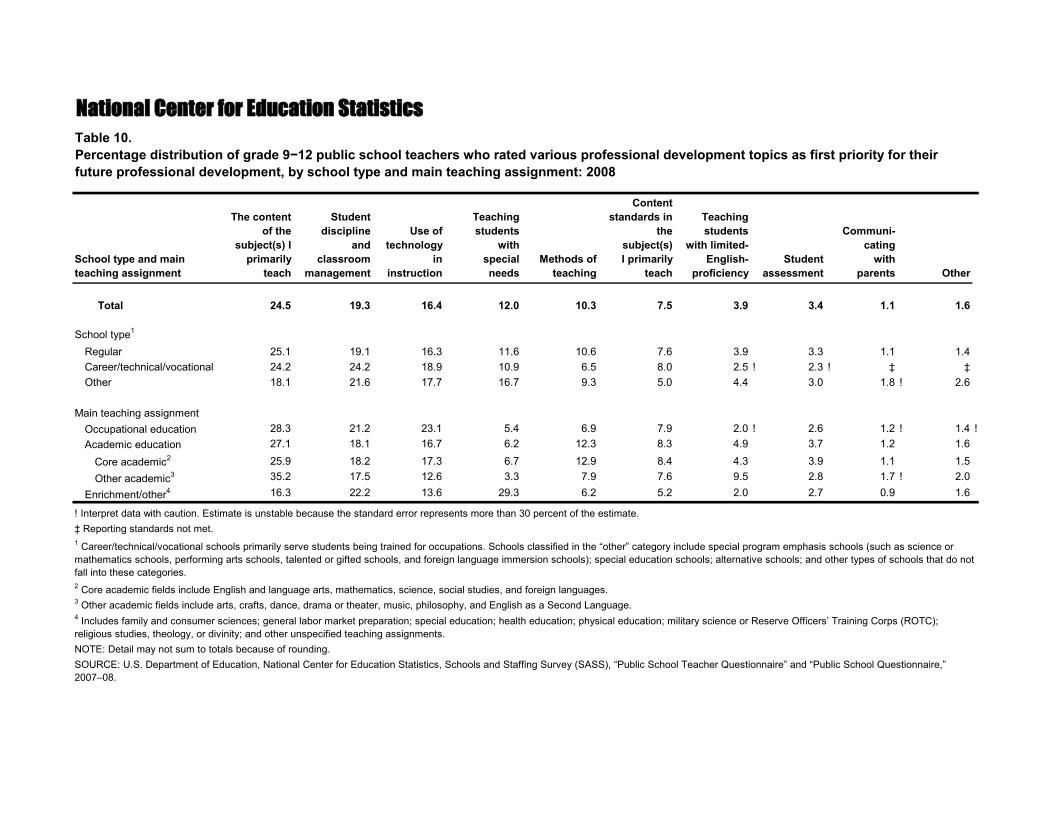
National Center for Education Statistics Table 10. Percentage distribution of grade 9−12 public school teachers who rated various professional development topics as first priority for theirfuture professional development, by school type and main teaching assignment: 2008
Content The content Student Teaching standards in Teaching
of the discipline Use of students the students Communi-subject(s) I and technology with subject(s) with limited- cating
School type and main primarily classroom in special Methods of I primarily English- Student with teaching assignment teach management instruction needs teaching teach proficiency assessment parents Other
Total 24.5 19.3 16.4 12.0 10.3 7.5 3.9 3.4 1.1 1.6
School type1
Regular 25.1 19.1 16.3 11.6 10.6 7.6 3.9 3.3 1.1 1.4 Career/technical/vocational 24.2 24.2 18.9 10.9 6.5 8.0 2.5 ! 2.3 ! ‡ ‡ Other 18.1 21.6 17.7 16.7 9.3 5.0 4.4 3.0 1.8 ! 2.6
Main teaching assignment Occupational education 28.3 21.2 23.1 5.4 6.9 7.9 2.0 ! 2.6 1.2 ! 1.4 ! Academic education 27.1 18.1 16.7 6.2 12.3 8.3 4.9 3.7 1.2 1.6
Core academic2 25.9 18.2 17.3 6.7 12.9 8.4 4.3 3.9 1.1 1.5 Other academic3 35.2 17.5 12.6 3.3 7.9 7.6 9.5 2.8 1.7 ! 2.0
Enrichment/other4 16.3 22.2 13.6 29.3 6.2 5.2 2.0 2.7 0.9 1.6
! Interpret data with caution. Estimate is unstable because the standard error represents more than 30 percent of the estimate. ‡ Reporting standards not met. 1 Career/technical/vocational schools primarily serve students being trained for occupations. Schools classified in the “other” category include special program emphasis schools (such as science or mathematics schools, performing arts schools, talented or gifted schools, and foreign language immersion schools); special education schools; alternative schools; and other types of schools that do not fall into these categories. 2 Core academic fields include English and language arts, mathematics, science, social studies, and foreign languages. 3 Other academic fields include arts, crafts, dance, drama or theater, music, philosophy, and English as a Second Language. 4 Includes family and consumer sciences; general labor market preparation; special education; health education; physical education; military science or Reserve Officers’ Training Corps (ROTC); religious studies, theology, or divinity; and other unspecified teaching assignments. NOTE: Detail may not sum to totals because of rounding. SOURCE: U.S. Department of Education, National Center for Education Statistics, Schools and Staffing Survey (SASS), “Public School Teacher Questionnaire” and “Public School Questionnaire,” 2007–08.
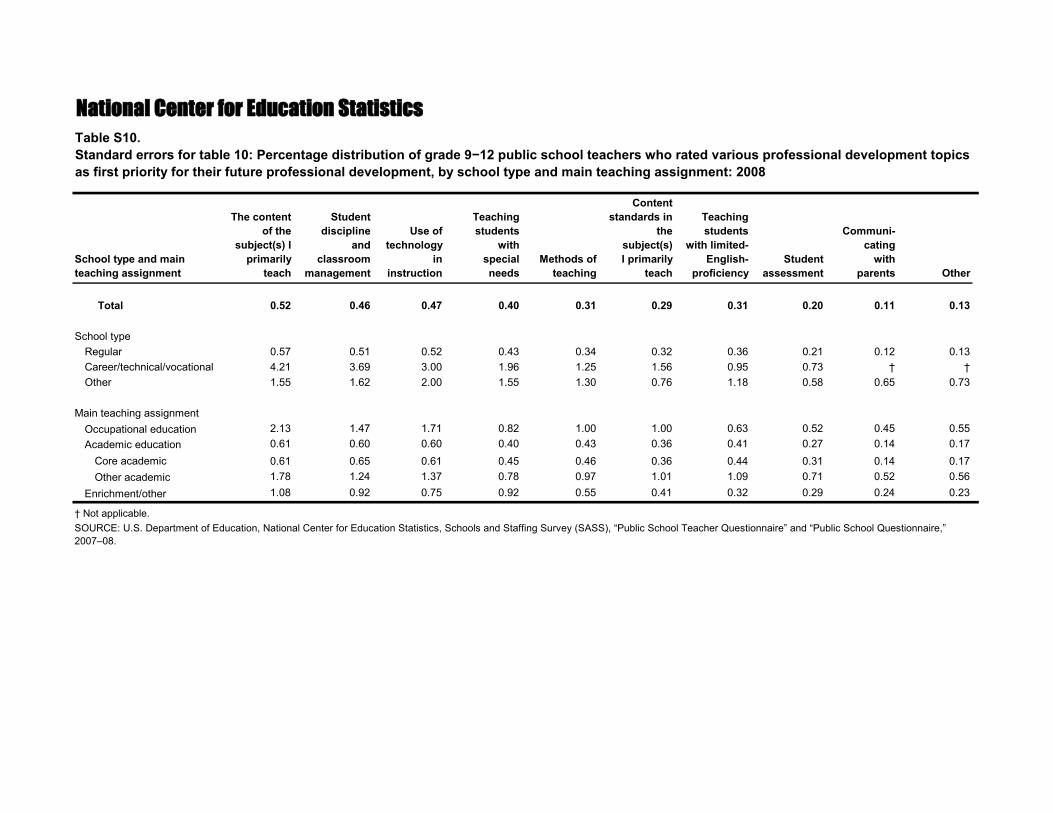
National Center for Education Statistics Table S10. Standard errors for table 10: Percentage distribution of grade 9−12 public school teachers who rated various professional development topicsas first priority for their future professional development, by school type and main teaching assignment: 2008
School type and main teaching assignment
The content of the
subject(s) I primarily
teach
Student discipline
and classroom
management
Use of technology
in instruction
Teaching students
with special needs
Methods of teaching
Content standards in
the subject(s) I primarily
teach
Teaching students
with limited-English-
proficiency Student
assessment
Communi-cating
with parents Other
Total 0.52 0.46 0.47 0.40 0.31 0.29 0.31 0.20 0.11 0.13
School type Regular Career/technical/vocational Other
0.57 4.21 1.55
0.51 3.69 1.62
0.52 3.00 2.00
0.43 1.96 1.55
0.34 1.25 1.30
0.32 1.56 0.76
0.36 0.95 1.18
0.21 0.73 0.58
0.12 †
0.65
0.13 †
0.73
Main teaching assignment Occupational education Academic education
2.13 0.61
1.47 0.60
1.71 0.60
0.82 0.40
1.00 0.43
1.00 0.36
0.63 0.41
0.52 0.27
0.45 0.14
0.55 0.17
Core academic Other academic
Enrichment/other
0.61 1.78 1.08
0.65 1.24 0.92
0.61 1.37 0.75
0.45 0.78 0.92
0.46 0.97 0.55
0.36 1.01 0.41
0.44 1.09 0.32
0.31 0.71 0.29
0.14 0.52 0.24
0.17 0.56 0.23
† Not applicable. SOURCE: U.S. Department of Education, National Center for Education Statistics, Schools and Staffing Survey (SASS), “Public School Teacher Questionnaire” and “Public School Questionnaire,” 2007–08.

National Center for Education Statistics Table 11. Percentage of grade 9−12 public school teachers who participated in professional development activities on the content of their subject(s) in the past 12 months, and among them, the percentage distribution of the total hours they spent on these activities and the percentage who rated these activities as very useful, by school type and main teaching assignment: 2008
Percent of teachers who participated in Percent of
professional development
activities on the
Pecentage distribution of the total hours participants spent on these activities
participants who rated
these School type and main teaching assignment
content of their subject(s)
8 hours or less
9−16 hours
17−32 hours
33 hours or more
activities as very useful
Total 80.5 22.5 27.3 21.9 28.3 26.7
School type1
Regular 80.7 22.7 27.4 21.7 28.3 26.5 Career/technical/vocational 77.6 19.9 27.1 21.8 31.2 32.8 Other 78.9 20.3 26.5 21.9 31.4 28.4
Main teaching assignment Occupational education 81.5 19.0 28.3 23.7 29.0 31.2 Academic education 79.4 23.1 27.0 20.8 29.2 26.4
Core academic2 79.0 23.6 27.2 20.7 28.6 24.9 Other academic3 82.1 19.9 25.8 21.1 33.2 37.1
Enrichment/other4 83.0 21.8 27.9 24.2 26.0 26.1 1 Career/technical/vocational schools primarily serve students being trained for occupations. Schools classified in the “other” category include special program emphasis schools (such as science or mathematics schools, performing arts schools, talented or gifted schools, and foreign language immersion schools); special education schools; alternative schools; and other types of schools that do not fall into these categories. 2 Core academic fields include English and language arts, mathematics, science, social studies, and foreign languages. 3 Other academic fields include arts, crafts, dance, drama or theater, music, philosophy, and English as a Second Language. 4 Includes family and consumer sciences; general labor market preparation; special education; health education; physical education; military science or Reserve Officers’ Training Corps (ROTC); religious studies, theology, or divinity; and other unspecified teaching assignments. NOTE: Detail may not sum to totals because of rounding. SOURCE: U.S. Department of Education, National Center for Education Statistics, Schools and Staffing Survey (SASS), “Public School Teacher Questionnaire” and “Public School Questionnaire,” 2007–08.
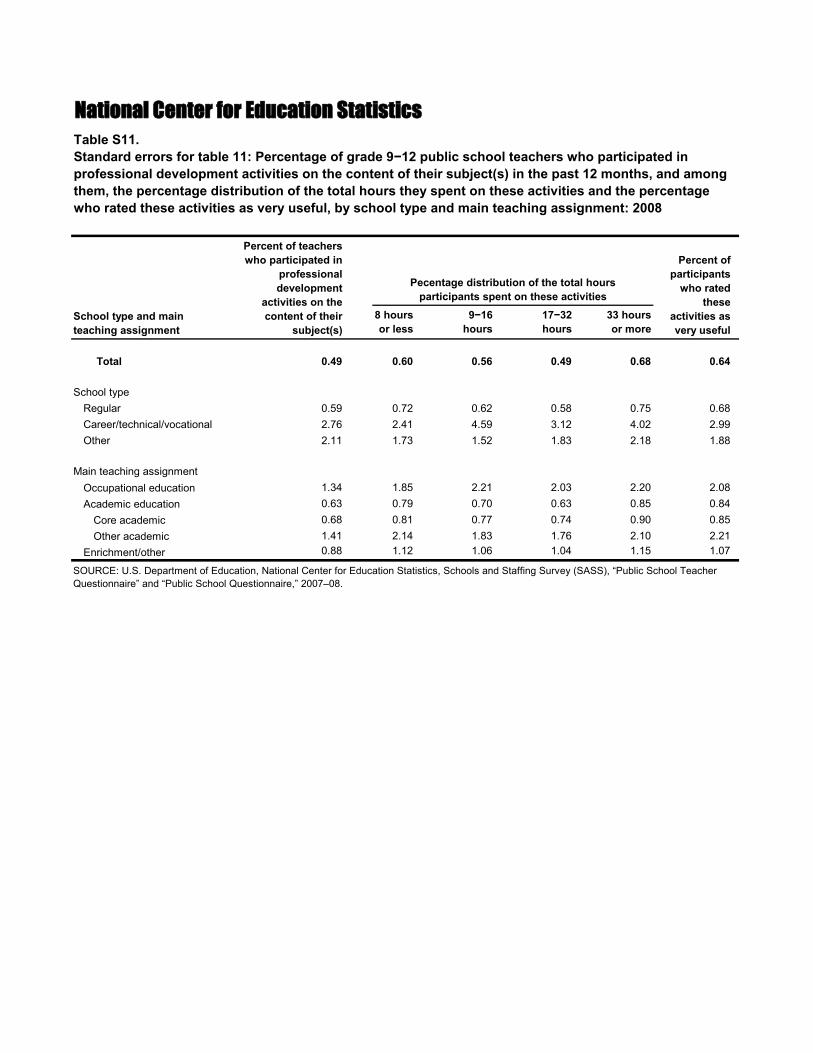
National Center for Education Statistics Table S11. Standard errors for table 11: Percentage of grade 9−12 public school teachers who participated in professional development activities on the content of their subject(s) in the past 12 months, and among them, the percentage distribution of the total hours they spent on these activities and the percentage who rated these activities as very useful, by school type and main teaching assignment: 2008
Percent of teachers who participated in Percent of
professional development
activities on the
Pecentage distribution of the total hours participants spent on these activities
participants who rated
these School type and main teaching assignment
content of their subject(s)
8 hours or less
9−16 hours
17−32 hours
33 hours or more
activities as very useful
Total 0.49 0.60 0.56 0.49 0.68 0.64
School type Regular 0.59 0.72 0.62 0.58 0.75 0.68 Career/technical/vocational 2.76 2.41 4.59 3.12 4.02 2.99 Other 2.11 1.73 1.52 1.83 2.18 1.88
Main teaching assignment Occupational education 1.34 1.85 2.21 2.03 2.20 2.08 Academic education 0.63 0.79 0.70 0.63 0.85 0.84
Core academic 0.68 0.81 0.77 0.74 0.90 0.85 Other academic 1.41 2.14 1.83 1.76 2.10 2.21
Enrichment/other 0.88 1.12 1.06 1.04 1.15 1.07
SOURCE: U.S. Department of Education, National Center for Education Statistics, Schools and Staffing Survey (SASS), “Public School Teacher Questionnaire” and “Public School Questionnaire,” 2007–08.
National Center for Education Statistics Table 12. Percentage of grade 9−12 public school teachers who agreed or strongly agreed with various statements about their school, students, and job, by school type and main teaching assignment: 2008
The level of student
misbehavior in this school
School type and main interferes with teaching assignment my teaching
Most of my colleagues share The principal
my beliefs and knows what I receive a values about kind of school
great deal of what the he or she wants support central mission and has
from parents for of the school communicated the work I do should be it to the staff
There is a great deal of I am given the I am generally
cooperative effort support I need satisfied with among the to teach students being a teacher
staff members with special needs at this school
Total 40.1 60.0 83.7 86.6 80.9 68.9 92.4
School type1
Regular 39.6 61.0 83.5 86.7 80.8 69.1 92.4 Career/technical/vocational 36.5 58.2 86.9 86.3 87.7 68.1 94.7 Other 41.8 52.2 85.3 85.8 83.5 69.5 92.5
Main teaching assignment Occupational education 37.9 64.2 85.8 87.9 82.9 71.2 93.8 Academic education 41.1 59.3 83.1 85.9 80.5 65.9 92.0
Core academic2 41.8 57.6 83.0 85.6 80.4 65.6 91.9 Other academic3 36.3 71.2 83.8 87.9 80.6 67.9 92.3
Enrichment/other4 38.0 60.5 84.7 87.8 81.6 76.3 93.3 1 Career/technical/vocational schools primarily serve students being trained for occupations. Schools classified in the “other” category include special program emphasis schools (such as science or mathematics schools, performing arts schools, talented or gifted schools, and foreign language immersion schools); special education schools; alternative schools; and other types of schools that do not fall into these categories. 2 Core academic fields include English and language arts, mathematics, science, social studies, and foreign languages. 3 Other academic fields include arts, crafts, dance, drama or theater, music, philosophy, and English as a Second Language. 4 Include family and consumer sciences; general labor market preparation; special education; health education; physical education; military science or Reserve Officers’ Training Corps (ROTC); religious studies, theology, or divinity; and other unspecified teaching assignments. SOURCE: U.S. Department of Education, National Center for Education Statistics, Schools and Staffing Survey (SASS), "Public School Teacher Questionnaire" and “Public School Questionnaire,” 2007–08.

National Center for Education Statistics Table S12. Standard errors for table 12: Percentage of grade 9−12 public school teachers who agreed or strongly agreed with various statements about their school, students, and job, by school type and main teaching assignment: 2008
The level of student
misbehavior in this school
School type and main interferes with teaching assignment my teaching
Most of my colleagues share The principal
my beliefs and knows what I receive a values about kind of school
great deal of what the he or she wants support central mission and has
from parents for of the school communicated the work I do should be it to the staff
There is a great deal of I am given the I am generally
cooperative effort support I need satisfied with among the to teach students being a teacher
staff members with special needs at this school
Total 0.77 0.67 0.52 0.53 0.52 0.74 0.38
School type Regular 0.85 0.70 0.55 0.53 0.57 0.79 0.42 Career/technical/vocational 4.87 3.69 1.98 2.73 2.28 4.01 1.12 Other 2.81 2.21 1.80 2.06 1.42 2.85 1.34
Main teaching assignment Occupational education 2.10 1.99 1.49 1.36 1.53 1.50 1.00 Academic education 0.89 0.78 0.57 0.60 0.64 0.85 0.45
Core academic 0.95 0.90 0.60 0.62 0.65 0.93 0.47 Other academic 1.84 1.83 1.41 1.25 1.57 1.75 1.24
Enrichment/other 1.11 1.06 0.88 0.82 0.88 1.15 0.65
SOURCE: U.S. Department of Education, National Center for Education Statistics, Schools and Staffing Survey (SASS), "Public School Teacher Questionnaire" and “Public School Questionnaire,” 2007–08.