web.stanford.edujbulow/lehmandocs/docs/lazard/laz-a-00000131... · ii sale of 49% and 51% of...
TRANSCRIPT

I I
tJ) ~ ~ ~ ;:,::; ~ [J;J ~ t; ~ r--., "" f""! ?-;
z ......,
~ 0
(,) ~ ..... ~ (,()
rJ) ·- N ,_, 0 G ~ <1 ::fl
'"" ~ ~ Q
CONFIDENTIAL TREATMENT REQUESTED LAZ -A-00000131
()
~ ~ ~ ----1
~ ----1
~ FR 0 ~
*1 0
r> N I
'i
~ w N
i'RCjE(. r;HLE!',
.,,.. ...
-------------- ---- -----------------------·-· ________ ___)
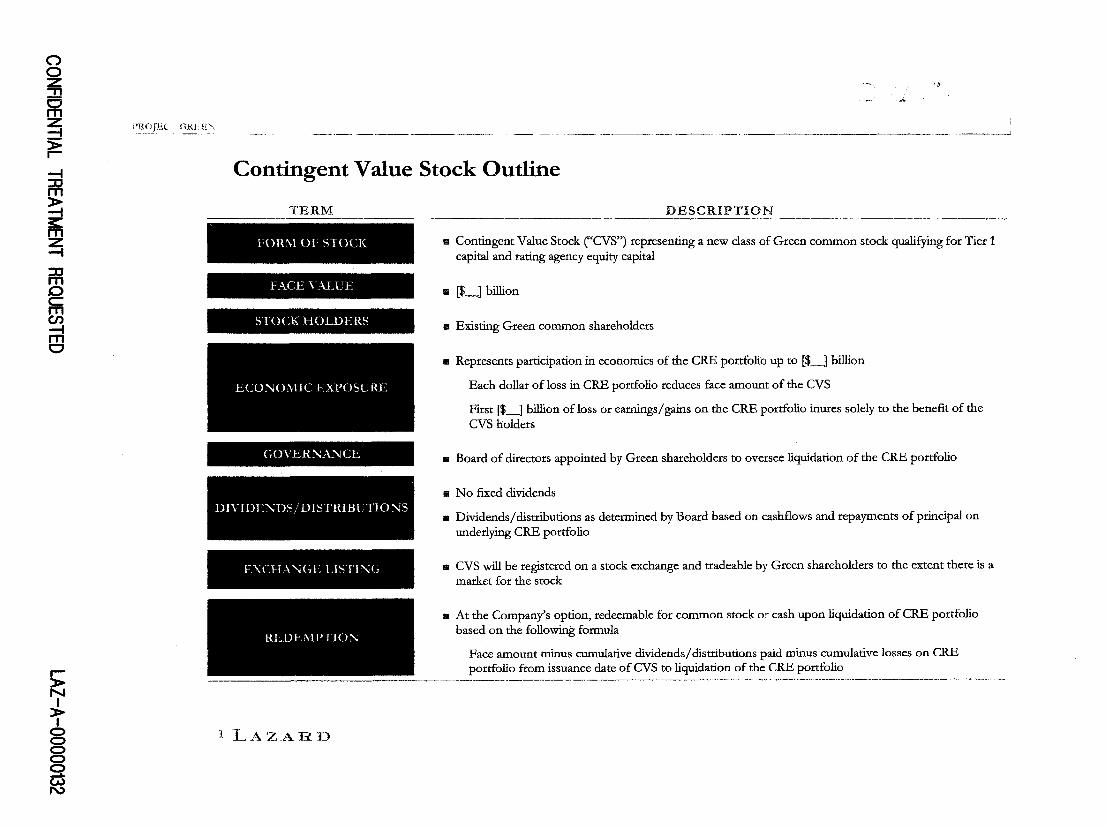
Contingent Value Stock Outline
TERM
FORM OF STOCK
FACE VALUE
STOCK HOLDERS
GO'VERNAt'-JCE
DIVIDENDS/DISTRIBUTIONS
EXCHANGE LISTING
REDEMPTION
DESCRIPTION
Iii Contingent Value Stock ('CVS") representing a new class of Green common stock qualifying for Tier 1 capital and rating agency equity capital
111 [$_] billion
a Existing Green common shareholders
111 Represents participation in economics of the CRE portfolio up to [$_] billion
Each dollar of loss in CRE portfolio reduces face amount of the CVS
First [$_] billion of loss or earnings/ gains on the CRE portfolio inures solely to the benefit of the CVS holders
11 Board of directors appointed by Green shareholders to oversee liquidation of the CRE portfolio
• No fixed dividends
11 Dividends/ distributions as determined by Board based on cashflows and repayments of principal on underlying CRE portfolio
a CVS will be registered on a stock exchange and tradeable by Green shareholders to the extent there is a market for the stock
11 At the Company's option, redeemable for common stock or cash upon liquidation of CRE portfolio based on the following formula
Face amount minus cumulative dividends/distributions paid minus cumulative losses on CRE portfolio from issuance date of CVS to liquidation of the CRE portfolio
~~~~~~~---------------------- ------------------------------------ -- --" ___ ,_ _______ , __________________________________________ _
1 L.AZAH.D

0 0 ~
~ )> r---t fF: )> --t
~ fF: ~ ~
r)> N I
i
,~--~.
_:; . ... ~''\{
PR- <k r .;REt! I ------- -------------------- -------------------- ·-------1
Potential Recapitalization By Creating Contingent Value Stock
Green Shareholder,
Green
Shareholders Ne" Irn estors
Economic Interest
NewCRE
cvs
-{¢ifui< :Ass~t~~.!JI:i~hlres---.. ·,::( __ · ,:-"': .. · ........ --~. ;:~· ~:~"'.. . '.
$10 billion Tangible Equity
·-·~-----·- -·---.. -·--·----·-··--·-···--~·-·
2 LAZARD
Common Stock
$36 billion angible Equity
il0lJj ~:
Economic Interest
;sec:untit:s, li~t~
$26 billion Tangible Equity
STEP 1: a Create new class of common stock, Contingent Value Stock or "CVS",
which represents $10bn of equity of CRE portfolio
STEP 2: 11 CVS distributed to Green shareholders in a tax-free manner
CVS is exchange traded Green has two classes of common stock- Green Holdings common stock and CVS
STEP 3: • Issue $4bn common equity at Holdings level
Assume rights offering Potential to also raise equity from new investors
STEP 4 a New issuance of restricted stock to employees
ADVANTAGES • Allows for separate reporting of Green ongoing franchise results and
CRE portfolio • No change in consolidated financials of Green as a result of issuance of
cvs a Green keeps equity associated with CRE portfolio • S_c::pllt~tion of C:RE el{p()sure into a different security may facilitate
Green's ability to raise additional equity against the franchise • Ability to optionally redeem CVS at a later date either for cash or
exchange offer for Green common equity
ISSUES • Does not result in shrinking of Green's overall balance sheet a Time required to register CVS, publish financials/proxy and receive
shareholder vote 11 Unclear how CVS would trade

(') 0
~ ~ > r--t ::D m > -t
~ -t
~ ffi C/)
rri c
r> N I
> I
8 § _., w .,J::.
·H_uJEL l , H. .• · ·''
"!
--- -------·----· . ______ !
Contingent Value Stock Payout Example By Creating New CRE Stock ($ in millions, except per share data)
li Assumes $30bn CRE portfolio which declines ratably over 5 years through sales, maturities
Assumes $1 Obn CVS issued to current shareholders of Green
Redeemed at 110% of face value at the end of fiscal year 5
No growth in assets
Net income based on IBES consensus for 2008E- 2010E and assumed 10% annual growth in 2011E- 2012E
II For modeling purposes, assumed no gain on sales
CVS PAYOUT EXAMPLE
% Cumulative Loss in CRE Portfolio Over Next 5 Years
0% 5% 10% 15% 20% 25% ------Pre-tax Loss $0 $1,500 $3,000 $4,500 $6,000 $7,500
Face Amount of CVS 10,000 8,500 7,000 5,500 4,000 2,500
Face Amount of CVS Per Share $14.15 $12.03 $9.91 $7.78 $5.66 $3.54
Pro Fotma Gn:en Year 5 .Leverage
Before Payout of CVS
Gross Leverage 11.8x 12.0x 12.2x 12.4x 12.6x 12.8x
Net Leverage 6.0x 6.1x 6.2x 6.3x 6.4x 6.5x
Mter Payout of CVS
Gross Leverage 14.5x 14.3x 14.1x 13.9x 13.7x 13.5x
Net Leverage 7.5x 7.3x 7.2x 7.1x 7.0x 6.8x
3l.AZA.HJ)

lf) d ~ QJ - QJ 0: [;l;l ~ E--
" ~· t"\ ' ~ 1-i
z ....- ~ 0 u ,... QJ ~ ':f) ':f) ·- N ;::: 0 '1
~ "'" ~ rJl ..... ~ ' 0 ~
CONFIDENTIAL TREATMENT REQUESTED LAZ -A-00000135

(") 0 ~
~ ~
~ ~
~ FR ~ ~ 0
.. > N I
=t 0
8 8 _... w en
CONFIDENTIAl. I
Alternatives Under Review
1!!1 Spin-off of CRE portfolio
No capital raise or additional asset sales
In conjunction with additional equity capital raise
In conjunction with Investment Management Division sale
Iii Issue Contingent Value Stock to existing shareholders with additional equity capital raise
a Sale of 100% of Investment Management Division
II Sale of 49% and 51% of Investment Management Division excluding minority stakes
ill Going private transaction
Cash only
In conjunction with CVS
In conjunction with 51% sale of Investment Management Division with F ASB 159 election
.I LAZARD

(") 0
~ m ~ ~ -f Rl )>
~ ~ Rl ~ ~ m 0
.-)> N I
)> I
~ El
~a\.1 CONFIDEN'I'J.AL -----· _j
Major Assumptions ($ in millions)
A1tetnatives Category Assumption
ASSET SALE
EMPLOYEE SHARES
GOING PRIVATE
Assets sold
Pre-tax loss on asset sale
After-tax loss on asset sale
Risk-weight on assets sold for Tier 1 Capital purposes
CRE portfolio assets
Spin Co financing by Green
SpinCo financing provided by third party Implied SpinCo equity
Risk-weight on CRE assets for Tier 1 Capital purposes Risk-weight on CRE financing for Tier 1 Capital purposes
Total IJ\ID value IJ\ID value excluding minority stakes at cost 2009E after-tax earnings for total IJ\ID business 2010E after-tax earnings for total IJ\ID business Book value of equities business Book value of fixed income business
Book value of Green alternative investments Book value ofD.E. Shaw, Spinnaker and Ospraie Book value of R3, One William Street and Field Street No book or cash tax on sale proceeds due to capital loss NOLs
Vested, saleable shares owned by employees (million)
RSUs in trust (million) Post 2007 RSUs subject to 18 month vesting post change of control (million)
Performance Stock Units (million)
Exchange of $2bn of mandatory convertibles and $4bn perpetual preferred at 15% premium to market
Remaining $2.9bn of straight preferred securities to remain outstanding Target new investor ownership in Green
----------·---------------------
2 LAZAHD
$23,778
4,100 2,800 75%
$30,000 19,000
1,000 10,000
100% 50%
$7,500 6,000 $629
889 $2,800
400
[ 0] 1,169
[ 0]
31 97 71 22
49.9%

(')
~
! ~ >
~ z -I
m E9
I > N I
> I
C>
8 8 --. w (X)
CONl1lDEN1'lAL I ----------
Green Strategic Alternatives - Key Summary Financial Metrics ($ in billions, except per share amounts)
CRE Spin-off CRE/CVS cvs Sta1us Pro With Green Only Consolidated Quo Fonna 100''10 With With
5/31/08 (b) 5/31/08 (b) __ Only_ IMD Sale $4bn Raise $4bn Raise
Balance Sheet Statistics:
New Third-Party Capital Raised -- -- -- $4.0 $4.0
Balance Sheet Cash Used
Net Leverage 10.1x 10.2x 14.7x 11.5x 12.5x 9.1x
Tier 1 Capital Ratio 13.5% 13.3% 9.2% 12.6% 11.4% 15.3%
Pre-Tax Charge to Breakeven -- -- $7.7
Net Assets $333.8 $310.0 $300.0 $306.1 $304.0 $314.0
Tangible Equity Capital 33.2 30.4 20.4 26.5 24.4 34.4
Tangible Common Book Value (a) $19.2 $16.4 $6.4 $12.5 $10.4 $20.4
Tangible Common Book Value Per Share $27.15 $23.19 $9.04 $17.71 $11.12 $21.83
Earnings Statistics:
2009E Earcings Per Share (a) $3.68 $3.68 $3.68 $3.09 $2.91 $2.91
%Accretion / (Dilution) 0.0% (15.9%) (20.9%) (20.9%)
2009E Operating ROE 10.5% 11.7% 21.4% 14.6% 16.9% 10.3%
FYE 2010 Illustrative Share Price (a):
Green FYE 2010 Est. Share Price $48.84 $43.53 $33.99 $35.45 $36.62
SpinCo./CVS FYE 2010 Est. Share Price -- 7.22 7.22 7.22 3.89
Total FYE 2010 Est. Share Price 48.84 50.75 41.20 42.66 40.51 --~-----
Source: Company filings and equity mearch ,.ports. (a) Assumes share count equal to 706.7 million shares plus incremental shares issued in capital raise. Excludes the dilution effect of in-the-money options, if any. (b) Status quo adjusted for capital raise since 2Q'08. Pro forma reflects $23.8 billion reduction in asset levels per management assuming $4.1 billion pre-tax ($2.8 billion after-tax) loss on asset sales.
3 I~ A z A H D

(") 0 ~
~ ~ -I ::0 m )> -I
~
m rri 0
.-)> N
~ g 8 g c.O
CONFIDEN'I'IALj . ----- ··-
• t-
Green Strategic Alternatives - Key Summary Financial Metrics (cont'd) ($in billions, except per share amounts)
Sell IMD Green Go Private (cJ
Pro 49% Sale 51% Sale $19.30 Cash $19.30 Cash $19.30 Cash $15 Cash + CVS Forma With With 9.2% Tier 1 11.0°;(, Tier 1 51% IMD Sale 9.2% Tiet 1
5/31/08 (b) 100% Sale Consolidation FASB 159 49.9% New Inv. 66.4% New Inv. + FASB 159 26.5% New Inv.
Balance Sheet Statistics:
New Third-Patty Capital Raised -- -- -- -- $3.7 $7.2 $3.7 $1.0
Balance Sheet Cash Used -- -- -- -- 8.1 4.5 5.1 8.1
Net Leverage 10.2x 8.7x 9.4x 8.7x 13.6x 11.8x 12.1x 13.6x
Tier 1 Capital Ratio 13.3% 16.4% 14.8% 16.2% 9.2% 11.0% 12.1% 9.2%
Pre-Tax Charge to Breakeven $11.9 $5.7 $11.2
Net A55ets $310.0 $316.1 $312.9 $315.8 $301.9 $305.5 $304.7 $301.9
Tangible Equity Capital 30.4 36.5 33.3 36.2 22.3 25.9 25.1 22.3
Tangible Common Book Value (a) $16.4 $22.5 $17.8 $22.2 $9.6 $13.2 $15.4 $9.6
Tangible Common Book Value Per Share $23.19 $31.86 $25.13 $31.40 $13.58 $18.67 $21.79 $13.58
Earnings Statistics:
2009E Eaming5 Per Share (a) $3.68 $3.09 $3.54 $3.55 $3.49 $3.64 $3.36 $3.49
%Accretion / (Dilution) (15.9%) (3.7%) (3.4%) (5.2%) (1.2%) (8.6%) (5.2%)
2009E Operating ROE 11.7% 8.7% 10.6% 10.1% 15.7% 13.2% 12.9% 15.7%
FYE 2010 Illustrative Share Price (a):
Green FYE 2010 Est. Share Price $48.84 $38.94 $43.03 $43.78 $44.26 $47.42 $39.55 $41.13
SpinCo./CVS FYE 2010 Est. Share Price -- -- -- -- -- -- 2.55
Total FYE 2010 Est. Share Price 48.84 38.94 43.03 43.78 44.26 47.42 39.55 43.68 ··-----~
___ _,._. .. ___ , ______ ~-----·
S onrce: Compaf!Y filings and equity research reports. (a) Assumes share count equal to 706.7 million shares plus incremental shares issued in capital raise. Excludes the dilution effect of in-the-money options, if any. (b) Pro fonna for capital raise since 2Q'08 and $23.8 billion reduction in asset levels per management assuming $4.1 billion pre-tax ($2.8 billion after-tax) loss on asset sales. (c) AU cash going private scenarios accounted for under recap accounting.
4 LAZAHD

(')
~ ~ ::! ~
~ > --i
~ ~
~ ~ m 0
r> N I
> 6 § :s: 0
CON~IDENTIAL j
Green Strategic Alternatives - Summary Observations
GREEN CRITERIA
BALANCE SHEET
EARNINGS POWER/ROE
PERCEIVED BLSINESS
MIX
TRANSACTION/ OPERATING EXECUTION
RISK
S'i'.t\::['lJS QUO
~
()
~
0
Full exposure iil
toCRE Market Ill
expecting Ill action
Iii
1!11
1111
CRE SPINOFF
WITH WITH 100% $4BN IMD
ONLY RAISE SALE CVS + $4BN
0 ~ !) ~
• () () ~
() () ~ ()
~ ~ ~ ~
Eliminates CRE exposure to llil Eliminates li!l
franchise CRE Probable rating agency downgrade exposure to fi!
Leverage and capital likely not franchise ta
feasible following spinoff only 11!1 CVS facilitates
Under $4bn raise scenario, dilutive capital raise
equity offering !ill Dilutive
IMD sale results in loss of equity
stable/valuable IM earnings offering
Multiple transactions iii Trading of CVS? &I CVS oversight
GO PRIVATE
SALE OF LMD $19.30 CASH ·------ --
51% 5l'Yo 49% SALE W/ SALE W/
100% SALE W/ FASB 159 9.2%· 1LO% FASB 159 SALE CONSOL ACCT TIER I TIER 1 ACCT cvs ----- ---- -~~~---··
• • • ~ ~ ~ ~
~ () () () () ~ ~
0 ~ ~ ~ ~ ~ ()
~ ~ ~ ~ ~ () ()
Loss or partial loss of stable/ valuable IIi CVS eliminates CRE exposure to franchise IM earnings Ill IMD sale results in loss of stable/valuable Full exposure to CRE IM earnings Timing required 11!1 Trading of CVS?
1!11 Requires large equity investment without sale ofiMD
Ill Multiple transactions !iii CVS facilitates capital raise 1111 CVS oversight
__ 0--~--=~~eas:~~F~~~~=-~-~-~-=--~e:s_~~~~~~---== _ ~--~=~::;~~=-=~==~ G==~:~:-~:-~~~~=~~~=-·=--:~ -~~s~:~~~i.a~~~---J
5 1· A ·z· A -.:::::. -I·J , ·- J • .-.~ • •• .I~"Jt.. . -

(') 0 ~ ~ ~ > r--i
~ ~ ~ ~ ~
~ en -i e:J
r)> N I
)> I
0
8 8 ~
CONFIDEN'l'IA.L I . ==..J
Select Publicly Traded Broker-Dealer Comparables ($ in millions)
Goldman Merrill fvl:organ _Green [aJ_ Sachs Lynch (b) Stanley
Market Statistics:
Share Price (8/5/08) $20.24 $180.77 $28.22 $43.20 As% 52-Week High 31% 73% 36% 63%
As% 52-Week Low 163% 120% 116% 139%
Fully Diluted Market Capitalization $14,055 $74,785 $43,601 $49,164
Price as a Multiple of:
2008E Calendarized BPS (c) NM 10.7x NM 9.2x 2009E Calendarized BPS (c) 5.3x 9.0 10.4x 7.4
2010E Calendarized BPS (c) 4.9 8.3 9.1 6.4
Reported Common Book Value 0.61x 1.85x 1.35x 1.43x
Tangible Common Book Value 0.75 2.12 1.60 1.62
Other Statistics:
2008E ROE (b) NM 17.4% NM 15.2%
2009E ROE (b) 12.1% 18.2% 13.5% 16.4%
2010E ROE (b) 13.7% 16.9% 11.6% 17.2%
IBESLTG 10.5% 14.0% 12.0% 12.2%
Tier 1 Capital Ratio 13.3% 10.8% 10.5% 12.4%
Gross Leverage 21.1x 24.3x 25.5x 25.1x
Net Leverage 10.2 14.7 16.2 14.1
Capital Raise since 3Q '07 $14,902 $0 $25,800 $5,579
% of Equity (2Q '08) 57% 0% 63% 14%
Write-downs since 3Q '07 $10,830 $4,485 $29,700 $11,700
% of Assets (2Q '07) 1.7% 0.5% 2.8% 1.0%
Source: Campa'!)' filings, pffiss fY!kases and equity fY!search.
Peer Universe Mean Median
57%
125%
2.4x
8~9
8.0
1.55x
1:7.8
(2;6%)
16.0%
·15~2%
i2.7o/o
11,.2%
·zs;ax u;.o
63%
120%
3.3x 9.0
8.3
1.43x
1.62
4.0%
16.4%
W,90fo
12.2%
10;8%
25.lx 14;7
(a) Pro forma for capital raise since 2Q'08 and $23.8 billion reduction in asset levels per management assuming $4.1 billion pre-tax ($2.8 billion after-tax) loss on asset sales. (b) Includes expected write-downs in 3Q '08 for Merrill Lynch. (c) Based on IBES median consensus.
6 r AZAHD

(") 0 ~ ~ ~ )> ,.... --t fR
~ fR ~ en iTI 0
,.... )> N I
)> I
8 ~ N
Select Comparable Operating Statistics ($ in millions)
Goldman Merr.m Mor.ga:n Green (a) Sachs Lynch (b) Stanle:y
Balance Sheet Statistics:
Reported Common Book Value $20,487 $41,718 $32,297 $33,393
Tangible Common Book Value 16,386 36,441 27,233 29,503
Common Book Value Per Share $28.99 $97.49 $20.90 $30.11
Tangible Common Book Value Per Share 23.19 85.16 17.63 26.60
Gross Leverage 21.1x 24.3x 25.5x 25.1x
Net Leverage 10.2x 14.7x 16.2x 14.1x
Liquidity Position $45,000 $87,756 $98,292 $135,000
Tier 1 Capital Ratio 13.3% 10.8% 10.5% 12.4%
Total Risk-Based Capital Ratio 19.1% 14.2% 16.6% 18.6%
Net Assets $310,000 $653,514 $659,777 $579,124
Total Assets 621,658 1,088,145 1,048,346 1,031,228
Tangible Equity Capital 30,383 44,541 40,753 41,070
Total Stockholders' Equity 29,480 44,818 41,063 41,070
Eamjugs Statistics (IHES Median):
2009E Calendarized EPS $3.79 $20.14 $2.72 $5.81
2009E Operating ROE 12.1% 18.2% 13.5% 16.4%
Issuer Credit Rati~s (Outlook) (c):
S&P A(ON) AA- (ON) A(ON) A+ (ON) Moody's A2 (ON) Aa3 (OS) A2 (OS) Aa3 (WN)
S onrcc: Compa'!Y filings and press releases. (a) Pro forma for capital raise since 2Q'08 and $23.8 billion reduction in asset levels per management assuming $4.1 billion pre-tax ($2.8 billion after-tax) loss on asset sales. (b) Includes expected write-downs in 3Q '08 for Merrill Lynch. (c) ON- Oudook Negative; OS- Oudook Stable; WN- Watch Negative.
?{Az·A·R--D -~ . .-~ - .
I _ ____g_ONFIDENTIALJ