weaving the mat: longitudinal study of development of ...€¦ · • milani‐comparetti motor...
TRANSCRIPT

5/02/2013
1
Weaving the Mat:
Longitudinal Study of
Development of Children
with Visual Impairment
South Pacific Educators in Vision Impairment
Auckland, NZ
January 13, 2013

5/02/2013
2
Blind children can learn to walk just as soon as seeing ones, only they have to be led around in the beginning more frequently than the others.
‐ Kleig (1836)
Studies of blind children and their development indicate that the sequence of development is, in general, unchanged by blindness, while the appearance of the various developmental stages varies a great deal from individual to individual.
Lowenfeld (1956)
5/02/2013
3
The growth and development of the blind child is more LIKE than UNLIKE that of the sighted child. In each area his growth and development passes through the same sequence, but his rate may be slower due to direct and indirect influences of his visual impairment.
‐ Scholl (1973)
There is little hard evidence that the rate and sequence of development of visually handicapped infants are any different from those of sighted infants. It is even legitimate to question whether the knowledge of risk actually causes, rather than ameliorates, the problems that have been documented in some children.
‐ Ferrell (1986), p. 124

5/02/2013
4
Project PRISM Overview
• Funding from US Department of Education ($750,000)
• Four years of data collection• 202 children and their parents• Majority of children followed for 2 years or more
• 50 assessors, advisory committee members, consultants
Collaborating Agencies• Anchor Center for Blind
Children• Blind Childrens Center• Dallas Services for Visually
Impaired Children• The Foundation for Blind
Children• New Mexico School for
the Visually Handicapped Preschool
• Visually Impaired Preschool Services

5/02/2013
5
Laurie HudsonTom Miller
Debbie Gleason
Sharon BensingerTerry GoldfarbSuze Staugus
Earl PalmerMirna PinedaMary Ellen McCannMarion YoshidaDavid WarrenLynne Webber
J GreeleyAllen HuangJanis MountfordMadeline MilianBill MuirRichard GibboneyJohn JostadRose ShawBeth TeetersDean TuttleDin Tuttle
Chris TompkinsAmy MurphyKelly ParrishDiane Pena
Tina SustaetaKathy Tompkins
Patti Watts
Fran BlackBetty DominguezPatrika GriegoDana KingSharon Nichols
Carol DanielsonCarol King
Sally J. DeitzDeborah Hatton
KirchnerJim WarnkePrism PeoplePrism People
Brenda HoyJan Nash
Schel Nietenhoefer
Debbie SymingtonAnn Estensen
Pam CraneDonald P. Bailey
Verna HartMarianne Riggio
Stuart Teplin
Corinne
Research Question
Are there differences in the rate and sequence of development of young children with visual impairments?
5/02/2013
6
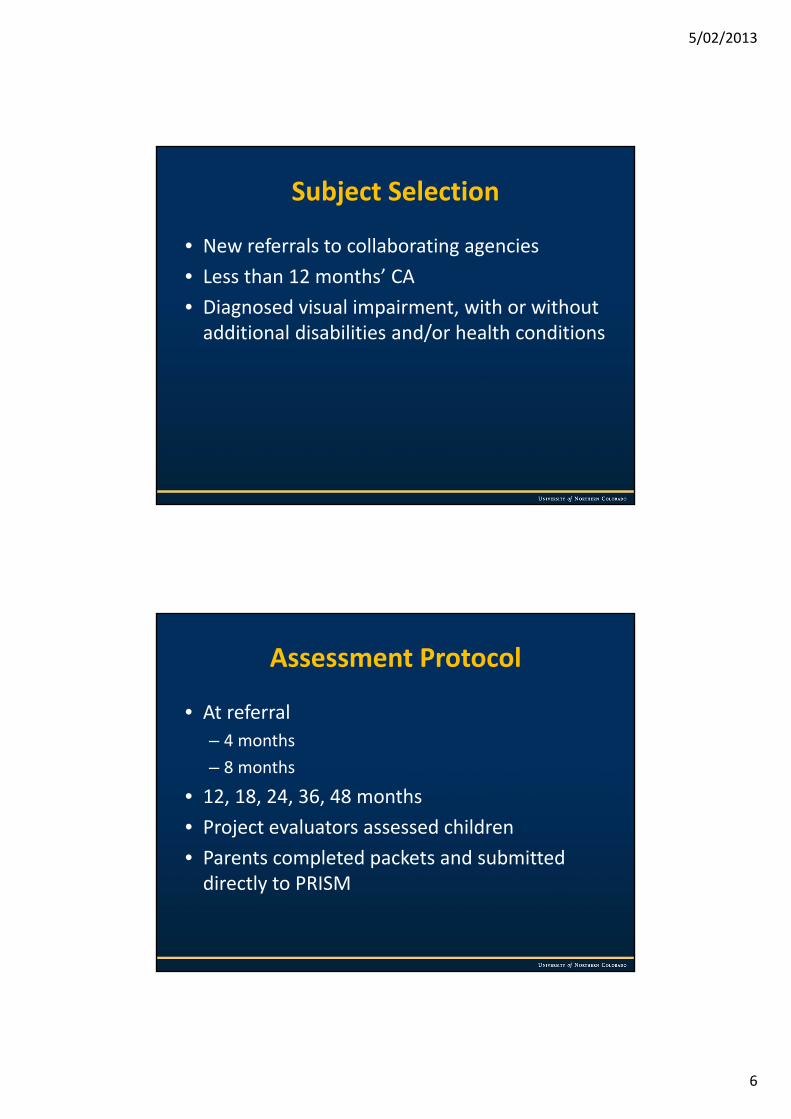
Subject Selection
• New referrals to collaborating agencies• Less than 12 months’ CA• Diagnosed visual impairment, with or without additional disabilities and/or health conditions
Assessment Protocol
• At referral– 4 months– 8 months
• 12, 18, 24, 36, 48 months• Project evaluators assessed children• Parents completed packets and submitted directly to PRISM

5/02/2013
7
Child Measures
• Teller Acuity Cards• Battelle Developmental Inventory
• Vineland Scales of Adaptive Behavior
• Temperament Scales
• Milani‐ComparettiMotor Development Screening Test
• ABILITIES Index• Medical and health questionnaires
Family Measures
• Demographic information• Parenting Stress Index• Family Resource Scale• Home Observation and Measurement of the Environment (HOME)

5/02/2013
8
Service Measures
• Amount, type, and extent of special education and related services
• Parent satisfaction with services• Primary interventionist’s perception of Family’s participation in services
Inter‐observer Agreement
Trainings Site Visits Project End
Battelle 85.9 92.9 80.6
HOME 88.4 95.1 85.4
Milani 85.6 89.7 75.8
Teller 83.6 89.7 91.0
Vineland 91.2 95.2 83.2
Mean 86.7 92.9 83.2

5/02/2013
9
Number of Assessments
Total Average per Child
Battelle 569 2.82
HOME 544 2.69
Milani 248 1.23
Teller 543 2.68
Vineland 542 2.68
Parent AssessmentsAssessment Number
Family Resource Scale 384Functional Status II® 409Health Questionnaire 406Income 343Evaluation of services 305Parenting Stress Index 375Public assistance 423Temperament 386

5/02/2013
10
Limitations
• All participants received services,– From specialized agencies for visual disabilities.
• The intensity, duration, and frequency of services differed across participants.– But didn’t seem to make much difference.
Birth Weights
Birthweight (grams)
5000.0
4750.0
4500.0
4250.0
4000.0
3750.0
3500.0
3250.0
3000.0
2750.0
2500.0
2250.0
2000.0
1750.0
1500.0
1250.0
1000.0
750.0500.0
Num
ber o
f sub
ject
s
40
30
20
10
0
Std. Dev = 1136.89
Mean = 2609.2N = 192.00

5/02/2013
11
Gestational Age at Birth
Gestational age at birth (weeks)
44.042.0
40.038.0
36.034.0
32.030.0
28.026.0
24.0
Num
ber o
f sub
ject
s90
80
70
60
50
40
30
20
10
0
Std. Dev = 6.06
Mean = 35.6N = 190.00
Hospitalization
Hospitalization after birth (days)
180.0170.0
160.0150.0
140.0130.0
120.0110.0
100.090.0
80.070.0
60.050.0
40.030.0
20.010.0
0.0
Num
ber o
f par
ticip
ants
90
80
70
60
50
40
30
20
10
0
Std. Dev = 43.43
Mean = 29.1N = 189.00

5/02/2013
12
Additional Disability
40%
22%
38%
None VI/Mild VI/Severe
(PRISM, n = 202)
Visual Disorders of PRISM Children
Number PercentCortical visual impairment 41 20.6
Retinopathy of prematurity 38 19.1Optic nerve hypoplasia 33 16.6Structural anomolies 22 11.1Albinism 16 8.0Retinal disorders 15 7.5Anoph-/microphthalmia 10 5.0All other 22 11.0Resolved 2 1.0

5/02/2013
13
T‐Test for Teller Card Scores
Visual Acuity N Mean
log s.d. t df Sig
Project entry 116 .1850 .4015 -.5150 115 .000
Project end 116 .3827 .4079
Changes in Visual Functionby Visual Disorder
0%10%20%30%40%50%60%70%80%90%
100%
Perc
ent
Improved
Declined
No change
(PRISM, n = 142)

5/02/2013
14
Additional Disability Riskby Visual Disorder
0
10
20
30
40
50
60
70
80
90
100
Perc
ent
VI/severe
VI/mild
None`
(PRISM, n = 199)
The primary question is not what you know, but how you know it.
(Aristotle)
The primary question is not what you know, but how you know it.
(Aristotle)
5/02/2013
15
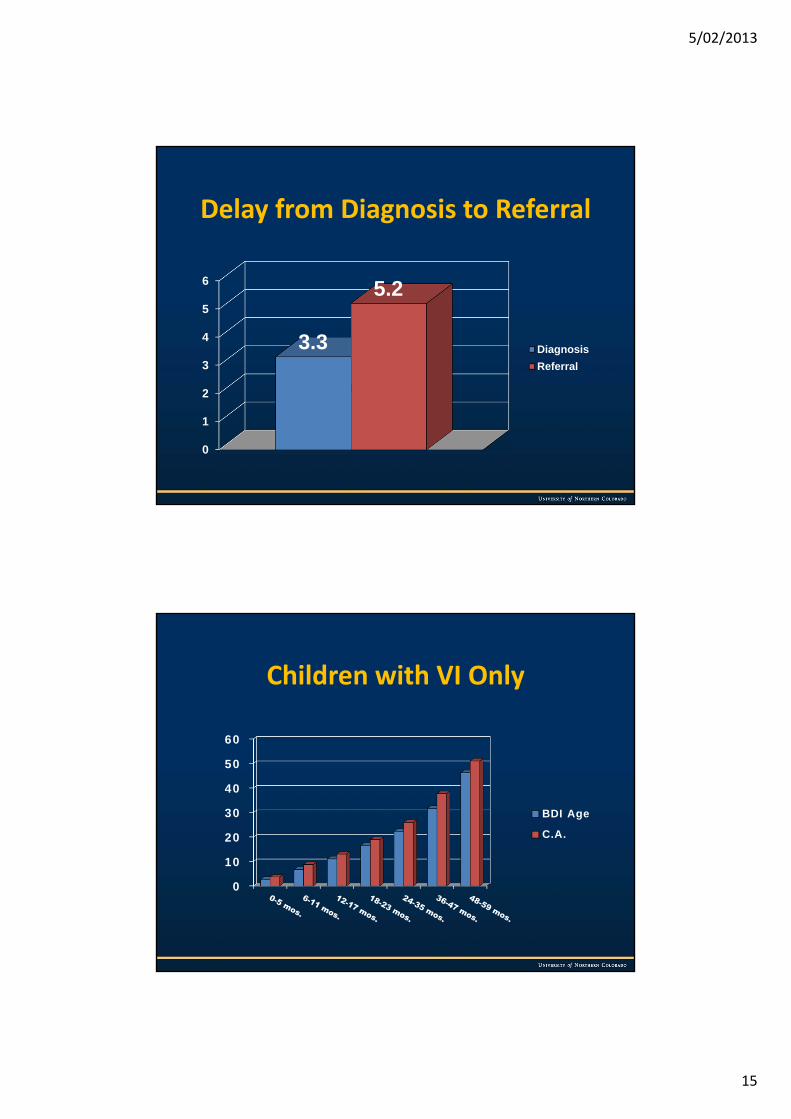
Delay from Diagnosis to Referral
0
1
2
3
4
5
6
3.3
5.2
DiagnosisReferral
Children with VI Only
0
10
20
30
40
50
60
BDI Age
C.A.
5/02/2013
16
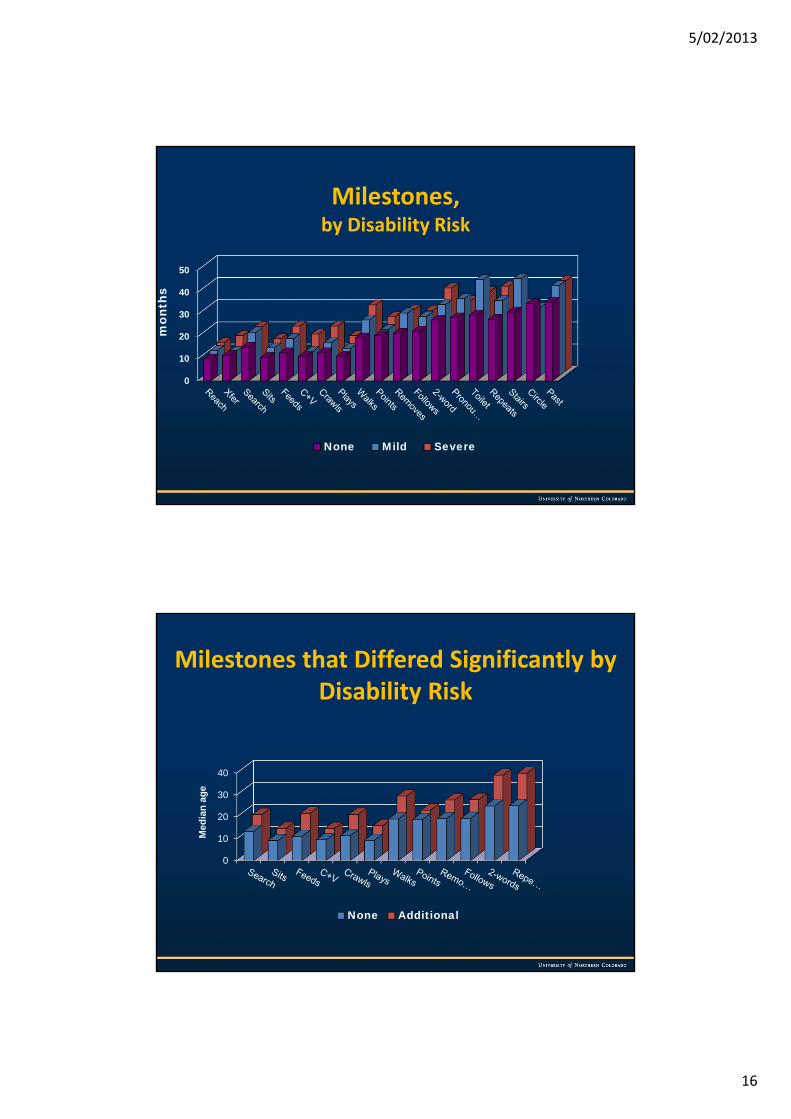
Milestones,by Disability Risk
0
10
20
30
40
50
mon
ths
None Mild Severe
Milestones that Differed Significantly by Disability Risk
0
10
20
30
40
Med
ian
age
None Additional
5/02/2013
17
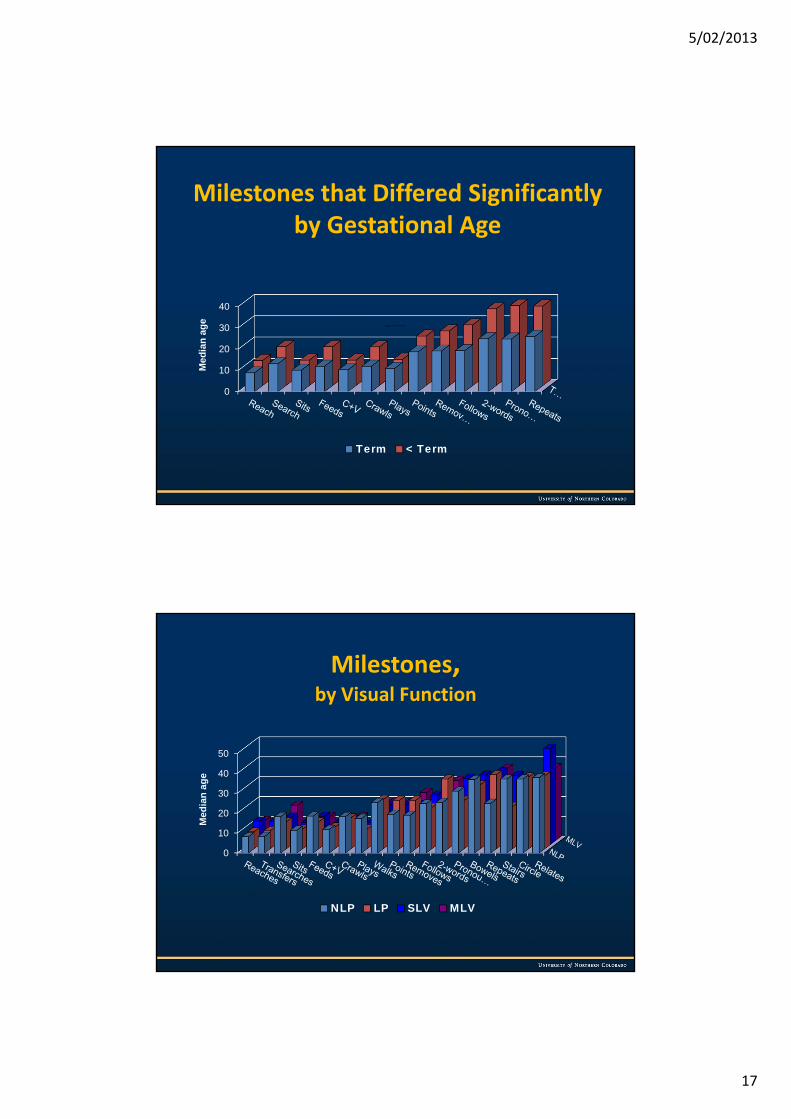
Milestones that Differed Significantly by Gestational Age
North 4 5.9 46.9 45 43.9
North 4 5.9 46.9 45 43.9
0
10
20
30
40
Med
ian
age
Term < Term
Milestones,by Visual Function
0
10
20
30
40
50
Med
ian
age
NLP LP SLV MLV

5/02/2013
18
Rate of Development,by Disability Risk
• Vineland & Battelle scores higher for children with no additional impairments, across almost all age groups– Not evident at 0‐5 mos.– At 48‐59 mos., mild additional disability similar to no additional disability
• Effects of mild impairment may disappear over time

5/02/2013
19
Parenting Stress Index
• Higher percentage of high scores than in the norming population– Not on child subscale at 0‐5 mos.– Higher scores primarily due to child subscale, not parent subscale
No Significant Differencesbetween additional disability groups
• Birth weight• Gestation• Parents’ age or education level• Parent evaluation of services• Primary interventionist’s rating of parent participation
5/02/2013
20
Significant Differencesbetween additional disability groups
• Battelle scores after 5 months• Age at entry
– Additional disability group entered later• Home learning environment at 18‐23 and 24‐36 months– Lower scores for additional disability group
• Hospitalization after birth– Longer for additional disability group
• Overall health between 6‐23 mos.– Additional disability group less healthy
• Child‐associated stress at 6‐11 mos.– Stress for parents of additional disability group greater

5/02/2013
21
Advantages Not Apparent
• Greater visual functioning• Specialized programs• Income• Home learning environment
Apparent Advantages
• Higher birth weights• No additional disability• Less hospitalization after birth

5/02/2013
22
Needed, Infancy to 18 Months
• More toys that are– Interactive– Manipulative– Problem solving
• More books• More literacy events
Did children with visual impairment attain developmental milestones at chronological ages that differ from sighted children?
• 12 milestones delayed• 5 milestones within the range of typical acquisition
• 2 milestones acquired early

5/02/2013
23
Did children with visual impairments attain developmental skills in a different sequence
than sighted children?
• 7 milestones acquired in a different sequence
• 3 acquired later:– Searching for dropped object– Feeding bite‐size pieces– Crawling 3 or more feet
• 3 acquired later by children with additional impairments:– Walking without support– Controlling bowel movements– Repeats 2‐digit sequences
5/02/2013
24
Were there differences in the rate and sequence of development among children with
different visual disorders?
• For 10 milestones, children with ROP acquired skills later than other children with visual impairments
• Children with albinism scored significantly higher Vineland and Battelle scores at ages 6‐11, 12‐17, and 18‐23 months.– Also at 24‐35 mos., but only for Battelle
• No significant differences at 36‐47 and 48‐59 months
Were there differences in the rate and sequence of development among children with
varying levels of visual function?
• Only one milestone demonstrated a significant difference among visual function levels:– Plays interactively with adults.– Children with NLP acquired later
• Differences not apparent for any other milestone

5/02/2013
25
• Milestones acquired in different order by visual function level,– But not statistically significant– No pattern is apparent
• No differences in Vineland and Battelle scores for 0‐5, 12‐17, or 36‐47 month age groups
• At 6‐11 and 18‐23 mos., children with moderate low vision scored significantly higher than children with NLP
• At 24‐35 and 48‐59 mos., children with moderate low vision scored significantly higher than children with NLP on the Battelle only

5/02/2013
26
Were there differences in the rate and sequence of development between groups of
children with and without additional disabilities?
• Children with additional disabilities generally acquired milestones later
• Age of acquisition was significantly later for children with additional impairments for 12 of 19 milestones
• Children without additional disabilities acquired some milestones (6) sooner, or within the range (4) of typical children
• Vineland and Battelle scores were significantly higher for children with no additional disabilities at all age groups except 0‐5 mos.
• At 36‐47 and 48‐59 mos., development of children with mild additional impairments were more like those with no additional impairment.

5/02/2013
27
Were there differences in the rate and sequence of development among children who differ along various social, cultural, or other
variables?• No differences in development apparent based on income, ethnicity, parent age, parent education, or other socio‐cultural variables.
• Age of acquisition for 13 milestones was significantly different for children whose gestation was full‐term.– Acquired milestones earlier.
Thoughts . . .
• For children receiving services, degree of visual loss may not have as great an impact on early development as the literature suggests
• Greatest impact seems to occur with the presence of additional disabilities– The more severe, the greater the impact

5/02/2013
28
• Children without additional disability and with typical intellectual functioning do develop within the normal range of their sighted peers– Nevertheless, they seem to be losing 1/10th of a month per month
• Children with additional disabilities comprised approximately 60% of this sample of young children
• Children with NLP at project entry still had NLP at project end
• Children with LP or greater tended to increase their visual function over time– Associated with age more than any other factor
5/02/2013
29
• Clinical judgments of project evaluators much better at observing present and predicting future visual function
• Children with CVI and ROP most at risk • Children with albinism least at risk
Implications
• Degree of visual disability is NOT the issue• Think about the words we choose and the messages we give

5/02/2013
30
An educator has to question himself or herself about options that are
inherently political, though often disguised as pedagogical to make them more acceptable within the existing structure. Thus, making
choices is most important. Educators must ask themselves on whose behalf
they are working.
(Paulo Freire)
Paihia Sculpture
Likewise we are the caregivers and teachersOf children who are growing up now, andIn the days to come.

5/02/2013
31
Together we can do more