weather risk management with weather derivatives
TRANSCRIPT

Weather Risk Management with
Weather Derivatives
Mark Rüegg, CEO CelsiusPro AG GARP, 12 June 2013
About CelsiusPro
CelsiusPro is specialized in structuring and originating weather certificates. For premiums starting from EUR500 and based on the weather data provided by national weather stations, CelsiusPro offers tailored solutions to hedge against financial losses due to adverse weather.
Core Services: Structuring and Origination of Weather Certificates (OTC Options) Distribution partnerships for White Labelling and Introducing Broker Partners Weather Sensitivity Analyses for Corporates Front-to-back Online Platform for Ceding Companies interested in offering Weather-Index-Based Insurance Solutions Weather Sensitivity Analyses of Insurance Portfolios Structuring of parametric Reinsurance Contracts Micro-Weather-Index Solutions Swiss Re is CelsiusPro’s strategic partner for weather risk management and risk transfer Aon Benfield UK is CelsiusPro’s strategic partner for weather sensitivity analyses and reinsurance solutions for weather dependent insurance portfolios. CelsiusPro is member of the Weather Risk Management Association (WRMA).
2

3
Part 1 - Climate Change and Environmental Stress
Weather More than just a small talk topic.

4
Number of Tornadoes 161 = April average during the past decade.
0
100
200
300
400
500
600
# To
rnad
oes
per
mon
th
Number of Tornadoes in the US
161
542 875
267
267 = April record set in April 1974.
875 = April 2011 – NEW RECORD! 542 = Record during any month set in May 2003.

5 Source: http://nsidc.org/arcticseaicenews/charctic-interactive-sea-ice-graph/
Arctic Sea Ice Extent (Area of ocean with at least 15% sea ice)

Glaciers Since 1980, a representative set of well studied glaciers has lost the equivalent of 40ft.(12.5m) of water on average. The graph shows the average mass balance of 30 reference glaciers around the world.
Temperature Earth’s overall temperature has increased by 1.3°F (0.7°C) since 1900. In the graph, average annual surface temperature is shown as the difference from the average for 1901-2000.
Spring Snow Cover Earlier melting of winter snow has reduced the area of land covered by snow in spring. The graph shows the area covered by snow in the N. Hemisphere during March and April, shown as the difference from the 1971-2000 average.
Source: National Oceanic and Atmospheric Administration (NOAA)

7
Ocean Heat More than 90% of the warming that has occurred on Earth over the past 50 years has occurred in the ocean. The graph shows heat energy in the top 700m of the ocean as the difference from the average from 1955-2006.
Sea Level The average height of the ocean’s surface has increased by 8.25”(210 mm) since 1880. The graph shows mean global sea level measured by tidal gauges since 1880 and by satellite instruments since 1993.
Source: NOAA
Arctic Sea Ice The area of the Arctic where sea ice remains frozen at the end of summer has decreased by more than 10% per decade since 1979. The graph shows the average area with at least 15% sea ice on its surface each September.
Source: National Oceanic and Atmospheric Administration (NOAA)

Climate Change - Trends
8
Source: IPCC, Intergouvernemental Panel on Climate Change
IPCC identifies three major effects of climate change on temperature and precipitation: Trend of warmer temperatures
Trend of more extreme temperatures
Trend of heavier precipitation and more intense and longer droughts.

Climate change matters
9
Source: Global Risks 2011 Sixth Edition, WEF
Global Risk Landscape – WEF 2011
Risk Interconnection Map
Billi
on U
SD
Perceived likelihood to occur in the next 10 years

10
Natural disasters in the United States, 1980-2012
Source: Munich Re

Weather. A driving force behind supply and demand for products and services.
11
Part 2 - Economic Consequences of Climate Change

12
Weather Derivatives
Weather-sensitive industries
Transportation Utilities Travel and Leisure
Construction/Mining Events Retail and Wholesale
Agriculture Marketing Renewable Energy

Supply: Weather is key production factor for renewable energy
13
World energy production is supposed to become “greener” with increased use of renewable energy sources. Weather is the key production factor. Demand is increasing.
Solar Power Bio Fuel
Wind Power Hydro Power

Supply: Weather is key production factor for food
14
World food production is supposed to feed an increasing population. Weather is the key production factor for staple food. Demand is increasing.
Corn/Maize Rice
Potato Wheat
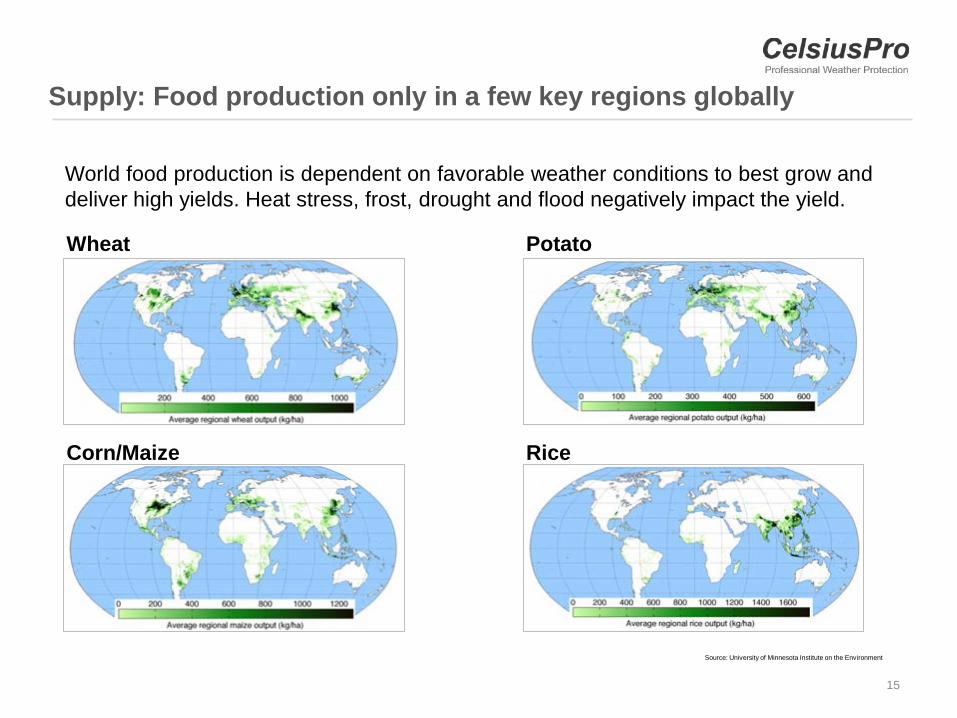
Supply: Food production only in a few key regions globally
15
Wheat
Corn/Maize Rice
Potato
Source: University of Minnesota Institute on the Environment
World food production is dependent on favorable weather conditions to best grow and deliver high yields. Heat stress, frost, drought and flood negatively impact the yield.

Demand: Population growth affects food demand
16
17
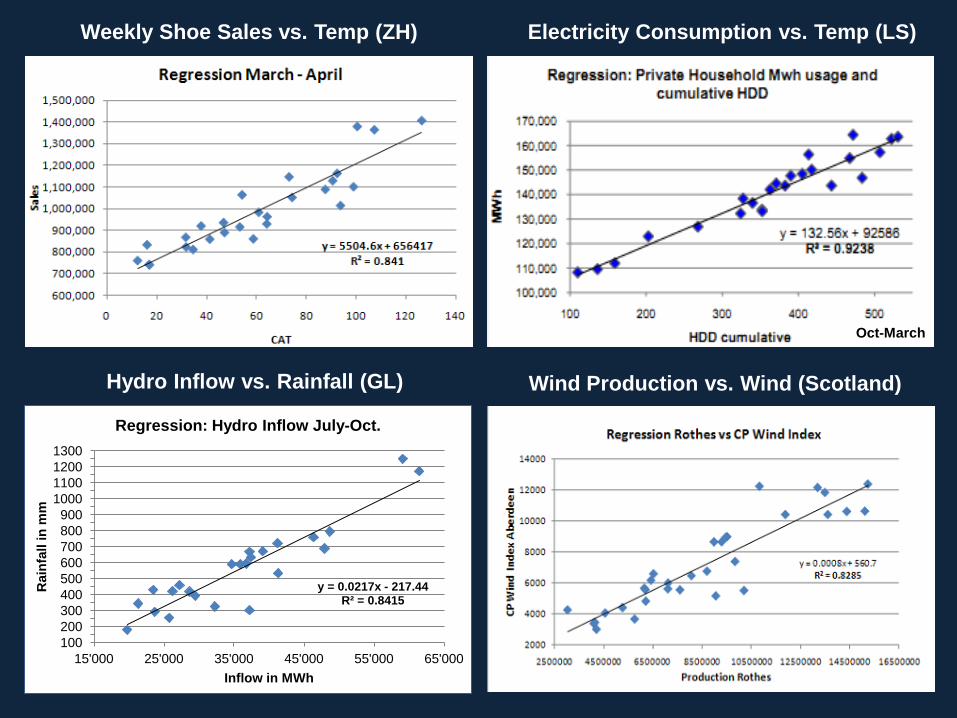
Weekly Shoe Sales vs. Temp (ZH)
Hydro Inflow vs. Rainfall (GL)
Electricity Consumption vs. Temp (LS)
Wind Production vs. Wind (Scotland)
Oct-March
y = 0.0217x - 217.44 R² = 0.8415
100 200 300 400 500 600 700 800 900
1000 1100 1200 1300
15'000 25'000 35'000 45'000 55'000 65'000
Rai
nfal
l in
mm
Inflow in MWh
Regression: Hydro Inflow July-Oct.

18
The effect of weather on sales can be calculated ..
Source: Weather Trends Int.

19
Part 3 – ART (Alternative Risk Transfer)
Weather. Where re-insurance business meets capital markets. Weather risk is split in two categories: Catastrophic Risk: low-frequency high-severity Non-Catastrophic Weather Risk: high-frequency low-severity
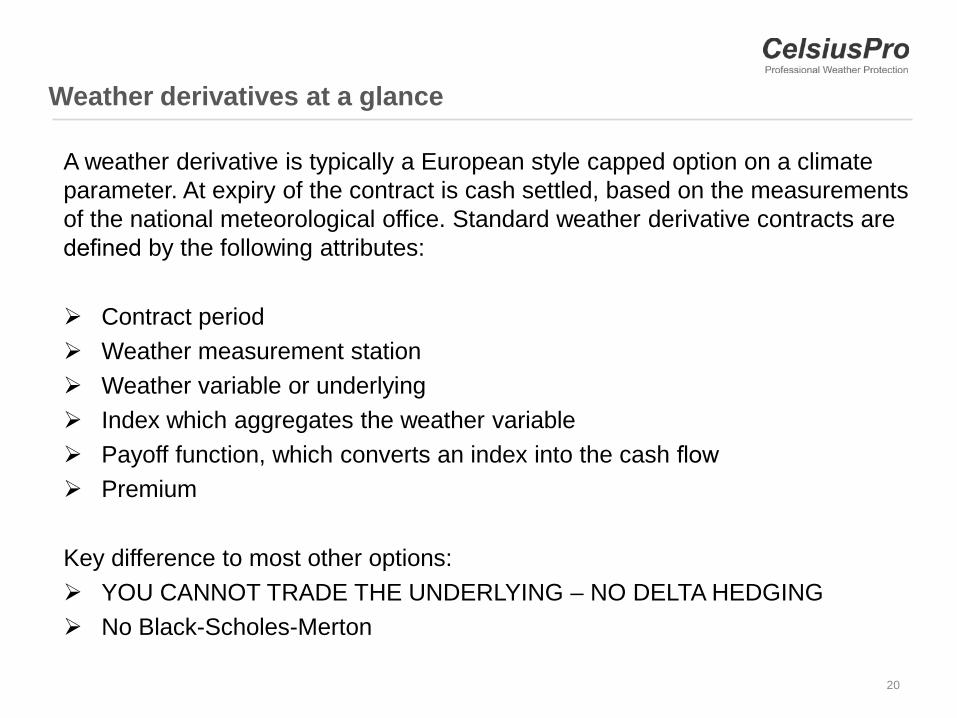
Weather derivatives at a glance
A weather derivative is typically a European style capped option on a climate parameter. At expiry of the contract is cash settled, based on the measurements of the national meteorological office. Standard weather derivative contracts are defined by the following attributes:
Contract period Weather measurement station Weather variable or underlying Index which aggregates the weather variable Payoff function, which converts an index into the cash flow Premium Key difference to most other options: YOU CANNOT TRADE THE UNDERLYING – NO DELTA HEDGING No Black-Scholes-Merton
20

6 Terms you need to be familiar with
Weather Station, Risk Period, Weather Trigger (Threshold), Strike (Excess), Defined Payout per Index Point, Maximum Payout
1. The Weather Station is the official measurement station operated by the met office
which is used for price calculation and settlement.
2. The period from Start Date to End Date is the Risk Period.
3. The Weather Trigger (Threshold) defines when a day counts as a Critical Day. (Weather derivative indices can have none, one or multiple thresholds)
4. The Strike defines the amount of Index Points of own risk. The option starts to pay once the number of cumulative Index Points during the Risk Period exceeds the Strike.
5. The Payout per Index Point is the amount paid for every Index Point in excess of the Strike.
6. The Maximum Payout is the cap of the option. 21
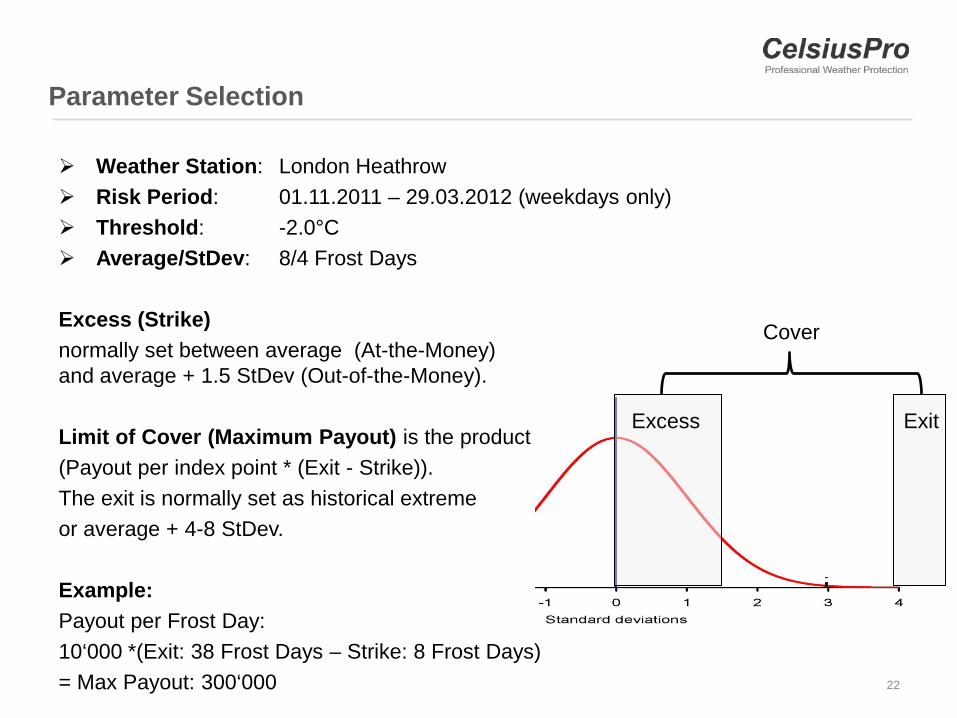
Weather Station: London Heathrow Risk Period: 01.11.2011 – 29.03.2012 (weekdays only) Threshold: -2.0°C Average/StDev: 8/4 Frost Days Excess (Strike) normally set between average (At-the-Money) and average + 1.5 StDev (Out-of-the-Money). Limit of Cover (Maximum Payout) is the product of: (Payout per index point * (Exit - Strike)). The exit is normally set as historical extreme or average + 4-8 StDev. Example: Payout per Frost Day: 10‘000 *(Exit: 38 Frost Days – Strike: 8 Frost Days) = Max Payout: 300‘000
Excess Exit
Cover
Parameter Selection
22

Payout Function
Payout Function Example: Strike: 8 Critical Days; Payout per Critical Day: 10k, Limit of Cover: 300k Payout Formula: The higher of zero or ((Number of Critical Days at End Date – Excess) * Payout per Critical Day), limited by the Limit of Cover (Max. Payout)
Example: Strike: 8 Payout per Critical Day: 10k Maximum Payout: 300k Critical Frost Days @ Expiry: 20 -> Payout: 120k Critical Frost Days @ Expiry: 7 -> Payout: 0 :
0
50000
100000
150000
200000
250000
300000
350000
0 2 4 6 8 10 12 14 16 18 20 22 24 26 28 30 32 34 36 38 40
Frost Day Payout Profile
23

Weather derivatives at a glance cont.
Weather derivatives are available from
Chicago Mercantile Exchange (since 1999) Products only available for major cities and selected indices (frost, snowfall, rain, HDD, CDD)
OTC market and weather risk specialists Location-specific products available Indices tailored to individual company’s weather exposure
Weather derivatives vs. insurance
Payout based on measurements at official weather stations No proof of losses or damages are required
24
Weather Derivatives

Traded @ Product Description
Exchange Industry Loss Warranties IFEX - The buyer selects … Insured event (e.g. tropical wind) Trigger in total industry loss units (Industry Loss Index
provided by PCS)
Hurricane Futures & Options CME Hurricane Index™ (CHI™) measures the potential damage from a hurricane by reference to its maximum wind velocity and size
Binary options are used in the same way as the Industry Loss Warranties
Hurricane Risk Landfall Options Call options on whether and where a hurricane will make first landfall on the U.S. Atlantic and Gulf coasts
National Hurricane Center determines whether a storm made landfall as a hurricane
Premiums aggregated into mutual risk pool Payout is pro rata share of the pool
Weather Derivatives Products are only available for major cities in the US Selected indices (HDD, CDD, frost, snowfall, rainfall)
OTC Cat Bonds alternative to traditional reinsurance, event triggered by natural catastrophe insurance company issues bonds (through) investment
bank no-event situation: Insurance company pays coupon to
investors event situation: principal is forgiven, money used to
pay claims
Weather Derivatives location- specific products available indices tailored to individual company’s weather
exposure

26

27
Weather Derivatives
Agriculture - Landkom Case
28
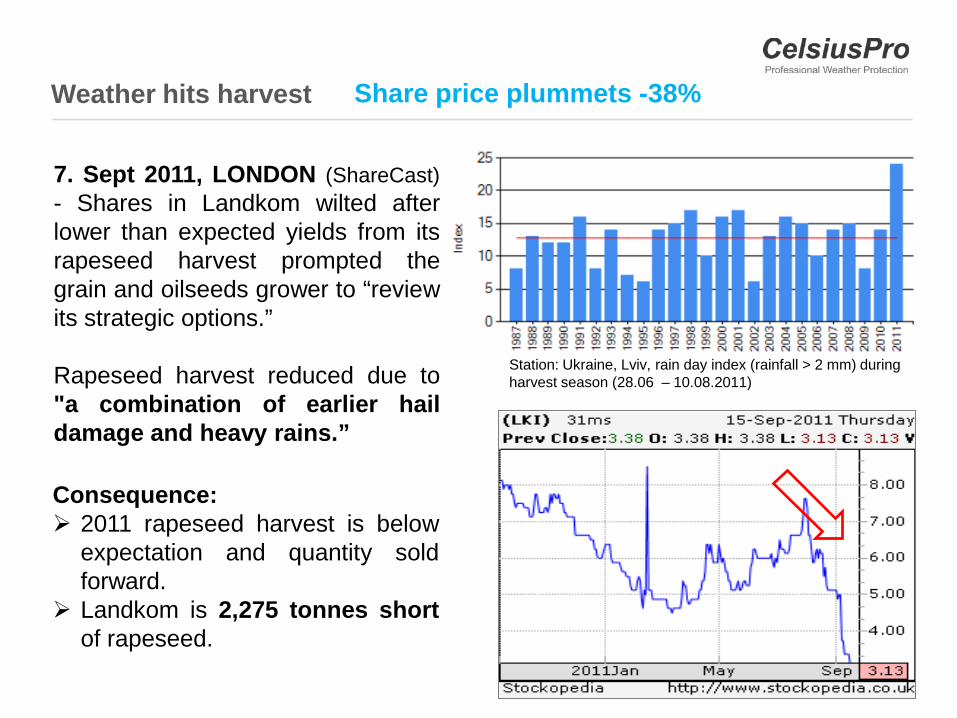
Weather hits harvest
7. Sept 2011, LONDON (ShareCast) - Shares in Landkom wilted after lower than expected yields from its rapeseed harvest prompted the grain and oilseeds grower to “review its strategic options.” Rapeseed harvest reduced due to "a combination of earlier hail damage and heavy rains.”
Station: Ukraine, Lviv, rain day index (rainfall > 2 mm) during harvest season (28.06 – 10.08.2011)
Consequence: 2011 rapeseed harvest is below
expectation and quantity sold forward.
Landkom is 2,275 tonnes short of rapeseed.
Share price plummets -38%

29
Weather Hedge with a Rain Day Call Option
Hedge against above average Rain Days during harvest: Weather Station: Lviv Risk Period: 28/06 - 10/08.2011 Rain Day: Rainfall > 2mm Strike: 13 Rain Days Payout per Rain Day: EUR 100k Maximum Payout: EUR 1’000k
0
200'000
400'000
600'000
800'000
1'000'000
1'200'000
11 12 13 14 15 16 17 18 19 20 21 22 23 24
Payo
ut in
EU
R
Number of Rain Days
Rain Day Call Option

30
Hedging Weather Risk in Energy
Electricity Prices in Victoria, AU

31
Energy – Electricity Prices in Victoria, AU
The demand for electricity is highly weather dependent. Cold winter weather increases the demand for energy used for heating. Hot summer weather increases the demand for energy used for cooling.
Vicoria has predominantly fossil fired energy production (Cole and gas), no Nukes and very little Hydro power. Power is exchange traded at d-cyphaTrade Exchange on a 30 min basis.
32
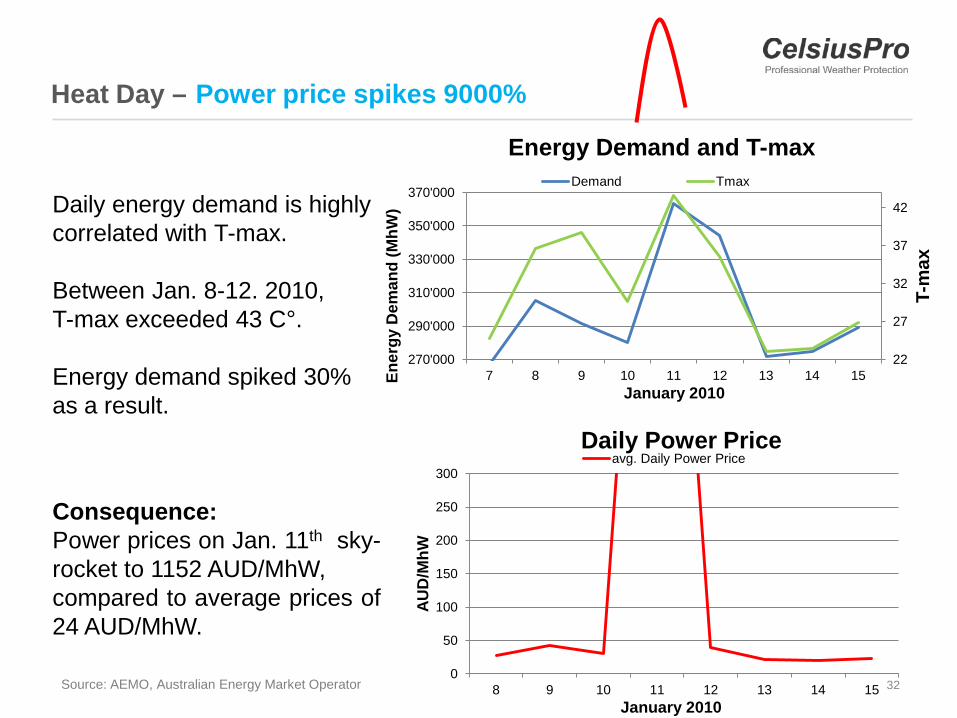
Heat Day –
Daily energy demand is highly correlated with T-max. Between Jan. 8-12. 2010, T-max exceeded 43 C°. Energy demand spiked 30% as a result.
0
50
100
150
200
250
300
8 9 10 11 12 13 14 15
AUD
/MhW
January 2010
Daily Power Price avg. Daily Power Price
22
27
32
37
42
270'000
290'000
310'000
330'000
350'000
370'000
7 8 9 10 11 12 13 14 15
T-m
ax
Ener
gy D
eman
d (M
hW)
January 2010
Energy Demand and T-max Demand Tmax
Consequence: Power prices on Jan. 11th sky-rocket to 1152 AUD/MhW, compared to average prices of 24 AUD/MhW.
Source: AEMO, Australian Energy Market Operator
Power price spikes 9000%
33
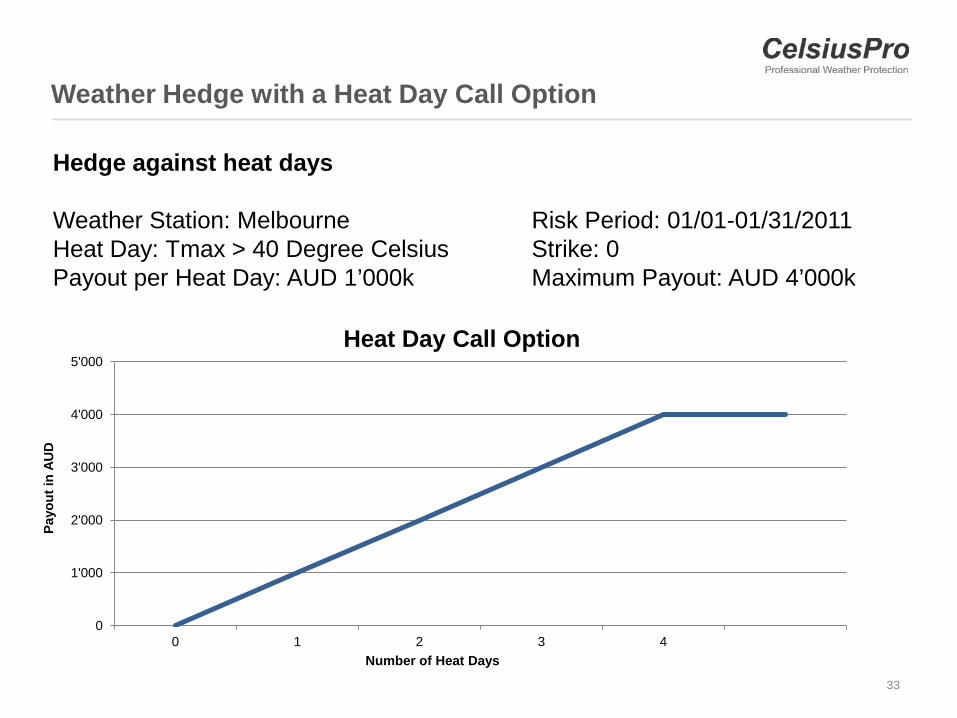
Weather Hedge with a Heat Day Call Option
Hedge against heat days Weather Station: Melbourne Risk Period: 01/01-01/31/2011 Heat Day: Tmax > 40 Degree Celsius Strike: 0 Payout per Heat Day: AUD 1’000k Maximum Payout: AUD 4’000k
0
1'000
2'000
3'000
4'000
5'000
0 1 2 3 4
Payo
ut in
AU
D
Number of Heat Days
Heat Day Call Option

34
You can debate the cause but fact remains, the climate is changing!
Source: NOAA, Temperature Anomalies September 2011 with respect to base period 1971-2000
Weather Derivative: Parametric risk transfer product Uncorrelated investment product

35
Contact
Mark Rüegg, Executive MBA, CFA Founder & CEO (+41) 44 205 99 11 [email protected] www.celsiuspro.com www.twitter.com/celsiuspro