weather issues all over, but… - fats and oils
TRANSCRIPT

MarketingCommunication
October2018AFOAOutlookForum,NYC
StefanVogelGlobalSectorStrategist,Grains&OilseedsHeadofAgriCommodityMarketsResearch
GlobalOutlookonAgriculture

2

Weatherissuesallover,but…
3
WorstdroughtinEUandArgentinain>20years.DroughtinAustralia&issueselsewhere.
Source:Rabobank2018
average
Belowaverage
BaddroughtBaddrough
Baddrough
Slightlyaboveaverage

DespiteWorstdroughtimpactinEU&Argentinain>20years
4
Justimaginewherepriceswouldbeifallcountrieshavearecordcrop…
Source:Bloomberg,Rabobank2018
0
100
200
300
400
500
600
700
1996 1997 1998 1999 2000 2001 2002 2003 2004 2005 2006 2007 2008 2009 2010 2011 2012 2013 2014 2015 2016 2017 2018
USD/
tonne
CBOT Wheat CBOT Soybeans +/- 20% of average CBOT Wheat
+/- 20% of average CBOT Soybeans CBOT Corn +/- 20% of average CBOT Corn

TradeWarsonthepoliticalagenda
5

USagricommoditiesheavilyimpactedreliantonexports
6Source:USDA,Rabobank2018

WHEAT

2018WHEATproductionshortfallinEU&Australiaand‘normalized’Russiancrop
8
Changeinproductionvs2017
-25,000
-20,000
-15,000
-10,000
-5,000
0
5,000
1000
t
2018 vs 2017 2019 vs 2017 Source:USDA,Rabobank2018

RussianWheatpricesliftoffagain
9
Russianwheatpricesreflectstrongexportdemand(whichareup20%yoyto15mtforJul-Sep,despitea20%loweryoyexportpotentialof33mtvs40mt)
Source:BSG,Rabobank2018
Biggestbullfactor:PotentialRUSSIANexport
restrictions

GlobalWheatwithlargestdeficitin15years
10
Butwhatwilltheyearafterbring?
Update
-40
-20
0
20
40
60
80
300
350
400
450
500
550
600
650
700
750
800
Mill
ion
tonn
es
Mill
ion
tonn
es
Surplus/Deficit (RHS) Production Total consumption Source:USDA,Rabobank2018

2019WHEATproduction(assumingaverageyields)bringsenough
11
Changeinproductionvs2017.
-25,000
-20,000
-15,000
-10,000
-5,000
0
5,000
1000
t
2018 vs 2017 2019 vs 2017

USwheatpricesforlate2019niceforfarmers,butEUpricesmorerealist!
12
+40%
+20%
Source:Bloomberg,Rabobank2018

13
CORN

Corn:RecordUSyield,butdon’tunderestimatedemand
14
YOYchangeincornfeedingglobally(outsideUS)underestimated!
0
50
100
150
200
250
0
100
200
300
400
500
600
700
USc/
bu
December 2018 Wheat-Corn Spread (RHS) CBOT Corn CBOT Wheat
Record$2/buWheat-Cornspreadtodrivecornfeedingdemandin2018/19
-20
-10
0
10
20
30
40
mlnto
nnes
corn wheat wheat&corn
Source:USDA,Rabobank2018

UScornbalance:Bullsneedyieldshortfallandstronguse,bearslookatASF&recordyield
15
2017/18sawexportsunderestimatedby600mbu!Willhistoryrepeat?Yes,butNO!
Source:USDA,Rabobank2018
SepWASDE bear bull% Change 16/17 17/18 (f) 18/19(f) 18/19(f) 18/19(f) Beginning Stocks 1,737 2,293 2,002 2,140 2,140Yield 174.6 176.6 181.3 183.0 180.0Production 15,148 14,604 14,827 14,964 14,719 Total Supply 16,942 16,937 16,879 17,154 16,909MY Exports 2,294 2,425 2,400 2,400 2,500Feed Consumption 5,470 5,450 5,575 5,400 5,600FSI Consumption 6,885 7,060 7,130 7,130 7,130Ethanol Usage 5,438 5,600 5,625 5,625 5,625 Total Consumption 12,355 12,510 12,705 12,530 12,730 Total Usage 14,649 14,935 15,105 14,930 15,230Ending Stocks 2,293 2,002 1,774 2,224 1,679Stocks/Usage 16% 13% 12% 15% 11%

16
USexports&exportsales50%upYOYsofar
CornexportpotentialfromkeyexportersexclUSatstronglevels
US2019/20cornexportswithastrongstart,butcompetitionwillbestiff
0
20
40
60
80
100
2015/16 2016/17 2017/18 2018/19mlnto
nnes
Ukraine Brazil Argentina othersSource:USDA,Rabobank2018
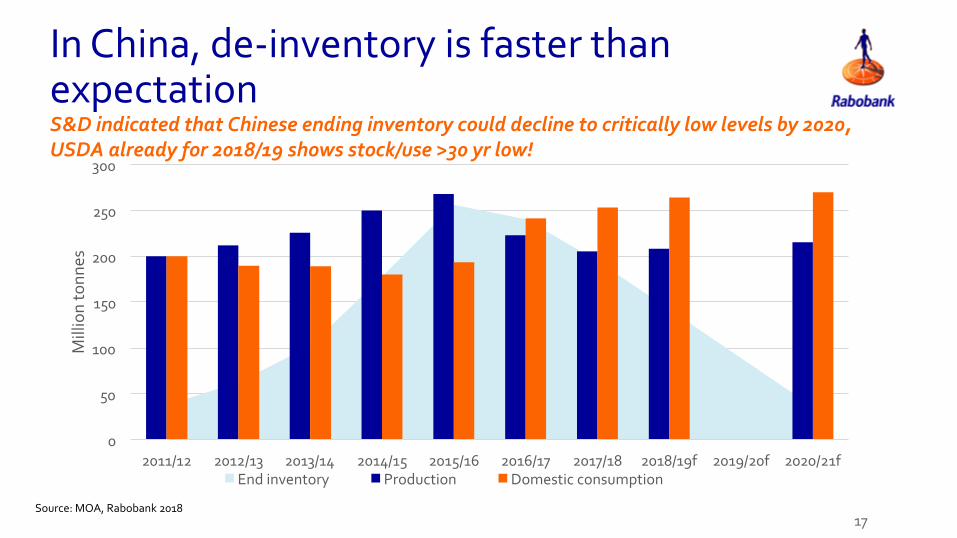
InChina,de-inventoryisfasterthanexpectation
17
S&DindicatedthatChineseendinginventorycoulddeclinetocriticallylowlevelsby2020,USDAalreadyfor2018/19showsstock/use>30yrlow!
0
50
100
150
200
250
300
2011/12 2012/13 2013/14 2014/15 2015/16 2016/17 2017/18 2018/19f 2019/20f 2020/21f
Milliontonn
es
Endinventory Production Domesticconsumption
Source:MOA,Rabobank2018

18
RecordWheat-Cornspreadtodrivecornfeedingdemandin2018/19
UScornandsoybeanpricesheavilydependonexports…Whatiftheydisappoint?!
Source:Bloomberg,Rabobank2018
LowUSexports
Resolvedtradewars

SOYBEANS

USsoybalance:Thedarksideoftradewars:potentially>1bnbuendingstocks
20
ContrarytoCorn,USDAdoesnotunderestimateuse.USsoybeanstockstopotentiallyhitmorethan1bnbu!
Source:USDA,Rabobank2018
SepWASDEOctWASDEtradeissue(Mln acres/Mln bu.) 16/17 17/18 (f) 18/19(f) 18/19(f) 18/19(f) Beginning Stocks 197 302 395 438 438 Yield 52.0 49.1 52.8 52.8 52.8 Production 4,296 4,392 4,693 4,693 4,693 Total Supply 4,515 4,715 5,113 5,156 5,156 MY Exports 2,166 2,130 2,060 2,060 1,950 Crush 1,901 2,055 2,070 2,070 2,055 Domestic Consumption 2,047 2,191 2,208 2,208 2,193 Total Usage 4,214 4,321 4,268 4,268 4,143 Surplus/Deficit 105 93 450 450 576 Ending Stocks 302 395 845 888 1,014 Stocks/Usage 7% 9% 20% 21% 24%

SingledigitUSsoybeanexportstoChinain2018/19?
21
USmightshipsomesoybeanstoArg/Brazilbutrequiresstrongmarketshareinrestofworld
3628
9
46
60
73
6 3 62 2 22 3 30 1 2
0
10
20
30
40
50
60
70
80
2016/17 2017/18 2018/19USA Brazil Argentina Canada Uruguay Others
Source:IEG,Rabobank2018

USsoybeanexportsdilemma…TheUSneedseither100%marketshareoutsideofChinaorpricebackintoChina
22
USsoybeanexportsareasbigasWorldexcl.Chinaimports,requiringtheUStogain~100%marketshareortogetChinabackintothetrademix
Source:USDA,Rabobank2018

PerfectlytimedimplementationofChinesedutiesonUSsoybean
23
ChinaintroduceddutiesinMay,whenanywaynoUSsoybeansgotoChina.But…
-
2,000
4,000
6,000
8,000
10,000
Oct Nov Dec Jan Feb Mar Apr May Jun Jul Aug Sep
mlnto
nnesperm
onth
Min Range avg 2017-18

TotalUSsoybeanexportsstrongerthanusual…supportingprices
24
-
2,000
4,000
6,000
8,000
10,000
12,000
Oct Nov Dec Jan Feb Mar Apr May Jun Jul Aug Sep
mlnto
nnesperm
onth
typicalUSexportstoworld Range avg 2017-18
USgainedmarketshareinimportcountries(exChina)duetopricediscount

HowtoalignUSexportswithworldexclChinaimportpattern?
25Source:USDA,Rabobank2018
Globalmonthlyimportsexcl.Chinaof3mto6mtonnespermontharenotenoughtoabsorbthetypicalhighUSpostharvestexportsinOct-Dec

Tradewar&pricingstructure:…SouthAmericansoybeansatUSD400/t,whileUSsoybeansarewellbelowduetothe25%duty
26
SpreadbetweenBrazilianandUSsoybeanpriceswillprevail,butseasonallywillchange
Source:USDA,Rabobank2018

WavingChineseimports?OrflatteningBrazilianExports?
27
ShowingtheneedtogetmoreSouthAmericansoybeanexportsinespeciallyNov-DectoChina.
Source:USDA,Rabobank2018
-4
-2
0
2
4
6
8
10
12
14
Jan Feb Mar Apr May Jun Jul Aug Sep Oct Nov Dec
milliontonn
es
Braziliantotalexports Arg,Can,Ugytotalexp TotalChineseimports
EarlyharvestedParanasoybeansnotenough!
HowtomeetChina’sDecdemand?Can,Ru,Ukrnotenouth
AlmostsufficientChineseOct-Novcoverage.

TheWorldoutsideoftheUS…canjustaboutmeetChina’sdemand,butonlyifChinaget’s~100%oftheexports
28
Chinaisexpectedtoimport95mtonnes,equivalenttoallsoybeansexportedbycountriesotherthantheUS
Source:USDA,Rabobank2018
75
86 6 3 3 1
Chinaimportpotential,94
0
10
20
30
40
50
60
70
80
90
100
Brazil Argentina Paraguay Canada Uruguay Ukraine Russia
mlnto
nnes
8512

TheOutlookfor2019withSouthAmericancurrenciesunderpressure
29
Productionisbeingincentivisedinmanyproducingcountries…butnotintheUS.
Source:Bloomberg,Rabobank2018

Brazil…4-6%acreageexpansionkeepsproductionaboutunchangedat120mt,butgoodyieldsarerequired!!
30
Exportsmighthit80mtvs76mtincurrentseason,requiringaslowercrush.
0
20,000
40,000
60,000
80,000
100,000
120,000
140,000
AreaHarvested Production Exports Crush
1000
tonn
es
2015/16 2016/17 2017/18 2018/19 2018/19alternative
Source:USDA,Rabobank2018

Argentineexporttaxchanges:Soybeansgainincompetitivenessrelativetograins
31
WeakArgentinepesobenefitsexports,whilefarmingcostsareonly55-60%inUSD(fertilizer,seed,…)while40-45%isinARS(labor,fuel,…)
Source:Rabobank2018
GoodnewsforArgentinebiodiesel:EUComdecidednottoreinstateimporttariffsonimportedArgentinebiodiesel(fornow!FurtherInvestigationswilltakeplace)

SouthAmericansoybeanproductioncouldhitanewrecordin2019
32
Closeto200mtofproductionanda12%to17%recoveryfromthisyear!
97115 120 121
5955 38
57
170185
171193
0
50
100
150
200
2015/16 2016/17 2017/18 2018/19
mlnto
nnes
Brazil Argentina Paraguay Bolivia Uruguay
Source:USDA,Rabobank2018

ElNiño–ARealThreatin2018/19?
33
Riskhasbeensomewhatloweredrecently,butstillafactortowatch
Source:AustralianBureauofMeteorology,Bloomberg,NOAA,Rabobank2018
-40
-30
-20
-10
0
10
20
30
SO
I
El Niño threshold La Niña threshold Southern Oscillation Index (SOI) 5-month moving average
Moderate Weak Moderate/Weak
Strong WeakStrong
StrongStrong/Moderate
Previous El Niño
ENSOAlertSystemStatus:ElNiñoWatchEquatorialseasurfacetemperatures(SSTs)arenear-to-aboveaverageacross
mostofthePacificOcean.Thereis~55%chanceofElNiñointheNorthernHemispherefall2018(September-November),increasingto~70%duringwinter2018-19.

PotentialImpactsofaSouthernHemisphereElNiñoEvent
34
Bothunfavourableandfavourableimpactsarepossibleforagricommodities
Source:NOAA,Rabobank2018
AustraliaDrierandwarmer-than-normal
SouthEastAsiaDrierandwarmer-than-normal
IndiaOftenareductionintheintensityoftheIndianMonsoonSouthernUSCanadaandnorthernUScanseemildwinters,whiletheUSsouthernstatescanexpectawetter-than-normalwinter
BrazilWetter-than-normalconditionsareoftenexperiencedacrosssouthernBrazil,whilenorthernBrazilcanexperiencedryness.

USchangeinplantingsfor2019:Lesssoybeans,buthowmuch?
35
Soy/cornpriceratioat2.3forend2018andend2019,callsforsomemorecorn,butnotadramaticcutinsoyacreage,whilemarketactuallyneedsa4-5macrescutinsoybean
1.9
2.1
2.3
2.5
2.7
2.9
3.1
3.3
3.5
3.7
3.9
Dec-12
Feb-13
Apr-13
Jun-13
Aug
-13
Oct-13
Dec-13
Feb-14
Apr-14
Jun-14
Aug
-14
Oct-14
Dec-14
Feb-15
Apr-15
Jun-15
Aug
-15
Oct-15
Dec-15
Feb-16
Apr-16
Jun-16
Aug
-16
Oct-16
Dec-16
Feb-17
Apr-17
Jun-17
Aug
-17
Oct-17
Dec-17
Feb-18
Apr-18
Jun-18
Aug
-18
Oct-18
Dec-18
Feb-19
Apr-19
Jun-19
Aug
-19
Oct-19
soy/corn
moresoy
morecorn
Source:Bloomberg,Rabobank2018

US2019acreagesplit:Lesssoy,moreothers
36
USsoyacreagecutnottoimmediatelymoveallintocorn,iftradewarsstayinplace&SouthAmericancropsaregood,a6macrescutisnoproblematall!!
-8
-6
-4
-2
0
2
4
soybean corn wheat cotton
yoych
ange
inacrea
g(m
acres)
withtarrifs withouttariffs
Source:Rabobank2018

VEGOILS
37
VEGETABLEOILS

Globaloilproductiongrowthexceedstrendinrecentyears(CAGR4.3%)
38
ProductiongrowthCAGR4.3%inpastdecade
Source:USDA,Rabobank2018

39
MalaysianMayandJun2018CPOproduc7onlowestinmanyyears
Indonesiaproduc7onstrong,offse@ngMalaysianshorBall,butithasbeenquitedryposingfutureproduc7onrisk
Palmoilstocksarehighandsoybeanoilisgettingcheaperduetotradewars.
0.8
1
1.2
1.4
1.6
1.8
2
2.2
Oct
Nov
Dec
Jan
Feb
Mar
Apr
May
Jun Jul
Aug
Sep
millionsto
nnes
5yrhigh 16/1717/18 5yravg
0
1
2
3
4
5
Jan
Feb
Mar
Apr
May
Jun Jul
Aug
Sep
Oct
Nov
Dec
millon
tonn
es
2016 2017 2018Source:MPOB,Bloomberg,Rabobank2018

India:Slowveg.oilgrowth…duetohighimportduties.Especiallysoyoiluseandsomewhatconsumptionslowed
40
2018/19tobringrisingimportsduetopoorcottonandpeanutcropanddespitesoyrecovery
0%
2%
4%
6%
8%
10%
12%
14%
16%
0
5,000
10,000
15,000
20,000
25,000
2010/11 2011/12 2012/13 2013/14 2014/15 2015/16 2016/17 2017/18 2018/19
YOYgrow
th(%)
1000
tonn
es
Oil,Palm Oil,Soybean other imports consumptiongrowth(%)
Indiansoycropto
recoverto10mvs8.2mt,butcotton&peanutdown
Source:USDA,Rabobank2018

Chineseveg.oilimportstorecoverin2019,drivenbyreducedsoycrush
41
Importsofpalmoil,soyoilandpartlyotheroilstobenefitfromtradewars
0%
5%
10%
15%
20%
25%
30%
35%
40%
45%
50%
0
2,000
4,000
6,000
8,000
10,000
12,000
1993
/94
1994
/95
1995
/96
1996
/97
1997
/98
1998
/99
1999
/00
2000
/01
2001
/02
2002
/03
2003
/04
2004
/05
2005
/06
2006
/07
2007
/08
2008
/09
2009
/10
2010
/11
2011/12
2012
/13
2013/14
2014
/15
2015
/16
2016
/17
2017/18
2018
/19
Source:USDA,Rabobank2018

MarketingCommunication
October2018vegoilsandsoymeal
StefanVogelGlobalSectorStrategist,Grains&OilseedsHeadofAgriCommodityMarketsResearch
10year0utlookforoils&meal

Globalvegetableoilproductionincreased3.5Xinlast25years,withpalmrising5X.
43
Willthisproductionrallycontinueinthenextdecade?
0
10,000
20,000
30,000
40,000
50,000
60,000
70,000
80,000
SoutheastAsia
EastAsia SouthAmerica
EuropeanUnion-28
NorthAmerica
FormerSovietUnion
-12
otherAsia Africa other
1993/94 1998/99 2003/04 2008/09 2013/14 2018/19
Soy
Mal & Ind Palm
Rape & sun & soy
Soy
China soy
Source:USDA,Rabobank2018

50
55
60
65
70
75
80
85
90
2012 2013 2014 2015 2016 2017 2018f 2019f 2020f 2021f 2022f 2023f 2024f 2025f 2026f 2027f 2028f 2029f 2030f
mill
ion
tonn
es
Global production high case Global production base case Global production low case Global production better-seed case
Global palm oil production increases on the back of increasing South-East Asian production
Global palm oil production decreases due to decreasing South-East Asian production, a result of replanting and old oil palm trees
Improving global palm oil production situation, as oil palm trees which were planted in Indonesia and Malaysia from 2018 to 2023 reach their young mature and mature stages
Low global palm oil price environment
Neutral to already slightly bullish price environment Bullish price environment
Global palm oil consumption is required to increase more than ‘long-term’ consumption. Thus, low palm oil prices are needed
Global palm oil consumption will have to decline from previous years, as global production decreases
Global palm oil consumption will decrease more than ‘long-term’ consumption in order to adjust for global palm oil supply availability
Other vegetable oils will fill the difference between palm oil base-case consumption and ‘long-term’ consumption
ThedecreaseinSouth-EastAsianpalmoilproductionpost-2021willresultinabullishpalmoilpriceenvironment
Source:UnitedNations,ChineseMinistryofAgriculture,IndonesianDirectorateGeneralofEstateCropsMPOB,USDA,Rabobank2018AgriCommodityMarketsResearch

ChinaSoybeandemandgrowthslowing,evenifthetradewarswouldberesolved
45
+75m tonnes
+45m tonnes
Source:USDA,Rabobank2018

EURapeseedproductionmaxedout,soyontherise
46
AnalmostflatoutlookforEUrapeseedproctioninnext10years
Source:USDA,Rabobank2018

Consumptiongrowthbyregion&keydrivers
47Source:USDA,Rabobank2018
Food 9m & industrial 12m t
food
China food
Food +4.5m & industrial+11m t
Food +5m & industrial+5m t
Food +4m & industrial+7m t
India food

India’simportgrowthsofvegetableoilstoslowto25mtfor35mtconsumption
48
Palmoiltoposethebiggestabsoluteincrease,buttoloosesharestosoy&sun
Sources:USDA,Rabobank2018

Africa:Importstoriseby1/3rdthrough2030from9mtto12mt
49
Thegapbetweenvegetableoilconsumptionandproductioniswidening,2010-2030f
Source:Rabobank2018

RisingAfricanVegetableOilImportsinNextDecade
50Source:Rabobank2018

Globalsoymealuseroseby75mt…or~50%inthepastdecade
51
Howmuchwilltheglobalsoymealdemandriseinthenextdecade?
Source:USDA,FAO,Rabobank2018

Globalmeat&aquaculturegrowth…isslowinginnextdecade(+56mtvs+84mt)
52
Adding56mtofmeatproductionor+15%in10years
Source:USDA,FAO,Rabobank2018

Globalmeat&aquaculturegrowth…isslowinginnextdecade(+56mtvs+84mt)
53
Representinga1/3rdslowergrowthcomparedtopreviousdecade
Source:USDA,FAO,Rabobank2018

Globalmeat&aquaculturegrowth…isslowinginnextdecade(+56mtvs+84mt)
54
Poultryforecasttogrowth55%lessinnextdecade,porkandaquaculture26%less
Source:USDA,FAO,Rabobank2018

Globalsoymealusetorisebyonly50-55mt…or~22%inthenextdecade
55
Howmuchwilltheglobalsoymealdemandriseinthenextdecade?
Source:USDA,FAO,Rabobank2018
287

Futureexportsofsoymealtogrow…atsimilarlevelasinthepastDespiteadeclineofglobalsoymealconsumptiongrowth
56
Changeofglobalsoymealuse2006/08-2016/18vs2016/18-2026/28
Source:USDA,FAO,Rabobank2018

57
UScrushtobenefitfromdomesticmealuse
USSoybeans…despitetheChinasetback,long-termproductionisexpectedtorise
Source:USDA,Rabobank2018

0
10
20
30
40
50
0
40
80
120
160
200
2000
/01
2001
/02
2002
/03
2003
/04
2004
/05
2005
/06
2006
/07
2007
/08
2008
/09
2009
/10
2010
/11
2011/12
2012
/13
2013/14
2014
/15
2015
/16
2016
/17
2017/18e
2018
/19f
2019
/20f
2020
/21f
2021
/22f
2022
/23f
2023
/24f
2024
/25f
2025
/26f
2026
/27f
2027/28f
mhec
tares
mto
nnes
Production(LHS) Area(RHS)
Braziliansoybeanproduction…isexpectedtoreach157mtonnesplantedin45.5mhectaresin2027/28
58
Brazil'ssoybeanproductionandacreageforecast,2000/01-2027/28f
Source:USDA,Rabobank2018

0
6
12
18
24
0
20
40
60
8020
00/01
2001
/02
2002
/03
2003
/04
2004
/05
2005
/06
2006
/07
2007
/08
2008
/09
2009
/10
2010
/11
2011/12
2012
/13
2013/14
2014
/15
2015
/16
2016
/17
2017/18e
2018
/19f
2019
/20f
2020
/21f
2021
/22f
2022
/23f
2023
/24f
2024
/25f
2025
/26f
2026
/27f
2027/28f
mhec
tares
mto
nnes
Production(LHS) Area(RHS)
Argentinesoybeanproduction…isexpectedtoreach68mtonnesplantedin22mhectaresin2027/28
59
Argentina'ssoybeanproductionandacreageforecast,2000/01-2027/28f
Source:USDA,Rabobank2018

TheWildcards:India
60
Risingdomesticmealdemandturnsthecountrysoonintoanetimportereitherofsoybeansorofsoymeal
Source:USDA,Rabobank2018

6161
ThisdocumentismeantexclusivelyforyouanddoesnotcarryanyrightofpublicationordisclosureotherthantoCoöperatieveRabobankU.A.(“Rabobank”),registeredinAmsterdam.Neitherthisdocumentnoranyofitscontentsmaybedistributed,reproduced,orusedforanyotherpurposewithoutthepriorwrittenconsentofRabobank.Theinformationinthisdocumentreflectsprevailingmarketconditionsandourjudgementasofthisdate,allofwhichmaybesubjecttochange.Thisdocumentisbasedonpublicinformation.Theinformationandopinionscontainedinthisdocumenthavebeencompiledorderivedfromsourcesbelievedtobereliable;however,Rabobankdoesnotguaranteethecorrectnessorcompletenessofthisdocument,anddoesnotacceptanyliabilityinthisrespect.Theinformationandopinionscontainedinthisdocumentareindicativeandfordiscussionpurposesonly.Norightsmaybederivedfromanypotentialoffers,transactions,commercialideas,etceteracontainedinthisdocument.Thisdocumentdoesnotconstituteanoffer,invitation,orrecommendation.Thisdocumentshallnotformthebasisof,orcannotberelieduponinconnectionwith,anycontractorcommitmentwhatsoever.Theinformationinthisdocumentisnotintended,andmaynotbeunderstood,asanadvice(including,withoutlimitation,anadvicewithinthemeaningofarticle1:1andarticle4:23oftheDutchFinancialSupervisionAct).ThisdocumentisgovernedbyDutchlaw.ThecompetentcourtinAmsterdam,theNetherlandshasexclusivejurisdictiontosettleanydisputewhichmayariseoutof,orinconnectionwith,thisdocumentand/oranydiscussionsornegotiationsbasedonit.ThisreporthasbeenpublishedinlinewithRabobank’slong-termcommitmenttointernationalfoodandagribusiness.ItisoneofaseriesofpublicationsundertakenbytheglobaldepartmentofRaboResearchFood&Agribusiness.©2018-AllRightsReserved.
Rabobank Food and Agribusiness Research & Advisory Stefan Vogel
Head of Agri Commodity Markets Research Global Sector Strategist Grains & Oilseeds
Telephone +44 (0) 20 7664 9523 Email [email protected]
Contacts:
London office Thames Court
One Queenhithe
London EC4V 3RL United Kingdom

62Source:USDA,FAO,Rabobank2018
Additionalsoymealdemandbycountryfrom2006/08to2016/18(mlnt)
Wherehappenedthegrowth…anddidcrushingatoriginordestinationrisemost?
Regionswithsoymealusedeclineoverpastdecade(ttl-5.6mtonnes)

Wildcards:AlternativeMeat
63
Ifittasteslikemeatandlookslikemeat,itmightnotbemeat…

Veggiemealswon’tkillyourfeedbusiness…butwillslowthefuturegrowth
64
Despitestrongconsumptiongrowthofalternativeproteins,volumesareforecasttostaybelow1%ofmeatproductionvolumes,2016-2022
Source:Rabobank2018

• Keydriversin2019forglobalvegoiltradeflows• • Vegoilsuppliesinglobalmarketsarelikelytoremainhighin2018/19;IndonesianCPOproductionmorethancompensatingforslightlylowery-o-yMalaysianproduction,USisexpectingrecordhighsoybeancrop;andlocallyinIndia,thankstodecentmonsoon,domesticoilseedandvegoilsuppliesarelikelytoremainbettery-o-y.
• Tradewarandcrudeoilarelikelytocontinuedictatingtheglobalvegoilpricesincomingseason.AnyupsurgeinbrentcrudepricescouldtriggerhigherCPOconsumption;orMPOBpalmpricinghastogodownfromcurrentlevelstotriggerdemandrecovery(butwithcurrentpricing,lowscopeforfurtherpricedrop).