weather hazards and vulnerabilities for the european
TRANSCRIPT

VT
T T
EC
HN
OL
OG
Y 4
3
Weath
er h
aza
rds a
nd
vuln
era
bilitie
s for th
e E
uro
pean
tran
spo
rt...
ISBN 978-951-38-7864-1 (URL: http://www.vtt.fi/publications/index.jsp) ISSN 2242-122X (URL: http://www.vtt.fi/publications/index.jsp)
Weather hazards and vulnerabilities for the European transport system – a risk panorama EWENT project D5
Weather hazards and vulnerabilities for the European transport system – a risk panoramaEWENT project D5
•VISIONS•S
CIE
NC
E•T
ECHNOLOGY•R
ES
EA
RC
HHIGHLIGHTS
43

VTT TECHNOLOGY 43
Weather hazards and vulnerabilities for the European transport system – a risk panorama EWENT project D5.1
Riitta Molarius, Pekka Leviäkangas, Jussi Rönty & Kalle Oiva (Eds.) VTT

2
ISBN 978-951-38-7864-1 (URL: http://www.vtt.fi/publications/index.jsp) ISSN 2242-122X (URL: http://www.vtt.fi/publications/index.jsp)
Copyright © VTT 2012
JULKAISIJA – UTGIVARE – PUBLISHER
VTT PL 1000 (Tekniikantie 4 A, Espoo) 02044 VTT Puh. 020 722 111, faksi 020 722 7001
VTT PB 1000 (Teknikvägen 4 A, Esbo) FI-02044 VTT Tfn +358 20 722 111, telefax +358 20 722 7001
VTT Technical Research Centre of Finland P.O. Box 1000 (Tekniikantie 4 A, Espoo) FI-02044 VTT, Finland Tel. +358 20 722 111, fax + 358 20 722 7001
Technical editing by Jussi Rönty

3
Weather hazards and vulnerabilities for the European transport system – a risk panorama EWENT project D5.1
[Äärisääilmiöiden riskit ja uhat Euroopan liikennejärjestelmälle]. Riitta Molarius, Pekka Leviäkangas, Jussi Rönty, Kalle Oiva (Eds.), Anna-Maija Hietajärvi, Marko Nokkala, Ville Könönen, Zulkarnain, Michael Kreuz, Thorsten Mühlhausen, Johanna Ludvigsen, Pirkko Saarikivi, Andrea Vajda, Heikki Tuomenvirta, Spyros Athanasatos, Matheos Papadakis, Silas Michaelides, Nina Siedl, Juha Schweighofer, Kathrin Riemann-Campe & Pieter Groenemeijer. Espoo 2012. VTT Technology 43. 95 p. + app. 13 p.
Summary This deliverable of EWENT project estimates the risks of extreme weather on European transport system. The main object of work package 5 in EWENT project was to perform a risk analysis based on impact and probability assessments car-ried out in earlier work packages (WP2–WP3). The results of WP 5 can be used as a starting point when deciding on the risk reduction measures, strategies and policies in the European Union. This deliverable also serves as a background material for the synthesis report (named shortly as Risk Panorama), which will summarise the findings of risk assessment and previous work packages.
The methodological approach of EWENT is based on the generic risk man-agement standard (IEC 60300-3-9) and starts with the identification of hazardous extreme weather phenomena, followed by an impact assessment and concluded by mitigation and risk control measures. This report pools the information from EWENT’s earlier work packages, such as risk identification and estimation, into a ‘risk panorama’ and provides a holistic picture on the risks of extreme weather in different parts of Europe and EU transport network.
The risk assessment is based on the definition of transport systems’ vulnerabil-ity to extreme weather events in different countries and on calculations of the most probable causal chains, starting from adverse weather phenomena and ending up with events that pose harmful consequences to the transport systems in different climate regions. The latter part, the probabilistic section, is the hazard analysis. The vulnerability of a particular mode in a particular country is a function of expo-sure (indicated by transport or freight volumes and population density), susceptibil-ity (infrastructure quality index, indicating overall resilience) and coping capacity (measured by GDP per capita). Hence, we define the extreme weather risk as
Risk = hazard × vulnerability = P(negative consequences) × V[f(exposure, susceptibility, coping capacity)]
Based on this analytical approach, risk indicators for each mode and country are presented. Due to the techniques used in calculations, the risk indicator is by definition a relative indicator, and must not be considered as an absolute measure of risk. It is a very robust ranking system, first and foremost. Country-specific vul-nerability indicators and hazard indicators following the climatological division are

4
also presented. In general, countries with poor quality infrastructures combined with high transport volumes and population densities are naturally at most risk.
Keywords EWENT, risk, vulnerability, EU transport system, extreme weather, WP5

5
Äärisääilmiöiden riskit ja uhat Euroopan liikennejärjestelmälle
[Weather hazards and vulnerabilities for the European transport system – a risk panorama. EWENT project D5.1]. Riitta Molarius, Pekka Leviäkangas, Jussi Rönty, Kalle Oiva (Eds.), Anna-Maija Hietajärvi, Marko Nokkala, Ville Könönen, Zulkarnain, Michael Kreuz, Thorsten Mühlhausen, Johanna Ludvigsen, Pirkko Saarikivi, Andrea Vajda, Heikki Tuomenvirta, Spyros Athanasatos, Matheos Papadakis, Silas Michaelides, Nina Siedl, Juha Schweighofer, Kathrin Riemann-Campe & Pieter Groenemeijer. Espoo 2012. VTT Technology 43. 95 s. + liitt. 13 s.
Tiivistelmä Tämä julkaisu esittelee EWENT-projektissa tehdyn riskianalyysin tulokset. Rapor-tissa kuvataan sään ääri-ilmiöistä Euroopan liikennejärjestelmälle aiheutuvaa riskiä. Riskianalyysi tehtiin projektin aikaisemmissa työvaiheissa toteutettujen vaikutus- ja todennäköisyysarviointien pohjalta. Riskianalyysin tuloksia voidaan käyttää päätöksenteon perustana Euroopan unionissa arvioitaessa strategioita ja toimintalinjoja riskien vähentämiseksi ja niihin varautumiseksi. Julkaisu on myös hankkeesta tehdyn yhteenvedon (Risk Panorama, englanniksi) tausta-aineisto.
Riskianalyysin metodologinen lähestymistapa pohjautuu yleiseen riskinhallin-nan standardiin (IEC 60300-3-9), jonka mukaan riskianalyysi alkaa vaaraa aiheut-tavien tekijöiden (sään ääri-ilmiöiden) tunnistamisesta ja jatkuu niiden todennäköi-syyksien ja seurausten arviointiin. Tässä projektissa riskin suuruus määritettiin lopuksi kohteen haavoittuvuuden ja vaaran todennäköisyyden pohjalta. Riskiana-lyysin lisäksi julkaisussa esitellään eri maissa nykyisin käytetyt riskien hallintatoi-met. Raportti yhdistää EWENT-projektin aikaisemmissa työvaiheissa kootun tie-don ja tarjoaa kokonaiskuvan sään ääri-ilmiöiden liikennejärjestelmälle aiheutta-masta riskistä eri puolilla Eurooppaa.
Riskin arviointi perustuu tarkastellun kohteen (liikennejärjestelmän) vaaran ja haavoittuvuuden määrittämiseen. Vaara tarkoittaa tässä sääilmiöstä aiheutuvan tapahtumaketjun lopputapahtuman todennäköisyyttä. Se on laskettu alkaen ky-seistä liikennejärjestelmää uhkaavan sääilmiön todennäköisyydestä päätyen ta-pahtumaketjun lopputapahtuman todennäköisyyteen. Liikennejärjestelmän haa-voittuvuuden laskennassa on huomioitu altistujien määrä (jota indikoivat liikenne- tai kuljetusmäärät sekä asukastiheys), järjestelmän herkkyys ilmiölle (infrastruk-tuurin laatuindeksi, kuvaa yleistä kestävyyttä) sekä selviytymiskykyfunktio (BKT asukasta kohti). Näin ollen riski sään ääri-ilmiölle voidaan määritellä seuraavasti
Riski = vaarav × haavoittuvuus = P(negatiivinen seuraus sääilmiöstä) × V[f(altistuminen, herkkyys, selviytymiskyky)]
Tämän analyyttisen lähestymistavan perusteella kaikille liikennemuodolle eri maissa on laskettu riski-indikaattorit. Käytetyistä laskumenetelmistä johtuen riski-indikaattori on luonteeltaan suhteellinen indikaattori, eikä sitä pidä käyttää abso-luuttisena riskin suuruuden arvona. Riski-indikaattori antaa kuvan eri liikennejär-
6
jestelmien haavoittuvuudesta suhteessa toisiinsa niin ilmastoalueittain kuin liiken-nemuodoittainkin. Julkaisussa on esitetty myös maakohtaiset haavoittuvuusindi-kaattorit sekä ilmastoalueiden mukaan luokitellut vaaraindikaattorit. Yleisesti otta-en voidaan todeta, että suurimmassa riskiryhmässä ovat maat, joiden infrastruk-tuurin taso on heikko ja joiden liikennemäärät sekä asukastiheydet ovat suuria.
Avainsanat EWENT, risk, vulnerability, EU transport system, extreme weather, WP5

7
Contents Summary.......................................................................................................... 3
Tiivistelmä ....................................................................................................... 5
List of figures and tables ................................................................................. 9
1. Introduction ............................................................................................. 12 1.1 Scope and objectives ........................................................................ 12
2. Vulnerability and risk .............................................................................. 14 2.1 Background and methods ................................................................. 14 2.2 Vulnerability of transport networks ..................................................... 16
3. Risk indication and ranking system in EWENT ...................................... 18 3.1 Hazard indicator ............................................................................... 19 3.2 Vulnerability indicator ........................................................................ 21 3.3 Risk indicator .................................................................................... 24 3.4 Discussion on the method ................................................................. 25 3.5 European climate regions and vulnerable modes of transport ............. 27
3.5.1 The climatic regions ................................................................ 27 3.5.2 Enhancements of the European Severe Weather
Database (ESWD) .................................................................. 30 3.6 The most vulnerable transport modes in different parts of Europa ...... 31
4. Regional and mode-specific risk assessment ........................................ 33 4.1 Northern European (sub-arctic) region ............................................... 33
4.1.1 Road transport ........................................................................ 34 4.1.2 Rail transport .......................................................................... 36 4.1.3 Short sea shipping .................................................................. 37
4.2 Temperate Central European region.................................................. 39 4.2.1 Road transport ........................................................................ 40 4.2.2 Rail transport .......................................................................... 42 4.2.3 Aviation .................................................................................. 43 4.2.4 Inland waterways .................................................................... 44 4.2.5 Short sea shipping .................................................................. 46
4.3 Temperate Eastern European region ................................................. 47 4.3.1 Road transport ........................................................................ 49 4.3.2 Rail transport .......................................................................... 50 4.3.3 Aviation .................................................................................. 52 4.3.4 Inland waterways .................................................................... 53
4.4 Mediterranean region ........................................................................ 53 4.4.1 Road transport ........................................................................ 55 4.4.2 Rail transport .......................................................................... 56 4.4.3 Short sea shipping .................................................................. 57
8
4.5 Oceanic region ................................................................................. 59 4.5.1 Road transport ........................................................................ 61 4.5.2 Rail transport .......................................................................... 63 4.5.3 Short sea shipping .................................................................. 64 4.5.4 Aviation .................................................................................. 66
4.6 Mountainous regions ........................................................................ 67 4.6.1 Road transport ........................................................................ 68 4.6.2 Rail transport .......................................................................... 69 4.6.3 Aviation .................................................................................. 70
4.7 Examples of adverse weather induced effects in Europe .................... 71 4.7.1 Costs at European level .......................................................... 71 4.7.2 Costs at climate region level .................................................... 74 4.7.3 Case studies of weather-induced disruptions in European
freight transport, logistics service provision and infrastructure functionality........................................................ 75
5. Risk management options in Europe...................................................... 77 5.1 Present risk management measures for extreme weather .................. 77 5.2 Risk management measures against heavy rain ................................ 78 5.3 Risk management measures against extreme snowfall ...................... 80 5.4 Risk management measures against strong winds ............................. 83 5.5 Risk management measures against heat waves............................... 86 5.6 Risk management measures against cold waves ............................... 87 5.7 Risk management measures against low visibility .............................. 88 5.8 Summary of present risk management measures .............................. 89
6. Risk indicators for transport modes ....................................................... 90
References ..................................................................................................... 92
Appendices
Appendix 1: Calculations of most probable event chains starting from extreme weather phenomenon and ending to final consequences
Appendix 2: Traffic density in Europe (EU-27; Eurostat, obtained Feb-2012) Appendix 3: nfrastructure quality indexes for Europe (EU-27) Appendix 4: GDP in Europe (EU-27) Appendix 5: Population Density in Europe (EU-27) Appendix 6: Risk indicators for delays Appendix 7: Risk indicators for accidents Appendix 8: Risk indicators for infrastructure related damages and costs

9
List of figures and tables
Figure 1 The approach to assess the risk to transport due to extreme weather events in EWENT project.
Figure 2 An example of the steps of the calculation of probability starting from extreme weather.
Figure 3 The relation between risk and vulnerability in the EWENT project.
Figure 4 Example of risk indicator for road passenger accidents due to extreme weather.
Figure 5 Correlation between GDP (PPP) and infrastructure quality indicator.
Figure 6 The improved map of European climate regions based on the frequency and probability analysis of the selected climatic extremes.
Figure 7 Spatial distribution of all reports in the ESWD (30 May 2012). Note that symbols overlap each other.
Figure 8 Some of the most important transport channels in Northern European climate region.
Figure 9 Risk Indicator in Northern European for road transport (passengers) due to extreme weather events.
Figure 10 Risk Indicator in Northern European for rail transport (freight) due to extreme weather events.
Figure 11 Risk Indicator in Northern European for short sea shipping (freight) due to extreme weather events.
Figure 12 Some of the most important transport channels in Temperate Central European climate region.
Figure 13 Risk Indicator in the Temperate Central European region for road transport (passengers) due to extreme weather events.
Figure 14 Risk Indicator in Temperate Central region for rail transport (freight) due to extreme weather events.
10
Figure 15 Risk Indicator in Temperate Central region for aviation transport (pas-sengers) due to extreme weather events.
Figure 16 Risk Indicator in Temperate Central region for inland waterways transport (freight) due to extreme weather events.
Figure 17 Risk Indicator in Temperate Central region for short sea shipping (pas-sengers) due to extreme weather events.
Figure 18 Some of the most important transport channels in EU-27 states in Tem-perate Central European climate region.
Figure 19 Risk Indicator in the Temperate Eastern region for road transport (freight) due to extreme weather events.
Figure 20 Risk Indicator in Temperate Eastern region for rail transport (passen-gers) due to extreme weather events.
Figure 21 Risk Indicator in the Temperate Eastern region for aviation (passen-gers) due to extreme weather events.
Figure 22 Risk Indicator in Temperate Eastern region for inland shipping (freight) due to extreme weather events.
Figure 23 Some of the most important transport channels in the Mediterranean climate region.
Figure 24 Risk indicators in Mediterranean region for road transport (freight) due to extreme weather events.
Figure 25 Risk Indicators in Mediterranean region for rail transport (passengers) due to extreme weather events.
Figure 26 Risk indicators in Mediterranean region for short sea shipping (passen-gers) due to extreme weather events.
Figure 27 Some of the most important transport channels and nodes in Oceanic climate region.
Figure 28 Risk Indicator in the Oceanic region for road transport (freight) due to extreme weather events. The indicator is given separately for delays, infrastructure maintenance and accidents.
Figure 29 Risk Indicator in the Oceanic region for rail transport (passenger) due to extreme weather events.
Figure 30 Risk Indicator in the Oceanic region for sea shipping (freight) due to extreme weather events.
Figure 31 Risk Indicator in Oceanic region for road aviation (freight) due to ex-treme weather events.

11
Figure 32 Some of the most important transport channels and nodes in southern Mountainous Region.
Figure 33 Risk Indicator in Mountainous region for road transport (passenger) due to extreme weather events.
Figure 34 Risk Indicator in Mountainous region for rail transport (passenger) due to extreme weather events.
Figure 35 Risk Indicator in the Mountainous region for aviation (passenger) due to extreme weather events.
Figure 36 The estimates of accidents costs (euros) resulting from extreme weath-er for all transport modes except aviation at the European level (D4 EWENT-project).
Figure 37 Costs for road accidents’ fatalities and aviation cancellations and avia-tion delays by climate regions.
Figure 38 The case studies of weather induce disturbances in freight transport in Europe.
Figure 39 a–c Overall risk indicator for road transport in Europe.
Table 1 Characteristics of vulnerability assessments (Füssel, 2007).
Table 2 The definitions used in risk assessment work package in EWENT.
Table 3 Hazard indicators for road transport in different climate regions. Values from Mediterranean climate region are highlighted as examples.
Table 4 Discrete ranking of the vulnerabilities in EWENT.
Table 5 Correlation matrix (correlation coefficient – r) between variables.
Table 6 The most vulnerable transport modes for extreme weather in different climate regions according to D1 in EWENT-project.
Table 7 Annual cost for infrastructure assets and operations due to storms, wintry conditions and floods.
Table 8 Stakeholder interviews made in EWENT-project per country and per transport mode.

1. Introduction
12
1. Introduction
1.1 Scope and objectives
The objective of this work package 5 deliverable of EWENT project is to assess the risks of extreme weather on European transport system. This working docu-ment D5.1 serves as a background material for the Risk Panorama, which will summarise the findings of risk assessment and previous work packages. D5.1 first and foremost makes a synthesis of work packages 1–3 of EWENT project.
The approach is presented in Figure 1, and the following steps are taken:
1. the concepts of hazard, vulnerability and risk are discussed and defined based on multiple literature sources (which represent only a fragment of the whole body of related literature)
2. hazard, vulnerability and risk are disaggregated to more detailed parame-ters which can be operationalized using empirical data
3. indicators of hazard and vulnerability are devised; hazard relies on proba-bilistic approach of extreme phenomena occurring in different parts of Eu-rope; vulnerability relies on easy-to-understand operational parameters ob-tained from public statistics sources (Eurostat)
4. the above indicators are calculated for each EU-27 member state
5. the concept of total risk is introduced and defined, as applied in EWENT
6. the most relevant risks, based on total risk concept, of extreme weather are identified in Europe
7. the most relevant extreme weather risks with high cost impacts are identi-fied.

1. Introduction
13
Figure 1. The approach to assess the risk to transport due to extreme weather events in EWENT project.
The work relies heavily on previous work packages’ achievements and the end result is dictated largely by the success of these. The end result, however, is unique to our knowledge: for the first time ever the European extreme weather risks have been analysed in a systemic manner starting from weather phenomena until to final risk assessment taking into account the relevant consequences and costs. The results obtained from total risk assessment will be serving as input to risk management options analysis to be carried out in WP6 of EWENT.
We hope that the results will be utilised widely and the methods and approach-es applied in EWENT will be improved and taken further in other research efforts.
14
Total risk of transport mode “x”
of Member State “X”
Extreme weather hazards of climate
zone where Member State “X” lies
Vulnerability of the mode “x” in Member
State “X”
×
Probability of extreme weather
phenomena
Probability of negative
consequences
Coping capacity
Exposure
Susceptibility(Resilience)
Cost of consequences
WP4WP2
WP3
WP5 approach for risk assessment

2. Vulnerability and risk
14
2. Vulnerability and risk
2.1 Background and methods
The concept of risk has been defined as “effect of uncertainty on objectives” (ISO 31000:2009, Purdy, 2010). This conceptualization highlights that there is not a question of that “something happens” but rather that some objects are impacted, positively or negatively. And this means that we have to analyse the likelihoods and consequences of the impacts, not the initial events (Leitch, 2010).
Most often risk is defined as a chance that an undesirable event will occur and the consequences of its possible outcomes (Lough et al., 2005; Habegger, 2008). However, in some cases risk has been defined equal to consequences: In this case one defines for example FAR (fatal accident rates) values as the expected number of fatalities per 100 million exposed hours. Risk analysis is used to verify that the risk acceptance criteria are met, and deciding on the need for risk-reducing measures (Gibson, 1977; Abrahamsen and Aven, 2008). In other cases risk has been defined to be equal to probability (Head, 1967; Denenburg et al., 1974). This definition is common for example in insurance and nuclear industry where the main focus of risk management is to diminish the probability of failures.
Mathematically risk R is most often defined as a function of probability P and consequences C
( ) [1]
However, as said before risk can also be understood as the probability of a harm-ful event, especially when this event has been specified beforehand.
( ) [2] [2]
It has been highlighted that there is no single inclusive definition to the term vul-nerability due to its varying use in different policy contexts (Füssel, 2007). Very often vulnerability refers to specific vulnerable situations which can cause harm to the existing systems, as critical infrastructures.
The concepts of risk and vulnerability have been connected to each other in several ways. In some cases they are understood to almost equal. For example Cutter (1993) defined vulnerability as “the likelihood that an individual or group will be exposed to and adversely affected by a hazard.”

2. Vulnerability and risk
15
Moreover, one mathematical expression of risk is
( ) [3]
where H is hazard and V vulnerability (Villagrán, 2006). This is justified by expla-nation that hazards are defined as potentially damaging phenomena only when a vulnerable object is exposed to the hazard and the potential for loss occurs (Walker et al., 2011).
Alexander (2000) has defined this connection in context of natural disasters by stating the total risk, TR. In the equation the elements at risk might be population, built environment, economic activities etc.
= ) [4]
Walker et al. (2011) have concluded almost the same result by stating that risk can be expressed by notation “Risk = Hazards × Vulnerability”.
Villagrán (2001) states that risk is a function of hazard, vulnerability and defi-ciencies in preparedness
[5]
Dilley et al. (2005) defined that
[6]
Disaster Reduction Institute (DRI) has formulated Vulnerability as a function of exposure, susceptibility and coping capacity (White et al., 2005).
Vulnerability = [7]
The Centre for European Policy Studies states that assessing critical infrastructure vulnerability means “a systematic examination of the characteristics of an installa-tion, system, asset, application, or its dependencies to identify vulnerabilities” (CEPS, 2010).
Cutter et al. (2003) utilize a “hazards-of-place” model of vulnerability to explore social vulnerability in the context of natural hazards, where levels of risk and levels of mitigation are combined to produce hazard potential. This hazard potential is then filtered by geographic and social variables to produce social vulnerability. Social vulnerability and hazard potential, thusly, to produce overall vulnerability of place. Cutter et al. have created a social vulnerability Indicator (SoVI). The SoVI is comprised of a multitude of indicators expressed by data from the US Census. The SoVI results were mapped, by county, to create a patchwork of comparative vulnerability across the U.S. As a result most U.S. counties were found to have moderate social vulnerability; areas of high social vulnerability were most frequent-ly in the southern part of the U.S.
Füssel (2007) has highlighted that there are different characteristics of vulnera-bility depending on whether there is a question of climate change or natural haz-ards (Table 1).

2. Vulnerability and risk
16
Table 1. Characteristics of vulnerability assessments (Füssel, 2007).
Natural hazards Climate change
Hazard characteristics
– Temporal Discrete events Discrete and continuous events
– Dynamics Stationary Non-stationary
– Spatial scope Regional Global but heterogeneous
– Uncertainty Low to medium Medium to very high
– Attribution Natural variability Natural and anthropogenic
Systems of concern Social systems and build infrastructures
All systems
System view Static Dynamic and adaptive
Targets for risk reduction Exposure to hazards and internal vulnerability
Magnitude of hazards and internal vulnerability
Analytical function Normative Positive and normative
Villagrán (2006) has noticed that there are three different discourses regarding vulnerability:
1. Vulnerability refers to a particular condition or state of a system before an event triggers a disaster.
2. Vulnerability means a direct consequence of the exposure to a hazard.
3. Vulnerability equals to the probability or possibility of an outcome of the system when exposed to a hazard which is linked to fatalities and econom-ic and social losses.
In the EWENT project we use the third discourse to produce a comprehensive picture on the fragility of the European transport network exposed to extreme weather phenomena.
2.2 Vulnerability of transport networks
There are several vulnerability and transport related studies each having their own approaches. Taylor and D’Este (2007) proposed a methodology for obtaining the vulnerability of each component of the network on the national level. They defined the main questions to be:
1. How do interruptions of different critical links affect system performance, and to what extent?
2. How is network performance affected by general capacity reductions and possible changes to traffic management and road space allocation in a sub-region of the network?
3. How is the system affected by variations in travel demand?

2. Vulnerability and risk
17
From this starting point they developed a methodology for study of vulnerability in transport networks and infrastructure. Vulnerability is defined as follows (Taylor and D’Este, 2007):
1. A network node is vulnerable if loss (or considerable degradation) of a small number of links significantly diminishes the accessibility of the node, as measured by a standard Indicator of accessibility
2. A network link is critical if loss (or considerable degradation) of the link sig-nificantly diminishes the accessibility of the network or of particular nodes, as measured by a standard Indicator of accessibility.
Sohn et al. (2003) produced analyses of the economic impact of an earthquake on transport network. They assessed two aspects of cost: final demand loss and transport cost increase. They found out that the links with greater physical disruption are not always the ones exhibiting the greater economic damage (Sohn et al., 2003).
Schulz (2007) studied German road networks to find out the most critical ones. There were two different approaches. The first one used information only on traffic load while the other one used more complicated transport modelling. It was no-ticed that the identified critical roads were not equal with these two methods. The first approach highlighted mainly autobahns as critical roads while the more com-plicated approach considered also some sections of federal roads to be critical.
Nicholls et al. (2008) studied the port cities and their vulnerability to climate ex-tremes. The methodology adopted was based on determining the numbers of people who would be exposed to extreme water levels which could then be related to the potential economic assets exposed within the city. The relative exposure to wind damage was calculated by weighting the present-day wind damage hazard, for tropical and extra-tropical cyclones, by the total city population. In this study the linkage between exposure and the risk of impact depends upon flood protection measures. Cities in richer countries have better protection levels than those in the developed world, and they also have access to greater resources for disaster recovery although the asset losses may be much higher.
Riccardo et al. (2011) assessed the criticality of transport networks in the Weather-project. The authors made a definition and differentiation between vulnerability and criticality for transport network. Vulnerability of a network element is defined as its physical sensitivity to extreme events and it indicates which parts of a network are the most sensitive. Criticality of a network element, on the other hand, is a term associated to the entire network performance indicating the relative importance of the independent network components (road sections (links) and intersections (nodes) to the entire network efficiency. Criticality indicates which parts of a network are the most im-portant/critical for the regular function of the network. The methodological approach has been to indicate the most important/critical components of a transport system, which is represented by a set of links and nodes. The aim is to define which of the respective links and nodes possess the most critical role in the performance of the overall transport system. The criticality of the different transport networks and the criticality of the components of the same transport network are being assessed.

3. Risk indication and ranking system in EWENT
18
3. Risk indication and ranking system in EWENT
As the focus of the EWENT project has been on the risk of extreme weather events on transport network we use the terminology of disaster management. The United Nations International Strategy for Disaster Reduction (UNISDR) has pub-lished the terminology on Disaster Risk Reduction (UNISDR, 2009) which employs the next definitions seen in Table 2.
Table 2. The definitions used in EWENT risk analysis.
Coping capacity: The ability of people, organizations and systems, to use available skills and resources in order to face and manage adverse conditions, emergencies or disasters.
Exposure: People, property, systems, or other elements present in hazard zones that are thereby subject to potential losses.
Hazard: A dangerous phenomenon, substance, human activity or condition that may cause loss of life, injury or other health impacts, property damage, loss of livelihoods and services, social and economic disruption, or environmental damage.
Natural hazard: Natural process or phenomenon that may cause loss of life, injury or other health impacts, property damage, loss of livelihoods and services, social and economic disrup-tion, or environmental damage.
Preparedness: The knowledge and capacities developed by governments, professional re-sponse and recovery organizations, communities and individuals to effectively anticipate, respond to, and recover from, the impacts of likely, imminent or current hazard events or conditions.
Risk: The combination of the probability of an event and its negative consequences
Vulnerability: The characteristics and circumstances of community, system or asset that make it susceptible to the damaging effects of a hazard.
Terms are taken from the terminology on Disaster Risk Reduction (UNISDR, 2009)
In addition of these we decided to use next definition for susceptibility.
Susceptibility: State or character of being capable of receiving, admitting, undergoing, or being affected by some harmful effect.

3. Risk indication and ranking system in EWENT
19
3.1 Hazard indicator
Relevant adverse and extreme weather phenomena were analysed by taking into account the ranking and threshold values defined from the viewpoint of different transport modes. The estimation of recent and past adverse weather events is based the observed data available from the meteorological services; from the E-OBS dataset from the EU-FP6 project ENSEMBLES1 and the ERA-Interim2 re-analysis dataset. To define the extreme weather a range of statistical methods were used. The features which specify the extreme weather are for example prob-ability, changes in spatial extension, intensity and temporal duration. More infor-mation about the assessment of extreme weather is given in project deliverable D2.1 Probabilities of adverse weather affecting transport in Europe: climatology and scenarios up to the 2050s (Vajda et al., 2011).
The weather phenomenon and its consequences are considered as the chain leading to a hazard.
( ) [8]
We defined hazard to be the probability of the outcome of the chain of events from weather phenomena to final consequences to society, including health (accidents), property (material) and delay consequences. Between a phenomenon and a con-sequence of the phenomenon there exists a direct causal connection, often physi-cal in its nature such as falling trees or striking lightning. The actual consequence of the phenomenon takes place when the impacts affect the transport system performance indicators such as safety and timeliness. A phenomenon will occur with a certain probability, subjective or based on the historical data, in a geograph-ical area. Moreover all the connections in a causal model have probabilities asso-ciated. For example storm wind cause trees falling on roads and rails with some probability as well as cold and snow cause frozen switches which in turn increase maintenance costs with a certain probability.
We assumed that between a phenomenon and a consequence multiple paths may exists that have different probabilities. With sufficiently large causal maps, it is a taunting task to generate and analyse different paths to a particular conse-quence node. In this work we develop a method for filtering the most relevant set of paths; we seek a maximum probability path from each consequence node to a phenomenon. We approach the problem with a dynamic programming approach that utilizes the Bellman’s principle of optimality. This calculation is explained more detailed in Appendix 1.
We used the outcome of these calculations to describe the natural hazard of different extreme weather events in each climatological area and directed to vari-ous transport modes. According to the hazard indicator HI would be
1 http://ensembles-eu.metoffice.com 2 http://www.ecmwf.int/research/era/do/get/era-interim

3. Risk indication and ranking system in EWENT
20
[9]
where Pp is the probability of the phenomenon, Pi is the probability of the impacts and Pc is the probability of final consequences. The final consequences stand for the endpoint of the concatenation of events starting from extreme weather phe-nomenon and ending to societal effects. These final consequences include 1) time delays, 2) infrastructure damages or maintenance cost increase and 3) accidents as shown in Figure 2. We use these three main categories for the remaining part of the analysis.
Figure 2. An example of the steps of the calculation of probability starting from extreme weather; phenomenon (in the right side of the figure) and ending to socie-tal effects; probabilities with blue fill indicate delays, green fills indicate infrastruc-ture maintenance costs and red fills accidents.
The hazard indicators vary between values 0.01 to 0.99 depending on how strong the relation-ships are in the causal chains from weather phenomena to final con-sequences. The probability values were derived using several methods:
– values obtained from the literature, either using statistical empirical materi-als or case studies
– expert assessments, experts representing different modes
– the combination of both.
The last mentioned was in reality the most common method, and the balance between empirical relationships and expert estimates varied. In general, the weather phenomena probabilities were relatively well obtained, including the prior research steps of EWENT. The longer then the causal chain from phenomena to final consequence, the more uncertain became the assessments, as was ex-pected. In expert estimates we used as a starting point probabilities 0.33 (impacts are possible), 0.66 (impacts are likely), and 0.99 (impacts are virtually certain).
Mediterranean
0,00396 Roads and traffic areas under water, traffic stops
Flooding, soil erosion, landslides, mudslides, rock falls Heavy precipit / 30 mm/d
0,01772
delays, undesirable effects on traffic interoperability
Closed roads/bridges/traffic areas, traffic stops Falling trees Wind gusts / 17 m/s
0,01182 damages for vehicles and property Slippery road Freezing, frost Cold / 0 C
0,0117 Injuries and casualties traffic accidents, indirect impacts Slippery road Freezing, frost Cold / 0 C
0,03881 Increased maintenance and repair costs
destruction of road infra (incl. Bridges) Deformation of pavement
Heat, direct sunlight exposure Heat waves / 25 C
0,03881 Delays destruction of road infra (incl. Bridges) Deformation of pavement
Heat, direct sunlight exposure Heat waves / 25 C
3. Risk indication and ranking system in EWENT
21
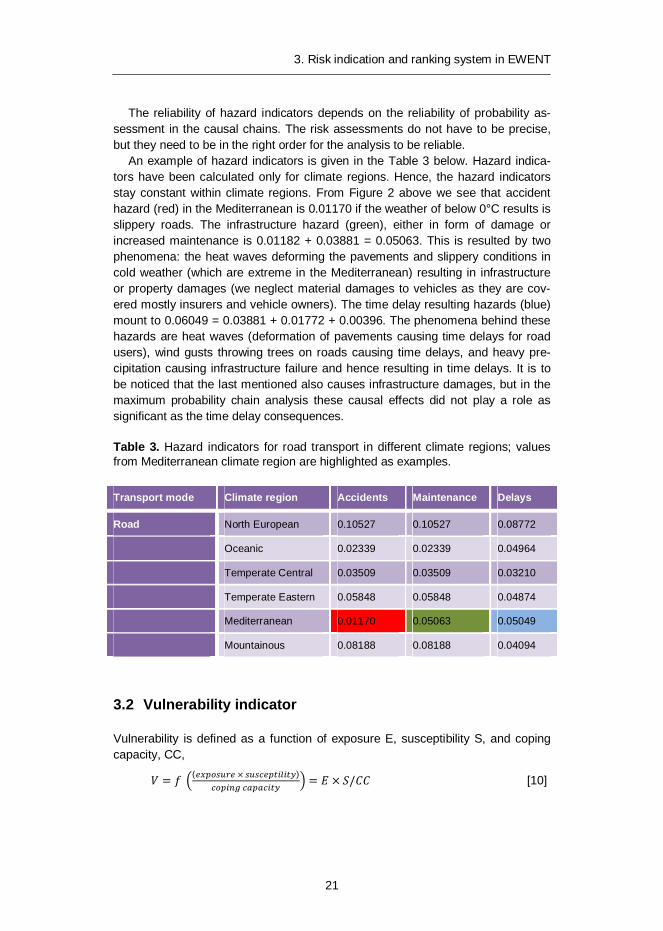
The reliability of hazard indicators depends on the reliability of probability as-sessment in the causal chains. The risk assessments do not have to be precise, but they need to be in the right order for the analysis to be reliable.
An example of hazard indicators is given in the Table 3 below. Hazard indica-tors have been calculated only for climate regions. Hence, the hazard indicators stay constant within climate regions. From Figure 2 above we see that accident hazard (red) in the Mediterranean is 0.01170 if the weather of below 0°C results is slippery roads. The infrastructure hazard (green), either in form of damage or increased maintenance is 0.01182 + 0.03881 = 0.05063. This is resulted by two phenomena: the heat waves deforming the pavements and slippery conditions in cold weather (which are extreme in the Mediterranean) resulting in infrastructure or property damages (we neglect material damages to vehicles as they are cov-ered mostly insurers and vehicle owners). The time delay resulting hazards (blue) mount to 0.06049 = 0.03881 + 0.01772 + 0.00396. The phenomena behind these hazards are heat waves (deformation of pavements causing time delays for road users), wind gusts throwing trees on roads causing time delays, and heavy pre-cipitation causing infrastructure failure and hence resulting in time delays. It is to be noticed that the last mentioned also causes infrastructure damages, but in the maximum probability chain analysis these causal effects did not play a role as significant as the time delay consequences.
Table 3. Hazard indicators for road transport in different climate regions; values from Mediterranean climate region are highlighted as examples.
Transport mode Climate region Accidents Maintenance Delays
Road North European 0.10527 0.10527 0.08772
Oceanic 0.02339 0.02339 0.04964
Temperate Central 0.03509 0.03509 0.03210
Temperate Eastern 0.05848 0.05848 0.04874
Mediterranean 0.01170 0.05063 0.05049
Mountainous 0.08188 0.08188 0.04094
3.2 Vulnerability indicator
Vulnerability is defined as a function of exposure E, susceptibility S, and coping capacity, CC,
( ) [10]

3. Risk indication and ranking system in EWENT
22
In Figure 3 there is a clarification of the relations between risk and vulnerability used in the EWENT project. Risk is defined to be a function of final consequences and their probabilities. These consequences are specified to be hazards.
Figure 3. The relation between risk and vulnerability.
The vulnerability of the system consists of exposure, susceptibility and coping capacity (Figure 3). When calculating the Vulnerability Indicator we used the fol-lowing statistics and datasets:
Exposure E
– Traffic performance (Eurostat, 2012). The more there is traffic in terms of performance, the more there are exposed transport system users in terms of volume and geographical coverage, and the more likely there is less infrastructure capacity to “absorb” the impacts and consequenc-es and the more likely there are parts of the system that are exposed. (see Appendix 2). The performance describes the geographical expo-sure (long distances, vast network) whereas the population density counterbalances the urbanisation effect (more people are exposed).
– Population density (Eurostat, 2012). The more population is located on a certain area, the more inhabitants are exposed; furthermore, popula-tion density directly refers to urbanization, and the urban areas are

3. Risk indication and ranking system in EWENT
23
more likely to be exposed to negative impacts in terms of population numbers and number of modes exposed. (See Appendix 5.)
Susceptibility S (Appendix 3):
– Infrastructure Quality Indicator. The Indicator measures executives’ perceptions of general infrastructure in their respective countries. Exec-utives grade, on a scale from 1 to 7, whether general infrastructure in their country is poorly developed (1) or among the best in the world (7). This Indicator is calculated for The Global Competitiveness Report 2011–2012 (Schwab, 2012).
Coping capacity CC (Appendix 4):
– Purchasing power parity adjusted per capita GDP measured in current U.S. dollars for differences in purchasing power parity (PPP), is applied as a robust indicator of economic capability of the country to face and overcome negative consequences of extreme weather. In short, it de-scribes the economic resilience. This data is obtained from IMF World Economic Outlook (USAID, 2012). We use the inverse number of cop-ing capacity (i.e. as a multiplier, not as a divisor).
Each of the indicators was classified in quartiles within the EU-27. The best quar-tile was given values 0.25, the second 0.5, the third 0.75 and the poorest quartile 1.0. This way the larger the given indicator value, the more vulnerable the country. We used discreet quartile steps in order to overcome some theoretical difficulties of scaling, for the first, and for the second we assessed that such robust indicators should be treated and classified in an equally robust manner. Table 4 gives an interpretation of the vulnerability scaling.
Table 4. Discrete ranking of the vulnerabilities in EWENT.
Description of ranking
Highest quartile = 1.00 high vulnerability
Upper-mid quartile = 0.75 moderately high vulnerability
Lower-mid quartile = 0.50 moderately how vulnerability
Lowest quartile = 0.25 low vulnerability
For example, Finland’s vulnerability with regard to road system and passenger transport was built on its exposure, susceptibility and coping capacity as follows:
E = traffic performance (mill. passenger-km × population density (persons / km2) = 0.50 × 0.25 = 0.125 [11]
Finland has somewhat long distances and hence a vast stretching road network which in terms of pure geographical exposure is making it somewhat vulnerable.

3. Risk indication and ranking system in EWENT
24
However, the population density is very low and fewer people are exposed to harmful weather. The former parameter belongs to the “second best” quartile in EU-27 and the latter to the “best” quartile.
S = infrastructure quality indicator of 5.8 (on the scale of 1 to 7, inversely ranked) = 0.25 [12]
Finland has a relatively good road infrastructure positioning it to the best quartile regard-ing road infrastructures in EU-27.
CC = GDP per capita (PPP) = 0.5 (inversely ranked) [13]
Finland has a relatively high GDP per capita which entitles the second best quar-tile within EU-27.
The vulnerability indicator for Finland’s road passenger system is then
Vr,p = 0.125 × 0.25 × 0.5 0.0156 [14]
For Bulgaria, for instance, the corresponding indicator gives a value of Vr,p = 0.0469, that is a clearly higher vulnerability indicator value. And the higher the indicator values are, the more vulnerability is expected for each country.
The vulnerabilities were derived for all modes, divided into passenger and freight, except for inland waterways, which was assumed to be carrying only freight.
3.3 Risk indicator
Finally, we define the risk is a product of natural hazard and vulnerability:
( ) × 1/ [15]
which means operationally that risk is the product of selected maximum probabili-ties of consequences and ranking numbers of vulnerabilities. The hazards – lead-ing to time delays, accidents or infrastructure damages or increased maintenance needs – follow the climate zone division, where several countries belong to one climate region, whereas the vulnerabilities are calculated for each type of traffic (freight, passenger) in each mode and in each country.
For example, the hazard indicator for Finland’s road accidents is Hr,a = 0.10527, coming out of the probabilities of heavy snow, leading to an increased accident risk, and which is shared between all countries in North European climate region (see Table 3). The vulnerability indicator for the road passenger system was Vr,p = 0.0156, as calculated previously.
Then the risk indicator for road accident risks for passengers would be
= 0.10527 × 0.00156 = 0.00164 [16]
which indicates still a very low value (see Figure 4). The hazard is relatively high, but the vulnerability of the sub-system is very low. The figure below illustrates the example. The risk indicator is a relative indicator, meaning that it should be viewed and treated as a ranking system. It is NOT an absolute measure of risk.

3. Risk indication and ranking system in EWENT
25
Figure 4. Example of risk indicator for road passenger accidents due to extreme weather.
3.4 Discussion on the method
The calculation method we used in the EWENT project to describe the overall risk of extreme weather events to different transport modes gives an overall picture of the risk situation in Europe. This is why we call it the risk panorama. These risk indicators can be used to compare situation in different countries both inside the climatic regions and within EU-27. It furthermore identifies the most vulnerable traffic modes in different parts of Europe. However, the results – the hazard, vul-nerability and risk indicators – must be considered as a “ranking system” and definitely not as exact measures of risk. Below follows some discussion points on the method.
Firstly: all variables we used were divided into quartiles, so that four major groups were formed, and a single figure describes the whole group. This process makes some differences between countries to vanish, and on the other hand cre-ated larger differences between countries that lay close to each other but were divided to different groups.
Secondly: some variables are closely correlated with each other. In statistical sense, e.g. in regression analysis this could create a theoretical problem. Luckily the risk indicator calculus is not a statistical analysis nor an explanatory model, but rather a descriptive index. Below is one example of such obvious internal correla-tion between GDP and infrastructure quality index. The full correlation matrix be-tween variables is shown in Table 5.

3. Risk indication and ranking system in EWENT
26
Figure 5. Correlation between GDP (PPP) and infrastructure quality indicator.
In the correlation matrix, the correlation coefficient r represents the linear relation-ship between two variables. It has range -1 < r < 1, which value of 1 means perfect positive correlation, 0 means a lack of correlation and -1 means perfect negative correlation. As it approaches zero there is less of a relationship (closer to uncorre-lated). The closer the coefficient is to either 1 or 1, the stronger the correlation between the variables. If the correlation coefficient is squared, then the resulting value (r2, the coefficient of determination) will represent the proportion of common variation in the two variables.
As shown in Table 5, the internal correlations between variables do exist, though they are not very strong. As mentioned before, there is correlation between GDP per capita and quality of infrastructure (r = 0.552) that might probably in-crease the differences between low income countries and high income countries. There is also correlation between population density and transport density (value of r varies from 0.020 to 0.621 depending on mode of transport), which might possibly increase the difference between dense populated countries and sparsely inhabited countries. Likewise there are correlations between GDP per capita – population density (r = 0.336) and GDP per capita – transport density (r varies from -0.058 to 0.533). Again, however these correlations are not very strong.
There are also several relatively high correlations spotted between some varia-bles (around 0.9). However, those high correlations are mostly between different transport modes’ transport volumes. However, this is not a problem since we are concerned with the interdependencies between four variables that we used for cal-culating a vulnerability indicator (i.e. GDP per capita, population density, quality of infrastructure, and one type of transport density – the first three columns in Table 5). In general, the interdependencies among our concerned variables do exist though relatively weak, with correlation coefficient ranges from 0.020 to 0.667.

3. Risk indication and ranking system in EWENT
27
Table 5. Correlation matrix (correlation coefficient r) between variables; statistically significance correlations are marked with stars (*).
The statistical significance of the correlations was also checked, using the limit values. The limit values for the correlations between variables were calculated by using Pearson tables (e.g. in http://www.gifted.uconn.edu/siegle/research/Correlation/ corrchrt.htm). In these calculations we used 27 pairs of data (EU-27), and had the degree of freedom of 25 (n-2). So, for significance level of 0.05, the limit value is 0.381. It means that those correlations which have coefficient values ≥ 0.381 are statistically significant, and marked with stars (*).
3.5 European climate regions and vulnerable modes of transport
3.5.1 The climatic regions
The EWENT WP2 study provided the first attempt to produce a comprehensive climatology of the adverse and extreme weather events affecting the European transport system by estimating the probability of phenomena for the present cli-mate (1971–2000) (Vajda et al., 2011). It also provides an overview of projected changes in some of these adverse and extreme phenomena in the future climate up to the 2050s. The following phenomena were analysed: strong winds; heavy snowfall; blizzards; heavy precipitation; cold spells; and heat waves. In addition, visibility conditions determined by fog and dust events, small-scale phenomena affecting transport systems such as thunderstorms, lightning, large hail and torna-does. Events that damage the transport system infrastructure were also considered.
There are large differences in the probabilities and intensity of extremes affect-ing transport systems across Europe. The Northern European and the Mountain-ous region are impacted most by winter extremes, such as snowfall, cold spells and winter storms, while the probability of extreme heat waves is highest in

3. Risk indication and ranking system in EWENT
28
Southern Europe. Extreme winds and blizzards are most common over the Atlan-tic and along its coastline. Heavy rainfalls occasionally impact the whole continent. Visibility conditions indicate a general improvement over the decades studied: severe fog conditions seem to have a strong declining trend at some of the main European airports.
Future changes in the probability of adverse and extreme weather phenomena are assessed based on six high resolution (ca. 25 x 25 km2) Regional Climate Model (RCM) simulations produced in the ENSEMBLES project. The studied time horizons are the 2020s (2011–2040) and the 2050s (2041–2070). The low number of climate models used did not allow probabilistic quantification of uncertainty, however, the range of projected changes is shown.
The multi-model approach adopted by the researchers indicates robust chang-es in temperature extremes. However, the projections are less coherent with re-gard to extremes in precipitation and wind. Both cold extremes and snow events are likely to become rarer by the 2050s. On the other hand, heavy snowfalls are not expected to decrease all over Europe; instead, the models project a slight increase over Scandinavia. Extreme heat is likely to intensify across the entire continent, being more accentuated in the south.
Climate change is expected to have both negative and positive impacts on the transport sector. A reduction in cold events would have many positive impacts, reducing disturbances caused, e.g. by slipperiness, as well as reducing ice at sea and on rivers, for example. On the other hand, the future increase in the frequency and severity of heat waves indicates the need to consider the heat tolerance of various transport modes. More specific examples are given in Chapter 3.
Due to the various climatic patterns, different regions of Europe are impacted by different extremes. In order to facilitate the assessment of impacts and conse-quences of extremes phenomena on European levels a map of the European climate regions was created by FMI. Based on the frequency and probability anal-ysis of the selected climatic extremes we differentiated six main climate regions: Northern European, Temperate Eastern European, Temperate Central European, Mediterranean, Mountainous and Oceanic regions.
The climate regions can be utilised in the reading of the results. The reader may identify the area of her/his interest from the map (Figure 6) and study the results of the corresponding climate regions in section 3. It is advisable to read also the results for the adjacent climate regions as the regions are often separated from each other rather by transition zones than sharply defined borders.

3. Risk indication and ranking system in EWENT
29
Figure 6. The improved map of European climate regions based on the frequency and probability analysis of the selected climatic extremes (modified from Vajda et al., 2011).

3. Risk indication and ranking system in EWENT
30
Each EU-27 member state belongs to one or several climate regions. For exam-ple, Italy presents both the Mediterranean and Mountainous climates, Norway and Sweden likewise present Northern European climate but some parts have moun-tainous characteristic, thus labelled Mountainous regions. Poland has both Tem-perate Central and Temperate Eastern regions present. In France there are in reality four climate regions present: Oceanic, Temperate Central, Mountainous and Mediterranean (however, we have used only three for France). Therefore the results that follow are shown by mode and climate regions, and some countries might appear in several places. These countries appear with an individual climate region identification sign, e.g. Poland_Tc, marking the Polish Temperate Central European climate region. All the identifiers are self-explanatory.
3.5.2 Enhancements of the European Severe Weather Database (ESWD)
The ESWD collects reports about events that are local, short-lived and severe, such as large hail, severe winds and tornadoes. Reports of such events are avail-able on an infrequent and inhomogeneous basis. Many of these events are not measured by conventional weather station networks due to their relatively small spatial and temporal scales. The reports in the ESWD are therefore collected are assembled through various sources including several National (Hydro-) Meteoro-logical Services (NHMS), voluntary observing networks, the general public as well as the media and other web sources.
The European Severe Weather Database (ESWD) was first introduced by Ful-vio Stel and Dario Giaiotti during the European Conference on Severe Storms (ECSS) 2002. It collects reports of eleven severe weather types occurring throughout Europe and adjacent regions. The reports of the ESWD are freely accessible via the web-interface www.eswd.eu, which started its operational phase in 2006. Since its introduction, the ESWD has been upgraded a number of times in terms of data format, web-interface, data sources, etc. The following par-agraphs summarize the enhancements within the project EWENT.
Within EWENT, the number of event types was enlarged. Those which are usually of convective nature: dust devil, funnel cloud, gustnado, heavy rain, large hail, tornado and severe wind events were complemented by winter event types: avalanche, heavy snowfall, ice accumulation, and by damaging lightning. The precise definitions of the weather types are described on the webpage.

3. Risk indication and ranking system in EWENT
31
Figure 7. Spatial distribution of all reports in the ESWD (30 May 2012); note that symbols overlap each other.
During the project EWENT, data from three countries were included into the ESWD, namely Austria, Cyprus, and Finland. The general public is encouraged to report their observations of severe weather via the ESWD webpage. To simplify the reporting process, the webpage is available in fourteen different languages. The following four were added within the project EWENT: Portuguese, Estonian, Turkish and Russian.
The ESWD contains 43 400 reports (Figure 7). The number of reports is rapidly increasing, especially of the four newly included weather types.
3.6 The most vulnerable transport modes in different parts of Europa
The most vulnerable transport modes in each climate region were tentatively as-sessed in EWENT D1 Review on extreme weather impacts on transport systems (Kojo et al., 2011) with the help of media reports database. These results were further sharpened in EWENT D3 Consequences of extreme weather (Mühlhausen et al., 2012). It appeared that certain traffic modes in certain climate zones were more vulnerable than the others when exposed to particular weather phenomena. The outcome of these studies is compiled into Table 6.
In the EWENT project the risk indicator for each country and traffic mode due to extreme weather events were calculated from basis of vulnerability indicator and hazard indicator. The vulnerability indicator varies between 0.25 (less vulnerable)

3. Risk indication and ranking system in EWENT
32
and 1.0 (more vulnerable) and the hazard indicator between 0.01 (less hazards) and 0.11 (more hazards). The overall situation of the whole Europe for each transport modes is seen in the Appendixes 6–8. In the next chapters the situation is discussed separately for different climate regions.
Table 6. The most vulnerable transport modes for extreme weather according to prior analysis in EWENT; Ro = road transport, Ra = railway transport, Av = aviation, Ss = short sea shipping, IWT = inland waterway transport.
Climate Region Strong winds
Heavy snowfall
Heavy precipitation
Cold spells
Heat waves
Blizzards
Northern European Region
Ss Ro, Ra Ro, Ra Ro, Ra — Ro, Ra, Av, Ss
Oceanic Region Ro, Ra, Ss Ro, Ra Ro, Ra Ro — Ro, Ra, Ss
Mediterranean Region Ss Ro Ro — Ro, Ra —
Temperate Central European Region
Ro, Ra, Av Ro, Ra, Av Ro, Ra, IWT IWT Ro, Ra, Av, Ss
Temperate Eastern European Region
Ro, Ra, Av Ro, Ra, Av Ro, Ra, Av IWT Ra, IWT Ro, Ra, Av, IWT
Mountainous Region Av Ro, Ra, Av Ro, Ra IWT IWT Ro, Ra, Av
It is notable that for the next chapters the most vulnerable traffic modes are se-lected by climate regions according to the most probable harmful event chains starting from the extreme or adverse weather phenomena and ending to harmful impacts to society in terms of accidents, delays or maintenance costs. In this case some of the most regular events even with harmful events are not taken into ac-count. For example, in the Northern European region the inland water transport is not highlighted even if it is stopped due to ice cover for almost every winter. Also aviation in this area is not critical enough despite long wintry conditions since airports in Northern area are prepared against winters and they have some excess capacity, for example extra runways which can be ploughed while the others are in use.

4. Regional and mode-specific risk assessment
33
4. Regional and mode-specific risk assessment
4.1 Northern European (sub-arctic) region
The Northern European region primarily located in Scandinavian countries and Russia, approximately north of 55° latitude, is typically dominated by extreme winter phenomena. The frequency of cold spells, heavy snowfalls and blizzards is highest in this region. Within this region the areas most impacted by winter ex-tremes are located north of 65° latitude, e.g. in Lapland, recording the highest probability of extreme cold spells (20–35 days/year for daily mean temperature under -20 °C in Lapland), heavy snowfall (40–50 days/year with 10 cm/day on the western coast of Norway), blizzards (locally over 140 cases during the 1971–2000 period), and extreme wind – especially over Iceland. Heavy rainfalls are frequent over the fjord coast and westerly exposed mountain ranges of Norway. Converse-ly, the frequency of hot spells is the lowest within the Northern European region (typically 5–20 days/year with maximum temperature over 25 °C).
In terms of projected future climate the winter extremes are predicted to mod-erate by 2050s in the Northern European region compared to their present range, with a substantial decrease in the frequency of cold spells (with 20–30 days per year), blizzards and snowfall events, while heavy snowfalls (over 10 cm/24 hour) indicate a slight increase. Maximum ice cover extent on the Baltic Sea and the probability for severe ice winters is expected to decrease. The average maximum fast ice thickness is likely to have decreased by 30–40 cm in 2060 relative to the control period 1971–2000, leaving the southern areas of Baltic Sea coast largely ice-free.
As anticipated in a warming climate, heat waves (> 25 °C) are expected to oc-cur more frequently (increase of ca. 5 days/year) in Scandinavia and Northern Russia, however, the projected increase is not as robust as in Southern Europe. Precipitation extremes (> 30 mm/day) record a slight intensification (1–2 days). Wind gusts show a tendency of strengthening over the Baltic Sea and weakening over the land areas, however, large uncertainties are related to estimates on changes in wind speed.

4. Regional and mode-specific risk assessment
34
Figure 8. Some of the most important transport corridors in Northern European climate region.
Due to sparse population the risk indicators for Northern area are not high. The main concern focuses on road and railway transport and short sea shipping. In the Figure 8 there are seen some of the most important transport channels from Northern European climate region.
4.1.1 Road transport
In road transport the Scandinavian area roads are among the most troubled in Europe. This is because of several most severe phenomena take place in this region. As the region has also versatility of landscape and climate ranging from southern parts where slippery conditions are common to coastal areas with strong winds and northern and eastern parts with extreme cold and heavy snowfalls. As temperature drops under 0°C, the roads become slippery which causes for exam-ple traffic jams. The most likely chain of events that could harm road transport in Northern European region starts when the weather temperature drops under -7°C. This increases the amount of accidents, traffic jams, and undesirable effects on traffic interoperability. Regarding accidents, the total amount of fatalities in the region was 1.514 in 2008, resulting in losses of 279 million euros in statistical

4. Regional and mode-specific risk assessment
35
valuation of life. In addition, severe and slight injuries result in additional personal damages that can be up to three times the value of fatalities3.
The other significant events are the wind gust (over 17 m/s) which cuts trees in this forestry region on roads causing accidents, delays and increased mainte-nance costs.
The countries in the region have over the past decade implemented rigorous road safety programmes, which have focused on identifying the major causes of accidents and measures needed to prevent them. For instance, the head-on colli-sions, which have been frequent in the regional roads, have been reduced by introduction of separation of lanes. For accidents, bad weather results easily in a large number of accidents over a short period of time, for instance heavy snowfall over a couple of hours can results in hundreds of accidents even in a geograph-ically small area. As a result of the measures taken the majority of fatalities in road transport are expected to take place on major roads, where speed limits are higher and accidents taking place are more severe as a result.
For delays, data availability on commuter volumes in cities is an issue. The greater the volumes of road users are, the greater the impact of extreme weather-related delays. In the Scandinavian area this means that the most significant im-pacts will be observed in the urban context, where volumes of road users are large. The occurrence of more than one severe weather phenomena at time can also worsen the impact and cause greater delays for road users.
Regarding maintenance costs, it is clear that extreme weather will impact the costs. However, in many cases the maintenance is regulated by contracts, which often include provisions for certain amount of work to be carried as part of the contract and for additional work not covered by contracts extra payments may be required. In last years the impact of heavy snowfall have extended over the whole winter period, as happened in 2009/2010 and 2010/2011 winters in Helsinki area in Finland. The snowfall created problems to maintain the infrastructure as roads and streets became narrow, parked vehicles became covered with snow and removal of snow and vehicles cost the municipalities of the region a significant amount in extra services required.
3 The European accident statistics do not provide a detailed breakdown of injuries by coun-tries so the exact estimation of all accident costs by climate regions is not possible. How-ever, in overall accident statistics the ratio between fatalities and all injury costs is approx-imately 1:3. This ratio will be used for all climate region estimates that follow.

4. Regional and mode-specific risk assessment
36
Figure 9. Risk Indicator in Northern European for road transport (passengers) due to extreme weather events; the indicator is given separately for delays, infrastruc-ture maintenance and accidents.
However, the risk indicator for road transport in Northern European region coun-tries (Figure 9) is not high compared to the risk indicators of other climate regions’ countries in Europe. This is due to sparsely populated areas and not thinner transport volumes. In addition the quality index of road infrastructure in this climate region is the highest in Europe, making the road structure more resilient to ex-treme weather.
4.1.2 Rail transport
For rail, the major impacts are resulting from strong winds, blizzards and cold temperatures. Wind gusts exceeding 17 m/s will start cutting down trees on tracks and cause delays. The impacts of wintry circumstances can be severe, as the network suffers from various impacts that require maintenance, at times in areas where maintenance is difficult. Prolonged or combined impacts cause overall more severe consequences. Unexpectedly also heat waves cause damages when tem-perature rises up over +25 °C. As a matter of fact they are supposed to cause main risks concerning working conditions and safety. All these weather phenome-na cause delays and cancellations of the service whenever rail buckling occurs.
In terms of accidents, the impact of extreme weather is created through poor visibility and obstacles on the tracks. Poor visibility leads to collisions with vehicles at road-rail level crossings. Obstacles on the tracks, including icy conditions, lead to crashes and deviations from tracks.
0
0,001
0,002
0,003
0,004
0,005
0,006
0,007
0,008
Denmark NE Finland Sweden
Delay
Infra.
Accident

4. Regional and mode-specific risk assessment
37
Risk Indicators for rail transport in Northern European (Figure 10) area coun-tries are not very high compared to other climate regions’ indicators. Congruent with road transport, this is due to sparsely populated areas and lower volumes of transport.
Figure 10. Extreme weather risk indicators in the Northern European region for rail freight transport.
4.1.3 Short sea shipping
The Northern European region includes the EU coast of the Baltic Sea and its approaches include the coastlines of Sweden, Northern Denmark and Finland as well as the whole Gulf of Finland.
This region is by far the most prone to ice conditions: Cold waves, snow, bliz-zards, low temperatures, ice accumulation and sea ice are another set of weather conditions affecting ships, especially in the Baltic Sea and the Gulf of Finland. Vessels operating in Northern European waters in late fall and winter are likely to experience some degree of topside icing on decks, bulwarks, rails, rigging, and spars. Icing can hinder shipboard activity and, in extreme cases, it can seriously impair vessel operations and stability. Smaller vessels are most at risk. The extent of the ice varies from year to year, and the winter of 2009/2010 saw more ice than had been experienced in the previous 20 years. This was after the relatively mild Baltic winter periods of the previous two years. This period of more ice than nor-mal meant that many ships needed icebreakers to free them after they had be-come stranded. The same applies to infrastructure on land: ice conditions affect equipment, personnel and can have adverse effects on everyday port activities.
0
0,0002
0,0004
0,0006
0,0008
0,001
0,0012
Denmark NE Finland Sweden
Delay
Infra.
Accident

4. Regional and mode-specific risk assessment
38
Accidents are regular incidents in the Baltic due to the high volumes of traffic at various critical shipping points, a situation further aggravated by weather condi-tions. One reason for the greater volume of trade is growing demand for fossil fuels, their majority coming from the Russian Federation. However, increased traffic leads to increased likelihood of an accident occurring, especially in the Northern European region where adverse weather conditions prevail. The principal risk to shipping is not so much extreme windstorms, as in the Atlantic, but a com-bination of frequent and sudden fog and bad weather. The prolonged winter cold spells, too, are fraught with hazard. Loss potential is higher because, in many cases, due to high freight rates and lack of appropriate vessels, the ships do not have ice-class hulls4. The great majority of the shipping traffic in the region uses the southern and central parts of the Baltic Sea and the Gulf of Finland, and de-spite the present economic conditions, ship voyages and cargo volumes are gen-erally increasing. The main bottlenecks in the region are in the south-western approaches between Denmark and Sweden, while the Finland-Åland-Stockholm corridor and parts of the Gulf of Finland also sees a significant number of acci-dents. These areas also have the greatest traffic concentrations.
Figure 11. Risk indicators in the Northern European region for short sea shipping freight transport due to extreme weather events.
The total number of vessels involved in accidents in the region in 2010 was up almost 19% on 2009, but significantly lower than the high in 2008. In the Baltic Sea during the severe or extreme severe sea ice winters a great number of “small
4 Info dealing with traffic restrictions e.g. due to sea ice is found on http://portal.liikennevirasto.fi/sivu/www/baltice/
0
0,005
0,01
0,015
0,02
0,025
Denmark NE Finland Sweden
Delay
Infra.
Accident
4. Regional and mode-specific risk assessment
39
accidents” take place as the routes through ice are narrow. The Baltic Sea vessel accidents in total represented almost 14% of the EU total for the year, which is similar to previous years. The most notable observation is that, although the ves-sel accident total was higher than in 2009, the 2010 figures were substantially lower than in 2007/2008. The potential for accidents increases significantly when ships operate in relatively confined waters, such as in parts of eastern Denmark, or in bad weather and/or without a pilot.
The risk indicator for maritime transport in Northern European (Figure 11) area is not a very high compared to other risk indicators in EU27. The higher value of risk indicator in Denmark is due to high population and high maritime traffic volumes.
Additionally, Baltic Sea is particularly vulnerable to environmentally severe ac-cidents: it is an exceptionally shallow sea with little turnover in the water mass.
4.2 Temperate Central European region
The Temperate Central European region is less affected by the very extreme weather events compared to the neighbouring regions. However, various adverse weather events might impact the area on a yearly basis. There is a 5% probability of heat waves (Tmax 35°C), 2% of heavy rainfall (> 30 mm/24 h) and on average 15–20 days/year with over 17 m/s wind gusts. Winters have occasionally blizzards and sporadically severe snowfall (5 events/year), especially over the southern part of this region, together with cold spells (up to 20 days).
A strengthening of warm extremes and decline in cold extremes are expected for this region by the 2050s. The intensification is more robust heading southward, increasing by 20 days/year for days with 32 °C. Accordingly, by 2070, the Central European region is expected to experience as many heat waves as the Mediterra-nean region currently does. The set of climate simulations analysed showed mixed patterns of changes for extreme wind gusts. Other studies, e.g. by Pinto et al. (2010) more clearly indicate an increase in wind storm impacts. Heavy rainfalls tend to increase in frequency over most of the area. The set of regional climate model runs analysed in this study does not project increase in heavy rains over the Balkan Peninsula. Snowfalls are also expected to reduce in number by 5–10 days/year due mainly to a shift from snow to rain in the warming climate.
Because of the populous areas and high transport density the risk indicators emerge for all transport modes in Temperate Central Areas. Some of the region’s most remarkable transport channels and nodes are presented in Figure 12.
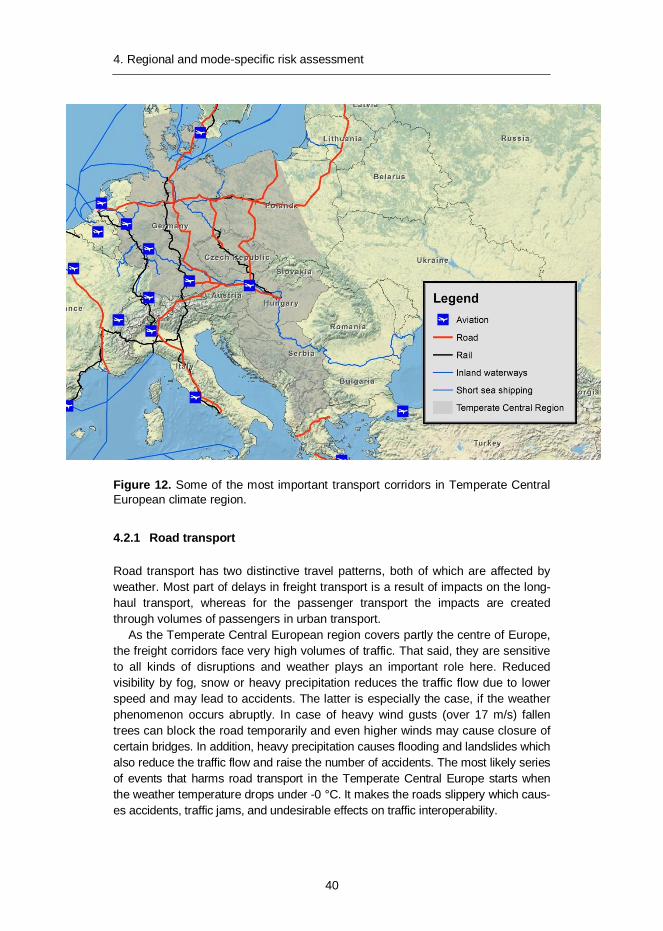
4. Regional and mode-specific risk assessment
40
Figure 12. Some of the most important transport corridors in Temperate Central European climate region.
4.2.1 Road transport
Road transport has two distinctive travel patterns, both of which are affected by weather. Most part of delays in freight transport is a result of impacts on the long-haul transport, whereas for the passenger transport the impacts are created through volumes of passengers in urban transport.
As the Temperate Central European region covers partly the centre of Europe, the freight corridors face very high volumes of traffic. That said, they are sensitive to all kinds of disruptions and weather plays an important role here. Reduced visibility by fog, snow or heavy precipitation reduces the traffic flow due to lower speed and may lead to accidents. The latter is especially the case, if the weather phenomenon occurs abruptly. In case of heavy wind gusts (over 17 m/s) fallen trees can block the road temporarily and even higher winds may cause closure of certain bridges. In addition, heavy precipitation causes flooding and landslides which also reduce the traffic flow and raise the number of accidents. The most likely series of events that harms road transport in the Temperate Central Europe starts when the weather temperature drops under -0 °C. It makes the roads slippery which caus-es accidents, traffic jams, and undesirable effects on traffic interoperability.

4. Regional and mode-specific risk assessment
41
High temperatures foster the fatigue of drivers and therefore, can also increase the number of accidents. In any case; an accident causes congestions and longer travel times for all passengers on route. A damage of pavement or constructions (e.g. bridges) either by weather phenomena or by accidents caused by those phenomena can lead to a temporary problem, as the capacity of detours is often limited or the rerouting is much longer than the original route.
For the urban transport, all of the above mentioned weather phenomena result in quite similar impact of the single vehicle, but due to a traffic pattern with more vehicles on a dense network, the overall impact is of significant scale. Especially during rush hours bad weather impact can result in a total breakdown of the whole road transport network. But it never takes more than a few hours to recover from this breakdown as many drivers look for shortcuts and rerouting by themselves. Furthermore, you have fewer fatalities due to bad weather as the speed is lower than on transit routes.
Central European passenger road transport is dominated by relatively well-functioning road corridor system, with large volumes of commuting and long-distance travelling passengers. The impact of extreme weather mainly results from heavy rains and occasional cold spells that bring along snowfall. Compared to the Northern European climate region the preparedness to tackle the extreme weather is lower, particularly for the impacts of cold spells and heavy snowfalls.
The extreme weather fatality costs in Temperate Central European climate re-gion are 300 million euros per year, with other accidents added totalling approxi-mately 1.2 billion euros. The figure is low compared to other regions with large volumes of traffic, explained partly by the purchasing power adjusted accident costs which get lower in lower income countries.
Figure 13. Risk indicators in the Temperate Central European region for road passenger transport due to extreme weather events.
00,010,020,030,040,050,060,070,080,090,1
Delay
Infra.
Accident

4. Regional and mode-specific risk assessment
42
The risk indicators for road transport in the Temperate Central European region are the highest in the EU-27 (Figure 13). Only in Denmark and Austria the indica-tor is at the same level as in the Northern European Region. In the Slovak Repub-lic and Slovenia the risk indicator is at the same level as in Germany. Germany is explained by high exposure (traffic volumes), the former countries by low coping capacity (GDP per capita) and susceptibility (infrastructure quality). The most vulnerable areas are in the Czech Republic and Poland due to exposure (high population and traffic density) together with low susceptibility (infrastructure quality) and coping capacity (GDP per capita).
4.2.2 Rail transport
Rail transport’s primary concerns in the Temperate Central European region are snowfall, low temperature and heavy precipitation. These extreme weather events lead to both delays in freight as well as passenger transport. Freight transport is primarily affected on long haul routes and passenger transport being affected in the commuter rail systems. In the case of snowfall and low temperatures the fro-zen switches might lead to e.g. a blockage of tracks and also further to delays. The likely weather phenomenon with potential harm to rail transport in Temperate Central Europe originates from two extreme phenomena: Wind gusts and heat waves when temperature rises up over +25°C. Heat waves are main reasons rail buckling but also carry risks for health related consequences. Wind gusts together with lightning and thunderstorms – which as well are common in association with heat waves – cut trees on tracks and damage wire grids ending to accidents, delays and maintenance costs. In addition heavy precipitation (30 mm/d) has a great prob-ability to damage railway embankments whenever drainage systems fail.
In comparison to the road transport the effects of extreme weather phenomena are the same for the most part. Focusing on the urban transport, disruptions caused by extreme weather might cause a breakdown of the whole system with significant negative effects on passengers in terms of travel times. In opposite to road transport, recovery times are higher as re-routings/shortcuts are more com-plex than on roads.
Similarly to road transport, there are not too many issues affecting the rail transport, with respect to extreme weather conditions. Occasional wind gusts and impacts of cold spells and snow fall are similar to rest of the Europe. These occur less frequently than in other climate regions but as the readiness of the region is less developed the impacts can be significant even if less frequent.

4. Regional and mode-specific risk assessment
43
Figure 14. Risk indicator in the Temperate Central region for rail freight transport due to extreme weather events.
As seen in Figure 14 Austria and Denmark produce the base level benchmark to the risk indicator in case when population and traffic density are lower and the infrastructure quality level and GDP are higher. Germany, the Czech Republic represent the situation where either population and traffic density are high and the infrastructure quality is high, or population and traffic density are low and the quali-ty of infrastructure is also on a low level. The highest risk indicator is in Poland where all the vulnerability factors increase the risk.
4.2.3 Aviation
The aviation system is highly sensitive against disturbing weather effects such as wind gusts, snow falls or cold waves. Compared to other modes of transport even slight disruptions in the flight plans at airports being at their capacity limit can lead to massive disruptions throughout Europe and the rest of the world. The Temper-ate Central European climate region (covering areas such as Germany, Poland, Czech Republic and other countries in the very East of the European Union) is together with the Oceanic region the most important one with regard to the amount of Europe’s leading airports in terms of movements and passengers per year. With the airports in Frankfurt and Munich number two and six and with Copenhagen ranked number 10, three of the main European airports are located in this region (EUROCONTROL, 2008).
The most likely series of events that harms aviation in this region takes place when the wind gusts over 17 m/s blow over the area. In addition fog and cold wave and especially even 1 cm/day snow are considered as prevailing weather
0
0,01
0,02
0,03
0,04
0,05
0,06
Delay
Infra.
Accident

4. Regional and mode-specific risk assessment
44
events in this climate region combined with the high volume of passengers in the area, the effects in terms of delays can be described as massive on a European level. Due to high safety standards and professional staff on-board (flight crew) as well as on ground (ATC) the number of accidents is negligible within Europe.
With regard to the outcomes of the EWENT work package 2 (D2.1 Probabilities of adverse weather affecting transport in Europe: climatology and scenarios up to the 2050s; Vajda et al., 2011) the probabilities of cold waves and snowfalls are expected to decrease whereas heat waves are expected to increase.
Figure 15. Risk indicators in the Temperate Central region for aviation passengers transport due to extreme weather events.
As seen in Figure 15 the risk indicator for accidents due to extreme weather is calcu-lated to be zero. This ensues the calculations which were done by taking into ac-count the accident rates during the last years (accidents caused by adverse weather). Congruent with the risk indicators of other transport modes the highest risk indicator is in Hungary and Poland where high population and transport density together with low GDP and low quality of infrastructure produce a high risk level. However, the risk level in aviation is significantly lower than in railway or road transport.
4.2.4 Inland waterways
In this region the most important waterways of Europe are present, comprising major parts of the Rhine-Main-Danube axis, the German waterways (e.g. Moselle, Neckar, Elbe) and canals, the Odra on the German-Polish border as well as the Sava and Tisza joining the Danube in Serbia. Parts of the Upper Rhine as well as the German and Austrian Danube in this climatic region coincide also with the
00,0050,01
0,0150,02
0,0250,03
0,0350,04
0,0450,05
Delay
Infra.
Accident

4. Regional and mode-specific risk assessment
45
Mountainous region. Poland’s other remarkable inland waterway is Vistula which runs from the western part of Carpathian Mountains through Kraków and Warsza-wa cities and ends in Gdansk at the Baltic Sea.
The most frequent extreme weather event affecting inland waterway transport is a cold wave resulting icing of river surface (and other surfaces), which causes reduced manouvreability, speed reduction, accidents for working staff and reduced safety of navigation. In spite of its frequency there are other phenomena which can also cause harm to inland waterway transport, as high water and floods due to heavy precipitation making the sailing upstream difficult, and low water due to drought and heat. Of less importance is the occurrence of wind gusts and reduced visibility. The impact of extreme weather events on inland waterway transport is depending on the different regions and local hydrological conditions under consideration.
Considering the German waterways in the Rhine area, transport on the Middle Rhine shows no vulnerability with respect to consequences of high water. On the Upper Rhine navigation may be suspended by a few days a year. Navigation on the Moselle, the Saar and in particular on the Neckar is vulnerable to the occur-rence of high waters. On the Neckar suspension of navigation due to high water may exceed 30 days a year in severe cases. In the Rhine area ice occurrence has no impact on inland waterway transport. The occurrence of drought in association with heat waves can affect transport on the Rhine by restricted water depths. A severe low water situation occurred e.g. in 2003. Important locations limiting the cargo carrying capacity of vessels in the case of low-water occurrence are the Rhine stretches at Kaub and Ruhrort.
Considering the Main, the Main-Danube Canal as well as the German and Aus-trian Danube, the German Danube shows a high vulnerability with respect to the occurrence of high waters. Navigation may be suspended by up to approximately 20 days a year in severe cases. On the Main-Danube Canal inland waterway transport shows only little vulnerability with respect to high water. However, there ice occurrence may lead to suspension of navigation by more than 40 days a year. Severe ice conditions occur approximately once in ten years.
Considering the Danube from Hungary to the Iron Gates vulnerability to high waters and flooding is present. Ice occurrence leading to suspension of navigation is possible on almost the entire Danube, even in the lower part (e.g. 2012). How-ever, ice occurrence is decreasing over time due to human influence as well as possibly due to global warming. On the Upper and Central Danube low water occurrence takes place roughly in September, extending till January.
Critical waterway sections with respect to low water occurrence and relevance to the cargo carrying capacity of vessels are the stretch between Straubing and Vilshofen on the German Danube, the free-flowing sections in the Wachau and between Vienna and Bratislava on the Austrian Danube, and the free flowing sec-tions between Gabcikovo and Budapest as well as Budapest and Mohács on the Hungarian Danube.

4. Regional and mode-specific risk assessment
46
Figure 16. Risk indicators in the Temperate Central region for inland waterways freight transport.
As seen in Figure 16 the highest risk indicators for inland waterway transport are in Hungary. This is due to the high population density and high amount of transport, low coping capacity (GDP) and low quality index of infrastructure (susceptibility). It is notable that the risk for accidents is in each country is very low compared with the risk indicator of delays and infrastructure damage or maintenance costs.
4.2.5 Short sea shipping
Included in this region are the coastlines of Germany, western Poland and Southern Denmark.
Wind and waves, fog, rain and low temperatures are considered the prevailing weather events in the region and, when extreme, these phenomena threaten both the operations and the infrastructure of short sea shipping. The most likely series of events that harm short sea shipping in Temperate Central Europe take place when the wind gusts exceed 17 m/s. Extreme winds are contributing accidents, such as collisions, and damage to vessels, cargo and humans. The other signifi-cant event chain happens when the temperature falls under freezing point. Usually just under -0°C temperatures do not build ice cover over the sea, but longer peri-ods clearly under the freezing point will do that. This affects the navigation and may contribute to accidents and delay. Cold weather is also one main reason for health related and occupational accidents.
As in past years, the highest concentrations of accidents occurred in the re-gion’s main bottlenecks, where large numbers of vessels are regularly brought together with less room to manoeuvre and where there are different types of ob-
00,020,040,060,080,1
0,120,140,16
Delay
Infra.
Accident

4. Regional and mode-specific risk assessment
47
structions to navigate through and around. For example, such concentrations occurred in and around the biggest ports in Germany and Denmark (Hamburg, etc.) and in the Kiel Canal. In 2010, as is usually the case, these bottlenecks saw a significant number of collisions and groundings.
Figure 17. Risk indicators in the Temperate Central region for passenger short sea shipping due to extreme weather events.
As seen in Figure 17, the risk indicator is again highest in Poland due to high exposure parameters (density of population and transport) and low level of port infrastructure quality and low coping capacity (GDP). Accident risks do not seem to however represent a significant share of the total risk.
4.3 Temperate Eastern European region
The Temperate Eastern European climate region differs from the Western Central European one by the more pronounced effect of continentally. Accordingly, cold spells are more frequent and intense during winter, 30 days/year with below -7°C in the western part of the region, increasing eastward to 70–80 days/year. Very extreme cold spells (under -20°C) are frequent over the eastern part. Blizzards and heavy snowfall events (> 10 cm/24 h) impact this eastern European region about 5 times a year; very heavy snowfall events may also occur sporadically. Days with temperature exceeding +32 °C eventuate with a 5% probability every year, being more frequent over the southern part of the region (~10%). The spatial variation of heavy rainfalls does not differ from the general European patterns, although very heavy events ( 100 mm/24 h) may locally occur.
00,010,020,030,040,050,060,07
Delay
Infra.
Accident

4. Regional and mode-specific risk assessment
48
Regarding the projected changes in extremes, a decrease in cold spells (by 5–10 days for < -7 °C), snowfall (by 1–5 days for 10 cm/day snow) and blizzard events, is expected, and a significant increase in warm extremes (up to 20 days for +32 °C) by the 2050s. Wind gusts and heavy rainfall long-term projections show mixed patterns over this region, with the frequency of heavy rainfall tending to increase over most of the region expect in the south.
Figure 18. Some of the most important transport corridors and nodes of EU mem-ber states in Temperate Eastern European climate region.
In the Temperate Eastern European climate region there is located only some of the EU-27 states. In this study only these areas were taken into account and hence, the main transport channels and nodes are presented just from these states.
As seen in Figure 18 the main transport corridors in this area are river Donau and Route E67 (Via Baltica) from Poland through Baltic area.
4. Regional and mode-specific risk assessment
49
4.3.1 Road transport
Road traffic/transport has two distinctive travel patterns, both of which are affected by weather. Most of freight transport delays on roads are a result of impacts on long-haul transports, whereas for the passenger transport the impacts are created through volumes of passengers in urban transport.
As the Temperate Eastern European region covers partly the centre of Europe, the freight corridors carry very high volumes. Hence, they are sensitive to all kind of disruptions and weather plays an important role. Reduced visibility by fog, snow or heavy precipitation reduces the traffic flow due to lower speed and leads to acci-dents. As a matter of fact, the most likely series of events that harms short road transport in the Temperate Eastern Europe takes place when the temperature falls under -0 °C causing slipperiness of road surfaces. This is especially the case, when this weather phenomenon occurs abruptly. In this region also wind gusts (17 m/s) might cut trees on roads or close bridges causing especially delays for road trans-ports. Heavy precipitation (30 mm/d) has same effects due to floods and mudslides.
In addition, heavy precipitation, snow and ice generate slippery roads, which also reduce the traffic flow and increase the risks for accidents. High temperatures foster the fatigue of drivers and therefore, can also increase the number of acci-dents which could cause congestions and longer travel times. In very extreme high temperature situations the pavement can be damaged. A damage of pavement or constructions (e.g. bridges) either by weather phenomena or by accidents caused by those phenomena can lead to a long term problem, as the capacity of detours is often limited or the rerouting is much longer than the planned route.
For the urban transport, all of the above mentioned weather phenomena result in quite similar impacts and consequences, but due to a complete different traffic pattern with more vehicles on a dense network, the overall impact is more severe. Especially during rush hours bad weather impact can result in a total breakdown of the whole road transport network. But it never takes more than a few hours to recover from this breakdown as many drivers seek shortcuts and alternative routes. Furthermore, there are fewer fatalities due to bad weather as the speed is lower than on transit routes. The fatalities in urban areas are often pedestrians and bicycles, which collide with vehicles. Also these accidents could be associated with the weather context, but empirical studies are lacking.
The Temperate Eastern European region is plagued by a large volume of road accidents, which are results of poor preparedness to extreme weather conditions and in some countries a poor culture in terms of driving and traffic behaviour. The estimated cost of fatalities in this climate region is 860 million euros annually, with over 2.5 billion euros in other injury costs, when adjusted for purchasing power parities. This is proportionally a smaller figure than the actual amount of fatalities as the countries have on average a lower per capita GDP levels than other climate regions in Europe.
Major weather phenomena that affect the region can be quite harsh and lead to prolonged periods of impacts, as shown by recent winter conditions in the region.

4. Regional and mode-specific risk assessment
50
For example according to CNN news5 during the January 2012 the death toll rose to at least 39 in Romania, 53 deaths in Poland, and over 120 in Ukraine due to heavy snow and cold weather. Transport hubs in central and eastern Europe were closed due to snow. Bosnian authorities declared a state of emergency in Saraje-vo and the state of emergency was in force in most of Serbia.
In Temperate Eastern region the risk indicator is highest in countries where population density and traffic density are high and quality of infrastructure is low, as in Poland and Romania (Figure 19). Even if the infrastructure quality index is low also in the Baltic States the low population and traffic density keep the risk indicator low.
Figure 19. Risk indicators in the Temperate Eastern region for road freight transport due to extreme weather events.
4.3.2 Rail transport
With regard to rail transport the primary concerns in the Temperate Eastern Eu-rope region are snowfall, low and high temperatures and heavy precipitation. Rail transport in this climate region suffers from these impacts, also due to the fact that in many countries the rail industry is using outdated equipment, which is even more vulnerable to the impacts of weather. The signaling system can also be affected by the weather conditions similar to the Northern European climate re-gion. Anything that harms power supply or communications systems, are of con-cern. Typically thunder strikes and falling trees are the main causes of disruptions.
5 http://www.wibw.com/weather/headlines/Dozens_Die_Across_Eastern_Europe_In_ Severe_Winter_Weather_138812124.html (access 4.5.2012)
00,020,040,060,080,1
0,120,140,16
Delay
Infra.
Accident

4. Regional and mode-specific risk assessment
51
There is no cost data available from this region’s countries regarding the mainte-nance costs associated with the extreme weather.
The extreme weather events lead to delays in both freight and passenger transport. The heat waves over +25 °C may cause health related consequences and maintenance costs due to rail truck buckling after thermal extension, when these heat waves are prolonged and intensified. Freight transport is primarily affected on long haul routes and passenger transport being affected in the com-muter rail systems. In case of low temperature there might occur with frozen switches leading to e.g. a blockage of tracks, slower speeds and delays. In addi-tion, wind gusts over 17 m/s may cut down trees on trails which cause delays and heavy precipitation (30 mm/d) can damage railway embankment when turned into floods and thereafter cause delays and extra maintenance costs.
In comparison to the road transport the effects of extreme weather phenomena are the same for the most part. Focusing on the urban transport, disruptions caused by extreme weather might cause a breakdown of the whole system with significant negative effects on passengers extending their travel times. In opposite to road transport, recovery times are higher as infrastructure is more sensitive to weather effects and re-routing/shortcuts are more complex than on roads.
Figure 20. Risk indicators in the Temperate Eastern region for passenger rail transport due to extreme weather events.
Figure 20 shows that the risk indicator for rail transport is highest in countries where both the population density and traffic density are high and coping capacity and infrastructure indicator low. Due to high possibility of heat waves also the risk for human accidents or injuries is on high level.
0
0,01
0,02
0,03
0,04
0,05
0,06
Delay
Infra.
Accident
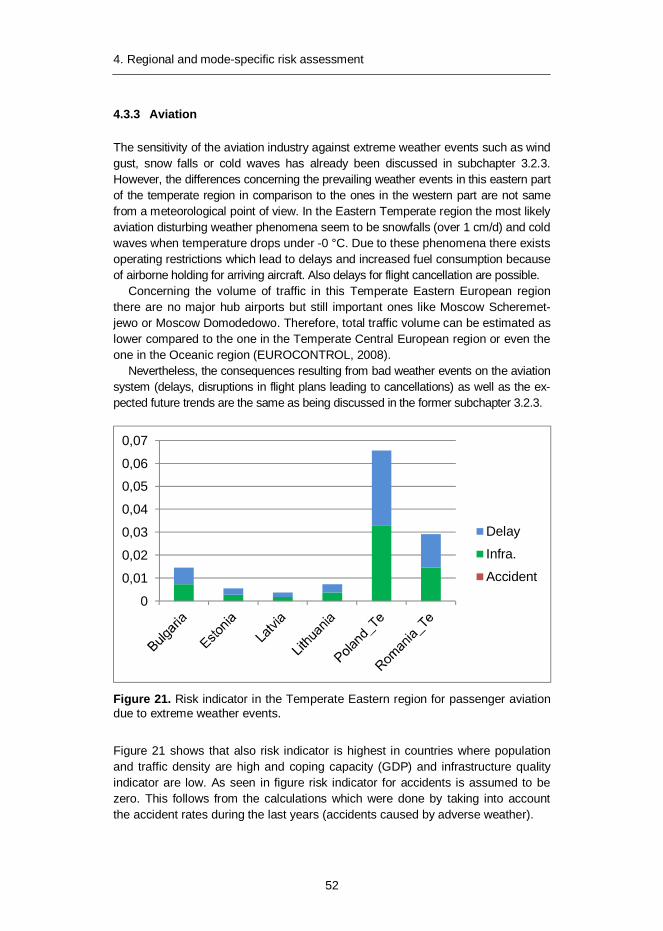
4. Regional and mode-specific risk assessment
52
4.3.3 Aviation
The sensitivity of the aviation industry against extreme weather events such as wind gust, snow falls or cold waves has already been discussed in subchapter 3.2.3. However, the differences concerning the prevailing weather events in this eastern part of the temperate region in comparison to the ones in the western part are not same from a meteorological point of view. In the Eastern Temperate region the most likely aviation disturbing weather phenomena seem to be snowfalls (over 1 cm/d) and cold waves when temperature drops under -0 °C. Due to these phenomena there exists operating restrictions which lead to delays and increased fuel consumption because of airborne holding for arriving aircraft. Also delays for flight cancellation are possible.
Concerning the volume of traffic in this Temperate Eastern European region there are no major hub airports but still important ones like Moscow Scheremet-jewo or Moscow Domodedowo. Therefore, total traffic volume can be estimated as lower compared to the one in the Temperate Central European region or even the one in the Oceanic region (EUROCONTROL, 2008).
Nevertheless, the consequences resulting from bad weather events on the aviation system (delays, disruptions in flight plans leading to cancellations) as well as the ex-pected future trends are the same as being discussed in the former subchapter 3.2.3.
Figure 21. Risk indicator in the Temperate Eastern region for passenger aviation due to extreme weather events.
Figure 21 shows that also risk indicator is highest in countries where population and traffic density are high and coping capacity (GDP) and infrastructure quality indicator are low. As seen in figure risk indicator for accidents is assumed to be zero. This follows from the calculations which were done by taking into account the accident rates during the last years (accidents caused by adverse weather).
0
0,01
0,02
0,03
0,04
0,05
0,06
0,07
Delay
Infra.
Accident

4. Regional and mode-specific risk assessment
53
4.3.4 Inland waterways
In this region the most important waterway is the Lower Danube extending from the Iron Gates to the Black Sea. This waterway has shown vulnerable to high waters and flooding as happened for example in 2006. Ice occurrence due to cold waves (temperature below 0 °C leading to suspension of navigation as well as accidents and damage of vessels and installations on the river banks is possible in this part of the Danube (e.g. 2012).
Compared with the Upper and Central Danube low water occurrence takes place little earlier, e.g. in August. As it is expected that the amount of hot days will increase in this area leading to higher evapotranspiration in summer, the low water situation may become severer there in the future. Between the Serbian-Romanian-Bulgarian border and Braila are several critical stretches with respect to low water occurrence (e.g. 2011).
Figure 22. Risk indicators in the Temperate Eastern region for inland shipping (freight).
As seen in Figure 22 the risk indicator is highest in Poland and Romania where the traffic and population density are highest and coping capacity (GDP) and quali-ty of infrastructure are low. The high risk indicator for maintenance costs are due to cold waves which may cause infrastructure damage via accidents.
4.4 Mediterranean region
The Mediterranean Sea and its coastal areas are affected particularly in summer by the highest frequency of heat waves in Europe (locally, a 25 % probability of
0
0,02
0,04
0,06
0,08
0,1
0,12
0,14
Delay
Infra.
Accident

4. Regional and mode-specific risk assessment
54
daily maximum temperatures over 32 °C). Locally thunderstorms and lightning frequency as well as intensity heavy rainfall reach high levels. However frost days and snowfalls may occur on an annual basis, while extreme winter events are uncharacteristic.
Fog is also a problem, creating low visibility and affecting all transport modes, regardless of type (radiation or advection fog). The frequency of mist and fog over the Eastern Mediterranean generally shows a maximum in the warm season (radi-ation fog) and a minimum in winter, contrary to Western Mediterranean where fog is common in autumn and winter. Fog events create problems with visibility in the aviation and maritime sector, mostly. For example, in Cyprus where episodes of radiation fog can become severe during the summer, when visibility is lower that 1 km, warnings are issued for ships and local airports. If the reduced visibility episodes persist for more than 6 hours, an EMMA warning is issued through Me-teoAlarm (www.meteoalarm.eu).
Dust events also impact the region occasionally, especially in the south-eastern Mediterranean. Visibility may deteriorate as a result of suspended dust blown from the African deserts by southerly winds in front of travelling depressions in winter or in spring. The trend analysis of synoptic classes with no-dust and dust deposition events indicates a tendency to decrease, however the classes with frequent dust deposition seem to become more frequent. When the visibility due to suspended dust is lower than 1 km a warning is issued for ships and airports, just like in the case of fog.
Neither fog nor dust was included in EWENT’s probabilistic hazard analysis, but both clearly pose an additional issue to be investigated in more detail.
The multi-model mean indicates a robust intensification of warm extremes over the Mediterranean region, with an increase of 30–40 days/year of daily maximum temperature above 32 °C and of 5–10 days of those above 43 °C. According to the regional climate model projections, the frequency and intensity of warm ex-tremes increases more rapidly in this region than over the rest of Europe. The spatial variation of changes in heavy rainfall events indicates mixed patterns, with no significant change over most of the Mediterranean basin. Cold temperatures and snowfalls decrease by 5–10 days, on average, over this region. Extreme winds tend to weaken, except in the eastern part of the region, where it locally alternates with strengthening.

4. Regional and mode-specific risk assessment
55
Figure 23. Some of the most important transport channels in the Mediterranean climate region.
In the Mediterranean climate region the main concern is road and railway transport and short sea shipping. In the figure 23 there are presented some of the most important transport channels in this region. As described later in subchapter 3.4.4 the cruisers and other ships carrying especially tourists between islands and con-tinent form a significant amount of short sea shipping all over the coast. These routes are not included in the figure above.
4.4.1 Road transport
The Mediterranean region includes the countries of Portugal, the larger part of Spain, Italy, Croatia, Greece, Cyprus, Malta, and Southern France. This region isn’t prone to weather phenomena such as low temperatures and wind gusts that are proving harmful to other areas and there is no particular concern associated with their consequences (The Mountainous region, situated half within the Mediter-ranean region is excluded, since it faces the same concerns as the other Moun-tainous regions). However, the fact that the road network of this area is not as dense as the one in the Temperate region (and even less in the eastern sector than the western one) and is, somewhat, underdeveloped compared to Northern Europe’s region, raises concerns to the degree this region can respond to snow-falls, heavy precipitation, wind gusts and excessive heat that are the primary con-cerns and most likely weather phenomena to start harmful series of events for road transport. Less dense road network does increase exposure on one hand (more roads to be affected), but on the other it lessens the alternative routes in case of link disruption.
Heavy precipitation (30 mm/d and above) can lead to a multitude of problems such as floods and landslides, which can have severe consequences to road transport. Susceptible regions for flood are south-eastern Spain, southern France, northern Italy and southern France (Mountainous Region). Two types of conse-

4. Regional and mode-specific risk assessment
56
quences emerge as the response to heavy precipitation: slower driving speeds and changes in accessibility. The consequences are again related to accident increases and longer travel times. Landslides occur mainly in Greece, Italy, south-ern France and the Pyrenees, Southern Spain and Portugal.
High temperature has three types of impacts: increased accident rates, delays and diversions. Increased accident rates are linked to impact of heat on road us-ers, the pavements and asphalt. Delays are a result of restrictions in road mainte-nance and construction. Diversions are also linked to maintenance and construction and result in delays due to increase in travel time and possible congestion impacts. These impacts are most likely to be severe in the Mediterranean climate region.
Figure 24. Risk indicators in the Mediterranean region for road freight transport due to extreme weather events.
As seen in Figure 24 the highest risk indicator is in Italy due to its dense popula-tion and high volumes of road transport. As the most recurrent extreme weather phenomena is heat wave which impacts mostly on fluency of traffic and mainte-nance costs the risk indicator for accidents is low relative to other risks.
4.4.2 Rail transport
The rail network of the Mediterranean region shares many characteristics with the road network: it is as a whole, compared to the Northern Europe one for instant somewhat underdeveloped and of lower quality.
The most recurrent phenomena in this region are wind gusts (over 17 m/s) and heat waves. Wind gusts together with thunderstorms pose threat to railways through lightning and power cuts. In this area the most frequently reported weather phenomenon to cause accidents is temperature extremes and temperature varia-
00,0050,01
0,0150,02
0,0250,03
0,0350,04
0,0450,05
Delay
Infrastructure
Accident
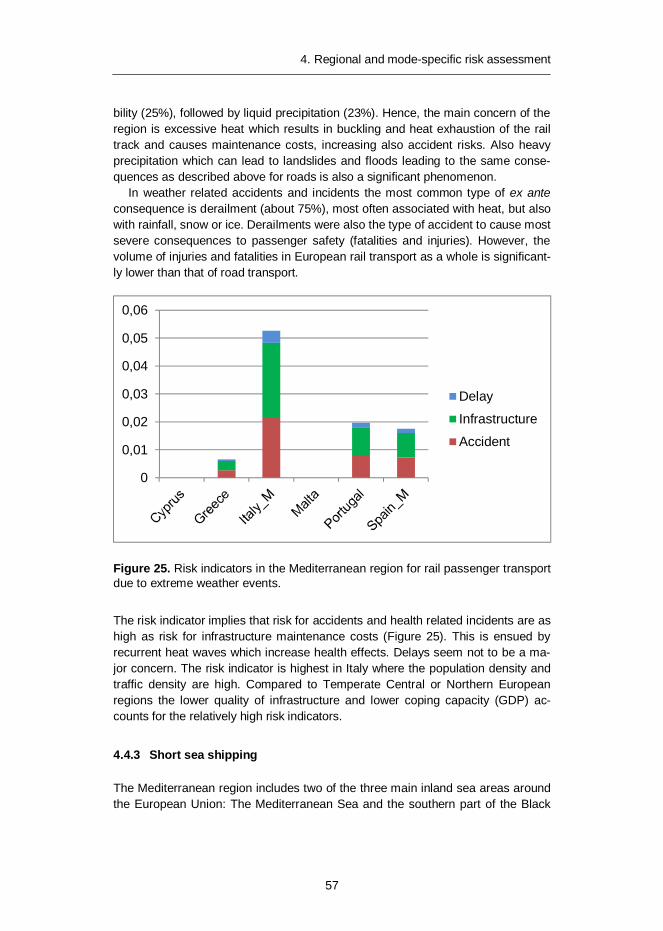
4. Regional and mode-specific risk assessment
57
bility (25%), followed by liquid precipitation (23%). Hence, the main concern of the region is excessive heat which results in buckling and heat exhaustion of the rail track and causes maintenance costs, increasing also accident risks. Also heavy precipitation which can lead to landslides and floods leading to the same conse-quences as described above for roads is also a significant phenomenon.
In weather related accidents and incidents the most common type of ex ante consequence is derailment (about 75%), most often associated with heat, but also with rainfall, snow or ice. Derailments were also the type of accident to cause most severe consequences to passenger safety (fatalities and injuries). However, the volume of injuries and fatalities in European rail transport as a whole is significant-ly lower than that of road transport.
Figure 25. Risk indicators in the Mediterranean region for rail passenger transport due to extreme weather events.
The risk indicator implies that risk for accidents and health related incidents are as high as risk for infrastructure maintenance costs (Figure 25). This is ensued by recurrent heat waves which increase health effects. Delays seem not to be a ma-jor concern. The risk indicator is highest in Italy where the population density and traffic density are high. Compared to Temperate Central or Northern European regions the lower quality of infrastructure and lower coping capacity (GDP) ac-counts for the relatively high risk indicators.
4.4.3 Short sea shipping
The Mediterranean region includes two of the three main inland sea areas around the European Union: The Mediterranean Sea and the southern part of the Black
0
0,01
0,02
0,03
0,04
0,05
0,06
Delay
Infrastructure
Accident

4. Regional and mode-specific risk assessment
58
Sea. In the Mediterranean Sea the EU parts include the coasts of Spain, southern France, Italy, Malta, Slovenia, Greece and Cyprus.
Although the Mediterranean (like the Black Sea) is an enclosed body of water, and although the sea conditions are usually not as bad as in the more northerly waters, major storms and heavy seas can still occur in both from time to time. Wind, waves and rain are the most common extreme weather phenomena associ-ated with the region; however dust storms and heat waves may prove to have a significant effect in the future.
The Mediterranean Sea has two important features: It includes three major bot-tlenecks (Gibraltar, the Suez Canal and the Bosporus) and has a very heavy tour-ist load. A number of areas of high traffic density exist, with domestic traffic being of great significance. This is particularly the case in and around Greek waters where both passenger and freight traffic is significant (in this case to, from and between the islands), the Adriatic and also traffic between the islands of Sicily, Malta, Corsica, Cyprus and the mainland. The through traffic is also heavy, with the largest volume using the main east-west lanes between the Indian and Atlantic Oceans, with ships passing between the Suez Canal and the Straits of Gibraltar. In addition, there is also a large volume of through traffic using the main north-south lanes that pass through the Aegean Sea between Greece and Turkey. This includes a significant number of tankers, due largely to the requirement to move oil from both the Black Sea and Gulf regions to different markets. Any significant change in weather patterns in those bottlenecks (such as increasing duct events in the Suez Canal) may have adverse effects in the shipping industry of the area.
Recreational shipping and tourism is quite an important factor of maritime ac-tivities in the area. The general view of the industry is one on the rise: In 1999 an estimated 1.9 million Europeans cruised but by 2009 this figure had grown to 4.9 million, representing an increase of 163%. Greece, Italy, Spain and France ac-count for more than 65% of the total of the cruise destinations in 2009.
Weather conditions in the area play a significant role, especially during transit and have a significant effect on passenger’s expectations. Furthermore, there are factors that have conflicting natures and affect the general view: rising tempera-tures in the Mediterranean may prove too much for some who eventually shift their focus to “higher latitudes” but, on the other hand, rising temperatures may also extend the “warm period” of the area, thus providing more time for peak-season cruises. Also, the fact that ships such as yachts are in the middle-to-small scale and, usually sail close to the coast, makes them more susceptible to adverse weather conditions. Finally, since passenger vessels, such as ferries, are more susceptible to winds and their regulation regarding embarking-disembarking are more strict (wind thresholds are lower than cargo ships) an increase or change in the wind fields of the area could make passenger ships suffer more downtime.
The Mediterranean along with the Black Sea, despite the milder climate, expe-riences the second largest EU maritime accident numbers: over 22% of the EU accident total of 2010 (up from 18% in 2009 and 17% in 2008). Geography has a significant impact on accidents. The Aegean Sea has the highest accident concen-trations, mainly because of the huge volume of traffic to and from the islands,

4. Regional and mode-specific risk assessment
59
between the islands, and between the Mediterranean Sea and the Black Sea. However, It is of note that the number of accidents reported in and around Greek waters substantially reduced in 2010 (down 24% from 2009 and 45% from 2008), and was the lowest reported in the last four years.
The most recurrent event chain due to extreme weather phenomena starts from the heat waves when the temperature stays for long time over 32 centigrades (daily average). Mostly it harms cargo and staff and due to reduced vitality also accidents are more possible.
Figure 26. Extreme weather risk indicators in the Mediterranean region for short sea passenger shipping.
As seen in Figure 26 in Mediterranean area the risk consists of risk for infrastruc-ture and risk for accidents. This is due to the studied most probable event chains due to heat waves which does not necessary cause delays but mainly increases maintenance costs (infrastructure) and health related consequences. As seen, the risk indicator is high in the areas where there is dense population and high amount of passengers, as Greece, Italy, Malta and Portugal.
4.5 Oceanic region
The oceanic region located over the western part of the continent – British Isles, France, Spain, Belgium, Luxembourg and the Netherlands, features relatively moderate frequency of extreme winter phenomena, such as blizzards, extreme cold spells (on average less than 10 days/year with -7 °C and very rarely cases with < -20 °C) and heavy snowfall (in general 3% probability of snowfall). On the other hand, as a consequence of the reduced probability of extreme winter events,
00,0020,0040,0060,0080,01
0,0120,0140,0160,018
Mediterranean Short sea shipping Passenger
Delay
Infrastructure
Accident

4. Regional and mode-specific risk assessment
60
most of the affected countries have a greatly reduced level of preparedness for these phenomena. This implies that once an extreme weather event eventuates, the severity of disruption and damages caused to transport systems are quite remarkable, such in the case of severe snowfall events during winters 2009 and 2010. The probability of heat waves is higher, especially over the mainland (5% for daily maximum temperature over 32 °C), while heavy rainfall and extreme wind gusts are more common over the British Isles (80 cases/year with > 17 m/s wind gust).
By the 2050s this climatic region is likely to become more impacted by warm extremes, with an increase of 5–10 days/year for the applied threshold indices, particularly over the land. According to regional climate model simulations ana-lysed heavy precipitation events are expected to increase only slightly. The spread between simulated projections is large, however. The intensity of cold tempera-tures, extreme snowfall and blizzard events are projected to decrease significantly for all the threshold indices. In terms of wind extremes, the patterns of changes are mixed, with a slight decrease for > 17 m/s gusts but an increase for > 25 m/s.
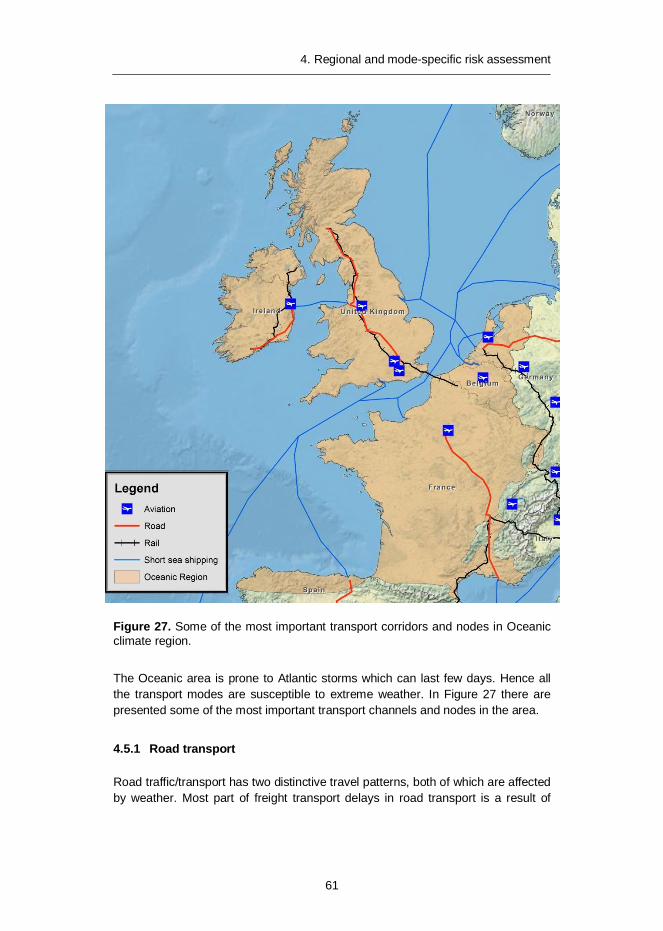
4. Regional and mode-specific risk assessment
61
Figure 27. Some of the most important transport corridors and nodes in Oceanic climate region.
The Oceanic area is prone to Atlantic storms which can last few days. Hence all the transport modes are susceptible to extreme weather. In Figure 27 there are presented some of the most important transport channels and nodes in the area.
4.5.1 Road transport
Road traffic/transport has two distinctive travel patterns, both of which are affected by weather. Most part of freight transport delays in road transport is a result of

4. Regional and mode-specific risk assessment
62
impacts on the long-haul transport, whereas for the passenger transport the im-pacts are created through volumes of passengers in urban transport.
The most likely series of events that harms road transport in the Oceanic region starts when the weather temperature drops under -0 °C or the wind gusts succeed the speed of 17 m/s. Cold makes the roads slippery which causes accidents, traf-fic jams, and undesirable effects on traffic interoperability and wind gusts cut trees on roads and block the roads temporarily. Heavy wind gusts can also close bridg-es for traffic. In addition reduced visibility by fog, snow or heavy precipitation re-duces the traffic flow due to lower speed and leads to accidents. The latter is es-pecially the case, if the weather phenomenon occurs abruptly. In addition, heavy precipitation, snow and ice generate slippery roads, which also reduce the traffic flow and raise the number of accidents. High temperatures foster the fatigue of drivers and therefore, can also increase the number of accidents. Furthermore, in very extreme high temperature situations the pavement can be damaged. In any case, accidents cause congestions and longer travel times. A damage of pavement or constructions (e.g. bridges) can lead to a long term problem, as the capacity of detours is often limited or the rerouting is much longer than the original way.
For the urban transport, all of the above mentioned weather phenomena result in quite similar impact of the single vehicle, but due to a complete different traffic pattern with more vehicles in a dense network, the overall impact is different. Es-pecially during rush hours adverse weather can result in a total breakdown of the whole road transport network. Luckily there are fewer fatalities due to bad weather as the speed is lower than on transit routes.
Preparedness of the Oceanic region transport system to tackle the challenges of extreme weather, particularly related to cold spells and snow fall is much lower than that in the Northern Europe region. The road transport system is vulnerable to shocks, which result in accidents and delays and cancellations in travel. In the UK, for instance, schools are closed during snowfall periods as public sector can-not maintain the road network. People choose not to commute on the days when the system is not responding to the maintenance needs and instead they opt to stay home. This generates productivity losses to the economy.
For the region the fatality costs of accidents related to extreme weather are 1.554 million euros annually, resulting from a large volume of traffic and population in the region. Countries are typically small in geographical size with high density and large volume of road network users. This leads to congestion in normal daily traffic, which is made worsened by adverse weather conditions.
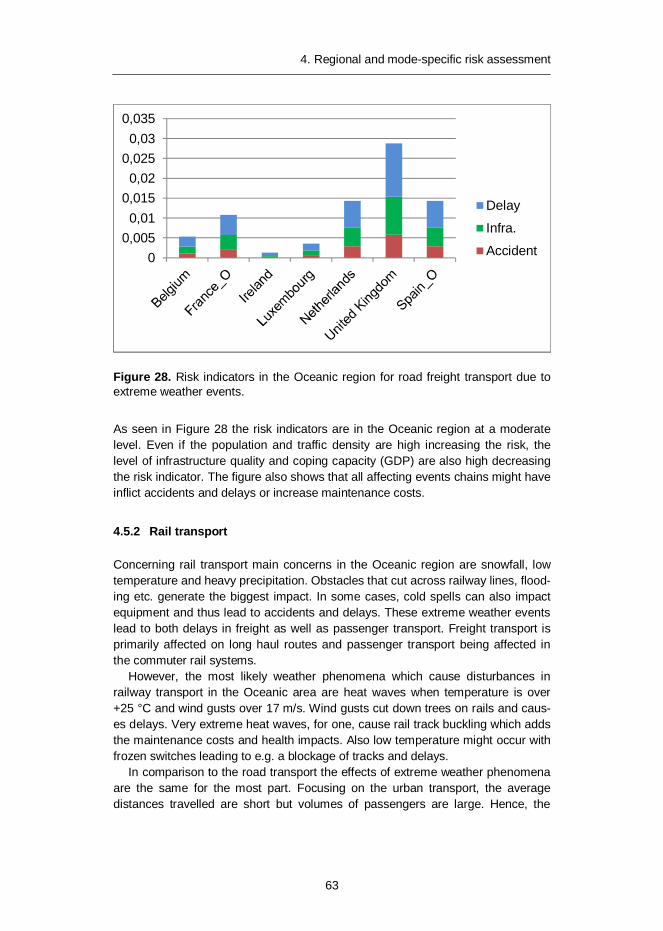
4. Regional and mode-specific risk assessment
63
Figure 28. Risk indicators in the Oceanic region for road freight transport due to extreme weather events.
As seen in Figure 28 the risk indicators are in the Oceanic region at a moderate level. Even if the population and traffic density are high increasing the risk, the level of infrastructure quality and coping capacity (GDP) are also high decreasing the risk indicator. The figure also shows that all affecting events chains might have inflict accidents and delays or increase maintenance costs.
4.5.2 Rail transport
Concerning rail transport main concerns in the Oceanic region are snowfall, low temperature and heavy precipitation. Obstacles that cut across railway lines, flood-ing etc. generate the biggest impact. In some cases, cold spells can also impact equipment and thus lead to accidents and delays. These extreme weather events lead to both delays in freight as well as passenger transport. Freight transport is primarily affected on long haul routes and passenger transport being affected in the commuter rail systems.
However, the most likely weather phenomena which cause disturbances in railway transport in the Oceanic area are heat waves when temperature is over +25 °C and wind gusts over 17 m/s. Wind gusts cut down trees on rails and caus-es delays. Very extreme heat waves, for one, cause rail track buckling which adds the maintenance costs and health impacts. Also low temperature might occur with frozen switches leading to e.g. a blockage of tracks and delays.
In comparison to the road transport the effects of extreme weather phenomena are the same for the most part. Focusing on the urban transport, the average distances travelled are short but volumes of passengers are large. Hence, the
00,0050,01
0,0150,02
0,0250,03
0,035
Delay
Infra.
Accident

4. Regional and mode-specific risk assessment
64
disruptions caused by extreme weather might cause a breakdown of the whole system with significant negative effects on passengers in terms of travel times and costs. In opposite to road transport, recovery times are higher as infrastructure is more sensitive to weather effects and re-routings/shortcuts are more complex than on roads.
Figure 29. Extreme weather risk indicators in the Oceanic region for passenger rail transport.
As seen in Figure 29 the risk indicators for rail transport are also at a moderate level in the Oceanic region. Even if the population and traffic density are high increasing the risk, the level of infrastructure quality and coping capacity (GDP) are also high decreasing the risk indicator. The figure also shows that all affecting events chains might have inflict accidents and delays or increase maintenance costs. The higher risk indicator in UK indicates the transport density is higher and quality index for rail infrastructure a little bit lower than on average in this region.
4.5.3 Short sea shipping
The Oceanic region includes the coastlines of Northern Spain, North-western France, Belgium, the Netherlands, Ireland and the UK. Outside European core, also Iceland, the Azores, the Faroe Islands and Canary Islands carry some char-acteristics of this region. Wind, waves, fog, snow and rain are the primary climatic conditions within this region. The northern part of the coastline of the region is particularly intricate, and this, combined with some (or, sometimes, full) effects of the weather systems coming across the northern Atlantic Ocean and the density of shipping operating between the Atlantic Ocean and northern EU ports, increases
00,0020,0040,0060,0080,01
0,0120,0140,0160,0180,02
Delay
Infra.
Accident

4. Regional and mode-specific risk assessment
65
the potential for accidents, since the area has some of the biggest and busiest ports not only in Europe but in the world.
Storms are the primary concern of this area and there is considerable in-ter-annual and inter-decadal difference in storm activity. There is observational evidence for an increase of intense cyclone activity in the North Atlantic since the 70’s. However, it is uncertain whether this constitutes of a continuing trend or just natural variability. The combination of strong winds with heavy precipitation affects all aspects of maritime activities: shipping, infrastructure and personnel. Storm hazard cannot be reduced and, therefore, future research should focus mainly on reducing the extent of damages caused by storms, by suitable territorial planning, building codes and better dissemination and use of weather reports. Erosion or accretion of beaches protecting port structures may affect the safety of structures or the probability of flooding.
Furthermore, changes in storm duration and/or frequency may lead to port problems in the area ranging from decreased regularity to increased downtime and the requirement for more storage capacity at container terminals for use in times of closure. These weather characteristics could affect some of the busiest maritime routes and ports in the world. Another sector storm has adverse effects is the capacity of natural systems to recover from storm erosion. This could poten-tially lead to permanent loss of sand offshore as well as degradation of structures, changes in depth, underwater landscape and added economic cost in the form of dredging. An increase of heavy precipitation and fog in the area can affect visibility leading to slower speeds, disruption in operations and reduce overall sunshine hours available for sun powered equipment. Higher thunderstorm activity is ex-pected in higher latitudes which would put higher demands on lightning systems and electronics. Higher winds or changes in the wind field could lead to difficulties in manoeuvring through curved narrow sailing channels with passenger vessels (which are much more affected by winds) suffering more downtime. Considering ports, reduced calm weather hours reduces time to unload high risk cargo such as oil and gas which would lead to increased berthing time for ships at terminals, and delayed departure time any or all of which may necessitate larger areas for an-choring of waiting vessels and greater fuel consumption (since, in storm condi-tions, a ship doesn’t remain anchored but must stay mobile).
Ice conditions in the North portion of the Oceanic region can have adverse ef-fects (same as the ones described in 4.1.3 for the Scandinavian region). The po-tential for ice accretion on vessels and offshore structures is directly related to the environmental conditions, i.e. wave height, wind speed and direction, air tempera-ture, sea surface temperature and the freezing temperature of sea water. Icing increases the weight and raises the centre of gravity of ships, lowering freeboard and reducing stability, a potentially catastrophic problem, particularly for smaller vessels such as fishing trawlers which operate frequently in the Oceanic region’s waters. Icing also affects personnel and equipment operations, emergency evacu-ation procedures and communications. Structures at the coast at high latitudes may have more sea spray during winter. Light from navigation installations could be reduced by additional sea spray icing.
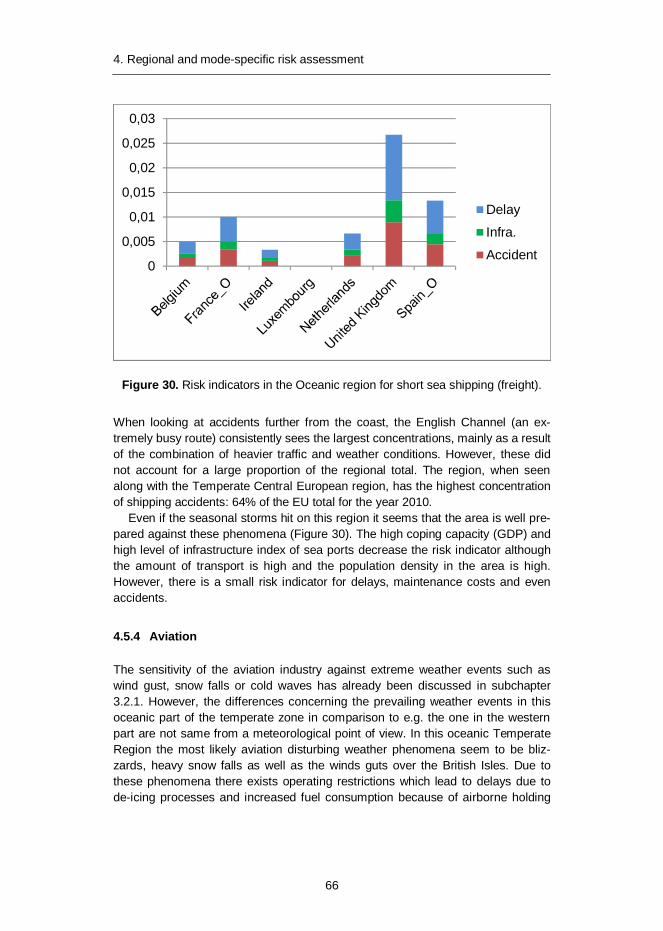
4. Regional and mode-specific risk assessment
66
Figure 30. Risk indicators in the Oceanic region for short sea shipping (freight).
When looking at accidents further from the coast, the English Channel (an ex-tremely busy route) consistently sees the largest concentrations, mainly as a result of the combination of heavier traffic and weather conditions. However, these did not account for a large proportion of the regional total. The region, when seen along with the Temperate Central European region, has the highest concentration of shipping accidents: 64% of the EU total for the year 2010.
Even if the seasonal storms hit on this region it seems that the area is well pre-pared against these phenomena (Figure 30). The high coping capacity (GDP) and high level of infrastructure index of sea ports decrease the risk indicator although the amount of transport is high and the population density in the area is high. However, there is a small risk indicator for delays, maintenance costs and even accidents.
4.5.4 Aviation
The sensitivity of the aviation industry against extreme weather events such as wind gust, snow falls or cold waves has already been discussed in subchapter 3.2.1. However, the differences concerning the prevailing weather events in this oceanic part of the temperate zone in comparison to e.g. the one in the western part are not same from a meteorological point of view. In this oceanic Temperate Region the most likely aviation disturbing weather phenomena seem to be bliz-zards, heavy snow falls as well as the winds guts over the British Isles. Due to these phenomena there exists operating restrictions which lead to delays due to de-icing processes and increased fuel consumption because of airborne holding
0
0,005
0,01
0,015
0,02
0,025
0,03
Delay
Infra.
Accident

4. Regional and mode-specific risk assessment
67
for arriving aircraft. Depending on the severity of these weather events even can-cellations may occur in case of long delays or disruptions in flight plan.
Concerning the volume of traffic this oceanic European includes some of Eu-rope´s leading hubs such as London Heathrow, Paris Charles de Gaulle or Am-sterdam. Therefore, total traffic volume can be estimated as higher compared to the other regions mentioned in this document (EUROCONTROL, 2008).
Nevertheless, the consequences resulting from bad weather events on the avi-ation system (delays, disruptions in flight plans leading to cancellations) as well as the expected future trends are the same as being discussed in former subchapter 4.2.3.
Figure 31. Risk indicators in the Oceanic region for aviation freight due to extreme weather events.
The Figure 31 shows that the highest risk indicators for aviation are in the United Kingdom and Luxembourg which both have high population density and transport volumes. In the UK the coping capacity (GDP) is lower than in Luxembourg which increases the risk indicator.
4.6 Mountainous regions
In our regionalisation, the Mountainous regions implies not only the Alps but also the Carpathians, the Pyrenees and in many aspects also the Scandinavian Moun-tains. These regions, due their topography, can have remarkably different extreme phenomena from their surroundings. The most characteristic extreme phenomena affecting the Mountainous region are cold spells (on average 50–60 days with -7 °C), heavy snowfall (40–45 days with > 10 cm and > 20 days with 20 cm of snow
0
0,005
0,01
0,015
0,02
0,025
0,03
Delay
Infra.
Accident
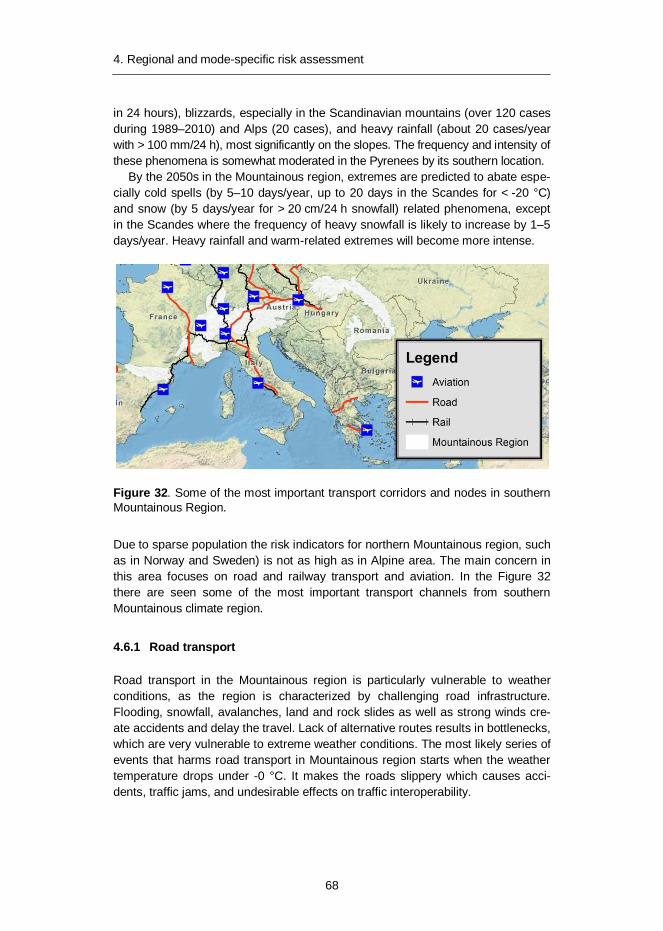
4. Regional and mode-specific risk assessment
68
in 24 hours), blizzards, especially in the Scandinavian mountains (over 120 cases during 1989–2010) and Alps (20 cases), and heavy rainfall (about 20 cases/year with > 100 mm/24 h), most significantly on the slopes. The frequency and intensity of these phenomena is somewhat moderated in the Pyrenees by its southern location.
By the 2050s in the Mountainous region, extremes are predicted to abate espe-cially cold spells (by 5–10 days/year, up to 20 days in the Scandes for < -20 °C) and snow (by 5 days/year for > 20 cm/24 h snowfall) related phenomena, except in the Scandes where the frequency of heavy snowfall is likely to increase by 1–5 days/year. Heavy rainfall and warm-related extremes will become more intense.
Figure 32. Some of the most important transport corridors and nodes in southern Mountainous Region.
Due to sparse population the risk indicators for northern Mountainous region, such as in Norway and Sweden) is not as high as in Alpine area. The main concern in this area focuses on road and railway transport and aviation. In the Figure 32 there are seen some of the most important transport channels from southern Mountainous climate region.
4.6.1 Road transport
Road transport in the Mountainous region is particularly vulnerable to weather conditions, as the region is characterized by challenging road infrastructure. Flooding, snowfall, avalanches, land and rock slides as well as strong winds cre-ate accidents and delay the travel. Lack of alternative routes results in bottlenecks, which are very vulnerable to extreme weather conditions. The most likely series of events that harms road transport in Mountainous region starts when the weather temperature drops under -0 °C. It makes the roads slippery which causes acci-dents, traffic jams, and undesirable effects on traffic interoperability.
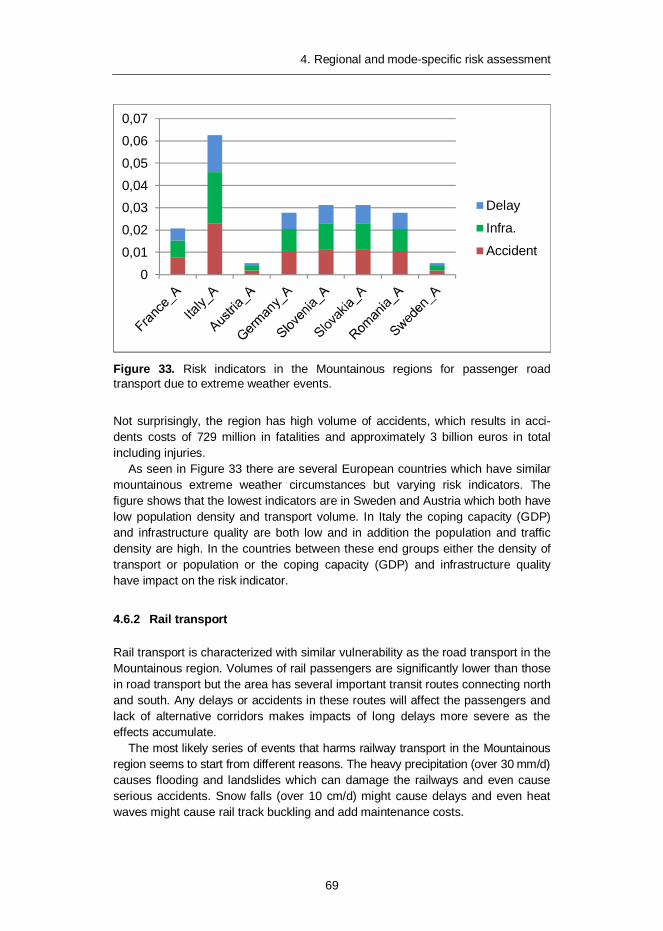
4. Regional and mode-specific risk assessment
69
Figure 33. Risk indicators in the Mountainous regions for passenger road transport due to extreme weather events.
Not surprisingly, the region has high volume of accidents, which results in acci-dents costs of 729 million in fatalities and approximately 3 billion euros in total including injuries.
As seen in Figure 33 there are several European countries which have similar mountainous extreme weather circumstances but varying risk indicators. The figure shows that the lowest indicators are in Sweden and Austria which both have low population density and transport volume. In Italy the coping capacity (GDP) and infrastructure quality are both low and in addition the population and traffic density are high. In the countries between these end groups either the density of transport or population or the coping capacity (GDP) and infrastructure quality have impact on the risk indicator.
4.6.2 Rail transport
Rail transport is characterized with similar vulnerability as the road transport in the Mountainous region. Volumes of rail passengers are significantly lower than those in road transport but the area has several important transit routes connecting north and south. Any delays or accidents in these routes will affect the passengers and lack of alternative corridors makes impacts of long delays more severe as the effects accumulate.
The most likely series of events that harms railway transport in the Mountainous region seems to start from different reasons. The heavy precipitation (over 30 mm/d) causes flooding and landslides which can damage the railways and even cause serious accidents. Snow falls (over 10 cm/d) might cause delays and even heat waves might cause rail track buckling and add maintenance costs.
0
0,01
0,02
0,030,04
0,05
0,06
0,07
Delay
Infra.
Accident

4. Regional and mode-specific risk assessment
70
Figure 34. Risk indicators in the Mountainous region for passenger rail transport due to extreme weather events.
The Figure 34 shows that the lowest indicators are in Sweden and Austria which both have low population density and transport volumes. In Italy and Romania the coping capacity (GDP) and infrastructure quality for railways are both low and in addition the population and traffic volume are high. In the countries between these end groups either the density of transport or population or the coping capacity (GDP) and infrastructure quality have impact on the risk Indicator.
4.6.3 Aviation
The sensitivity of the aviation industry against extreme weather events such as wind gust, snow falls or cold waves has already been discussed in subchapter 4.2.3. The differences concerning the prevailing weather events in this Mountain-ous region in to the one in the temperate region are remarkable for cold spells, heavy snow falls and blizzards. The most likely series of events that harms aviation in Mountainous region seems to start from snowfall (over 1 cm/d) or wind gusts (over 17 m/s). Both of them cause delays and snowfalls add maintenance costs.
The above mentioned extreme weather events will have significant influence on the performance at airports such as Zurich or Munich. In consequence delays as well as cancellations might increase, i.e. the time costs for this region are high.
0
0,005
0,01
0,015
0,02
0,025
0,03
Delay
Infra.
Accident
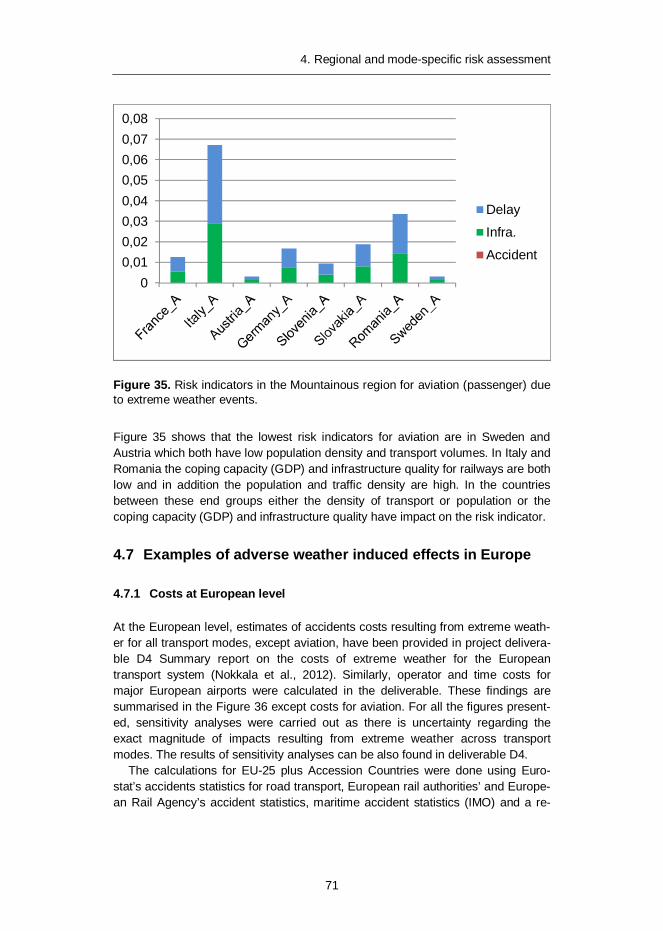
4. Regional and mode-specific risk assessment
71
Figure 35. Risk indicators in the Mountainous region for aviation (passenger) due to extreme weather events.
Figure 35 shows that the lowest risk indicators for aviation are in Sweden and Austria which both have low population density and transport volumes. In Italy and Romania the coping capacity (GDP) and infrastructure quality for railways are both low and in addition the population and traffic density are high. In the countries between these end groups either the density of transport or population or the coping capacity (GDP) and infrastructure quality have impact on the risk indicator.
4.7 Examples of adverse weather induced effects in Europe
4.7.1 Costs at European level
At the European level, estimates of accidents costs resulting from extreme weath-er for all transport modes, except aviation, have been provided in project delivera-ble D4 Summary report on the costs of extreme weather for the European transport system (Nokkala et al., 2012). Similarly, operator and time costs for major European airports were calculated in the deliverable. These findings are summarised in the Figure 36 except costs for aviation. For all the figures present-ed, sensitivity analyses were carried out as there is uncertainty regarding the exact magnitude of impacts resulting from extreme weather across transport modes. The results of sensitivity analyses can be also found in deliverable D4.
The calculations for EU-25 plus Accession Countries were done using Euro-stat’s accidents statistics for road transport, European rail authorities’ and Europe-an Rail Agency’s accident statistics, maritime accident statistics (IMO) and a re-
00,010,020,030,040,050,060,070,08
Delay
Infra.
Accident

4. Regional and mode-specific risk assessment
72
view of inland waterways accident statistics from past 10 years. Data sources and figures are documented in more detail in D3 Consequences of extreme weather (Mühlhausen et al., 2011). The figures at European level were obtained using an estimate of 10 per cent of road and inland waterways accidents resulting from extreme weather and 5 per cent of rail and maritime accidents resulting from ex-treme weather. Based on the accidents data, values used and the probabilities associated, the total cost of extreme weather related accident at European level at present is estimated to be even as high as 20 billion euros.
For aviation, the two significant cost items were operator costs resulting from cancellations of flights and time costs for passengers. Operator costs were calcu-lated for selected airports, covering 88% of daily volumes in Europe based on reported number of bad weather days on which an average rate of cancellations was calculated. For passenger time costs, the Eurocontrol official values of time were used to calculate the average delay for each passenger during the number of bad weather days reported for 2010 at the major European airports. The average delay represents the fact that accumulated delays in major airports results in a continuous problem of delays during the day and sensitivity analyses were carried out with respect to the estimated duration of the delay for each passenger.
The annual operator costs for aviation in 2010 were 606 million euros. This is calculated on the bases of 10% cancellation rate for medium jets. The annual time costs for aviation in 2010 were 980 million euros. This calculation is based on 30 minute average delay/flight on selected airports.

4. Regional and mode-specific risk assessment
73
Figure 36. The estimates of accidents costs (euros) resulting from extreme weather for all transport modes except aviation at the European level.
Annual infrastructure maintenance and asset costs were not available for those extreme weather events determined in EWENT project. Even then, to get a gen-eral picture about the cost level, we assembled data from three extreme weather events or their consequence we found, such as storms, wintry conditions and floods. The results show that no costs were calculated for maritime transport or aviation, and the main costs fell on road and railway transport (Table 7).

4. Regional and mode-specific risk assessment
74
Table 7. Annual costs (mill. €) for infrastructure assets and operations due to storms, wintry conditions and floods.
Extreme weather event Infrastructure assets Infrastructure operations
Storm Road 76.10 22.60
Rail 0,07
Maritime - -
Air - -
Winter Road 248.80 126.30
Rail 0.04
Flood Road 630.10 21,90
Rail 103.66
4.7.2 Costs at climate region level
Availability of climate region level data is less than the data at European level. What we can present here (Figure 37) are road transport accident statistics (fatali-ties) for each climate region as well as operator and time costs for the aviation by climate regions. The regional estimates of fatalities were obtained by classifying each country to a climate region (except for Italy which features in two climate regions, Mediterranean and Mountainous) and calculating each country’s fatality costs using either official values for the country or, when these were not available, the adjusted European average figures used for overall impact calculations.

4. Regional and mode-specific risk assessment
75
Figure 37. Costs (mill. €) for road accidents’ fatalities (red; socio-economic costs) and aviation cancellations (black; operators’ costs) and aviation delays (blue; passenger time costs) by climate regions.
The figures on airport data should be interpreted as follows: The data shows the annual impact of cancellations for those airports reviewed by Eurocontrol. The calculation of costs is based on the impact of extreme weather days on selected airports, covering 88% of daily passenger flows in Europe. The figures show the case where the average cancellation rate has been 10 per cent of daily flights. The reason why the Northern European climate region dominates the calculation is naturally the volume of extreme weather days compared to other regions. Due to the regional classification between the Temperate Eastern and the Temperate Central regions no airports reviewed feature in the Temperate Eastern region.
4.7.3 Case studies of weather-induced disruptions in European freight transport, logistics service provision and infrastructure functionality
EWENT Working Memo D.4.4 Linkages between extreme weather and reactive behaviour of European freight transport, logistics service supply and infrastructure provision industries (Ludvigsen et al., 2012) presented results from several case

4. Regional and mode-specific risk assessment
76
studies of how harsh weather disrupted operations of European freight transport, logistics service and infrastructure providers causing damage and losses along the entire supply chains. Figure 38 summarizes the main outcomes from these stud-ies. All cases have shown clearly that continuity and safety of the entire road and rail freight transport and logistics supply in the UK, Norway, Finland, Sweden, Poland, Holland and Switzerland were critically contingent on infrastructure func-tionality. This became especially manifest during the unusually severe winters of 2009 and 2010, which were followed by extensive floods, and disclosed high level of vulnerability of the affected companies due to the lack of physical preparedness and disaster management skills. However, railways emerged as the most severely damaged transport mode because they not only lost the current customers, but also the long-term competitiveness towards truck operators.
Figure 38. The case studies of weather induce disturbances in freight transport in Europe.
5. Risk management options in Europe
77
5. Risk management options in Europe
5.1 Present risk management measures for extreme weather
A specific objective of EWENT WP5 was to gather information on available risk management measures and lines for actions for Europe to protect the perfor-mance of its transport system. For this purpose, stakeholder interviews were con-ducted to gain expert view on the issue. Responses were received from policy-makers, infrastructure managers and operators, transport operators and supply chain actors interviews with non- or semi-structural analyses. Interviews focused on available risk management measures, their usability, strengths and weakness-es and needed improvements.
The most harmful weather phenomena to transport system in Europe that were selected in EWENT WP1 were used as examples of extreme weather cases that require risk management measures, i.e. strong winds, heavy snowfall, heavy rain-fall and long lasting high and low temperatures. Risk management for low visibility was also relevant for some transport modes.
Altogether 81 interviews were initiated either face-to-face, via telephone or by e-mail. In the end 29 responses were collected from twelve countries: Austria, Cyprus, Denmark, Finland, Germany, Greece, Iceland, Lithuania, Romania, Slo-venia, Sweden and Switzerland (Table 8).

5. Risk management options in Europe
78
Table 8. Stakeholder interviews per country and per transport mode.
Road transport Railways Light
traffic Inland
waterways Short-sea shipping Aviation
Austria 1 1 4 1 1
Cyprus 2 1
Denmark 2
Finland 1 1 1 2 1
Germany 1 1
Greece 1
Iceland 1
Lithuania 1
Romania 1
Slovenia 1 1
Sweden 1
Switzerland 1
total 5 2 8 6 4 4
In the following a summary of the responses is presented per each extreme weather event. Detailed results are reported in EWENT Task 5.2 Working Memo “The summary report of the stakeholder interviews on preparedness for extreme weather”.
5.2 Risk management measures against heavy rain
For road transport very heavy rainfall may lead to situations when roads have to be closed for safety reasons. In case of long lasting heavy rainfall, flooding may occur and cause damage to road structures. For instance in Germany, roads need to be closed in case of extreme precipitation, leading into significant delays. No preparation means are available for this situation.
Asfinag in Austria is member of standardization committees which take regional meteorological long term studies into consideration saying that there will be no in-crease in heavy precipitation in Austria. As a result, the technical design of the road transport infrastructure is based on drainage systems that are not oversized. In case of heavy precipitation exceeding the technical capacity, roads have to be closed.
In Finland heavy rain over 100 mm per day may cause local disorders, as the intensity of rain can be locally very hard. 150 mm per day can cause erosion dam-
5. Risk management options in Europe
79
age, and also flooding, if the drums do not carry the water away and the waters nearby flow to the road area. Gravel roads are particularly sensitive to the in-crease of winter precipitation: the surface structure affected by water saturation weakens the road bed structure and decreases the winter carrying capacity. This is especially harmful for agriculture and forestry. Common gravel road network in Finland is still about 27 000 km (in addition to 200 000 km of private roads), and part of the lightweight coated roads will be changed back to gravel roads.
The overall increase in rainfall has not yet been taken into account on the na-tional level in Finland, and there seem not to be national guidelines to increase the appropriate size of the culverts. Some of the local environmental centers have already been demanding larger culverts. Road underpasses pumping capacity can be exceeded, but even greater problem is the potential of power failures.
For rail transport heavy rainfall is not such a big risk. In principle, a well-built track can put up with any amount of water, if the superstructure of the substrate layer (crushed stone) is in good condition and drainage works. The old sections of the superstructure may have too much very small grain-size material, which pre-vents the penetration of water, and water stays inside the structure. At worst, the whole rail bed can collapse. At the moment there is an action plan in progress in Austria to cope with risks of heavy precipitation to rail transport. Despite of ava-lanches and floods in certain areas, heavy precipitation and hail is not an extreme weather scenario that calls for immediate prioritization.
For light traffic (cyclists, motorcyclists) heavy rainfall and thunderstorms pose a great risk. Heavy rain and thunderstorms in open places, in the plains or on mountain ridges could be a burden for cycling. Cyclists have to manage the risk by preparing to the journey with weather forecasts, but in most countries there are no specific weather forecasts for light traffic. Public forecasts are not too detailed and accurate, and thus cycle tourists mainly use free forecasts from different websites. In cases of flooding, the abundance of secure bicycle parking racks comes in extremely handy so that bicycles are not washed away.
For inland waterway transport heavy rainfall has significance for inland wa-terway transport as navigation may be suspended for several days due to high water. Consequences may be delays, vessel damage due to driftwood as well as interruption of cargo handling. However, of greater significance is the occurrence of drought and low water as here the cargo carrying capacity can be severely limited or inland waterway transport cannot be realized anymore. Consequences of flooding are in general more severe to the waterway infrastructure and protect-ed areas as to waterway transport itself. With respect to floods catastrophe plans are available, e.g. for the Saimaa Canal region in Finland and the Port of Enns in Austria. High water surface elevation is usually causing no problems and can be managed by water control in the canals. On the contrary, very low water level after prolonged drought is causing serious problems for inland waterway transport.
Thresholds for aviation concerning heavy precipitation are well defined and are as follows:

5. Risk management options in Europe
80
– 30 mm / 1 h > Route blocked, runway closed, loss of situational awareness
– 60 mm/6 h > airport limited infrastructure
– 90 mm/12 h > Airport limited infrastructure, total airport closed
– 150 mm/24 h > airport limited infrastructure, total airport closed (Leviäkangas et al., 2010).
Special measures are taken in case of airside flooding (closing the airport). Heavy rainfall may be associated with thunder as well. Airport ground operations have to be terminated when a lightning stroke has been observed within a radius of 5 km around the airport (Leviäkangas et al., 2010).
5.3 Risk management measures against extreme snowfall
For road transport heavy snowfall is the most challenging case of extreme weather in the Northern and Mountainous regions. If snowfall is heavy, most im-portant is to provide enough staff and machinery in addition to the “standard” sce-nario to shorten the time interval of snow clearance. In case of blizzards there are no built structures which could be affected and thus the risks are connected to accumulated snow. In cities, public transport organizations apply snow removal on streets and bus stops. Heated overhead contact wires and heated shunting switches are also used.
In the Nordic countries road users are well prepared for winter conditions, e.g. winter tires are compulsory and studded tires are used in majority of the passen-ger cars. These countries have well organised winter maintenance management infrastructure – scheduled service with guidelines for maximum allowed snow accumulation. Blizzard situations are managed with updated information about road condition on the Internet, tele text, automatic telephone, road condition infor-mation desk, and variable message signs.
For rail transport in Austria, a manual “Winter and snow clearing” has been is-sued, describing an action plan. The earlier the rail company gets relevant weath-er information (at least 2 days) the better. Snowfall in itself does not pose a prob-lem for the rail network. If the weather in autumn is such that tree leaves are car-ried on the tracks, this can slow down the traffic, because the train does not stop or will not accelerate with normal pace. Snowfall of 15–20 cm does not yet cause a problem, because the snow will be below the running surface of the tracks, and the speed of the train will clean the tracks. Wet and heavy snow is problematic because it may block the shifts.
In Finland’s capital Helsinki special measures have to be taken, because the wet offshore wind and snow blow in the track direction and the snow is packed in gears. Although the shifts are heated, in all conditions this is not sufficient way to melt the snow, and manual work (men with brushes) is needed. Since the whole train network ends up in Helsinki, the disturbances there reflect to the rail traffic throughout the country. Plowing equipment is also needed throughout the country.

5. Risk management options in Europe
81
After some mild winters the snow plowing equipment has been in short supply – railways need more slings, plows and brushes.
Freezing rain can sometimes accumulate ice and cold moist weather frost to contact wires. Dry and cold seasons with fresh powder snow present a problem for the rolling stock. Powder snow accumulates and freezes on the bogies and when the fall of they might damage the lower structures of the rolling stock. Powder snow also affects breaks, makes coupling and decoupling more difficult, jams car doors, etc. The ultimate major impact is increased rolling stock maintenance costs which often have to be performed in an unpleasant environment outdoors.
Cycling in winter has proved particularly interesting during the past 2–3 winters with blizzards sweeping across Northern Europe (and in winter 2011–2012 even in most parts of Central Europe). Copenhagen has increased their funding for snow removal on cycle tracks by 270 000 Euros from beginning of January 2012. Re-garding other cycle track maintenance issues, Copenhagen City increased funding by 1.3 million euros per year, starting last year. This keeps the cycle tracks as safe as possible, particularly in inclement weather. Cycle tracks and sidewalks are also salted before a snow storm. The tracks and sidewalks are cleared in the mornings with snow plows, often well before the car lanes, as motorists are a minority in Copenhagen traffic, see http://www.copenhagenize.com/2010/12/ultimate-bike-lane-snow-clearance.html.
For inland waterway transport reduced visibility due to snow falls and bliz-zards are not a major obstacle on the Danube as most vessels are equipped with radar and navigation may be carried on even under such circumstances. In the Port of Enns, an action plan ensures 24 hours of port operation. This includes the provision of adequate machines for snow clearance, salt silos, shift work during the night and safety measures.
Shipping is helped in difficult conditions with varied safety equipment. Safety devices may be harder to see in the snowfall, or the lights are covered in snow, but with safety devices that appear on the radar it is possible to operate in rainfall, snowfall and fog. Snow fall as such does not affect significantly the passage of the ships. However, loading and discharging might be affected depending on the type of the ship and her cargo. Since blizzards are associated with strong winds, course and speed might be affected, delaying the passage between two ports.
For air traffic, snowfall can result in the three different indicators: low visibility, slippery runways and icing. Within low visibility, special procedures are performed, which set a higher separation. Slippery runways result in longer runway occupan-cy times, i.e. also higher separations. And finally the de-icing process increases the turnaround time. So all three indicators reduce the capacity and lead to higher delay in air traffic. How much delay, depends very much on the situation and the airport. In extreme cases snowfall can result in a total disruption of the airport system and a stop of all operations.
The most challenging weather-related situations in Athens were the snowstorms that affected the airport on January 5 to 7 of 2002, on February 14 to 16 of 2004, on January 24 to 26, 2006 and on February 16 & 17 of 2008. Since the first snowstorm that arose 9 years ago lot of things have drastically changed and a lot of measures

5. Risk management options in Europe
82
were taken in order to prevent the repetition of serious customer service problems due to lack of equipment and resources, due to lack of experience and clear/coordinated communications, along with the lack of a designated mechanism for overseeing and assessing the airport system's response to the snowstorm. Air-port company in cooperation with the Airlines Committee and the ground handling companies took several remedial actions, which included the following:
– Preparation of a detailed Winter Operation Procedure (that provides guide-lines and describes the actions that have to be followed in case of snow removal and ice control operations)
– The development of a Snow Control Center that operates as the snow con-trol coordinating element for all the airport snow clearing operations, aiming to improve emergency management capabilities and resources’ effective management, in cases that weather conditions may become complicated to deal with and potentially disable part or the whole airport activities, and
– Acquisition of new special airport snow clearing and de-icing equipment.
Airport of Athens has now a Snow and Ice Control Plan that describes the provi-sions made by the concerned entities in order to achieve the safe operation of the Airport under such adverse weather conditions. Trained airport staff and Airport’s contractors for snow removal, undertake the task of snow/ice removal. Hellenic Civil Aviation Authority, through ATC Tower, is responsible for the coordinated and safe management of air traffic, including the traffic on the maneuvering area, by ensuring the timely and accurate transmission of the information relevant to the Snow and Ice Control Plan.
Hellenic National Meteorological Services is responsible to provide information, through the issuance of relevant WARNINGS, in case that the airport is affected or expected to be affected by meteorological phenomena. Airlines are implementing their own operational procedures, anticipate the provision of the necessary re-sources and means for ground handling and to minimize the impact of the meteor-ological phenomenon and handle any irregularities at their flights’ schedule, due to restrictions that may imposed to air operations. Finally the Tenants/Occupants of airport’s facilities provide for the snow and ice control in their areas.
Whatever the severity of the phenomenon is, the aim is always to clear the runways, the taxiways, and other critical surfaces, such as specific routes to air-craft stands, to such extent so as to ensure the safe movement of aircraft, equip-ment and personnel. In case that this is not possible, if for example 20 cm/d or more snowfall conditions prevail, and there is a requirement for immediate use of the runway and taxiways for landing, take off or ground movement of aircraft, then the runway and the taxiways required for the safe landing, take off and ground movement of aircraft should be cleared in the absolute necessary width, as ap-proved by HCAA. Having achieved this, surfaces are kept free of ice by using anti-icing agents.

5. Risk management options in Europe
83
5.4 Risk management measures against strong winds
For road transport strong winds can cause harm to infrastructure as well as to transport users. Risk management for road transport has well defined international and national standards, and thus there is no need to set any other technical measures for constructions exposed to strong wind. To manage daily transport risks, roads are controlled regularly to remove wind-thrown trees. In urban areas and in tunnels video cameras and traffic control systems are used to help in quick assessment of the situation. In Austria there is also a new project to test specific walls to protect a valley from wind gusts.
In Iceland strong winds pose a common risk for road transport. The following are an example of Trucking companies working rules for wind and wind gusts – Valid for winter season from 1st November – 31st March.
– “Alert 1” Storm warning, average wind speed 19 m/s or 23 m/s in wind gusts: Reason for drivers to pay good notice to weather condition and weather forecast. Before driving on the more demanding road sections show for thought and vigilance.
– “Alert 2” Storm warning, average wind speed 23 m/s or 30 m/s in wind gusts: The driver is to search for special information, e.g. from other drivers on the route, from the loading office or from others which can provide fur-ther information on the condition. Special vigilance is expected from the driver. Special rule for light trucks (empty trailers etc.): Storm warning, av-erage wind speed 19 m/s or 26 m/s in wind gusts.
– “Alert 3” Storm warning, average wind speed 30 m/s or 35 m/s or over in wind gusts: Drivers are not expected to take the relevant route or route section be-fore the situation is as “Alert 2”. Special rule for light trucks (empty trailers etc.): Storm warning, average wind speed 26 m/s or 30 m/s in wind gusts.
– “Other” Special vigilance is expected for light trucks or trailers. It’s for the driver to decide whether trailer is left in neighbouring town or to wait for bet-ter condition. This is applicable if wind is under the limits set in “Alert 3”.
In Finland, 17 m/s wind alone is not yet an issue for road infrastructure and transport. But instead, already 8 m/s wind with drifting snow creates a situation in which the contractors need to be prepared, as for example plowing operations may be delayed. 25 m/s wind may already carry fallen trees on the road, but the problems are usually quickly managed, as the main road network generally is open in the vicinity of roads. 20 m/s wind with slippery and sloping road surface can cause large vehicles (buses) running off the road when entering from forest to open fields.
Falling trees cause trouble for the rail network as well. In Finland, several strong thunder storms in the summer of 2010 caused problems when wind-felled trees blocked the rails. Trees can be removed from the area close to rails owned by the railways, but the other landowners’ trees close to tracks can cause electrici-ty supply interruptions. Problem areas are being investigated, and new scanning

5. Risk management options in Europe
84
methods will be developed (e.g. laser scanning), but all of the problematic places are not known yet.
In Austria, ÖBB implemented an action plan to cope with strong winds compris-ing speed limits (as problems occur at 100–130 km/h), additional safety measures for railway cars not in use, and surveillance trips.
For light traffic users, most risky is probably strong wind with heavy rain to-gether. In Denmark cycling is very popular and it is no wonder that the weather news in the media (newspapers, radio) always tell the weather forecast for cyclists including wind direction and eventual rain.
The strong wind implies a hazard associated with the possible collisions with cars in situations where strong side wind can shake the cyclist to collide with the car. Risky places are especially high bridges over large bodies of water. On the other hand the wind can also drop tree branches or roofing and the like, which cause no danger to vehicles with protective bodywork but are very risky for cyclists.
At present there are no weather services in Finland especially for cyclists. Oth-er weather Information and forecasts are available in many different ways. Transport Agency weather cameras are also available, but in practice they serve only very few, because the winter cycling on the roads is low. In urban areas, the cameras are usually positioned in places where they do not serve cycle transport.
In Southern and South-Eastern Romania strong winds are sometimes a prob-lem for cycling, but not a big risk since they do not occur very often, do not last for days or weeks as in other parts of the world, and do not have an intensity that puts down a cyclist from his bike (but can of course make biking slow and tiring if blow-ing from the front).
For inland waterways, wind constitutes not a significant obstacle as most in-land vessels are sufficient wide and stable in order to cope with strong winds. Nevertheless, locally wind speeds may accept values hindering navigation and reduced manoeuvreability of a vessel leading to delays and increased time for manoeuvring operations as well as possible collisions with waterway infrastructure e.g. when entering locks, demanding increased maintenance. Therefore, educa-tion and training is essential for lock management operators to provide a safely operated lock management as well as for captains and seamen e.g. training for stability of container and liquid gas transport.
The Port of Enns in Austria relies on weather forecasts as well as forecasts from the airport Hörsching nearby. In case of winds, the port of Enns applies rele-vant operating procedures. Particular emphasis is given in the usage of container cranes at certain wind speeds. Containers inside the container terminal are put in a specific order and tied up. The port of Enns, reported an increasing number of damages caused by storms.
Finnish Meteorological Institute issues regional weather forecasts on the Inter-net. For example, if stormy weather is expected, the pilot checks the situation before going on board. If the situation is turning really bad, the ship stops if neces-sary. Such a situation in Lake Saimaa is very rare. If wind is at 5–6 m/s, then the timber remains floating in protection positions to wait for the wind to weaken. An-nually some 1 000 000 m3 of timber is floated through Lake Saimaa. In Saimaa

5. Risk management options in Europe
85
Canal input in Russian waters, especially southern storms stop traffic, because the narrow strait Vysotsk will create too strong flow. Port captain of Vyborg decides the closure of the Strait for ships coming to the port of Vyborg and the Saimaa Canal.
In marine transport, ships are obliged to carry equipment used for receiving weather information. Although designed to withstand wind gusts of these catego-ries, since the sea state is affected as well, course/speed alternation and prepar-ing the ship for the bad weather might be necessary.
In principle, marine safety equipment and aids to navigation will endure even vio-lent winds. In risky situations the traffic to the port is restricted following the safety limits. The ice and wind conditions, however, can remove the floating safety equip-ment. Buoys and capes may be removed and go to drift. This is prevented with the so-called proactive care, which keeps the safety devices in good enough condition all the time. In addition, comprehensive set of safety devices helps to navigate in these situa-tions. Strong thunderstorms can also break down shipping safety equipment.
Marine failure reporting system further improves safety. In general, seafarers report quickly on faulty equipment and they will be repaired as soon as possible. Similarly, information on defects will reach mariners quickly.
There are provisions in the national maritime legislation of Cyprus, where the sail of small coastal passenger vessels is prohibited under certain weather condi-tions. Also the departure/arrival of any ship may be prohibited in extreme weather condition, if deemed necessary.
In aviation the critical wind values, which lead to a suspension of a runway, vary from airport to airport. In ICAO Annex 3, subhapter 3.1.1 the desired origin of the runway is described. In 95% of the time an operation with less than 20 knots of cross-wind is foreseen. Furthermore, each aircraft type has a different tolerance to wind operations. However, for each airfield a rule is in place, which regulates the use of runways depending on exact wind measurements.
In case of strong winds, the airport company and the airport stakeholders apply relevant operating procedures. Particular emphasis is given in the prevention of Foreign Object Damage (FOD) that could be swept away by the winds, as well as in the tethering of the equipment (e.g. containers, trolleys etc.) and light planes (less than 5700 kilos of Maximum Take-Off Weight (MTOW)) that could be drifted and damage equipment or harm personnel.
Concern also is given for the interruption of normal operation of the access con-trol mechanisms (bars, automatic electrically driven doors) at the security gates and their temporary placement in open position to preclude accidents. Especially when wind speeds exceed 40 kts (46 mph), more measures are taken (e.g. air bridge cabs are fully lowered with the shutters closed and where possible posi-tioned to face out of wind, to avoid structural damage).
In the event that very extreme phenomena (e.g. whirlwind, tornado etc.), the Airport management examines even the possibility of outdoor activities suspension, requesting the affected area’s evacuation. Similarly, all airport users and handling agencies are responsible to proceed with the implementation of the necessary precautionary measures, including the potential suspension of their services.
5. Risk management options in Europe
86
5.5 Risk management measures against heat waves
Heat waves may cause damage to road infrastructure. For extremely hot spells In Austria, road maintenance staff is instructed to watch out for blow ups which occur by increased elongation values of Bitumen, etc. According to received in-formation, increased heat waves are not expected in near future, and thus any specific measures are not taken.
In Finland, the heat is not in itself harmful for the road network. Of the road sur-face, there is just a little bit of binder – majority is rock. The road construction work in temperatures + 32 degrees or higher slows down the cooling of the road surface structure.
Gravel roads can be problematic in warm periods due to occurrence of dust, and the roads cannot be repaired during the dry season. The surface may also get cracks. Groundwater decrease in practice only reduces the spring thaw which is positive. But the old road bed structures may have used wooden poles which may start to rot.
Railway carriages and buildings have been equipped with air conditioning. Heat waves lead to distortion of the tracks. That is why tracks are painted with white color in southern European countries. This measure is not needed further north as in Austria.
The hot season is not in itself a problem in Finland if the superstructure and its supporting layers are very well done (welded to the concrete sleepers and rails), and the structure cannot deform. Each country defines a so-called Neutral Tem-perature, in which rails are installed. In the Nordic countries the Neutral tempera-ture is lower than in the south. When the rail is installed at this temperature, it takes relatively well deviations in both directions. The so-called heat curve effect (profile is compressed and goes into a curve) is not common in Finland and occurs just occasionally.
For light traffic very hot spells together with heavy rain in summer are risky when there are many people using bicycles for tourism and commuting. In Lithua-nia there are small shelters made by forestry companies in some resting places near roads. These shelters may be used to protect against heavy rain or hot sun-shine.
For inland waterway transport heat waves, when combined with drought, lead to low water events, and the full cargo carrying capacity of a vessel cannot be used anymore. Emergency concepts shall allow transport by other means of transport.
Hot periods have no relevance for shipping (it should be made clear that shipping means maritime or seaborne transport of navigation). Generally speaking the ships can operate normally with high temperatures. If other parame-ters, such as humidity and sea water temperatures are also high, the performance of some main and auxiliary equipment might be affected.

5. Risk management options in Europe
87
For aviation in moderate climate areas there are no problems arising from in-creasing temperatures. On the contrary, increasing temperatures enhance the movements per hour performed at airports.
In Cyprus, there are measures to cope with heat waves, especially for employ-ees working on airside (more frequent breaks, provision of fluids, monitoring, etc.).
In case of Extreme Temperatures in Athens, the Terminal Services Depart-ment, Technical Services and the Handling Agents apply relevant procedures (e.g. monitoring of emergency consumption and activation of generators, courtesy services initiation for affected of travellers/visitors, facilitation of the Public Health Authorities to detect and handle the cases of affected passengers etc.).
5.6 Risk management measures against cold waves
The extent of winter road maintenance operations depend of the climate zone. In the Northern and the Mountainous areas, to cope with cold spells, the road con-struction work and used material are of very high quality to avoid frost heaves in the pavement. In case of ice on the driving surface, salting is applied. During the long cold spells lower network of gravel roads just gets better. Asphalted roads cannot be salted (salt is not effective below -6 degrees) and the road surface can become very slippery due to polishing effect of the traffic. These are local prob-lems, though.
In very cold spells frost goes deeper into the ground causing thawing even in the best roads in spring time. Continuing thawing cycles deteriorate the road bed structure. Extremely low temperatures mainly harm wintertime construction works.
In rail transport, cold waves may damage infrastructure. Bad rail bed structure absorbs the track moisture which expands upon freezing. In the spring the ice melts, the water cannot drain out, and the track embankment thaws. The local problems can be fixed using the maintenance budget, but larger prepares of the rail network are investment projects. In very low temperatures the frosty rails will shrink and may even break, but this is not causing a risk for transport.
As the cyclists and motorists are exposed to weather conditions more than private car drivers and public transport users, cyclists also prepare better for weather conditions. Thus, they are often better prepared for e.g. slipperiness and cold. However unforeseen events, such as if the temperature drops quickly re-markably low, together with bad cold preparedness can cause a risk of frostbite. Snowfalls with cold spells in winter are also risky, but then on the other hand there are only few people using bicycles and very few tourists.
Cold temperatures are problematic for inland waterways transport in North-ern Europe. In general the Saimaa Canal is closed at the end of January. Canal maintenance is scheduled to take place during the winter break. Saimaa Lake and the Canal winter traffic apply specific ice class reductions (such as are on the coast of Finland). In winter and spring time ice-breakers (large tugs) are used for assistance in Lake Saimaa and the Canal. If the winter season would change so that the canal and the lakes would be open throughout the year for traffic, it would

5. Risk management options in Europe
88
change the activity so that the maintenance break is likely to be placed in the fall, about three weeks, when the maintenance work would be made around the clock.
In shipping, there is a specific category of ships which can operate normally in below -20 °C temperatures (usually associated with ice navigation). For tempera-tures below 0 °C special actions might be required for preparing the ship. The management personnel of companies with ships engaged in voyages under these conditions are usually preparing internal procedures taking into account the specif-ic ship type, cargo and the operational parameters.
During cold periods, certain types of ice conditions and strong wind and the in-teraction of these can remove or break the maritime safety equipment. For this reason, in Finland the winter can cause about 0.5 million € additional costs. During long cold spells problems arise due to security equipment power consumption growth, in which case the batteries can wear out more quickly. This is prevented with the development of battery technology, and reducing the power consumption of signaling devices. In Northern conditions, pack ice makes marine transport difficult.
As regards Port of Rotterdam, only a waterway connection to The Hague can be with some ice, but this gives no significant problems because of the possibility to break the ice.
Safety is of greatest importance in the aviation market also during cold spells. Aeroplane de-icing/anti-icing facilities should be provided at an aerodrome where icing conditions are expected to occur (see ICAO Annex 3, 3.15). De-Icing is re-quired starting at temperatures of 3 °C. In extreme cases, this threshold can be up to 15 °C when the aircraft was airborne more than 3 hours and time at ground is very short. The reason is that overcooled fuel might be in the wings and could lead to icing at critical parts of the aircrafts wing (see Association of European Airlines, Recommendations for De-Icing / Anti-Icing of Aircraft on the Ground, 2008).
5.7 Risk management measures against low visibility
Low visibility may occur due to dense fog, heavy rain or snowfall or dust. Accident risk is greatly enhanced in low visibility for all transport modes. In road transport, bad visibility in dense fog or snowfall has caused several serious chain collision accidents. In bad visibility the traffic signs cannot be well detected, thus increasing the dark time accident risk. General weather forecasts may include notifications of fog or reduced visibility, but there seems to be a lack of warnings for poor visibility for road users.
In the case of reduced visibility due to fog, rainfall, haze, snowfall or other rea-sons, all vessels are requested to navigate by radar. The decision weather re-duced visibility is present or not and respective actions have to be taken is up to the master of the vessel. During poor visibility traffic is stopped in canals. In Fin-land, fog occurs regularly in spring and autumn. Every spring, after opening the waterways from ice, and in the autumn when the air cools down, the time will
5. Risk management options in Europe
89
come when the ships must stop for the night. In August for about 8–14 days, the traffic is stopped in the Saimaa Canal for 6–8 hours.
Marine weather information contains observations and forecasts for visibility. The most challenging situations in the Mediterranean area for shipping are those when sea visibility is very poor when too much dust or humidity exists. The sea traffic is handled by using radars or AIS (Automatic Identification System).
Aviation has strict limits for runway horizontal and vertical visibility. The airport must stop operations if visibility gets too low.
5.8 Summary of present risk management measures
The analysis of the stakeholder responses revealed what was expected in the first place: the risks and current risk management systems vary considerably through-out Europe according to the transport mode and the climate zone in question.
Transport modes have very different quality and standardisation levels in safety measures. Aviation has the most advanced and standardised safety and opera-tional regulations, naturally due to the very strong weather related safety risks, and these are and must be followed with precision. This is also true with professional maritime and inland waterways transport. Road managers have detailed risk man-agement systems and get their special weather services especially for winter maintenance use.
Some special tailored weather forecasts are available for private citizens for their transport in cars, bicycles or leisure boats. However, it seems that very often the transport users rely on the general weather information and forecasts from the media, which may not be detailed and local enough for their needs.
Respondents also presented numerous new ideas that would improve weather risk management in their specific transport mode. Most of them were such that could be realised with reasonable effort and financing. Few more ideas were inno-vated and evaluated in the EWENT Innovation Seminar in Athens on 26–27 April 2012. These results will be reported in EWENT WP6. After the initial analysis it already seems evident that there is plenty of room and good opportunities for improvement in the European weather risk management systems for transport.
6. Risk indicators for transport modes
90
6. Risk indicators for transport modes
In next chapters we present the relative risk indicator of different transport modes in European countries. The factors which effect on these indicators are:
– probability of the most recurrent extreme weather events (hazard indicator) – quality of infrastructure – traffic density – population density – coping capacity (gross domestic product).
The way to assess this indicator is explained detailed in Chapter 2. In next Figures 39 a–c there are examples of risk indicators which are calculat-
ed from vulnerability indicator (combination of quality index of infrastructure, traffic density, population density and coping capacity) and hazard indicator.
In these figures all countries are arranged into their climate regions so that some of them are even divided in two parts as they belong into two different areas. The first countries from Cyprus (CY) to ES (Spain) belong into the Mediterranean area, from Belgium (BE) to Spain (ES_O) into the Oceanic region; from Austria (AT_Tc) to Belgium (BG)) into the Temperate Central region; from Estonia (EE) to Romania (RO_Te) into the Temperate Eastern region; from France (FR_A) to Sweden (SW_A) into the Mountainous Region and finally from Denmark (DK_NE) to Sweden (SE) into the Northern European region.
The next figures show the overall situation in road transport in Europe. More results regarding all different transport modes can be found in the Appendix 6–8.

6. Risk indicators for transport modes
91
Figure 39 a–c. Overall risk indicators for road transport in Europe; the red chart is calculated are for accidents, blue one is for delays, and green one for infrastructure.

92
References Abrahamsen, E.B. and Aven, T. 2008. On the consistency of risk acceptance
criteria with normative theories for decision-making. Reliability engineering and System Safety (2008). Doi:10.1016/j.ress.2008.03.0214.
Alexander, D. 2000. Confronting Catastrophe. Terra. Hertfordshire.
Association of European Airlines, 2008: Recommendations for De-Icing / Anti-Icing of Aircraft on the Ground. 23rd Edition, September 2008. 42 p.
CEPS, 2010. Protecting Critical Infrastructure in the EU. CEPS Task Force Re-port. Centre for European Policy Studies. Brussels. http://www.ceps.be/ book/protecting-critical-infrastructure-eu.
Cutter, S.L. 1993. Living with risk: The geography of technological hazards. ISBN 0340529873. Edward Arnold. London. 214 p.
Cutter, S.L, Boruff, B.J and Shirley, W.L. 2003. Social Vulnerability to Environmen-tal Hazards. Social Science Quarterly, 84(2):242–261.
Denenburg, H.S, Eilers, R.D, Melone, J. and Zelten, J. 1974. Risk and Insurance, 2nd ed. Englewood Cliffs, N,J: Prentice-Hall, 1974.
Dilley, M., Chen, R., Deichmann, U., Lerner-Lam, A. and Arnold, M. 2005. Natural Disaster Hotspots. A Global Risk Analysis. World Bank.
Eurocontrol, 2012. www.eurocontrol.int
Eurostat, 2012. Extracted on 07.02.2012, from multiple databases, such as: (For traffic density data)
1. Passenger road transport on national territory, by type of vehicles regis-tered in the reporting country [road_pa_mov]
2. Railway transport - Total annual passenger transport [rail_pa_total] 3. Maritime transport - Passengers - Annual data - All ports - by direction
[mar_pa_aa] 4. Air passenger transport by reporting country [avia_paoc] 5. Summary of annual road freight transport by type of operation and type of
transport [road_go_ta_tott] 6. Railway transport - Goods transported, by type of transport [rail_go_typeall] 7. Maritime transport - Goods (gross weight) - Annual data - All ports - by di-
rection [mar_go_aa] 8. Freight and mail air transport by reporting country [avia_gooc]

93
Eurostat, 2012. Extracted on: 12.02.2012 from database: Population density [demo_r_d3dens]
Füssel, H.-M. 2007. Vulnerability; A generally applicable conceptual frame work for climate change research. Global Environmental Change 17(2):155–167. Doi: 10.1016/j.gloenvcha.2006.05.002.
Gibson, S.B. 1977.The quantitative measurements of process safety. 1977. Insti-tution of Chemical Engineers, Chem. E. Symposium Series 49.
Habegger, B. 2008. Risk Analysis and Management in a dynamic Landscape in International Handbook on Risk analysis and management. Professional experiences. Habegger, B. (Ed.). http://www.css.ethz.ch/. ISBN 3-905696-18-5.
Head, G. 1967. An alternative to defining risk as uncertainty. Journal of Risk and Insurance, 34(2):205–214.
ICAO, International Standards and Recommended Practices, Annex 3 to the Con-vention on the International Civil Aviation, Meteorological Service for In-ternational Air Navigation, Fifteenth Edition, 2004.
ISO 31000:2009. Risk management – Principles and guidelines.
Kojo, H., Leviäkangas, P., Molarius, R., Tuominen, A. (Eds.). 2011. Extreme weather impacts on transport systems. VTT, Espoo. VTT Working Papers 168. 119 p. + app. 14 p. http://www.vtt.fi/inf/pdf/workingpapers/2011/W168.pdf.
Leitch, M. 2010. ISO 31000:2009 The New International Standard on Risk Management. Risk Analysis, 30(6):887–892. Doi: 10.1111/j-1539-6924.2010.01397.x.
Leviäkangas, P., Tuominen, A., Molarius, R., Schabel, J., Toivonen, S., Keränen, J., Törnqvist, J., Makkonen, L., Vajda, A., Tuomenvirta, H., Juga, I., Nurmi, P., Rauhala, J., Rehm, F., Gerz, T., Schweighofer, J., Michaelides, S., Pa-padakis, M., Dotzek, N., Groenemeijer, P. and Ludvigsen, J. 2010. EWENT D1 Review on extreme weather impacts on transport systems. EWENT project deliverable D1. July 30, 2010.
Lough, K.G, Stone, R. and Turner, I.Y. 2005. Function based risk assessment; mapping function to likelihood. In: Proceedings of International Design Engineering technical conferences and computers and information in en-gineering conference. Long Beach. CA. 2005.
Ludvigsen, J., Klæboe, R., Nokkala, M., Hietajärvi, A.-M., Leviäkangas, P., Oiva, K., Athanasatos, S., Michaelides, S. and Papdakis, M. 2011. D4.4 (working
94
memo): Costs and consequences of extreme weather on European freight and logistics industries and supply chains. 92 p.
Mühlhausen, T., Bläsche, J., Kreuz, M., Schweighofer, J., Leviäkangas, P., Mo-larius, R., Nokkala, M., Athanasatos, S., Michaelides, S., Papadakis, M., Ludvigsen, J. 2011. D3.4 Consequences of extreme weather. 133 p. http://ewent.vtt.fi/Deliverables/D3/EWENT_D34_v1_0_20111201.pdf.
Mühlhausen, T., Leviäkangas, P., Molarius, R., Nokkala, M., Askola, H., Kreuz, M., Bläsche, J., Schweighofer, J., Siedl, N., Reicher, T., Athanasatos, S., Michaelides, S., Papadakis, M. and Ludvigsen, J. 2012. EWENT: Extreme weather impacts on European networks of transport. Conse-quences of extreme weather. DLR Deutsches Zentrum für Luft- und Raumfahrt e.V., Braunschweig. Forschungsbericht 2012-03. 110 p. + app. 23 p.
Nicholls, R.J., Hanson, S., Herweijer, C., Patmore, N., Hallegatte, S., Corfee-Morlot, J., Chateau, J. and Muir-Wood, R. 2008. Ranking Port Cities with High Exposure and Vulnerability to Climate Extremes: Exposure Estimates. OECD Environment Working Papers, No. 1, OECD Publishing. 63 p. Doi: 10.1787/011766488208.
Nokkala, M., Leviäkangas, P., Oiva, K. (Eds.). Hietajärvi, A.-M., Schweighofer, J., Siedl, N., Vajda, A., Athanasatos, S., Michaelides, S., Papadakis, M., Kreuz, M., Mühlhausen, T., Ludvigsen, J. and Klæboe, R. 2012. The costs of extreme weather for the European transport system. EWENT project D4. VTT, Espoo. VTT Technology 36. 92 p. http://www.vtt.fi/inf/ pdf/technology/2012/T36.pdf.
Pinto, J.G, Neuhaus, C.P., Leckebusch, G.C, Reyers, M. and Kerschgens, M. 2010. Estimation of wind storm impacts over West Germany under future climate conditions using a statistical-dynamical downscaling approach. Tellus A, 62:188-201 Doi: 10.1111/j.1600-0870.2009.00424.x.
Purdy, G. 2010. ISO 31000:2009 – Setting a new standard for Risk Management. Risk Analysis, 30(6): 881–886. Doi: 10.111/j.1539-6924.2010.01442.x.
Riccardo, E., Doll, C., Klug, S., Partzsch, I., Sedlacek, N., Nesterova, N., Kiel, J., Rudzikaite, L., Papanikolaou, A. and Mitsakis, V. 2011. Deliverable 2, Vulnerability of Transport systems. Main report. http://www.weather-project.eu/weather/downloads/Deliverables/WEATHER_Deliverable-2_main-report_20110614.pdf.
Schulz, C. 2007. Identification of critical transport infrastructures. 8. Forum DKKV /CEDIM: Disaster Reduction in Climate Change 15./16.10.2007. Karls-ruhe University. http://www.cedim.de/download/14_Schulz.pdf.

95
Schwab, 2012. The Global Competitiveness Report 2011–2012. World Economic Forum, Geneve, Switzerland. http://www3.weforum.org/docs/WEF_GCR _Report_2011-12.pdf.
Sohn, J., Kim, J.T., Hewings, G.J., Lee, J.S. and Jang, S.-G. 2003. Retrofit Priority of Transport Network Links under an Earthquake J. Urban Plann. Dev., 129(4): 195–210. http://dx.doi.org/10.1061/(ASCE)0733-9488(2003)129:4(195).
Taylor, M.A.P. and D’Este, G.M. 2007. Transport Network Vulnerability: a Method for Diagnosis of Critical Locations in Transport Infrastructure Systems. Critical Infrastructure: Reliability and Vulnerability. Pp. 9–30.
UNISDR, 2009. The United Nations International Strategy for Disaster Reduction (UNISDR) Terminology. http://www.unisdr.org/files/7817_UNISDRTermin ologyEnglish.pdf.
USAID, 2012. IMF World Economic Outlook, US Agency for International Development. http://www.countrycompass.com/data/standard/dataworksheet.php?lb=i&iid=11P1&syr=2001&eyr=2010&acid=1.
Vajda, A., Tuomenvirta, T., Jokinen, P., Luomaranta, A., Makkonen, L., Tikanmäki, M., Groenemeijer, P., Saarikivi, P., Michaelides, S., Papadakis, M., Tymvios, F. and Athanastos, S. 2011. Probabilities of adverse weather affecting transport in Europe: climatology and scenarios up to the 2050s. Finnish Meteorological Institute. Reports 2011:9. ISBN 978-951-697-762-4. Helsinki 2011.
Walker, G., Deeming, H., Margottini, C. and Menoni, S. 2011. Introduction to Sustainable Risk Mitigation for a More Resilient Europe. In: Inside Risk: A Strategy for Sus-tainable Risk Mitigation. Menoni, S. and Margottini, C. (Eds). Springer-Verlag, Italia. 369 p. ISBN978-88-470-1841-9. Doi: 10.1007/978-88-470-1842-6.
White, P., Pelling, M., Sen, K., Seddon, D., Russel, S. and Few, R. 2005. Disaster Risk Reduction. A Development Concers. A scoping study on links be-tween disaster risk reduction, poverty and development. Department for International Development, DFID, United Kingdom.
Villagrán, J.C. 2001. La Naturaleza de los Riesgos, un Enfoque Conceptual. Serie. Aportes para el Desarrollo Sostenible. CIMDEN, Guatemala.
Villagrán, J.C. 2006. Vulnerability. A conceptual and Methodological Review. SOURCE. Studies Of the University: Research, Counsel. Education. Publication Series of UNU-EHS. No 4/2006. Germany. http://www.ehs. unu.edu/file/get/3904.

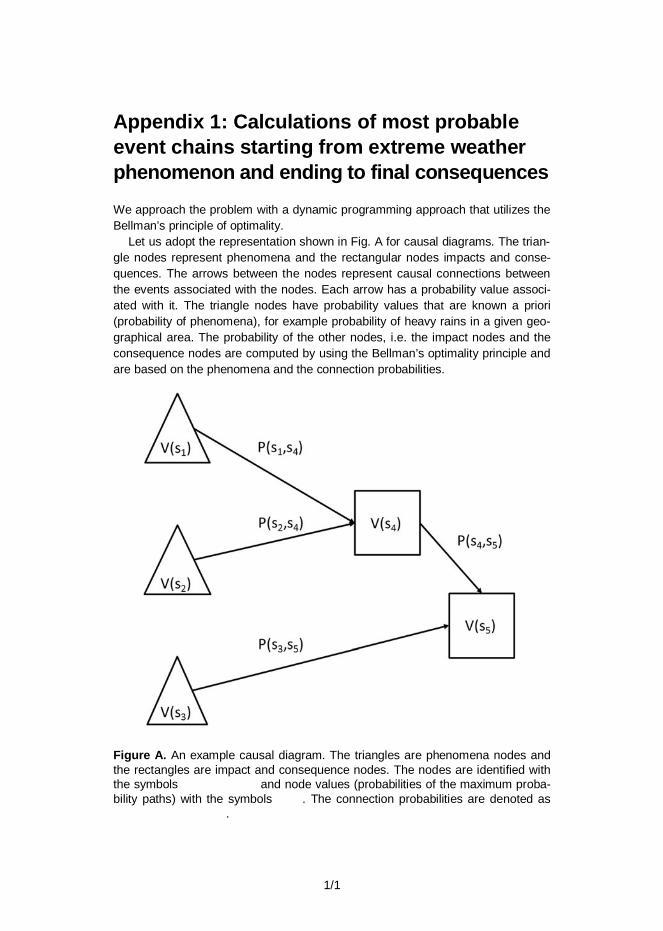
Appendix 1: Calculations of most probable event chains starting from extreme weather phenomenon and ending to final consequences
1/1
Appendix 1: Calculations of most probable event chains starting from extreme weather phenomenon and ending to final consequences We approach the problem with a dynamic programming approach that utilizes the Bellman’s principle of optimality.
Let us adopt the representation shown in Fig. A for causal diagrams. The trian-gle nodes represent phenomena and the rectangular nodes impacts and conse-quences. The arrows between the nodes represent causal connections between the events associated with the nodes. Each arrow has a probability value associ-ated with it. The triangle nodes have probability values that are known a priori (probability of phenomena), for example probability of heavy rains in a given geo-graphical area. The probability of the other nodes, i.e. the impact nodes and the consequence nodes are computed by using the Bellman’s optimality principle and are based on the phenomena and the connection probabilities.
Figure A. An example causal diagram. The triangles are phenomena nodes and the rectangles are impact and consequence nodes. The nodes are identified with the symbols and node values (probabilities of the maximum proba-bility paths) with the symbols . The connection probabilities are denoted as
.

Appendix 1: Calculations of most probable event chains starting from extreme weather phenomenon and ending to final consequences
1/2
Bellman’s optimality principle states that the optimal path has the property that whatever the initial state is, the remaining path should be optimal with regarding to the state resulting from the first selection. Let us denote the optimal path (the path with the maximum probability) from the phenomenon to the consequence as:
) = { , … , }
The probability value of the path is:
( ) ( ) ( ) ( ) ( ) × … × ( ) ( ),
in which ( ) is the optimal path probability from a phenomenon node to the node and is the probability of the event after the event . Because ( )
and are in the unit interval the above product remains bounded and in the unit interval. As all the subpaths have to have the maximal probability values we can rewrite the above product as:
( ) ( ) ( ) ( ) ( ) × … × max( )
( ) ( ),
in which ( ) is the set of incoming links of the node . For the optimal solution it holds that
max( )
( ) ( ).
The equation tells us that the value of the any given node is the maximal product of the connection probability and the preceding node probability over the set of the all incoming links if we assume that the preceding node values are optimal. Re-cursively we can repeat the above deduction until we reach the phenomenon node for which the value is known a priori. Therefore, for finding the optimal path proba-bility value for each node = 1, … , it is enough to perform the following simple update rule several times for each node :
( ) = max( )
.
When the above equation is used iteratively for each node in the causal diagram, the nodes that are directly connected to the phenomena nodes will get their values and after that the nodes that are connected to these first pass nodes. Fig. B illus-trates how the nodes will get their values in the small five node causal diagram.

Appendix 1: Calculations of most probable event chains starting from extreme weather phenomenon and ending to final consequences
1/3
Figure B. An example of the iterative process for finding the maximum probability paths in a small causal diagram consisting of five nodes. Left: initial condition, middle: the only node that is directly connected to the phenomena nodes gets its value, right: based on the previous iteration, the last remaining node gets its value.


2/1
Appendix 2: Traffic density in Europe (EU-27; Eurostat, obtained Feb-2012)
Year 2008 Passenger Freight
Road (mill. person-km)
Rail (mill. person-km)
Sea ports (1000 passengers)
Air ports (passengers)
Road (mill. tn-km)
Rail (mill. tn-km)
Sea ports (1000 tn)
Air ports (tn)
Austria 83211 10365 : 24089381 34313 21915 : 227264
Belgium 132590 10139 799 22340256 38356 8927 243819 1250310
Bulgaria 11988 2317 8 6447810 15322 4693 26576 19769
Cyprus : : 150 7575187 1308 : 7962 41874
Czech Republic 88487 6773 : 13643795 50877 15437 : 55696
Denmark 69368 6267 46657 24483893 19480 1866 106096 246864
Estonia 2123 274 9190 1804792 7354 5943 36191 41744
Finland 71840 4052 16975 14848534 31036 10777 114725 147796
France 769000 86516 26813 1,23E+08 206304 40548 351976 1667689
Germany 949306 82428 28945 1,68E+08 341532 115652 320636 3813613
Greece 5889 1657 91101 35056356 28850 786 152498 112224
Hungary 20449 8291 : 8429082 35759 9874 : 62523
Ireland : 1976 3108 30166241 17402 103 51081 121857
Italy 97560 49524 90156 1,07E+08 180461 23831 526219 826289
Latvia 17169 941 437 3700661 12344 19581 61430 6884
Lithuania 41719 258 212 2562957 20419 14748 36379 9056
Luxembourg : 345 : 1692621 9382 279 : 776959
Malta : : 8132 3109899 : : 5501 18218
Netherlands 193900 : 1959 50670350 78159 6984 530359 1658449
Poland 300294 19762 2647 18729811 164930 52043 48833 57956
Portugal : 4213 762 24773897 39091 2549 65275 133885
Romania 20194 6958 1 8061181 56386 15236 50458 24430 Slovak Republic 7308 2296 : 2600088 29276 9299 : 7419
Slovenia 28024 765 50 1676821 16261 3520 16554 10138
Spain 405386 23453 22478 1,62E+08 242983 10475 416158 540246
Sweden 107844 11146 32745 28063643 42370 22924 187778 206444 United Kingdom 736000 53002 29555 2,15E+08 160296 21077 562166 2404738


3/1
Appendix 3: Infrastructure quality indexes for Europe (EU-27)
The Infrastructure Quality Index: The Index measures executives’ perceptions of general infrastructure in their respective countries. Executives grade, on Likert’s scale from 1 to 7, whether general infrastructure in their country is poorly devel-oped (1) or among the best in the world (7) Global Competitiveness Report, World Economic Forum, obtained from www.countrycompass.com in Feb-2012.
Year 2008 Road Rail Sea port Air port Overall
Austria 6,4 5,5 5,0 6,2 6,5
Belgium 5,9 5,7 6,3 6,1 5,8
Bulgaria 2,3 2,9 3,7 3,6 2,5
Cyprus 5,8 1,0 5,2 5,4 5,5
Czech Republic 3,1 4,4 4,1 5,4 4,2
Denmark 6,2 5,5 6,4 6,4 6,4
Estonia 4,0 3,5 5,5 5,1 4,7
Finland 5,8 5,8 6,3 6,4 6,5
France 6,7 6,6 5,9 6,5 6,6
Germany 6,5 6,4 6,4 6,7 6,6
Greece 4,2 3 4,2 5,5 4,3
Hungary 3,5 3,4 3,9 4,7 4,0
Ireland 3,5 3,0 4,0 5,3 3,7
Italy 3,9 3,0 3,3 4,3 3,5
Latvia 2,9 3,6 4,4 5,6 3,8
Lithuania 5,2 4,1 4,6 4,6 4,5
Luxembourg 5,7 4,9 5,4 5,0 5,9
Malta 3,3 2,0 5,2 5,6 4,6
Netherlands 5,3 5,5 6,6 6,3 5,6
Poland 1,9 2,6 2,6 3,7 2,5
Portugal 5,8 4,3 4,7 5,4 5,4
Romania 1,9 2,7 3,1 3,9 2,3
Slovak Republic 3,1 4,1 4,3 3,5 3,7
Slovenia 4,7 3,3 4,8 4,8 4,8
Spain 5,1 4,7 5,0 5,6 5,1
Sweden 5,6 5,5 5,8 6,0 6,0
United Kingdom 5,3 4,6 5,1 5,8 5,3

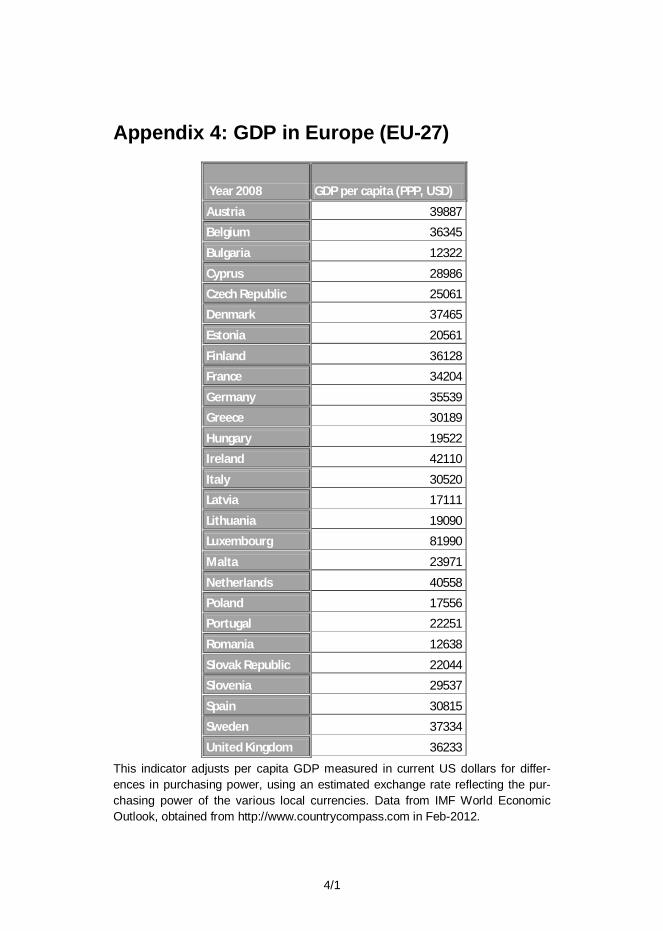
4/1
Appendix 4: GDP in Europe (EU-27)
This indicator adjusts per capita GDP measured in current US dollars for differ-ences in purchasing power, using an estimated exchange rate reflecting the pur-chasing power of the various local currencies. Data from IMF World Economic Outlook, obtained from http://www.countrycompass.com in Feb-2012.
Year 2008 GDP per capita (PPP, USD)
Austria 39887
Belgium 36345
Bulgaria 12322
Cyprus 28986
Czech Republic 25061
Denmark 37465
Estonia 20561
Finland 36128
France 34204
Germany 35539
Greece 30189
Hungary 19522
Ireland 42110
Italy 30520
Latvia 17111
Lithuania 19090
Luxembourg 81990
Malta 23971
Netherlands 40558
Poland 17556
Portugal 22251
Romania 12638
Slovak Republic 22044
Slovenia 29537
Spain 30815
Sweden 37334
United Kingdom 36233


5/1
Appendix 5: Population Density in Europe (EU-27)
Source: Eurostat, obtained Feb-2012.
Year 2008 Population Density (person / km2) Austria 101,1 Belgium 353,1 Bulgaria 68,7 Cyprus 85,7 Czech Republic 135,0 Denmark 127,5 Estonia 30,9 Finland 17,5 France 101,4 Germany 229,9 Greece 85,9 Hungary 107,9 Ireland 64,7 Italy 202,7 Latvia 36,4 Lithuania 53,6 Luxembourg 189,0 Malta 1303,6 Netherlands 487,2 Poland 121,9 Portugal 115,3 Romania 93,6 Slovak Republic 110,3 Slovenia 100,4 Spain 90,8 Sweden 22,5 United Kingdom 252,5


6/1
Appendix 6: Risk indicators for delays

Appendix 6: Risk indicators for delays
6/2
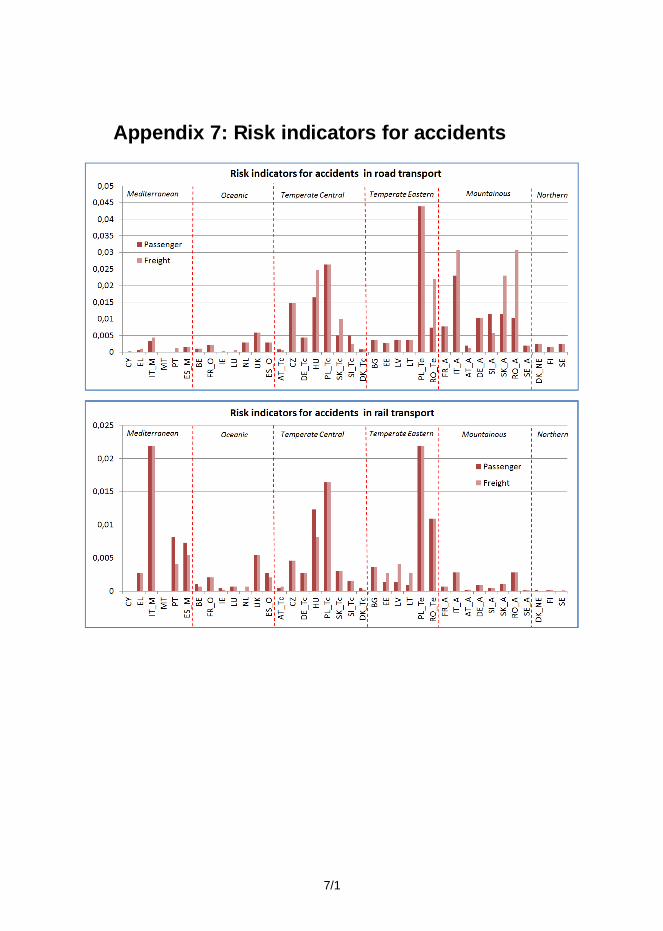
7/1
Appendix 7: Risk indicators for accidents

Appendix 7: Risk indicators for accidents
7/2

8/1
Appendix 8: Risk indicators for infrastructure related damages and costs

Appendix 8: Risk indicators for infrastructure related damages and costs
8/2
Series title and number VTT Technology 43
Title Weather hazards and vulnerabilities for the European transport system – a risk panorama EWENT project D5.1
Author(s) Riitta Molarius, Pekka Leviäkangas, Jussi Rönty & Kalle Oiva, (Eds.) Anna-Maija Hietajärvi, Marko Nokkala, Ville Könönen, Zulkarnain, Michael Kreuz, Thorsten Mühlhausen, Johanna Ludvigsen, Pirkko Saarikivi, Andrea Vajda, Heikki Tuomenvirta, Spyros Athanasatos, Matheos Papadakis, Silas Michaelides, Nina Siedl, Juha Schweighofer, Kathrin Riemann-Campe & Pieter Groenemeijer
Abstract This deliverable of EWENT project estimates the risks of extreme weather on European transport system. The main object of work package 5 in EWENT project was to perform a risk analysis based on impact and probability assessments car-ried out in earlier work packages (WP2–WP3). The results of WP 5 can be used as a starting point when deciding on the risk reduction measures, strategies and policies in the European Union. This deliverable also serves as a background material for the synthesis report (named shortly as Risk Panorama), which will summarise the findings of risk assessment and previous work packages.
The methodological approach of EWENT is based on the generic risk manage-ment standard (IEC 60300-3-9) and starts with the identification of hazardous extreme weather phenomena, followed by an impact assessment and concluded by mitigation and risk control measures. This report pools the information from EWENT’s earlier work packages, such as risk identification and estimation, into a ‘risk panorama’ and provides a holistic picture on the risks of extreme weather in different parts of Europe and EU transport network.
The risk assessment is based on the definition of transport systems’ vulnerabil-ity to extreme weather events in different countries and on calculations of the most probable causal chains, starting from adverse weather phenomena and ending up with events that pose harmful consequences to the transport systems in different climate regions. The latter part, the probabilistic section, is the hazard analysis. The vulnerability of a particular mode in a particular country is a function of expo-sure (indicated by transport or freight volumes and population density), susceptibil-ity (infrastructure quality index, indicating overall resilience) and coping capacity (measured by GDP per capita). Hence, we define the extreme weather risk as
Risk = hazard × vulnerability = P(negative consequences) × V[f(exposure, susceptibility, coping capacity)]
Based on this analytical approach, risk indicators for each mode and country are presented. Due to the techniques used in calculations, the risk indicator is by defi-nition a relative indicator, and must not be considered as an absolute measure of risk. It is a very robust ranking system, first and foremost. Country-specific vulnera-bility indicators and hazard indicators following the climatological division are also presented. In general, countries with poor quality infrastructures combined with high transport volumes and population densities are naturally at most risk.
ISBN, ISSN ISBN 978-951-38-7864-1 (URL: http://www.vtt.fi/publications/index.jsp) ISSN 2242-122X (URL: http://www.vtt.fi/publications/index.jsp)
Date September 2012
Language English, Finnish abstract
Pages 95 p. + app. 13 p.
Keywords EWENT, risk, vulnerability, EU transport system, extreme weather, WP5
Publisher VTT Technical Research Centre of Finland P.O. Box 1000, FI-02044 VTT, Finland, Tel. 020 722 111

Julkaisun sarja ja numero VTT Technology 43
Nimeke Äärisääilmiöiden riskit ja uhat Euroopan liikennejärjestelmälle EWENT projekti D5.1
Tekijä(t) Riitta Molarius, Pekka Leviäkangas, Jussi Rönty & Kalle Oiva (toim.), Anna-Maija Hietajärvi, Marko Nokkala, Ville Könönen, Zulkarnain, Michael Kreuz, Thorsten Mühlhausen, Johanna Ludvigsen, Pirkko Saarikivi, Andrea Vajda, Heikki Tuomenvirta, Spyros Athanasatos, Matheos Papadakis, Silas Michaelides, Nina Siedl, Juha Schweighofer, Kathrin Riemann-Campe & Pieter Groenemeijer
Tiivistelmä Tämä julkaisu esittelee EWENT-projektissa tehdyn riskianalyysin tulokset. Rapor-tissa kuvataan sään ääri-ilmiöistä Euroopan liikennejärjestelmälle aiheutuvaa riskiä. Riskianalyysi tehtiin projektin aikaisemmissa työvaiheissa toteutettujen vaikutus- ja todennäköisyysarviointien pohjalta. Riskianalyysin tuloksia voidaan käyttää päätöksenteon perustana Euroopan Unionissa arvioitaessa strategioita ja toimintalinjoja riskien vähentämiseksi ja niihin varautumiseksi. Tämä raportti on myös hankkeesta tehdyn yhteenvedon (Risk Panorama, englanniksi) tausta-aineisto.
Riskianalyysin metodologinen lähestymistapa pohjautuu yleiseen riskinhallin-nan standardiin (IEC 60300-3-9), jonka mukaan riskianalyysi alkaa vaaraa aiheut-tavien tekijöiden (sään ääri-ilmiöiden) tunnistamisesta, ja jatkuu niiden todennä-köisyyksien ja seurausten arviointiin. Tässä projektissa riskin suuruus määritettiin lopuksi kohteen haavoittuvuuden ja vaaran todennäköisyyden pohjalta. Riskiana-lyysin lisäksi raportissa esitellään eri maissa nykyisin käytetyt riskien hallintatoi-met. Raportti yhdistää EWENT-projektin aikaisemmissa työvaiheissa kootun tiedon ja tarjoaa kokonaiskuvan sään ääri-ilmiöiden liikennejärjestelmälle aiheuttamasta riskistä eri puolilla Eurooppaa.
Riskin arviointi perustuu tarkastellun kohteen (liikennejärjestelmän) vaaran ja haavoittuvuuden määrittämiseen. Vaara tarkoittaa tässä sääilmiöstä aiheutuvan tapahtumaketjun lopputapahtuman todennäköisyyttä. Se on laskettu alkaen kyseis-tä liikennejärjestelmää uhkaavan sääilmiön todennäköisyydestä päätyen tapahtu-maketjun lopputapahtuman todennäköisyyteen. Liikennejärjestelmän haavoittuvuu-den laskennassa on huomioitu altistujien määrä (jota indikoivat liikenne- tai kulje-tusmäärät sekä asukastiheys), järjestelmän herkkyys ilmiölle (infrastruktuurin laa-tuindeksi, kuvaa yleistä kestävyyttä) sekä selviytymiskyky (BKT asukasta kohti) funktio. Näin ollen riski sään ääri-ilmiölle voidaan määritellä seuraavasti
Riski = vaarav × haavoittuvuus = P(negatiivinen seuraus sääilmiöstä) × V[f(altistuminen, herkkyys, selviytymiskyky)]
Tämän analyyttisen lähestymistavan perusteella kaikille liikennemuodolle eri maissa on laskettu riski-indikaattorit. Käytetyistä laskumenetelmistä johtuen riski-indikaattori on luonteeltaan suhteellinen indikaattori, eikä sitä pidä käyttää abso-luuttisena riskin suuruuden arvona. Riski-indikaattori antaa kuvan eri liikennejär-jestelmien haavoittuvuudesta suhteessa toisiinsa niin ilmastoalueittain kuin liiken-nemuodoittainkin. Raportissa on esitetty myös maakohtaiset haavoittuvuusindi-kaattorit sekä ilmastoalueiden mukaan luokitellut vaaraindikaattorit. Yleisesti ottaen voidaan todeta, että suurimmassa riskiryhmässä ovat maat, joiden infrastruktuurin taso on heikko ja joiden liikennemäärät sekä asukastiheydet ovat suuria.
ISBN, ISSN ISBN 978-951-38-7864-1 (URL: http://www.vtt.fi/publications/index.jsp) ISSN 2242-122X (URL: http://www.vtt.fi/publications/index.jsp)
Julkaisuaika Syyskuu 2012
Kieli Englanti, suomenkielinen tiivistelmä
Sivumäärä 95 s. + liitt. 13 s.
Avainsanat EWENT, risk, vulnerability, EU transport system, extreme weather, WP5
Julkaisija VTT PL 1000, 02044 VTT, Puh. 020 722 111

VT
T T
EC
HN
OL
OG
Y 4
3
Weath
er h
aza
rds a
nd
vuln
era
bilitie
s for th
e E
uro
pean
tran
spo
rt...
ISBN 978-951-38-7864-1 (URL: http://www.vtt.fi/publications/index.jsp) ISSN 2242-122X (URL: http://www.vtt.fi/publications/index.jsp)
Weather hazards and vulnerabilities for the European transport system – a risk panorama EWENT project D5