we’re delivering on our promise....we’re delivering on our promise. 24 performance measures 30...
TRANSCRIPT

We’re delivering on our promise.
2014 Short Range Transportation Plan
metro.net/srtp2014

Board of Directors
Eric Garcetti, Chair, Mayor, Los Angeles
Mark Ridley-Thomas, First Vice Chair, Los Angeles County Supervisor, Second Supervisorial District
John Fasana, Second Vice Chair, City Council Member, Duarte
Michael D. Antonovich, Los Angeles County Supervisor, Fifth Supervisorial District
Mike Bonin, City Council Member, Los Angeles
Diane DuBois, City Council Member, Lakewood
Jacquelyn Dupont-Walker, City of Los Angeles Appointee
Don Knabe, Los Angeles County Supervisor, Fourth Supervisorial District
Paul Krekorian, City Council Member, Los Angeles
Gloria Molina, Los Angeles County Supervisor, First Supervisorial District
Ara Najarian, City Council Member, Glendale
Pam O’Connor, Mayor, Santa Monica
Zev Yaroslavsky, Los Angeles County Supervisor, Third Supervisorial District
Carrie Bowen, Caltrans District 7 Director, Non-Voting, Appointed by the Governor of California
On the cover: Construction continues on Metro’s Expo Line extension.

Letter from the CEO
To the People of Los Angeles:
I love LA. Our region is vibrant in its culture, its citizens, and its economy. LA County is home to about 10 million residents today, and we expect an additional 750,000 by 2024. This growth is a sign of the vitality and desirability of Southern California as a place to live, work, and visit. But along with success comes challenges.
Our county experiences some of the greatest mobility challenges in America. According to the Texas Transportation Institute’s Annual Mobility Report, Los Angeles is regularly at the top of the list of the nation’s most congested regions. Our county’s extensive freeway system experiences signi>cant stop-and-go tra;c for much of the day. An auto commuter spends an average of 61 hours per year stuck in tra;c, time that could be better spent with friends and family.
Yet, even as we experience major tra;c challenges, we have developed the foundation of an extensive, diverse transportation system, including highways and streets, bus, rail, and commuter trains and projects for bikes and pedestrians. We have served as an incubator to test new ideas ranging from carpool lanes and toll express lanes, to implementing projects that reduce greenhouse gases and lead to a “greening” of our transportation system. And while we are building major new transit and highway projects, we are also maintaining and protecting the system we already have.
And we’re doing this with your support, to meet your needs. In 2008, the voters of Los Angeles County approved Measure R, a half-cent sales tax to fund a multitude of transportation projects over 30 years. Measure R revenues, when blended with other federal, state, and local dollars, continue to fund an ambitious countywide transportation program. These projects have been highlighted in our Long Range Transportation Plan, approved by the Metro Board in 2009.
This document, the 2014 Short Range Transportation Plan, shows our many customers and constituents – indeed, all who live, work or play in LA County – Metro is making good on our promise. In particular, this Plan highlights how we are delivering on projects and programs in the near term…the next ten years.
It’s an exciting time in LA, as we embark on one of the largest public works programs in the nation. This Plan shows how it all comes together, and also points to strategies that could build projects sooner and possibly fund even more projects. To wrap it up, this Plan shows how we will be changing LA County in a way that’s never been done before. Join us!
Arthur T. Leahy Chief Executive O;cer

Table of Contents
Introduction 5
What’s on our list? And why? 6 We’re caring for what we have. 14 We’re building green. 18 We’re delivering on our promise. 24
Performance Measures 30
Let’s eye the future, together. 34
Get Involved 36
Maps figure a Future Projects – Transit and Highways 9 figure c Public Transportation Recommended Plan 11 figure f Highways Recommended Plan 13
Tables figure b Public Transportation Recommended Plan 10 figure d Highways Recommended Plan 12 figure e Call for Projects Funding 12 figure k Phasing of Forecasted Funds 27
Figures figure g Metro Controlled Funds by Mode 22 figure h Greenhouse Gas Emissions Per Trip 23 figure i Countywide Sources of Funds 26 figure j Countywide Use of Funds 26 figure l AM Peak Period Speeds 30 figure m A Measure of How We Move 30 figure n Mode Choice by Income Level 31 figure o Job Accessibility by Population Subgroup 31 figure p Air Quality Benefits 32 figure q Greenhouse Gas Emissions Reduction 32 figure r Employment Resulting from the Plan 33 figure s Economic Gain Resulting from the Plan 33
The newly-refurbished El Monte Transit Center greets the day.

Metro has been entrusted by the voters of LA County to improve our transportation system, and we are delivering on our promise. Because of Measure R, the voter-approved half-cent sales tax for transportation, we’re redesigning the biggest county in the nation. A ?ood of new projects is coming down the pipeline, and we have to make sure we’re ready and able to meet that future by delivering them to the voters and taxpayers of Los Angeles County.
The Short Range Transportation Plan has been developed as a focused ten-year plan that guides our actions through 2024. The Plan will advance us toward the long-term goals outlined in the 2009 Long Range Transportation Plan (LRTP), a 30-year vision for addressing growth and tra;c in LA County. The Plan monitors our progress in moving projects and programs forward to ensure our system moves people and goods safely.
Here’s what the Short Range Transportation Plan will do:
Establish a coordinated blueprint for transportation. This is a near-term plan that lays out our many transportation projects, such as building 32 miles of rail and 76 miles of carpool lanes and funding programs like the Call for Projects and Highway Operational Improvements.
Honor the near-term priorities of the 2009 LRTP. The Plan identifies those projects and programs that will be implemented over the next ten years in accordance with the project priorities and funding schedules of the
A transportation transformation is taking place, right here.
2009 LRTP. While the Plan advocates for new funding strategies, it does not program any new funds for any new projects. Any new funding sources and their uses would be addressed through Board approval of an amendment or update of the LRTP.
Keep our existing system in a State of Good Repair. While Metro is expanding our transportation system, we are also increasing our e=orts to proactively maintain the current network. The Plan will identify what’s being done to maintain our existing transit system so that it remains safe and reliable.
Grow LA County greener. As Metro continues with its ambitious transportation improvements program, minimizing the impacts associated with construction will continue to be a top priority. We are greening our operations and planning for sustainable communities.
Respond to our >nancial challenges. We’re keeping a close watch on taxpayer dollars. Times are tight and we have had to be resourceful to keep the system moving. By pursuing federal grants and public-private partnerships, as well as options such as borrowing low-interest federal money against local sales tax revenue, we hope to gain maximum value from available funding sources and build our system more rapidly, but with a close eye on available resources.
Measure the bene>ts. The success of the Plan can be evaluated by how it will improve mobility, air quality and the economy over the next ten years.
5
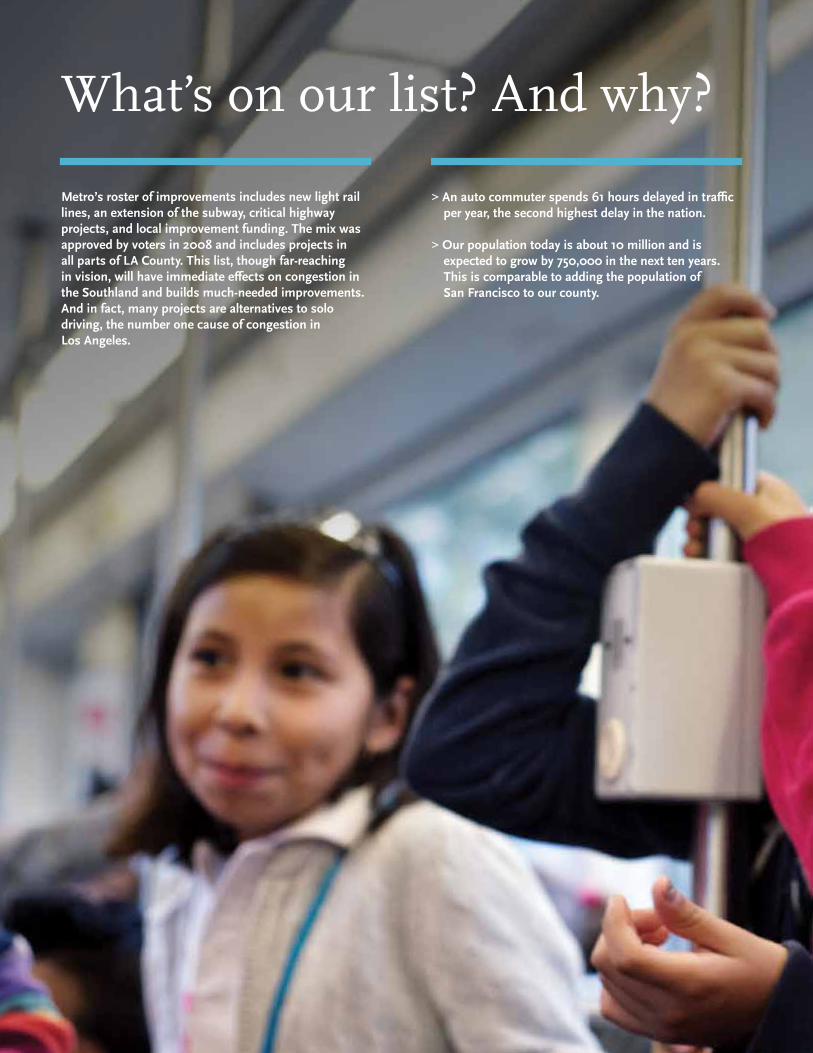
Metro’s roster of improvements includes new light rail lines, an extension of the subway, critical highway projects, and local improvement funding. The mix was approved by voters in 2008 and includes projects in all parts of LA County. This list, though far-reaching in vision, will have immediate e=ects on congestion in the Southland and builds much-needed improvements. And in fact, many projects are alternatives to solo driving, the number one cause of congestion in Los Angeles.
> An auto commuter spends 61 hours delayed in tra;c per year, the second highest delay in the nation.
> Our population today is about 10 million and is expected to grow by 750,000 in the next ten years. This is comparable to adding the population of San Francisco to our county.
What’s on our list? And why?
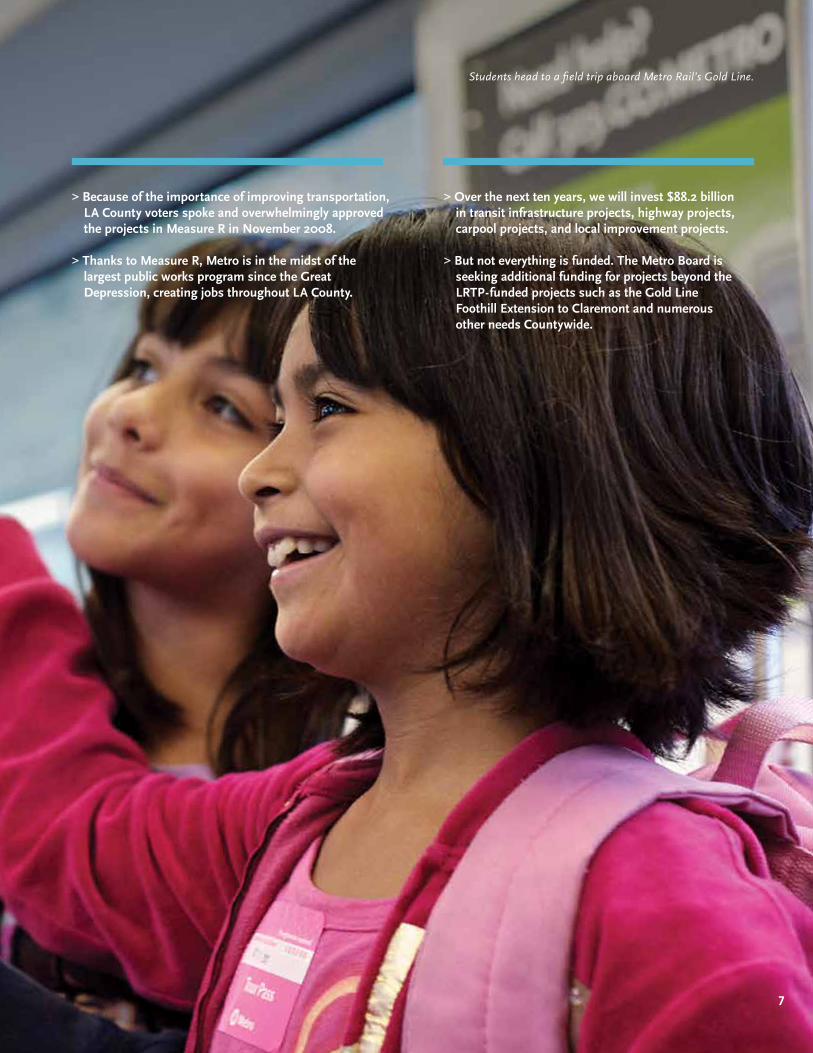
> Because of the importance of improving transportation, LA County voters spoke and overwhelmingly approved the projects in Measure R in November 2008.
> Thanks to Measure R, Metro is in the midst of the largest public works program since the Great Depression, creating jobs throughout LA County.
> Over the next ten years, we will invest $88.2 billion in transit infrastructure projects, highway projects, carpool projects, and local improvement projects.
> But not everything is funded. The Metro Board is seeking additional funding for projects beyond the LRTP-funded projects such as the Gold Line Foothill Extension to Claremont and numerous other needs Countywide.
7
Students head to a >eld trip aboard Metro Rail’s Gold Line.

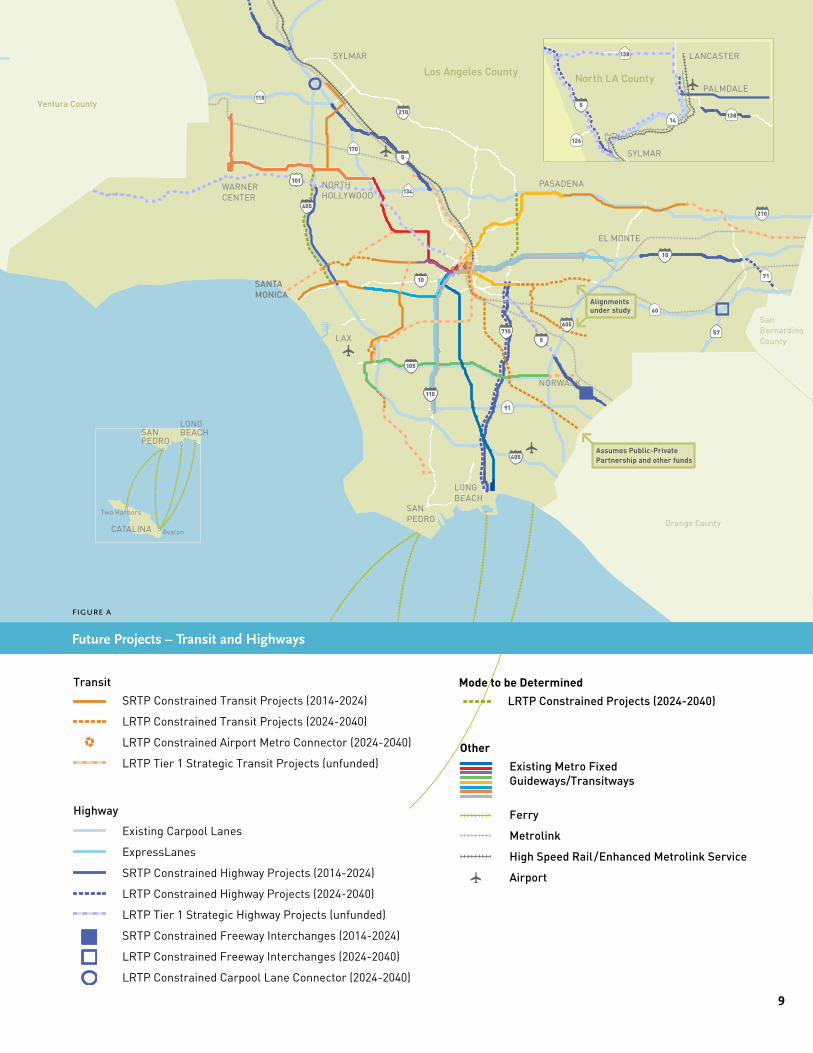
There are many layers to the region’s transportation system – carpool lanes, local streets, bicycle and pedestrian facilities, transit buses, regional rail, and rail lines that must be intelligently integrated to form an overlay of mobility options that enables us to move seamlessly throughout the county. It’s a complex bit of business; the challenge is to apply the right transportation solution to the right problem. Over the next ten years, $88.2 billion is committed to implementing projects and programs that will move us towards improved mobility, better air quality and increased transit access (Fig. A). This funding will also allow us to maintain our vital transportation infrastructure and further our sustainability e=orts.
LA County’s transit providers operate over
4,000 buses and serve approximately
1.6 million bus passengers daily.
In addition to Metro’s regional bus system,
16 municipal operators and
42 local operators serve LA County residents.
The Plan also provides funding for our other regional transit partners, including Access paratransit service for persons with disabilities and Metrolink, which provides commuter rail service in a >ve-county service area.
Metro Rail and Metrolink trains carry over
340,000 passengers daily on
300 miles of rail in LA County.
In the next ten years, Metro Rail will expand by
32 miles of track and grow to
110 stations to o=er approximately
120 miles of service.
The Plan identi>es
6 major transit corridor projects that will be completed by 2024 (Figs. B and C).
The existing carpool lane system spans 541 miles and according to Caltrans’ 2011 Annual HOV report, it carries approximately
322,000 vehicles or
759,000 people per day.
Since the 2009 Long Range Transportation Plan, we have opened nearly
34 carpool-lane miles.
Over the next decade we will see an additional
76 carpool-lane miles completed on I-5, I-10, I-405, and the High Desert Corridor (Figs. D and F).
We continue to improve freeway interchanges and use technology to maximize roadway capacity. Plus, Metro’s Freeway Service Patrol trucks clear tra;c accidents and stalled vehicles from our crowded freeways nearly 900 times each day.
Funding also is identi>ed for interchange improvements at critical choke points where major freeways come together and result in tra;c delays. Interchanges such as the I-5/Carmenita project and interchange improvements in the South Bay will be completed. Operational Improvements such as the Freeway Service Patrol, freeway ramp metering and signal timing also continue to be funded over the next ten years.
In addition to the major public transportation and highway projects, Metro funds other transportation improvements through its Call for Projects. The Call for Projects is a competitive process that gives cities, the County, and some transit operators the opportunity to apply for funding for regionally signi>cant capital transportation projects that are beyond their own capability to fund. The Call for Projects process, which is conducted biennially, funds projects in seven modal categories: Regional Surface Transportation Improvements, Goods Movement, Signal Synchronization and Bus Speed Improvements, Transportation Demand Management, Bicycle, Pedestrian and Transit Capital (Fig. E).
Bicycle and Pedestrian Improvement projects are funded in all seven modes. In the 2013 Call for Projects, over
55% of projects funded had Active Transportation elements and were sustainable.
Metro helps 10 million people move through LA County every day.
SAN PEDRO
CATALINA Avalon
Two Harbors
LONG BEACH
Assumes Public-Private Partnership and other funds
Alignmentsunder study
NORWALK
EL MONTE
WARNERCENTER
LAX
LONG BEACH
SANTAMONICA
SYLMAR
PASADENA
Orange County
San Bernardino County
North LA County
LANCASTER
PALMDALE
Los Angeles County
Ventura County
SAN PEDRO
SANTAMONICA
SYLMAR
110
105
71
57
405
405
710
210
210
10
10
170
118
134
91
60
57605
5
138
126
NORTHHOLLYWOOD
101
138
5
5
14
9
Transit Other
Highway
SRTP Constrained Transit Projects (2014-2024)
LRTP Constrained Transit Projects (2024-2040)
LRTP Constrained Airport Metro Connector (2024-2040)
LRTP Tier 1 Strategic Transit Projects (unfunded)
Existing Carpool Lanes
ExpressLanes
SRTP Constrained Highway Projects (2014-2024)
LRTP Constrained Highway Projects (2024-2040)
LRTP Tier 1 Strategic Highway Projects (unfunded)
SRTP Constrained Freeway Interchanges (2014-2024)
LRTP Constrained Freeway Interchanges (2024-2040)
LRTP Constrained Carpool Lane Connector (2024-2040)
Exising Metro Fixed Guideways/Transitways
Ferry
Metrolink
High Speed Rail*
*enhanced Metrolink service
Transit Other
SRTP Constrained Transit Projects (2014-2024) Existing Metro Fixed Guideways/Transitways
Ferry
Metrolink
High Speed Rail/Enhanced Metrolink Service
Airport
figure a
Future Projects – Transit and Highways
Mode to be Determined
LRTP Constrained Projects (2024-2040)

Public Transportation Recommended Plan 1
total project cost $ in millions escalated to year of expenditure
open year 2
Buses 3
Metro Bus $1,411.3 2014-2024Muni Bus 4,5 $2,140.6 2014-2024
Transit Corridors 3
Exposition LRT Phase II: Culver City to Santa Monica (R) $1,511.2 2016Metro Gold Line Foothill LRT Extension Phase 2A 6,(R) $851.1 2016East San Fernando Valley Transit Corridors (R) $170.1 2018Crenshaw/LAX Transit Corridor (LRT)(R) $2,058.0 2019Regional Connector (R) $1,399.5 2021
Westside Purple Line Extension (R)
Section 1 to La Cienega$2,485.7
2024
Regional RailLos Angeles/Palmdale Corridor (Enhanced Metrolink Service) 7 2019High Speed Rail for Southern California Region 8 $225.0 tbdMetrolink-subsidy 9,(R) $1,131.3 2014-2024
Other Miscellaneous Public Transportation ProjectsAccess Services (paratransit)–Metro Subsidy $1,177.4 2014-2024Safety Net (Immediate Needs) Program $114.7 2014-2024Metro State of Good Repair $4,769.6 2014-2024Metro Rail System Improvements 3,(R) $257.5 2014-2024
1 Listed by Open Year.2 Fiscal Year (July to June).3 Capital costs only.4 Includes rehabilitation and capital costs.5 Does not include Muni Operators Measure R potential acquisitions.6 Measure R funds estimated to fund initial segment, including yard and vehicles.7 Funds included in Metrolink-subsidy line item.8 Federal High Speed Rail funds assumed for Los Angeles County Region.9 Includes rehabilitation and capital; does not include Metrolink fares and other non-Metro funds.(R) Projects included in Measure R.
figure b
Here’s our ten-year transit and highway investment plan.

1111
SAN PEDRO
CATALINA Avalon
Two Harbors
LONG BEACH
LONG BEACH
NORWALK
EL MONTE
WARNERCENTER
LAX
SYLMAR
PASADENA
Orange County
San Bernardino County
North LA County
LANCASTER
PALMDALE
Los Angeles County
Ventura County
SANTAMONICA
SYLMAR
LONG BEACH
SAN PEDRO
110
105
71
57
405
405
710
210
210
10
10
170
118
134
91
60
57605
5
138
126
14
NORTHHOLLYWOOD
101
138
5
5
Exposition Phase II to Santa Monica
Crenshaw/LAX Transit Corridor
Metro Gold Line Foothill Extension Phase 2A
High Speed Rail/Enhanced Metrolink Service
East San Fernando Valley Transit Corridor
Westside Purple Line Extension to La Cienega
Regional Connector
High Speed Rail/Enhanced Metrolink Service
figure c
Public Transportation – Recommended Plan
Transit Other
SRTP Constrained Transit Projects (2014-2024) Existing Metro Fixed Guideways/Transitways
Ferry
Metrolink
High Speed Rail/Enhanced Metrolink Service
Airport
Transit Other
SRTP Constrained Transit Projects (2014-2024) Existing Metro Fixed Guideways/Transitways
Ferry
Metrolink
High Speed Rail*
*enhanced Metrolink service

Highways Recommended Plan1
total project cost $ in millions escalated to year of expenditure
open year 2
Freeway Improvements and Gap Closures
I-5 North Capacity Enhancements: Phase I from SR-14 to Pico Canyon 3,(R) $5,292.8 4 2014
SR-138 Widening (remaining 7 segments) 3,(R) $217.1 2017High Desert Corridor 3 $3,004.0 2021SR-138 Capacity Enhancements (additional segments) 3,(R) $325.0 2022I-710 Early Action Projects 3,(R) $720.0 2024
Carpool LanesI-405 NB Carpool Lanes: I-10 to US-101 $1,149.4 2014I-5 Carpool Lanes: SR-170 to SR-134 $608.4 2015I-5 Carpool Lanes: SR-118 to SR-170 $229.3 2015I-10 Carpool Lanes: Puente Av to Citrus Av $195.6 2015I-10 Carpool Lanes: Citrus Av to SR-57 $234.9 2015
I-5 Carpool & Mixed-Flow Lanes: I-605 to Orange County Line (R) $1,514.5 2017Freeway Interchanges
I-5/Carmenita Rd Interchange Improvement (R) $379.8 2015I-405, I-110, I-105 and SR-91 Ramp and Interchange Improvements in South Bay 3,5,6,(R) $1,512.4 2014+
I-605 Corridor “Hot Spot” Interchanges in Gateway Cities 3,6,(R) $3,050.8 2015-2024Other Freeway Improvements
Countywide Soundwalls (Metro regional list and Monterey Park/SR-60) 3,6,7,(R) $2,329.1 2014-2024
Highway Operational Improvements in Arroyo Verdugo Subregion 3,5,6,(R) $259.6 2014+
Highway Operational Improvements in Las Virgenes/Malibu Subregion 3,5,6,(R) $253.3 2014+Freeway Rehabilitation
Caltrans-administered SHOPP $1,980.0 2014-2024Highway Operations
Freeway Service Patrol $288.0 2014-2024
SAFE $80.0 2014-2024Goods Movement
Alameda Corridor East (Metro Funds) Phase I 6 $541.8 2014
Alameda Corridor East Grade Separations Phase II 3,6,(R) $903.9 2018
BNSF Grade Separations in Gateway Cities 3,6,(R)
1st Grade SeparationRemaining three Grade Separations
$270.02017+
1 Listed by Open Year.2 Fiscal Year (July to June).3 The Plan assumes other local, State and federal funding, including opportunities to fund with fees,
public-private partnerships or tolls. See Technical Document for more funding details.4 Total project cost includes funding for all phases of project.5 Subregional COG project lists are periodically updated by the Subregional COGs and approved by the Board.6 Projects not mapped on Figure F.7 Includes Measure R funding of $250 million.(R) Projects included in Measure R.
Call for Projects Fundingmodal category constrained plan
per year1 2014-20242
Regional Surface Transportation Improvements $29.2 $353.5
Goods Movement Improvements $26.2 $319.8Signal Synchronization & Bus Speed Improvements $33.9 $403.9Transportation Demand Management $6.0 $74.1
Bicycle Improvements $11.7 $134.6 3
Pedestrian Improvements $11.7 $134.6 3
Transit Capital $15.7 $185.11 Unescalated dollars (in millions).2 Escalated dollars (in millions).3 Reduction of the Transportation Alternatives fund by federal legislation, Moving Ahead for Progress in the 21st Century Act (MAP-21), technically reduces the total funding for these modes.
figure d
figure e

Highway
Existing Carpool Lanes
ExpressLanes
SRTP Constrained Highway Projects (2014-2024)
SRTP Constrained Freeway Interchanges (2014-2024)
13
SAN PEDRO
CATALINA Avalon
Two Harbors
LONG BEACH
NORWALK
EL MONTE
WARNERCENTER
LAX
LONG BEACH
SANTAMONICA
SYLMAR
PASADENA
Orange County
San Bernardino County
North LA County
LANCASTER
PALMDALE
Los Angeles County
Ventura County
SAN PEDRO
SANTAMONICA
SYLMAR
110
105
71
57
405
405
710
210
210
10
10
170
118
134
91
60
57605
5
138
126
NORTHHOLLYWOOD
101
138
5
5
High Desert Corridor
I-5: Carpool Lanes(SR-134 to SR-170)
I-5: Carpool Lanes(SR-118 to SR-170)
I-5 Carpool and Mixed Flow Lanes(I-605 to Orange County Line)
SR-138: Capacity Enhancements
I-5 North Capacity Enhancements Phase I (SR-14 to Pico Canyon)
I-405: NB Carpool Lane (I-10 to US-101)
I-710 Early Action Projects
ExpressLanes
I-5: Carmenita RdInterchange Improvement
I-10: Carpool Lanes(Citrus Av to SR-57)
I-10: Carpool Lanes(Puente Av to Citrus Av)ExpressLanes
14
figure f
Highways – Recommended Plan
Transit Other
SRTP Constrained Transit Projects (2014-2024) Existing Metro Fixed Guideways/Transitways
Ferry
Metrolink
High Speed Rail/Enhanced Metrolink Service
Airport
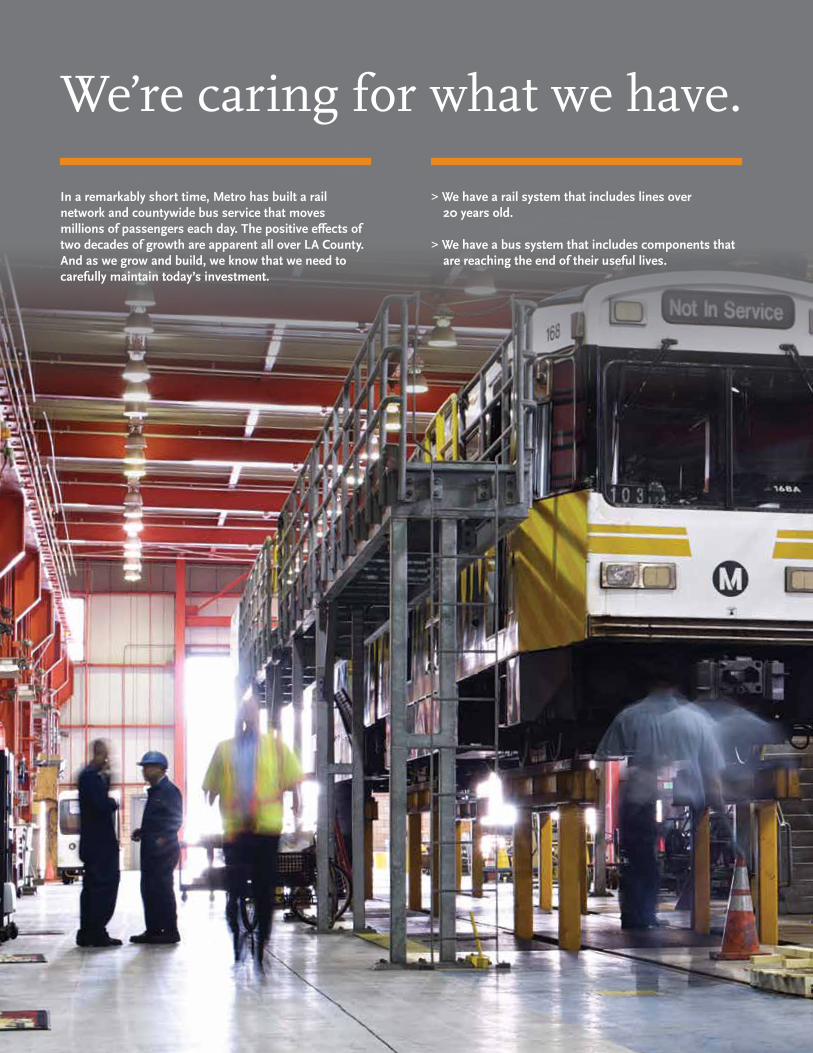
In a remarkably short time, Metro has built a rail network and countywide bus service that moves millions of passengers each day. The positive e=ects of two decades of growth are apparent all over LA County. And as we grow and build, we know that we need to carefully maintain today’s investment.
> We have a rail system that includes lines over 20 years old.
> We have a bus system that includes components that are reaching the end of their useful lives.
We’re caring for what we have.

1315
> We are maintaining our system now so it will continue to operate smoothly in the future.
> We are keeping the system safe and reliable and improving the cleanliness and overall appearance of our facilities.
Blue Line trains are rehabilitated at Division 11.

the metro system includes:
Metro’s system is growing. And it needs continued upkeep.
The Metro Rail system has been expanding since 1991 and, with Measure R, will grow from 88 miles to 120 miles in the next ten years. Metro Rail’s Blue Line, the >rst rail line to enter service, is now more than 20 years old. While Metro is still expanding, maintenance of the existing system is the focus of increased e=orts. Metro is working to protect our investment in transit service and to ensure that we continue to provide safe, reliable and high-quality service over the long run. We are following the best practices in the transit industry, with guidance from the Federal Transit Administration (FTA) and lessons learned from the experience of many of our nation’s older, more mature transit systems.
Metro’s transit system includes thousands of physical assets – pieces of equipment and facilities such as buses and railcars, stations, power plants and service buildings. Each of these assets receives regular maintenance (like changing the oil and tires on a bus). Over time, however, they need extra care. Eventually, items need to be rehabilitated or replaced. The goal of asset management is to keep the system in a State of Good Repair. The requirements for regular maintenance are included in Metro’s operating and maintenance budget. However, Metro needs to look beyond its annual needs to ensure funds are set aside to cover the cost of rehabilitating and replacing assets (such as purchasing replacement rail cars and buses, rebuilding escalators, or replacing roofs on buildings).
2,368 buses
137 escalators
191 miles of track
86 substations

171 light rail cars 104 heavy rail cars
5 closed circuit TV centers 27 division buildings
17
The State of Good Repair needs fall into three categories – safety, service delivery, and quality of service. Safety needs are those critical to prevent accidents on our system (i.e., closed circuit TV centers). Service delivery needs are those critical to delivering reliable service (i.e., buses). Lastly, quality of service needs are those that keep the system clean, attractive and user-friendly (i.e., escalators).
The responsibility for maintaining our system in a State of Good Repair is spread across the Metro organization and involves relationships across many functions. Metro has conducted a detailed analysis examining the rehabilitation and replacement needs, workforce capacity, costs and available funding over the Plan timeframe.
Federal legislation, Moving Ahead for Progress in the 21st Century Act (MAP-21), requires transit agencies to prepare a Transit Asset Management Plan. FTA is developing guidelines recommending transit industry best practices, but has not yet developed speci>c requirements. Metro will coordinate with FTA in developing those requirements as well as a Transit Asset Management Plan for the agency.
To sustain vital transportation infrastructure in LA County, the Plan dedicates $4.8 billion over the next ten years. This dedicated funding represents the cost of bringing Metro’s transportation assets back into a State of Good Repair. Metro will continue with our vigilant e=orts in updating our inventory, managing, and prioritizing our investments so that our assets are protected to serve current and future generations.
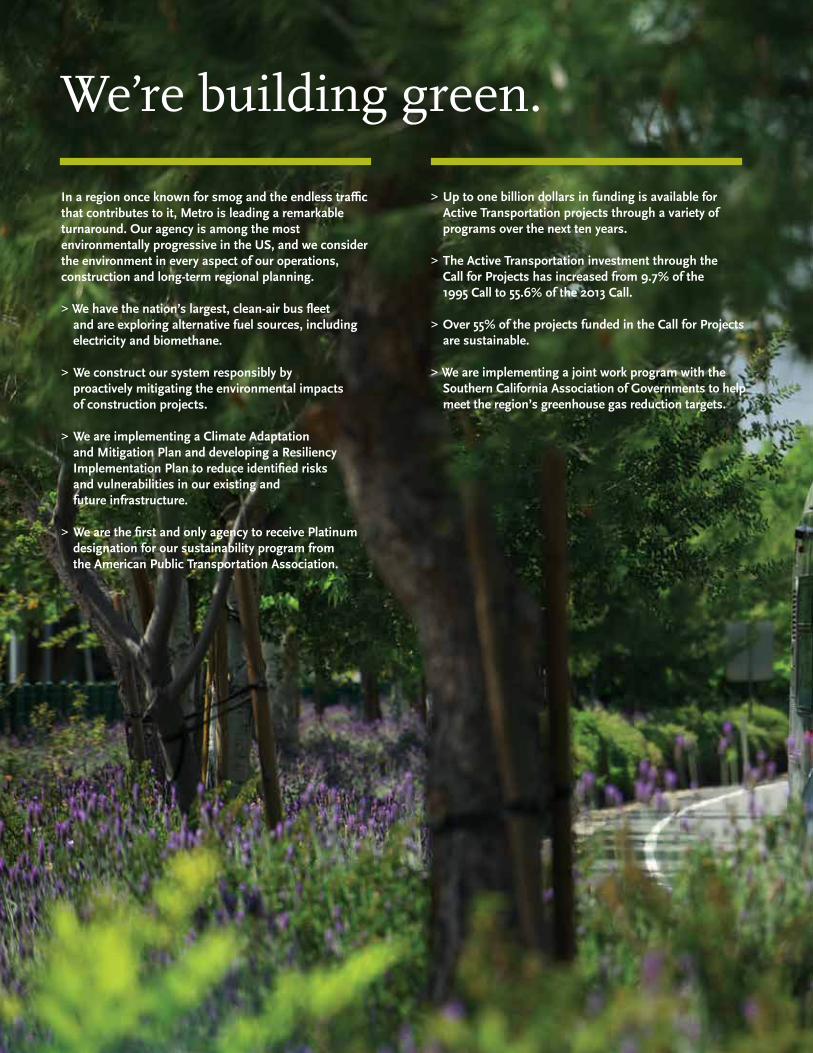
We’re building green.
In a region once known for smog and the endless tra;c that contributes to it, Metro is leading a remarkable turnaround. Our agency is among the most environmentally progressive in the US, and we consider the environment in every aspect of our operations, construction and long-term regional planning.
> We have the nation’s largest, clean-air bus ?eet and are exploring alternative fuel sources, including electricity and biomethane.
> We construct our system responsibly by proactively mitigating the environmental impacts of construction projects.
> We are implementing a Climate Adaptation and Mitigation Plan and developing a Resiliency Implementation Plan to reduce identi>ed risks and vulnerabilities in our existing and future infrastructure.
> We are the >rst and only agency to receive Platinum designation for our sustainability program from the American Public Transportation Association.
> Up to one billion dollars in funding is available for Active Transportation projects through a variety of programs over the next ten years.
> The Active Transportation investment through the Call for Projects has increased from 9.7% of the 1995 Call to 55.6% of the 2013 Call.
> Over 55% of the projects funded in the Call for Projects are sustainable.
> We are implementing a joint work program with the Southern California Association of Governments to help meet the region’s greenhouse gas reduction targets.

19
Clean-fuel articulated buses traverse Metro’s Orange Line.
> We are developing a First/Last-Mile Strategic Plan to increase the reach of our transit system.
> We are developing a Complete Streets Policy to better accommodate all users of streets.
> We adopted the Countywide Sustainability Planning Policy to facilitate greater coordination and collaboration across transportation modes, planning disciplines, and government agencies.
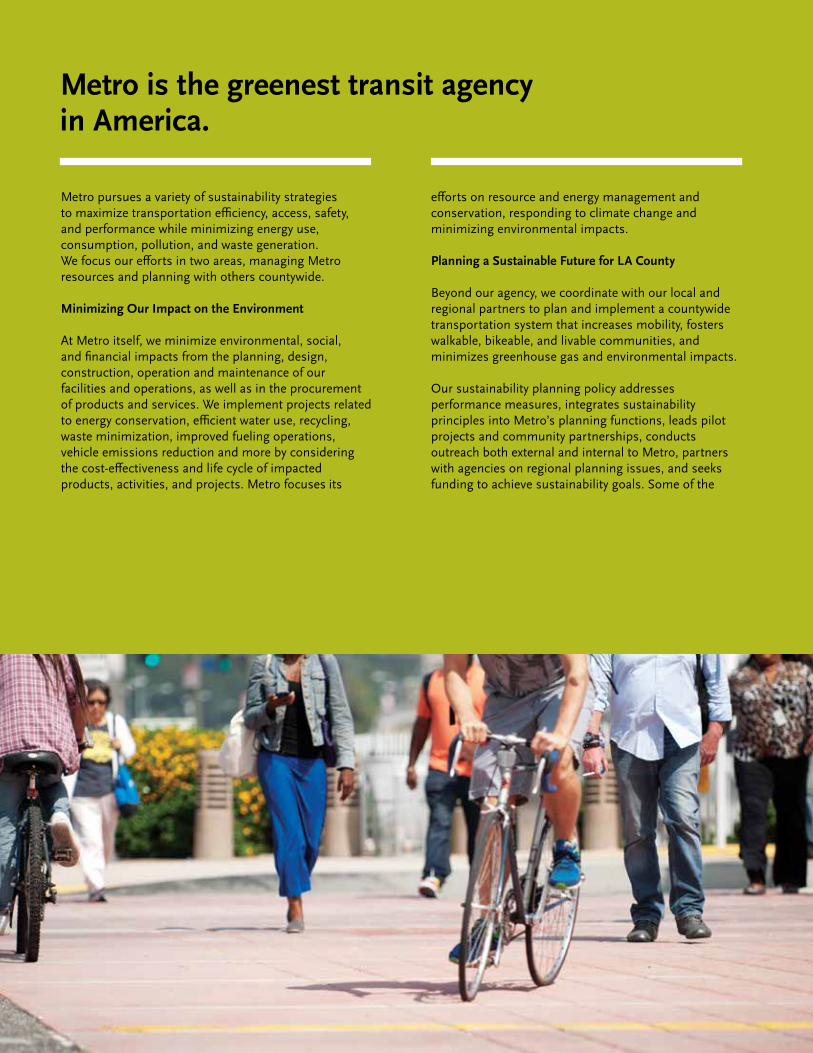
Metro pursues a variety of sustainability strategies to maximize transportation e;ciency, access, safety, and performance while minimizing energy use, consumption, pollution, and waste generation. We focus our e=orts in two areas, managing Metro resources and planning with others countywide.
Minimizing Our Impact on the Environment
At Metro itself, we minimize environmental, social, and >nancial impacts from the planning, design, construction, operation and maintenance of our facilities and operations, as well as in the procurement of products and services. We implement projects related to energy conservation, e;cient water use, recycling, waste minimization, improved fueling operations, vehicle emissions reduction and more by considering the cost-e=ectiveness and life cycle of impacted products, activities, and projects. Metro focuses its
e=orts on resource and energy management and conservation, responding to climate change and minimizing environmental impacts.
Planning a Sustainable Future for LA County
Beyond our agency, we coordinate with our local and regional partners to plan and implement a countywide transportation system that increases mobility, fosters walkable, bikeable, and livable communities, and minimizes greenhouse gas and environmental impacts. Our sustainability planning policy addresses performance measures, integrates sustainability principles into Metro’s planning functions, leads pilot projects and community partnerships, conducts outreach both external and internal to Metro, partners with agencies on regional planning issues, and seeks funding to achieve sustainability goals. Some of the
Metro is the greenest transit agency in America.
21
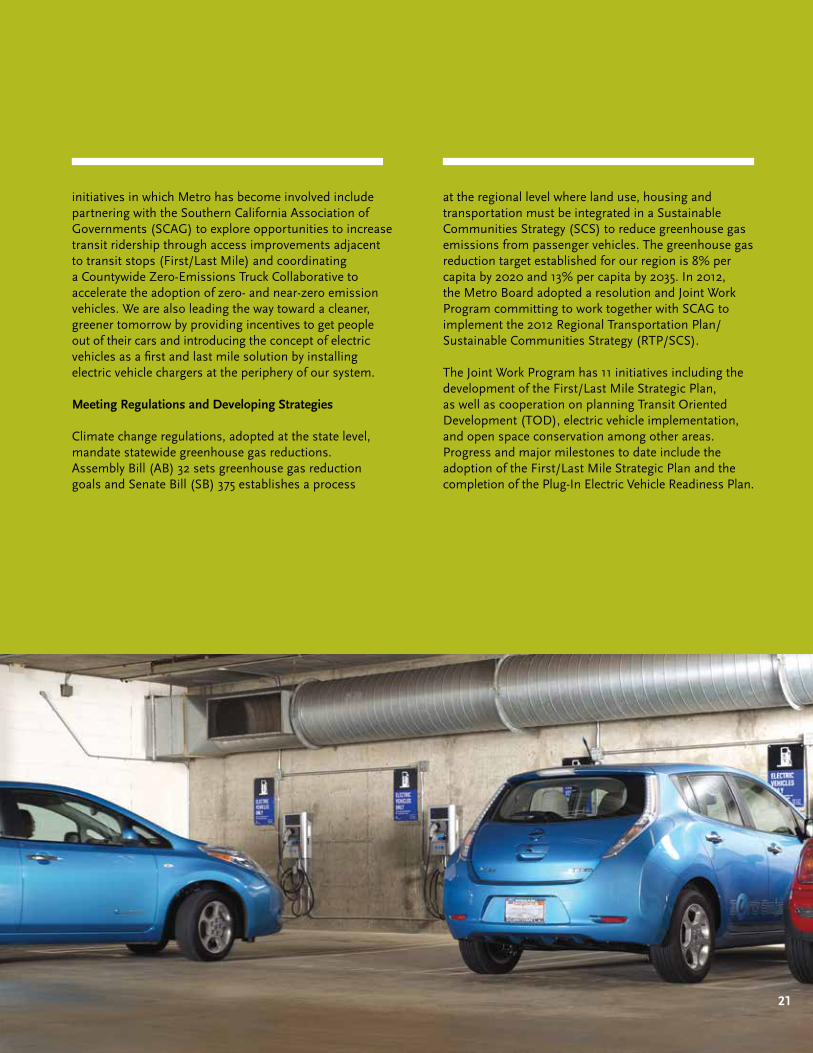
initiatives in which Metro has become involved include partnering with the Southern California Association of Governments (SCAG) to explore opportunities to increase transit ridership through access improvements adjacent to transit stops (First/Last Mile) and coordinating a Countywide Zero-Emissions Truck Collaborative to accelerate the adoption of zero- and near-zero emission vehicles. We are also leading the way toward a cleaner, greener tomorrow by providing incentives to get people out of their cars and introducing the concept of electric vehicles as a >rst and last mile solution by installing electric vehicle chargers at the periphery of our system.
Meeting Regulations and Developing Strategies
Climate change regulations, adopted at the state level, mandate statewide greenhouse gas reductions. Assembly Bill (AB) 32 sets greenhouse gas reduction goals and Senate Bill (SB) 375 establishes a process
at the regional level where land use, housing and transportation must be integrated in a Sustainable Communities Strategy (SCS) to reduce greenhouse gas emissions from passenger vehicles. The greenhouse gas reduction target established for our region is 8% per capita by 2020 and 13% per capita by 2035. In 2012, the Metro Board adopted a resolution and Joint Work Program committing to work together with SCAG to implement the 2012 Regional Transportation Plan/Sustainable Communities Strategy (RTP/SCS). The Joint Work Program has 11 initiatives including the development of the First/Last Mile Strategic Plan, as well as cooperation on planning Transit Oriented Development (TOD), electric vehicle implementation, and open space conservation among other areas. Progress and major milestones to date include the adoption of the First/Last Mile Strategic Plan and the completion of the Plug-In Electric Vehicle Readiness Plan.
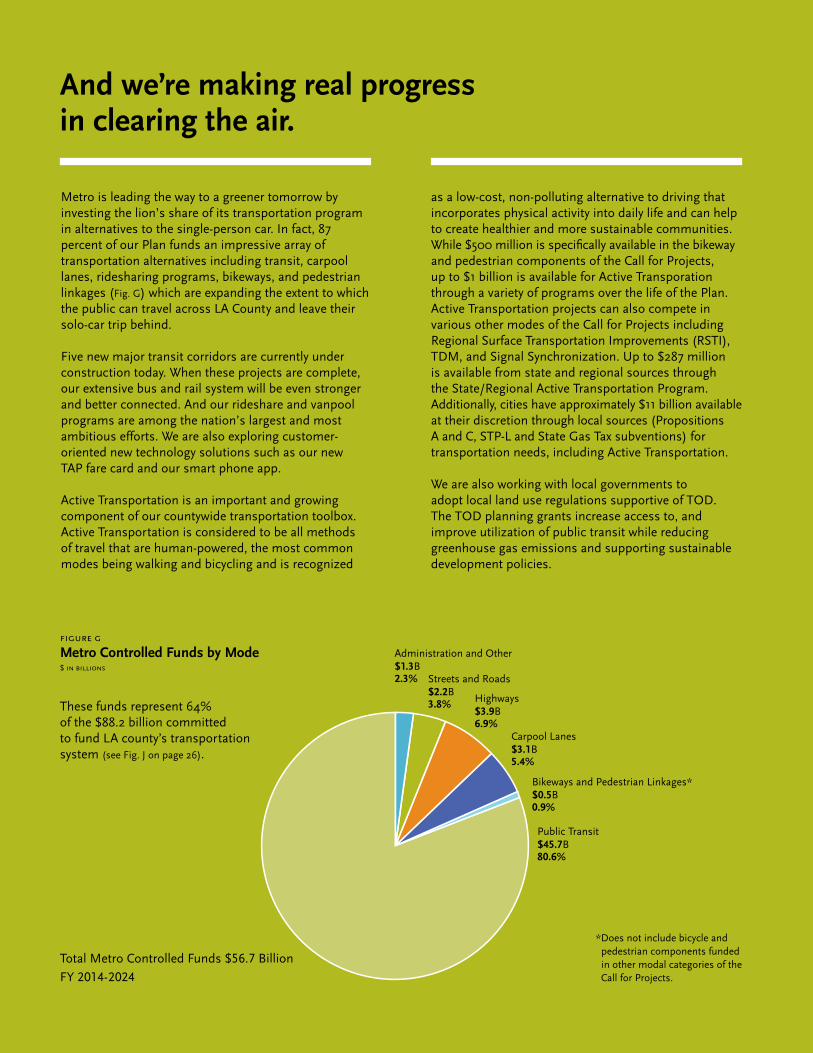
Metro is leading the way to a greener tomorrow by investing the lion’s share of its transportation program in alternatives to the single-person car. In fact, 87 percent of our Plan funds an impressive array of transportation alternatives including transit, carpool lanes, ridesharing programs, bikeways, and pedestrian linkages (Fig. G) which are expanding the extent to which the public can travel across LA County and leave their solo-car trip behind.
Five new major transit corridors are currently under construction today. When these projects are complete, our extensive bus and rail system will be even stronger and better connected. And our rideshare and vanpool programs are among the nation’s largest and most ambitious efforts. We are also exploring customer-oriented new technology solutions such as our new TAP fare card and our smart phone app.
Active Transportation is an important and growing component of our countywide transportation toolbox. Active Transportation is considered to be all methods of travel that are human-powered, the most common modes being walking and bicycling and is recognized
as a low-cost, non-polluting alternative to driving that incorporates physical activity into daily life and can help to create healthier and more sustainable communities. While $500 million is specifically available in the bikeway and pedestrian components of the Call for Projects, up to $1 billion is available for Active Transporation through a variety of programs over the life of the Plan. Active Transportation projects can also compete in various other modes of the Call for Projects including Regional Surface Transportation Improvements (RSTI), TDM, and Signal Synchronization. Up to $287 million is available from state and regional sources through the State/Regional Active Transportation Program. Additionally, cities have approximately $11 billion available at their discretion through local sources (Propositions A and C, STP-L and State Gas Tax subventions) for transportation needs, including Active Transportation.
We are also working with local governments to adopt local land use regulations supportive of TOD. The TOD planning grants increase access to, and improve utilization of public transit while reducing greenhouse gas emissions and supporting sustainable development policies.
figure g
Metro Controlled Funds by Mode$ in billions
Streets and Roads $2.2B 3.8% Highways
$3.9B 6.9%
Carpool Lanes $3.1B 5.4%
Bikeways and Pedestrian Linkages* $0.5B 0.9%
Public Transit $45.7B 80.6%
Administration and Other $1.3B 2.3%
*Does not include bicycle and pedestrian components funded in other modal categories of the Call for Projects.
Total Metro Controlled Funds $56.7 BillionFY 2014-2024
These funds represent 64% of the $88.2 billion committed to fund LA county’s transportation system (see Fig. J on page 26).
And we’re making real progress in clearing the air.
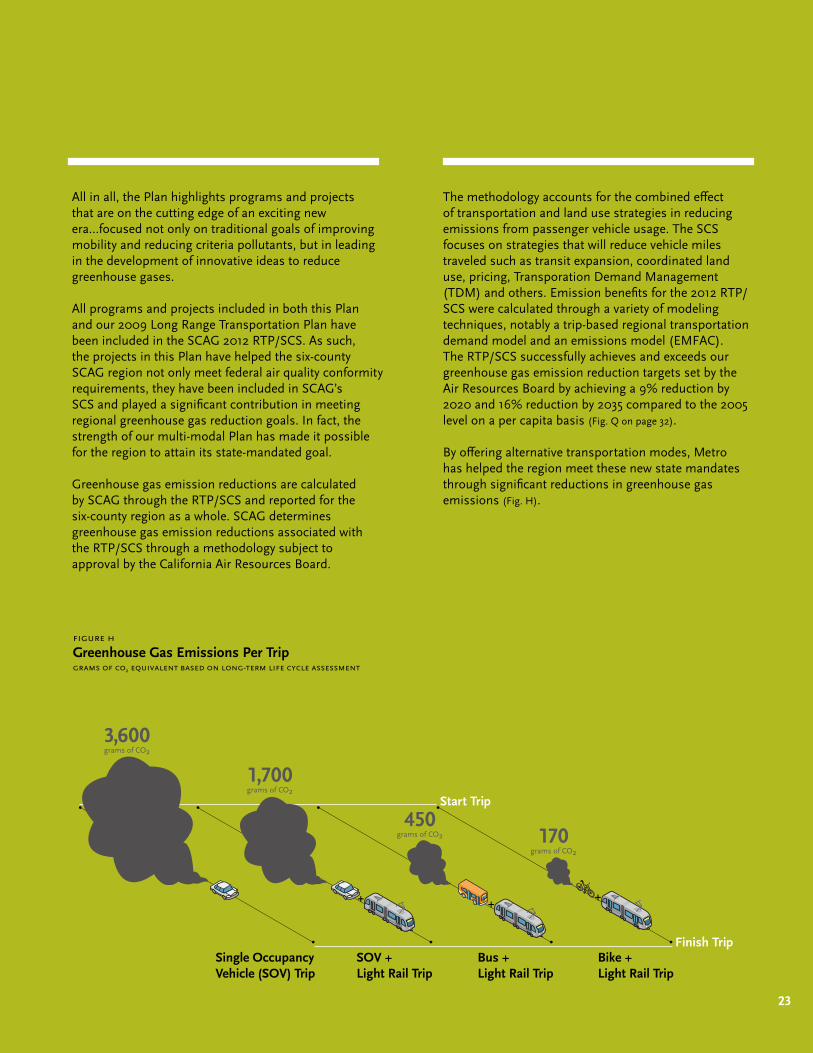
All in all, the Plan highlights programs and projects that are on the cutting edge of an exciting new era…focused not only on traditional goals of improving mobility and reducing criteria pollutants, but in leading in the development of innovative ideas to reduce greenhouse gases.
All programs and projects included in both this Plan and our 2009 Long Range Transportation Plan have been included in the SCAG 2012 RTP/SCS. As such, the projects in this Plan have helped the six-county SCAG region not only meet federal air quality conformity requirements, they have been included in SCAG’s SCS and played a significant contribution in meeting regional greenhouse gas reduction goals. In fact, the strength of our multi-modal Plan has made it possible for the region to attain its state-mandated goal.
Greenhouse gas emission reductions are calculated by SCAG through the RTP/SCS and reported for the six-county region as a whole. SCAG determines greenhouse gas emission reductions associated with the RTP/SCS through a methodology subject to approval by the California Air Resources Board.
The methodology accounts for the combined e=ect of transportation and land use strategies in reducing emissions from passenger vehicle usage. The SCS focuses on strategies that will reduce vehicle miles traveled such as transit expansion, coordinated land use, pricing, Transporation Demand Management (TDM) and others. Emission benefits for the 2012 RTP/SCS were calculated through a variety of modeling techniques, notably a trip-based regional transportation demand model and an emissions model (EMFAC). The RTP/SCS successfully achieves and exceeds our greenhouse gas emission reduction targets set by the Air Resources Board by achieving a 9% reduction by 2020 and 16% reduction by 2035 compared to the 2005 level on a per capita basis (Fig. Q on page 32).
By o=ering alternative transportation modes, Metro has helped the region meet these new state mandates through signi>cant reductions in greenhouse gas emissions (Fig. H).
23
figure h
Greenhouse Gas Emissions Per Tripgrams of co2 equivalent based on long-term life cycle assessment
Start Trip
Finish TripSingle Occupancy Vehicle (SOV) Trip
Bike + Light Rail Trip
SOV + Light Rail Trip
Bus + Light Rail Trip
3,600grams of CO2
170grams of CO2
1,700grams of CO2
450grams of CO2
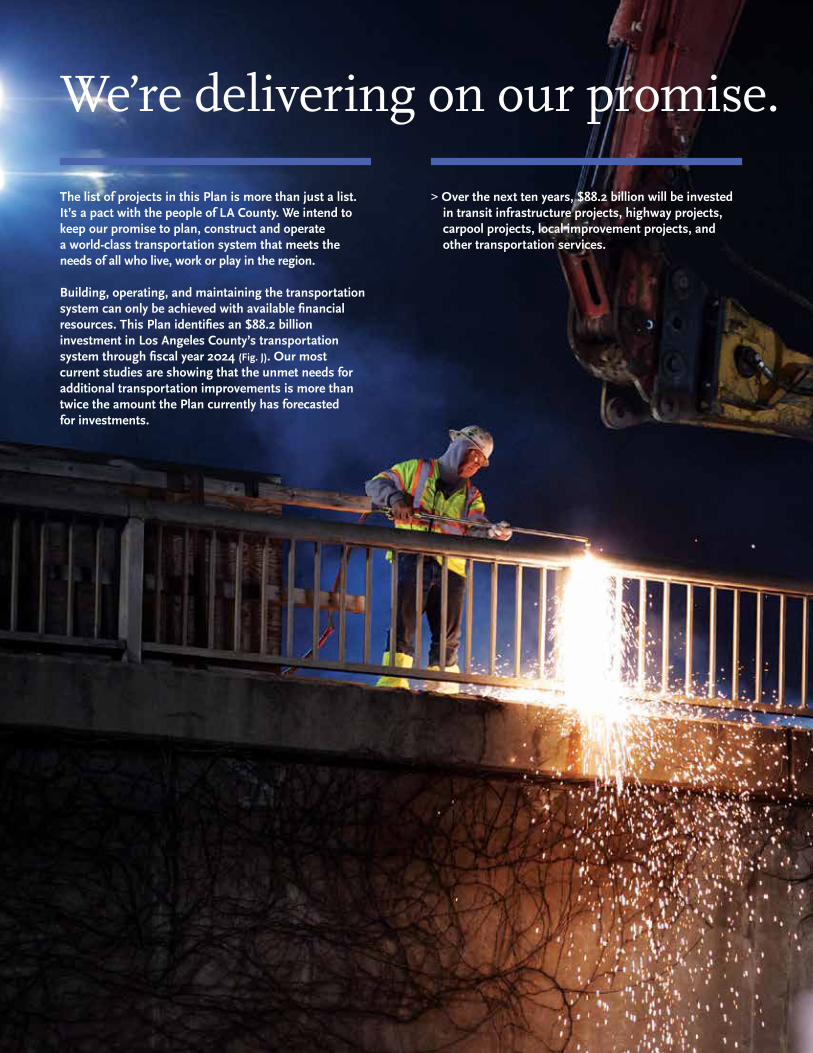
The list of projects in this Plan is more than just a list. It’s a pact with the people of LA County. We intend to keep our promise to plan, construct and operate a world-class transportation system that meets the needs of all who live, work or play in the region.
Building, operating, and maintaining the transportation system can only be achieved with available >nancial resources. This Plan identi>es an $88.2 billion investment in Los Angeles County’s transportation system through >scal year 2024 (Fig. J). Our most current studies are showing that the unmet needs for additional transportation improvements is more than twice the amount the Plan currently has forecasted for investments.
> Over the next ten years, $88.2 billion will be invested in transit infrastructure projects, highway projects, carpool projects, local improvement projects, and other transportation services.
We’re delivering on our promise.
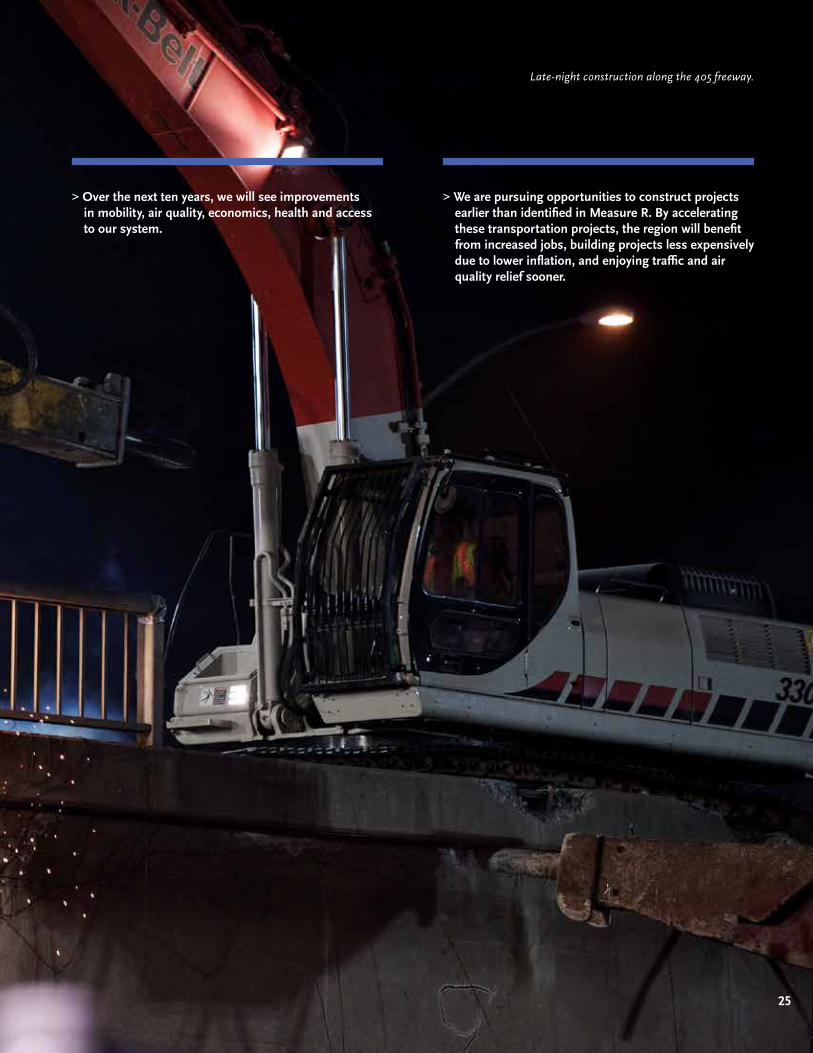
> Over the next ten years, we will see improvements in mobility, air quality, economics, health and access to our system.
> We are pursuing opportunities to construct projects earlier than identi>ed in Measure R. By accelerating these transportation projects, the region will bene>t from increased jobs, building projects less expensively due to lower in?ation, and enjoying tra;c and air quality relief sooner.
25
Late-night construction along the 405 freeway.
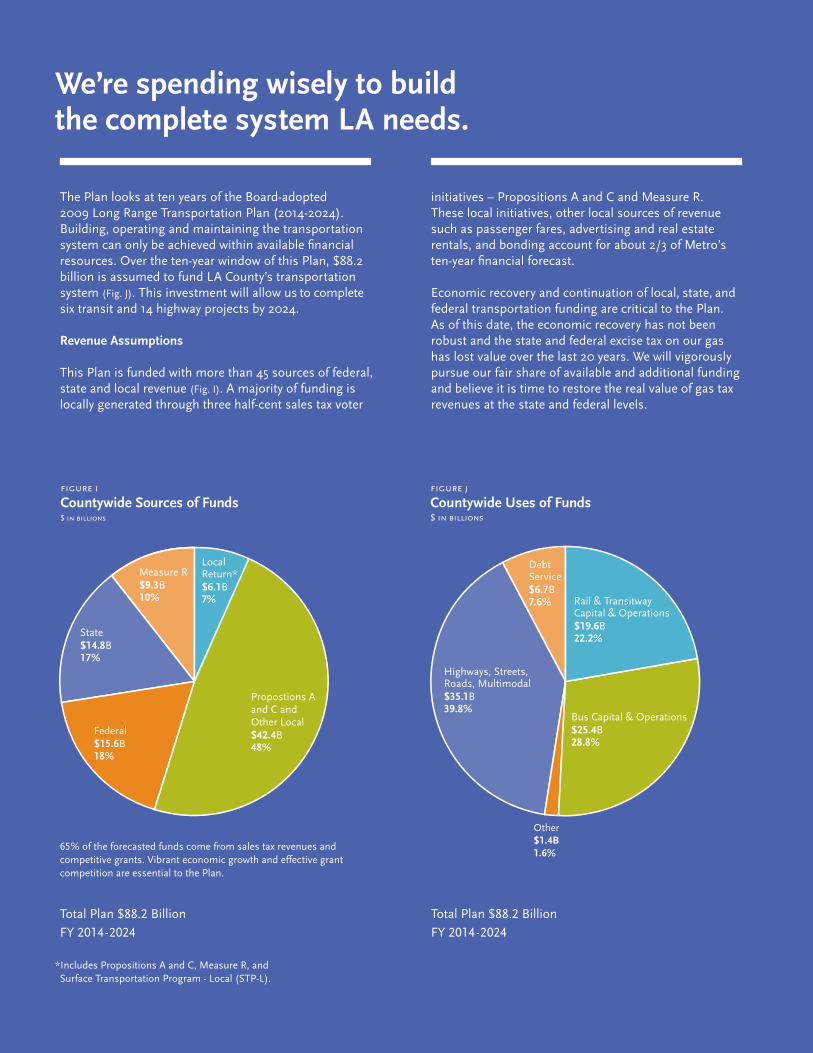
figure i
Countywide Sources of Funds $ in billions
figure j
Countywide Uses of Funds $ in billions
Rail & Transitway Capital & Operations $19.6B 22.2%
Propostions A and C and Other Local $42.4B 48%
Measure R $9.3B 10%
State $14.8B 17%
Federal $15.6B 18%
Bus Capital & Operations $25.4B 28.8%
Other $1.4B 1.6%
Debt Service $6.7B 7.6%
Local Return* $6.1B 7%
Highways, Streets, Roads, Multimodal $35.1B 39.8%
Total Plan $88.2 BillionFY 2014-2024
Total Plan $88.2 Billion FY 2014-2024
*Includes Propositions A and C, Measure R, and Surface Transportation Program - Local (STP-L).
65% of the forecasted funds come from sales tax revenues and competitive grants. Vibrant economic growth and e=ective grant competition are essential to the Plan.
We’re spending wisely to build the complete system LA needs.
The Plan looks at ten years of the Board-adopted 2009 Long Range Transportation Plan (2014-2024). Building, operating and maintaining the transportation system can only be achieved within available >nancial resources. Over the ten-year window of this Plan, $88.2 billion is assumed to fund LA County’s transportation system (Fig. J). This investment will allow us to complete six transit and 14 highway projects by 2024.
Revenue Assumptions
This Plan is funded with more than 45 sources of federal, state and local revenue (Fig. I). A majority of funding is locally generated through three half-cent sales tax voter
initiatives – Propositions A and C and Measure R. These local initiatives, other local sources of revenue such as passenger fares, advertising and real estate rentals, and bonding account for about 2/3 of Metro’s ten-year >nancial forecast.
Economic recovery and continuation of local, state, and federal transportation funding are critical to the Plan. As of this date, the economic recovery has not been robust and the state and federal excise tax on our gas has lost value over the last 20 years. We will vigorously pursue our fair share of available and additional funding and believe it is time to restore the real value of gas tax revenues at the state and federal levels.

27
Numbers may not add due to rounding.
Committed Funds fy 14-15
fy 16-17
fy 18-19
fy 20-21
fy 22-24 plan total
BusOperations $3,319.3 $3,429.4 $3,646.4 $3864.4 $6,247.0 $20,506.5Capital $442.8 $370.6 $382.5 $449.4 $774.6 $2,419.9Subtotal $3,762.1 $3,800.0 $4,028.9 $4,313.8 $7,021.6 $22,926.4
Rail and Transit CorridorsOperations $925.9 $1,041.7 $1,148.8 $1,275.0 $2,072.7 $6,464.2Capital $3,277.1 $2,675.8 $2,257.8 $1,018.5 $1,580.0 $10,809.2Subtotal $4,203.0 $3,717.6 $3,406.6 $2,293.5 $3,652.7 $17,273.4
Highway, Streets, Roads, MultimodalOperations $1,850.9 $1,942.1 $2,025.0 $2,108.8 $3,331.8 $11,258.7Capital $3,551.7 $5,676.4 $4,481.6 $3,934.0 $6,167.4 $ 23,811.1 Subtotal $5,402.6 $7,618.5 $6,506.6 $6,042.9 $9,499.2 $ 35,069.8
State of Good RepairSubtotal $655.8 $798.6 $987.9 $810.9 $1,498.6 $ 4,751.7
Debt ServiceSubtotal $849.5 $1,027.7 $1,300.0 $1,480.3 $2,069.2 $ 6,726.6
OtherSubtotal $257.5 $257.6 $267.5 $249.8 $402.5 $1,435.0
Total Forecasted Funds
$15,130.5 $17,220.0 $16,497.5 $15,191.1 $24,143.8 $ 88,182.9
figure k
Phasing of Forecasted Fundsescalated $ in millions
Metro transit fare revenues currently pay for only 26 percent of our cost to operate transit services. Cost savings are essential to improving this percentage to the planned level of 33 percent. Fare adjustments and/or savings will be necessary to avoid serious deterioration in transit service.
The Plan assumes the continuation of federal formula funds and that additional assistance will be needed to address transit operating and Americans with Disabilities Act (ADA) mandates, with the intent of minimizing future fare adjustments. The Plan also assumes the need for federal discretionary funds, especially for heavy rail transit and major freeway improvements.
Key Commitments
Metro has programming authority for most transportation funds in Los Angeles County, about 64% (see Fig. G on page 22). Cities and other public entities fund other projects and programs with federal, state, and local funds. About $27 billion is projected to operate bus and rail services countywide. Highway, roadway, signal, bicycle and pedestrian programs will require $35 billion (Fig. K).

Congressionally-appointed national commissions, professional engineering organizations, academic think tanks, and national business groups have all documented the national imperative for a new era of federal investment in transportation infrastructure. A new era of federal >nancing of critical transportation infrastructure must take place within the context of >scal and budget realities. These >scal realities require smart, targeted, and innovative >nancing mechanisms that achieve two national priorities: minimize impacts on the federal budget and maximize the generation of new jobs, particularly in the small business sector. A new federal >nancing approach, leveraging transportation projects at the state and local levels can achieve both of these priorities. This is the innovative thinking behind Metro’s Board-approved initiative –America Fast Forward (AFF).
The America Fast Forward initiative supports the creation of a 21st Century national surface transportation system. The plan contains two federal innovative and proven investment methods: tax code incentives and credit assistance.
The speci>c legislative proposals are:(1) America Fast Forward Transportation Bonds(2) Enhanced Transportation Infrastructure Finance and Innovation Act (TIFIA) Program
Bonds: The US Congress may authorize America Fast Forward Transportation Bonds. The AFF bonds would be issued by Metro and the federal government would subsidize interest costs by o=ering tax credits in lieu of the interest. The AFF bonds would be repaid by Metro within 35 years of issuance of the bonds. As of this writing, Metro continues to work with national stakeholders to move this proposal forward.
Loans: Metro is pursuing federal loans from sources such as the TIFIA loan program for projects beyond the Crenshaw/LAX Transit Corridor, the Regional Connector and the Westside Purple Line Extension, Section 1. TIFIA loans o=er ?exible repayment terms and provide combined construction and permanent >nancing of capital costs. None of the other transit infrastructure projects is far enough along in the project development process to apply for TIFIA loans.
In an era of limited budgetary resources, federal policy tools that draw upon credit and tax incentives can play an important role in advancing major transportation investments. With unprecedented demand for existing federal grant programs, the fractional budget scoring of the TIFIA credit assistance and transportation bonds o=ers a >scally-sound approach to moving America forward – America Fast Forward. The expansion of TIFIA was enacted into MAP-21. Metro is now pursuing creation of the AFF Transportation Bonds.
Metro is leading the nation into a new era with America Fast Forward.

Other initiatives beyond AFF are critical to meeting our >nancial needs:
Grants: Metro may pursue additional New Starts (NS) grants funding for projects beyond the Regional Connector and the Westside Purple Line Extension, Section 1. NS grants are the FTA’s primary grant program for funding major transit capital investments and have a local match commitment. At this time, Metro is still considering the possibility of pursuing additional NS grant funds.
Public-Private Partnerships (P3): The principal objective of our Public-Private Partnership Program is to explore opportunities for partnering with the private sector to (1) attract new capital sources for our transportation and highway programs through private financial participation in selected projects, and (2) explore concepts that allow private parties to assist Metro in accelerating project delivery through risk-sharing mechanisms such as design-build delivery and responsibility for project operations and/or maintenance.
By facilitating private sector participation in the provision of public works projects, we may supplement available funds with private debt and equity or utilize other more ?exible funding methods. This P3 project delivery approach is designed to accelerate the delivery of projects,
with repayment to the private sector by project funds programmed for later years and/or by project-generated revenues. Such an approach provides potentially greater ?exibility to Metro in leveraging existing revenue sources and, in the case of project-generated revenues such as tolls, provides a new source of funding.
Sales Tax Measure: Another strategy being considered to increase desperately-needed transportation investments is exploring an extension of an existing sales tax measure or an additional sales tax measure altogether. Using a consensus-based process, Metro has asked the subregions for information on their unfunded transportation priorities. The information collected will allow Metro to use a bottoms-up approach in planning for a new transportation sales tax measure that re?ects the unique needs of each area of the county. If either a new sales tax measure or an extension is successful, it may be possible to accelerate projects.
The new funding sources listed above would help Metro serve a dual purpose – accelerating projects currently expected to be completed between 2025 and 2040 and funding projects that are currently unfunded in the LRTP. Consistent with adopted Metro Board policy, Metro will continue to identify, seek, and obtain funding from all feasible sources in order to fund needed transit and highway projects within the County.
29

We’re measuring our success by your success. And the news is good.
It’s not enough to expand our system. We must grow judiciously and with the intention that the options we provide are e=ective, because we need to meet the needs of all. So we constantly evaluate our planning and service.
We measure our success by comparing:
> how our system will perform in 2024 with the plan
> how our system will perform in 2024 without the plan
> how our system performs today
figure m
Q: How fast will we move through the transportation system?
A: We will hold the line on freeway and arterial speeds. A: More people will move more quickly.
40
42
44
46
48
50
A Measure of How We Movethe higher the number, the better
figure l
Q: How fast will we travel?
AM Peak Period Speedsthe higher the number, the faster the speed
miles per hour
mobility index
0
5
10
15
20
25
30
Free
way
Arteria
l
2024 Plan2024 No Build2014
0
10
20
30
40
50
60
70
80
90
100
Low
Inco
me
Moder
ate
Inco
me
Med
ium
Inco
me
Above
Avg
Inco
me
High
Inco
me
2014 2024 No Build 2024 Plan 2024 Accelerated Plan
0
10
20
30
40
50
60
70
80
90
100
Low
Inco
me
Moder
ate
Inco
me
Med
ium
Inco
me
Above
Avg
Inco
me
High
Inco
me
2014 2024 No Build 2024 Plan 2024 Accelerated Plan

Travel Speed/Mobility: The projects in the Plan will improve AM peak period travel speeds (Fig. L). More people will move faster through the transportation system (Fig. M).
Title VI/Environmental Justice: All income groups, including low-income, are expected to use transit more (Fig. N). All segments of the population, including the transit dependent, enjoy more transit access (Fig. O).
31
0
10
20
30
40
50
60
Africa
n
Amer
ican
Hispan
ic
Asian/
Pacific
Islan
der
Non-Minorit
y
Transit
Depen
dent
figure o
Q: Can transit deliver to the workplace?
Mode Choice by Income Level the more intense the shades, the higher the transit ridership
figure n
Q: How do people get to their workplace?
A: An increasing number will ride transit. A: An increasing number will enjoy better access to transit.
% of home to work peak trips ridership% of work trips within 60 minutes by transit
Transit
Carpool
Single Driver
Job Accessibility by Population Subgroupthe higher the number, the easier it is to get to work by transit
0
10
20
30
40
50
60
70
80
90
100
Low
Inco
me
Moder
ate
Inco
me
Med
ium
Inco
me
Above
Avg
Inco
me High
Inco
me
2014 2024 No Build 2024 Plan 2024 Accelerated Plan
0
10
20
30
40
50
60
70
80
90
100
Low
Inco
me
Moder
ate
Inco
me
Med
ium
Inco
me
Above
Avg
Inco
me
High
Inco
me
2014 2024 No Build 2024 Plan 2024 Accelerated Plan
0
10
20
30
40
50
60
70
80
90
100
Low
Inco
me
Moder
ate
Inco
me
Med
ium
Inco
me
Above
Avg
Inco
me
High
Inco
me
2014 2024 No Build 2024 Plan 2024 Accelerated Plan

Economic: Capital improvements in transportation infrastructure have a positive e=ect on the regional economy as a whole. Building the transportation projects included in the Plan helps to reduce congestion. This means improved productivity for businesses and households, because they reduce their expenditures for the movement of goods and commuting.
Metro projects will help clean our air and fuel local jobs and the local economy.
Air Quality: Over the next ten years, the Plan will reduce mobile source emissions by 1% (Fig. P). Completion of the projects included in the Plan enables SCAG, in part, to achieve a 9% reduction in greenhouse gas emissions by 2020 which surpasses the ARB target of 8% (Fig. Q).
Air Resources Board (ARB) Goal
Level Achieved by 2012 Regional Transportation Plan/
Sustainable Communities Strategy (RTP/SCS)
Air Quality Bene>ts the lower the number, the cleaner the air
Greenhouse Gas Emissions Reduction the higher the number, the cleaner the air
2024 No Build 2024 Plan 2024 Accelerated Plan
COCarb
on M
onoxid
e
PM 10
Partic
ulate M
atter
<10 M
icrons
PM 2.
5
Partic
ulate M
atter
<2.5 M
icrons
NOx
Oxides
of Nitr
ogen
ROG
Reacti
ve O
rgan
ic Gas
es0
1,000,000
500,000
100,000
50,000
2024 No Build 2024 Plan
0
20%
15%
10%
5%
2017
2022
cumulative emissions lb/day
% reduction in per capita ghg since 2005
A: The air will have less pollutants.
figure p
Q: How clean will the air be?
A: The air will have less greenhouse gas emissions.
0
10
20
30
40
50
60
70
80
90
100
Low
Inco
me
Moder
ate
Inco
me
Med
ium
Inco
me
Above
Avg
Inco
me
High
Inco
me
2014 2024 No Build 2024 Plan 2024 Accelerated Plan
figure q
Q: How will the Plan reduce greenhouse gases?

Over the next 10 years, almost 193,000 longer-term jobs will be created from the increased economic activity that will accompany the growth in our infrastructure. Regional employment will bene>t from construction spending and the improvements to mobility (Fig. R).
The Plan will also grow our County’s economy by $33 billion through 2024. The regional economy will bene>t from construction spending and the improvements to mobility (Fig. S).
Economic Gain Resulting from the Plan the higher the number, the more growth in the economy
Employment Resulting from the Plan the higher the number, the more jobs
jobs in thousands
Employment From SRTP Spending
Employment From Increased Mobility
Employment From SRTP Spending
Employment From Increased Mobility
year-of-expenditure dollars in billions
A: Nearly 200,000 jobs will be created. A: $33 billion will be pumped into the local economy.
figure r
Q: How many jobs will be created by the Plan? figure s
Q: How will the economy be a=ected by the Plan?
0
10,000
5,000
15,000
20,000
25,000
30,000
2015
2016
2017
2018
2019
2020
2021
2022
2023
2024
$0
$1
$2
$3
$4
$5
2015
2016
2017
2018
2019
2020
2021
2022
2023
2024
33
jobs added due to construction spending...
additional economic output due to construction spending...
...are replaced by longer-term jobs added due to mobility benefits
...is replaced by longer-term output gains due to mobility benefits

This Plan is just the beginning of an ongoing process to sharpen the vision of our future. As we have seen, you can do a lot in a short period of time. This Plan provides LA County with a roadmap for keeping us all moving over the next ten years.
Let’s eye the future, together.
> Metro will seek to work with state and federal legislators regarding new revenue sources. We will explore opportunities for a new or extended sales tax to accelerate existing projects to optimal schedules or even to fund new projects. And we will continue to test, model and measure our success with every move we make.
35
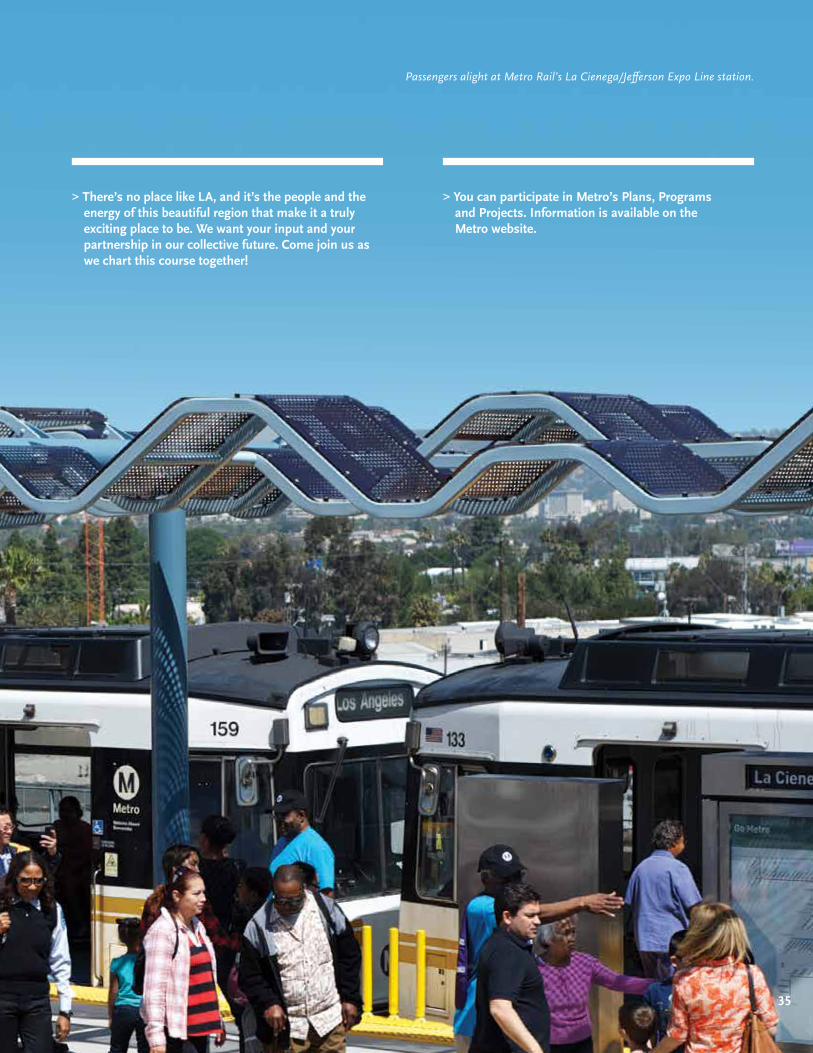
Passengers alight at Metro Rail’s La Cienega/Je=erson Expo Line station.
> There’s no place like LA, and it’s the people and the energy of this beautiful region that make it a truly exciting place to be. We want your input and your partnership in our collective future. Come join us as we chart this course together!
> You can participate in Metro’s Plans, Programs and Projects. Information is available on the Metro website.

To learn more about Metro:
> Visit metro.net
> Subscribe to The Source or El Pasajero
> Attend a local Service Council or community meeting
> Download the Go Metro Los Angeles mobile app
Attn: Long Range Planning Metro One Gateway Plaza Los Angeles, CA 90012-2952
213.922.2833
metro.net/srtp2014
@metrolosangeles
losangelesmetro
Contact Us
Be informed and get involved.

37

12-1
623t
ih ©
2014
lac
mta
15-0
749t
ih ©
2015
lac
mta
Los Angeles County Metropolitan Transportation AuthorityOne Gateway PlazaLos Angeles, CA 90012-2952