:wear and friction effects on energy consumption in the
TRANSCRIPT

PIRITA HÄRKISAARI
WEAR AND FRICTION EFFECTS ON ENERGY CONSUMPTION
IN THE MINING INDUSTRY
Master of Science Thesis
Examiners: Professor Veli-Tapani Kuokkala and Project Manager Kati Valtonen. Examiners and topic ap-proved by the Faculty Council of the Faculty of Engineering Sciences on January 14th 2015.

i
ABSTRACT
PIRITA HÄRKISAARI: Wear and Friction Effects on Energy Consumption in the Mining Industry Tampere University of Technology Master of Science Thesis, 77 pages, 14 Appendix pages April 2015 Master’s Degree Program in Material Science Major: Personal Studies in Materials Science Examiners: Professor Veli-Tapani Kuokkala, Project Manager Kati Valtonen Keywords: Mining, energy consumption, wear, friction
Mining is very important globally. The total amount of mines worldwide is estimated to
be 100,000–150,000 [1]–[3]. Mining’s share of global energy consumption is ~5% [4]–
[6]. Previous studies made on vehicles [7], [8] and paper machines [9] indicate that even
20–30% of total energy is lost due to friction. Similar studies on the energy losses due
to wear have not been made.
This thesis is divided into two parts. In the first part, the global mining industry, energy
consumption in mining, and wear and friction in mining are examined. In the second
part, case studies of highly energy consuming devices, a haul truck, a jaw crusher, and a
grinding mill, are made.
From all mines, 70–80% are surface mines and 20–30% are underground or mixed
mines. The largest mining countries are China, USA, Australia, India, and Russia [1].
The mining process can roughly be divided into three operational stages: extraction,
haulage, and processing. In addition to these three, there is the group of supporting ac-
tivities. When the energy consumption distribution in surface and underground opera-
tions was studied it was discovered that most of the energy goes to processing and sup-
porting activities.
In the case studies the energy losses due to friction are examined by making energy dis-
tribution models. Previous studies and literature on this field was used as a frame of
reference in this work. The effect of wear is evaluated by calculating the costs caused by
replacement parts and wear-related maintenance.
The obtained results indicate that friction losses in the rigid frame haul truck are 24%,
in the jaw crusher 30%, and in the grinding mill 50% of the total energy consumption.
The annual costs of wear are in the haul truck 40,000€, in the jaw crusher 100,000€, and
in the grinding mill 825,000€. The total annual costs of wear and friction compared with
the purchase price of a new device are 28% in a haul truck, 13% in a jaw crusher, and
34% in a grinding mill. Energy savings can be obtained with improving energy efficien-
cy, planning the mining operations and maintenance, and with material selections.

ii
TIIVISTELMÄ
PIRITA HÄRKISAARI: Kulumisen ja kitkan vaikutus energiankulutukseen kaivosteollisuudessa Tampereen teknillinen yliopisto Diplomityö, 77 sivua, 14 liitesivua Huhtikuu 2015 Materiaalitekniikan diplomi-insinöörin tutkinto-ohjelma Pääaine: Materiaalitekniikan henkilökohtaiset aineopinnot Tarkastajat: professori Veli-Tapani Kuokkala, projektipäällikkö Kati Valtonen Avainsanat: kaivosteollisuus, kuluminen, kitka, energiankulutus
Kaivosteollisuus on maailmanlaajuisesti merkittävä teollisuudenala. Maailman kaivos-
ten kokonaismäärä on arviolta noin 100 000–150 000 [1]–[3]. Kaivosteollisuus vastaa
noin viittä prosenttia globaalista energiankulutuksesta [4]–[6]. Kitkan osuutta kokonais-
energiankulutuksesta on tutkittu aikaisemmin ajoneuvoille [7], [8] ja paperikoneille [9]
ja todettu, että jopa 20–30 prosenttia kokonaisenergiasta kuluu moottorin ja vaihteiston
kitkahäviöihin. Vastaavaa tutkimusta kulumisen aiheuttamista häviöistä ei ole tehty.
Tämä diplomityö on jaettu kahteen osaan. Ensimmäinen osa käsittelee kaivosteollisuut-
ta yleisellä tasolla sekä energiankulutusta, kitkaa ja kulumista kaivosteollisuudessa.
Toinen osa koostuu paljon energiaa kuluttavien laitteiden case-tutkimuksista. Tutkitta-
viksi laitteiksi on valittu dumpperi, leukamurskain sekä jauhinmylly.
Maailman kaivoksista 70–80 prosenttia on avolouhoksia ja 20–30 prosenttia maanalai-
sia kaivoksia tai sekakaivoksia. Suurimpia kaivosmaita ovat Kiina, USA, Australia, In-
tia. Kaivosprosessi voidaan karkeasti jakaa kolmeen osaan, louhintaan, kuljetukseen ja
prosessointiin sekä niiden tukitoimintoihin. Avolouhoksissa sekä maanalaisissa kaivok-
sissa suurimpia energiankuluttajia ovat prosessointi ja tukitoiminnot.
Kitkan aiheuttamia energiahäviöitä tutkitaan tässä työssä energianjakautumismallien
avulla. Lähteenä malleihin käytetään kirjallisuutta ja aikaisempia tutkimuksia aiheesta.
Kulumisen vaikutuksia arvioidaan laskemalla uusien kulutusosien hankinnan sekä ku-
lumisen aiheuttaman kunnossapidon kustannuksia.
Kitkahäviöt suhteessa kokonaisenergiankulutukseen ovat dumpperilla 24, leukamurs-
kaimella 30 ja jauhinmyllyllä 50 prosenttia. Kulumisen aiheuttamat kokonaiskustannuk-
set ovat arviolta dumpperilla 40 000 €, leukamurskaimella 100 000 € ja jauhinmyllyllä
825 000 € vuodessa. Jos vuosittaisia kitkan ja kulumisen yhteiskustannuksia verrataan
uuden laitteen hankintahintaan, ovat vastaavat luvut dumpperille 28, murskaimelle 13 ja
jauhinmyllylle 34 prosenttia. Energiasäästöjä voidaan saavuttaa parantamalla energia-
tehokkuutta, prosessien ja kunnossapidon suunnittelulla sekä materiaalivalinnoilla.

iii
PREFACE
This Master’s thesis has been done within the FIMECC BSA (Breakthrough Steels and
Applications) programme. I gratefully acknowledge the financial support from the Finn-
ish Funding Agency for Innovation (Tekes) and the participating companies. The thesis
is written at Tampere University of Technology.
This thesis has been a true learning process in many dimensions. It has been very inter-
esting to learn about the mining industry, to see the actual mining processes, and to find
many new possibilities for my future career.
I want to thank my supervisors Kati and Kenneth for your help and support. Thank you,
Veli-Tapani for taking the time to examine my work from the other side of the Atlantic
Ocean. A special thank you goes to our associates in VTT, Metso, Outotec, SSAB, Py-
häsalmi mine and Kiruna mine as well as maintenance specialist Seppo Tolonen. With-
out the expertise from in field in question this thesis would be in a totally different form.
My journey to become a Master of Science has been a memorable one. I am happy that
I have had the opportunity to see so many sides of teekkari life and the credit from that
goes to all You people I met in my guild, in the student union as well as teekkari choir
and NääsPeksi, in my Erasmus studies in Spain, or maybe just somewhere else on the
way! A special thank you goes to the GGGG girls Laura, Tanja and Elli. It just never
would have been the same without you.
Thank you, Ville for your continuous support and for bearing with me in this somewhat
stressful thesis-time. But most importantly, thank you to my family Anita, Jorma, and
Kaisa for always believing in me and encouraging and supporting me. I did it, finally.
Tampere 7. 4. 2015
Pirita Härkisaari
iv
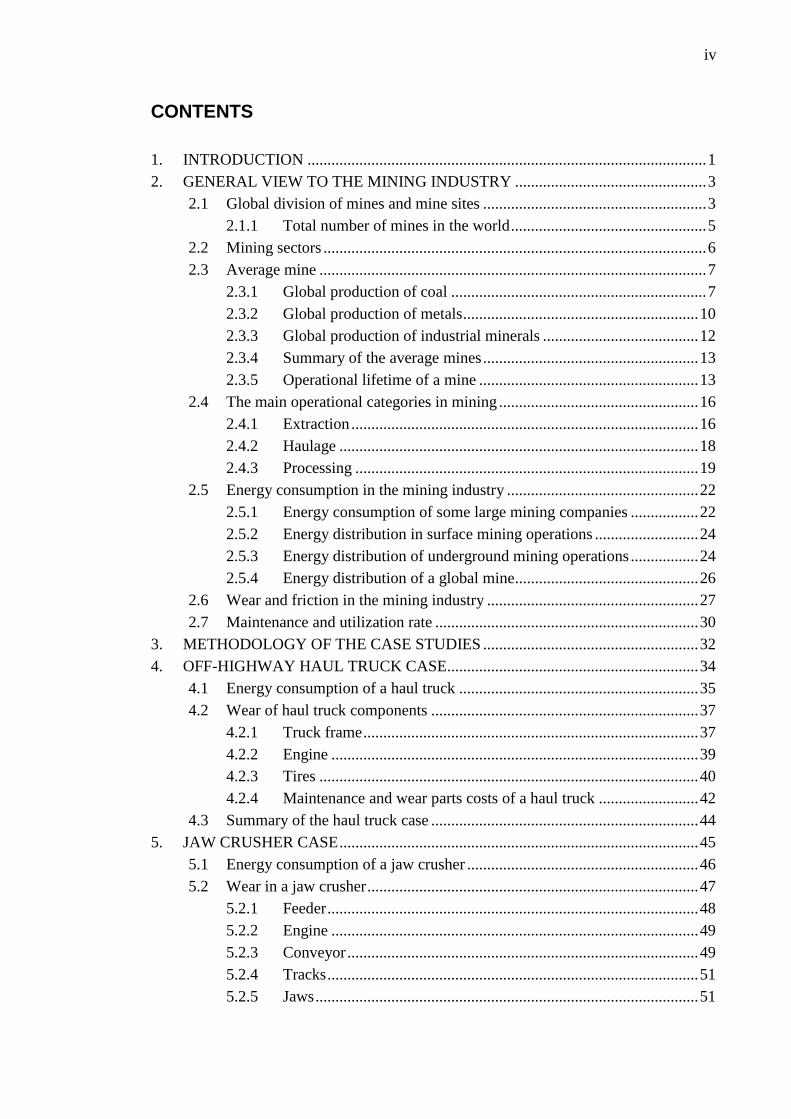
CONTENTS
1. INTRODUCTION .................................................................................................... 1
2. GENERAL VIEW TO THE MINING INDUSTRY ................................................ 3
2.1 Global division of mines and mine sites ........................................................ 3
2.1.1 Total number of mines in the world ................................................. 5
2.2 Mining sectors ................................................................................................ 6
2.3 Average mine ................................................................................................. 7
2.3.1 Global production of coal ................................................................ 7
2.3.2 Global production of metals ........................................................... 10
2.3.3 Global production of industrial minerals ....................................... 12
2.3.4 Summary of the average mines ...................................................... 13
2.3.5 Operational lifetime of a mine ....................................................... 13
2.4 The main operational categories in mining .................................................. 16
2.4.1 Extraction ....................................................................................... 16
2.4.2 Haulage .......................................................................................... 18
2.4.3 Processing ...................................................................................... 19
2.5 Energy consumption in the mining industry ................................................ 22
2.5.1 Energy consumption of some large mining companies ................. 22
2.5.2 Energy distribution in surface mining operations .......................... 24
2.5.3 Energy distribution of underground mining operations ................. 24
2.5.4 Energy distribution of a global mine.............................................. 26
2.6 Wear and friction in the mining industry ..................................................... 27
2.7 Maintenance and utilization rate .................................................................. 30
3. METHODOLOGY OF THE CASE STUDIES ...................................................... 32
4. OFF-HIGHWAY HAUL TRUCK CASE ............................................................... 34
4.1 Energy consumption of a haul truck ............................................................ 35
4.2 Wear of haul truck components ................................................................... 37
4.2.1 Truck frame .................................................................................... 37
4.2.2 Engine ............................................................................................ 39
4.2.3 Tires ............................................................................................... 40
4.2.4 Maintenance and wear parts costs of a haul truck ......................... 42
4.3 Summary of the haul truck case ................................................................... 44
5. JAW CRUSHER CASE .......................................................................................... 45
5.1 Energy consumption of a jaw crusher .......................................................... 46
5.2 Wear in a jaw crusher ................................................................................... 47
5.2.1 Feeder ............................................................................................. 48
5.2.2 Engine ............................................................................................ 49
5.2.3 Conveyor ........................................................................................ 49
5.2.4 Tracks ............................................................................................. 51
5.2.5 Jaws ................................................................................................ 51

v
5.2.6 Maintenance and wear part costs of a jaw crusher ......................... 53
5.2.7 Summary of the jaw crusher case .................................................. 54
6. GRINDING MILL CASE ....................................................................................... 55
6.1 Energy used for grinding .............................................................................. 56
6.2 Wear in a grinding mill ................................................................................ 57
6.2.1 Feeder ............................................................................................. 57
6.2.2 Shell ............................................................................................... 58
6.2.3 Motor .............................................................................................. 59
6.2.4 Maintenance and wear part costs of a grinding mill ...................... 60
6.3 Summary of the grinding mill case .............................................................. 61
7. SUMMARY OF THE CASE STUDIES ................................................................ 62
8. SUMMARY AND CONCLUSIONS ..................................................................... 64
APPENDIX A: CONVERSION FACTORS
APPENDIX B: LIST OF GLOBAL MINE SITES
vi
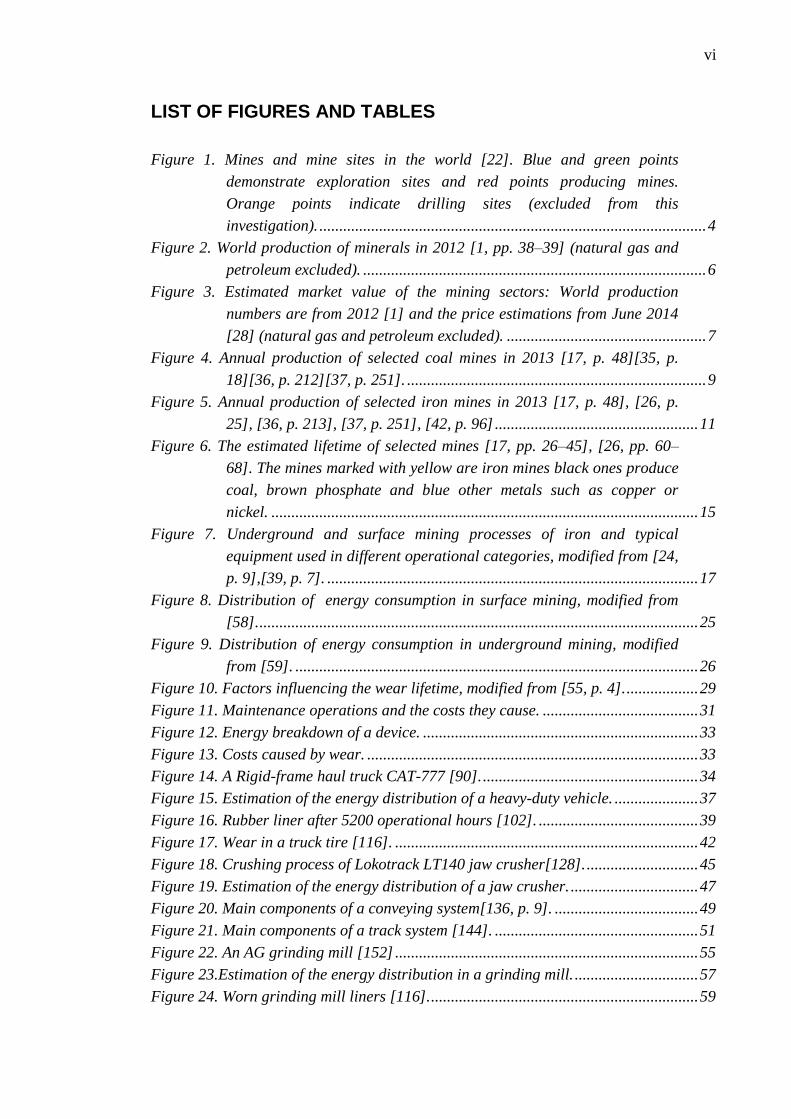
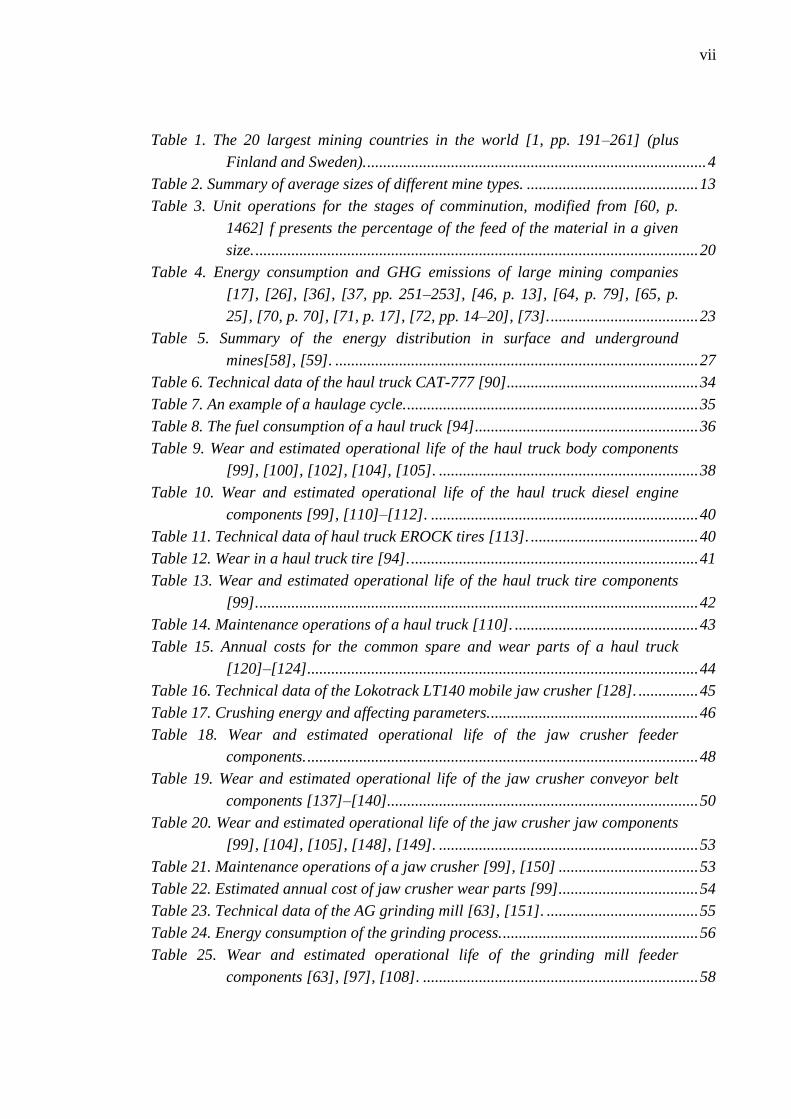
LIST OF FIGURES AND TABLES
Figure 1. Mines and mine sites in the world [22]. Blue and green points
demonstrate exploration sites and red points producing mines.
Orange points indicate drilling sites (excluded from this
investigation). ................................................................................................. 4
Figure 2. World production of minerals in 2012 [1, pp. 38–39] (natural gas and
petroleum excluded). ...................................................................................... 6
Figure 3. Estimated market value of the mining sectors: World production
numbers are from 2012 [1] and the price estimations from June 2014
[28] (natural gas and petroleum excluded). .................................................. 7
Figure 4. Annual production of selected coal mines in 2013 [17, p. 48][35, p.
18][36, p. 212][37, p. 251]. ........................................................................... 9
Figure 5. Annual production of selected iron mines in 2013 [17, p. 48], [26, p.
25], [36, p. 213], [37, p. 251], [42, p. 96] ................................................... 11
Figure 6. The estimated lifetime of selected mines [17, pp. 26–45], [26, pp. 60–
68]. The mines marked with yellow are iron mines black ones produce
coal, brown phosphate and blue other metals such as copper or
nickel. ........................................................................................................... 15
Figure 7. Underground and surface mining processes of iron and typical
equipment used in different operational categories, modified from [24,
p. 9],[39, p. 7]. ............................................................................................. 17
Figure 8. Distribution of energy consumption in surface mining, modified from
[58]. .............................................................................................................. 25
Figure 9. Distribution of energy consumption in underground mining, modified
from [59]. ..................................................................................................... 26
Figure 10. Factors influencing the wear lifetime, modified from [55, p. 4]. .................. 29
Figure 11. Maintenance operations and the costs they cause. ....................................... 31
Figure 12. Energy breakdown of a device. ..................................................................... 33
Figure 13. Costs caused by wear. ................................................................................... 33
Figure 14. A Rigid-frame haul truck CAT-777 [90]. ...................................................... 34
Figure 15. Estimation of the energy distribution of a heavy-duty vehicle. ..................... 37
Figure 16. Rubber liner after 5200 operational hours [102]. ........................................ 39
Figure 17. Wear in a truck tire [116]. ............................................................................ 42
Figure 18. Crushing process of Lokotrack LT140 jaw crusher[128]. ............................ 45
Figure 19. Estimation of the energy distribution of a jaw crusher. ................................ 47
Figure 20. Main components of a conveying system[136, p. 9]. .................................... 49
Figure 21. Main components of a track system [144]. ................................................... 51
Figure 22. An AG grinding mill [152] ............................................................................ 55
Figure 23.Estimation of the energy distribution in a grinding mill. ............................... 57
Figure 24. Worn grinding mill liners [116]. ................................................................... 59
vii
Table 1. The 20 largest mining countries in the world [1, pp. 191–261] (plus
Finland and Sweden). ..................................................................................... 4
Table 2. Summary of average sizes of different mine types. ........................................... 13
Table 3. Unit operations for the stages of comminution, modified from [60, p.
1462] f presents the percentage of the feed of the material in a given
size. ............................................................................................................... 20
Table 4. Energy consumption and GHG emissions of large mining companies
[17], [26], [36], [37, pp. 251–253], [46, p. 13], [64, p. 79], [65, p.
25], [70, p. 70], [71, p. 17], [72, pp. 14–20], [73]. ..................................... 23
Table 5. Summary of the energy distribution in surface and underground
mines[58], [59]. ........................................................................................... 27
Table 6. Technical data of the haul truck CAT-777 [90]. ............................................... 34
Table 7. An example of a haulage cycle. ......................................................................... 35
Table 8. The fuel consumption of a haul truck [94] ........................................................ 36
Table 9. Wear and estimated operational life of the haul truck body components
[99], [100], [102], [104], [105]. ................................................................. 38
Table 10. Wear and estimated operational life of the haul truck diesel engine
components [99], [110]–[112]. ................................................................... 40
Table 11. Technical data of haul truck EROCK tires [113]. .......................................... 40
Table 12. Wear in a haul truck tire [94]. ........................................................................ 41
Table 13. Wear and estimated operational life of the haul truck tire components
[99]. .............................................................................................................. 42
Table 14. Maintenance operations of a haul truck [110]. .............................................. 43
Table 15. Annual costs for the common spare and wear parts of a haul truck
[120]–[124]. ................................................................................................. 44
Table 16. Technical data of the Lokotrack LT140 mobile jaw crusher [128]. ............... 45
Table 17. Crushing energy and affecting parameters. .................................................... 46
Table 18. Wear and estimated operational life of the jaw crusher feeder
components. .................................................................................................. 48
Table 19. Wear and estimated operational life of the jaw crusher conveyor belt
components [137]–[140].............................................................................. 50
Table 20. Wear and estimated operational life of the jaw crusher jaw components
[99], [104], [105], [148], [149]. ................................................................. 53
Table 21. Maintenance operations of a jaw crusher [99], [150] ................................... 53
Table 22. Estimated annual cost of jaw crusher wear parts [99]. .................................. 54
Table 23. Technical data of the AG grinding mill [63], [151]. ...................................... 55
Table 24. Energy consumption of the grinding process. ................................................. 56
Table 25. Wear and estimated operational life of the grinding mill feeder
components [63], [97], [108]. ..................................................................... 58

viii
Table 26. Wear and estimated operational life of the grinding mill shell
components [63], [139]................................................................................ 59
Table 27. Planned maintenance of a grinding mill [63], [99], [159]. ........................... 60
Table 28. Annual costs of grinding mill wear parts [63], [99], [123], [124]. ............... 61
Table 29. Summary of annual friction losses. ................................................................. 63
Table 30. Summary of annual wear losses. ..................................................................... 63
Table 31. Annual costs of wear and friction vs. the estimated purchase price. .............. 63

ix
LIST OF SYMBOLS AND ABBREVIATIONS
Al Aluminum
Au Gold
CO2-eq Carbon dioxide equivalent
Cu Copper
ct Carat
Di Diamond
E Energy
f Top size of feed material
Fcl Climbing resistance
Fm Main resistance
Fs Secondary resistance
Fsp Special resistance
Ftot Total resistance
Fe Iron
Mtoe Million tons of oil equivalent
N Required power
Ni Nickel
oz Ounce
p Top size of product material
Ph Phosphate
t Tonne (metric ton)
v Speed of the conveyor
Vkm Vehicle kilometer
Wi Work index
Zn Zinc
η Mechanical efficiency
AG/SAG Autogenous/ Semi-Autogenous (grinding mills)
AU Australia
BR Brazil
CA Canada
CN China
CO Colombia
CV Calorific Value
GDP Gross Domestic Product
GHH Greenhouse Gas
HV Vickers hardness
HPGR High pressure grinding roll
IBRAM Brazilian Minerals Institute
ID Indonesia
MZ Mozambique
ROM Run-of-mine
SE Sweden
US Unites States of America
ZA South Africa
1
1. INTRODUCTION
The global energy demand increases continuously. In the last 40 years, the world’s en-
ergy demand has doubled [10, p. 28]. A review made by the oil company BP [11] indi-
cates that in the year 2013 the global energy consumption increased by 2.3% from the
previous year, especially in the developing countries. Even though the development of
renewable energy sources is rapid, more than 80% of the total energy is produced with
oil, coal and natural gas [10]. In 2012, the energy related CO2 emissions increased by
1.4% from the year 2011 [12].
The industry, on average, is responsible for 30% of the total energy consumption [10].
In 2011 in the USA from all the industry sections mining was in charge of 2–3% of the
energy consumption [6], which corresponds to approximately 1% of the total energy
use. In South Africa mining used 8% of the total energy [4] of the country in 2010. The
corresponding number in Canada in 2009 [5] was 12%. The world’s largest individual
energy consumer is China, which also produces 40% of the world’s minerals [1].
Not all energy is used for mechanical work, but a large portion of it is lost due to cool-
ing, exhaust, friction and wear. For the first time the relation between wear and friction
and the costs they cause on the gross domestic product was researched by the Great
Britain Ministry of Technology in 1964. The so-called Jost Report [13] proposed the
total part of wear in the GDP to be 2%. Many studies on this topic have been made, and
later figures presented in the ASM Tribology Congress in 2013 [14] suggest that the
wear costs are annually even 9% of the GDP. The potential savings with the correct use
of tribology are estimated to be up to 1.6 % of the GDP [15]. In the European Union
this would correspond to 250 billion euros, which is almost the double of the European
Union budget for 2014 [16].
Recent studies made on vehicles [12], [13] propose that one third of the energy fed to
passenger cars or trucks goes to overcome friction in the engine, transmission, brakes
and tires. In paper machines the equivalent number is 15–25% [9]. The circumstances in
mining are more demanding than for example in the paper industry; instead of a con-
trolled industrial environment the conditions in a mine can differ from the dry and hot
deserts of Atacama Copper mine [17, p. 279] in Gobi desert to the cold icy Norilsk
Nickel mine sites [18, p. 28] in Siberia, Northern Russia, and everything in between.
Understanding and controlling wear and friction therefore plays an extremely important
role in the total energy consumption in the mining industry.

2
In the first part of this study, the global mining industry is mapped; how many mines are
there globally, what an average mine would be like, and how is the energy consumption
divided in the mining industry. Mining for construction as well as oil and natural gas
drilling are excluded from this investigation. In the second part of the thesis, three ener-
gy consuming devices are more closely examined: a haul truck, a jaw crusher, and a
grinding mill. The energy losses due to friction and the costs caused by wear are exam-
ined in each case.
3
2. GENERAL VIEW TO THE MINING INDUSTRY
In earlier times, a mine was built wherever ore was found. Nowadays, however, the
mining business has developed to an entity where the actual mining process is just one
of the many factors to be considered. When building up a mine it is rational to debate
whether the mineral is really worth excavating, are the resources adequate to make the
mine profitable, and what are the best methods for mining [19, pp. 4–6]. The current
trends are towards carefully optimized operational units, where extraction is done even
deeper and from lower grades of ore [20, pp. 8–9]. In addition to the actual extraction
and minerals processing the environmental and political factors such as conservation or
permits [19, pp. 4–6] and social license for mining [21, pp. 23–24] must be considered.
In the following chapter, an overview of the global mining industry, the mining process,
and the energy consumption in mining is made. In the end of the chapter, the phenome-
na of wear and friction as well as maintenance in mining are discussed.
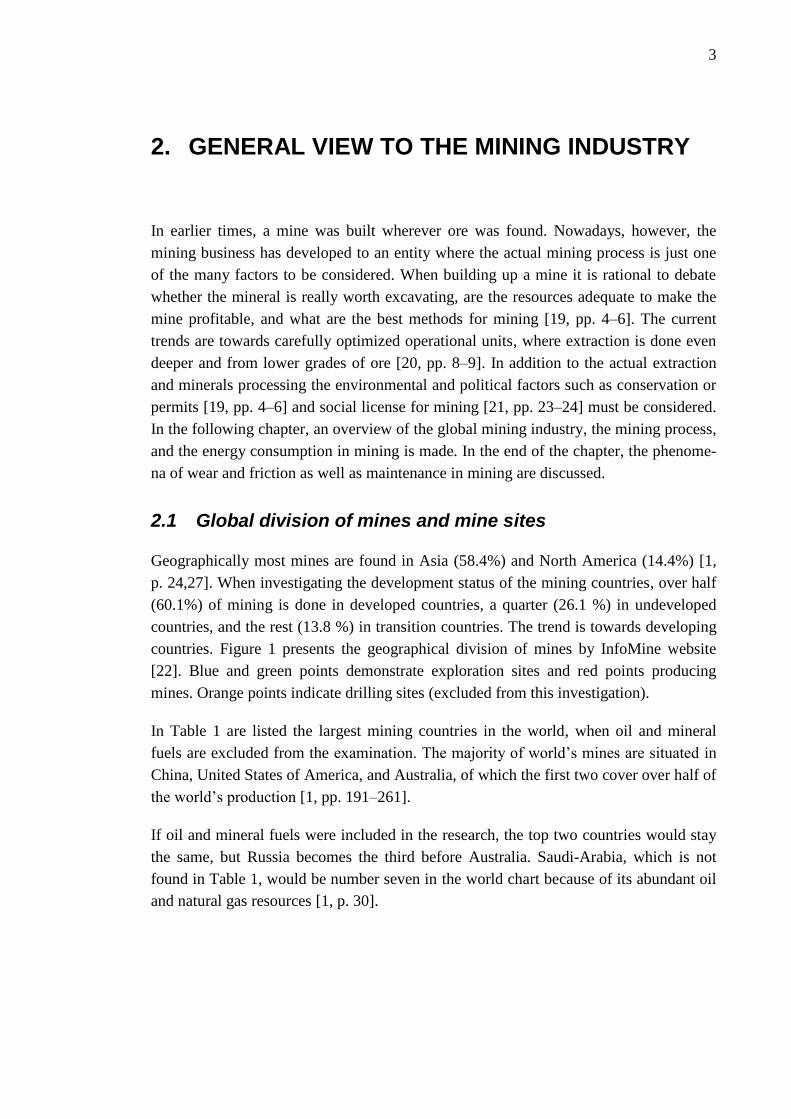
2.1 Global division of mines and mine sites
Geographically most mines are found in Asia (58.4%) and North America (14.4%) [1,
p. 24,27]. When investigating the development status of the mining countries, over half
(60.1%) of mining is done in developed countries, a quarter (26.1 %) in undeveloped
countries, and the rest (13.8 %) in transition countries. The trend is towards developing
countries. Figure 1 presents the geographical division of mines by InfoMine website
[22]. Blue and green points demonstrate exploration sites and red points producing
mines. Orange points indicate drilling sites (excluded from this investigation).
In Table 1 are listed the largest mining countries in the world, when oil and mineral
fuels are excluded from the examination. The majority of world’s mines are situated in
China, United States of America, and Australia, of which the first two cover over half of
the world’s production [1, pp. 191–261].
If oil and mineral fuels were included in the research, the top two countries would stay
the same, but Russia becomes the third before Australia. Saudi-Arabia, which is not
found in Table 1, would be number seven in the world chart because of its abundant oil
and natural gas resources [1, p. 30].

4
Figure 1. Mines and mine sites in the world [22]. Blue and green points demonstrate
exploration sites and red points producing mines. Orange points indicate drilling sites
(excluded from this investigation).
Table 1. The 20 largest mining countries in the world [1, pp. 191–261] (plus Finland
and Sweden).
Country Percentage of the world production (2012)
1. China 40.96
2. USA 10.27
3. Australia 8.20
4. India 7.22
5. Russia 4.71
6. Indonesia 4.43
7. The Republic of South Africa 3.08
8. Brazil 2.85
9. Georgia 2.21
10. Kazakhstan 1.53
11. Poland 1.47
12. Canada 1.21
13. Ukraine 1.15
14. Turkey 1.03
15. Colombia 0.66
16. Greece 0.66
17. The Czech Republic 0.57
18. Mexico 0.50
19. Vietnam 0.45
20. Iran 0.43
31. Sweden 0.17
73. Finland 0.02

5
2.1.1 Total number of mines in the world
Finding the exact number of mines in the world is complicated. Canadian American
Handbook 2007–2008 [23] reports the total number of mines to be about 500–750,
while Mining Journal 2014 [2] proposes the total number to be 125,000. This large dif-
ference must be due to differences in the classification; in one case all small quarries are
seen as individual operations while in the other cases only large industrial mines are
accounted for. Precise numbers where obtained from two mining countries: Brazil and
USA. According to the Brazilian Minerals Institute IBRAM [3] in Brazil, where there
are 2.85 percent of mines of the world, the total number of mines is 7,054. In the United
States the corresponding numbers were 10.27 percent and 13,904 mines [24] (numbers
from 2000). Using these numbers as a basis, the total number of mines in the world
would be 135,384~247,509 mines. An educated guess is somewhere around 100,000–
150,000 mines.
Not all mines have their own mineral processing units at the site. Especially in situa-
tions where there are many small mines quite close to each other, it is smart to concen-
trate the mineral processing to only one location. The amount of mineral processing
plants is half or less of the total amount of mines.
2.1.1.1 Underground vs. surface mine
With similar conditions, a surface mine is usually preferred to an underground mine due
to lower development costs, quicker start-up time, and lower accident rates [25, pp.
341–42]. Factors that influence the decision between these two mine types are dimen-
sions of the deposit and ore recoveries and revenues. Nowadays environmental and so-
cial issues also have a strong influence on the site permissions of a mine. Due to envi-
ronmental effects, obtaining a permit for an open pit mine may be complicated. Quite a
common procedure is also that a mine is built up as an open pit and later developed to
an underground operation.
The larger portion of mines worldwide are surface mines. When examining the under-
ground metal and coal production in the USA during the years 2003–2007 [25, pp. 341–
342], it can be noted that in 2007 less than 10% of the mines were underground mines.
With coal mines the tendency for underground extraction is higher (30.68%) than with
metals (1.27%) and non-metals (3.61%). Global numbers are very similar. For example,
one of the world’s largest mining companies, Vale [26, pp. 27,34,47–50], has 43 mine
sites of iron, copper, coal and phosphate, of which 83% are surface operations. From the
mines located in Brazil [3], 99% are surface mines. Coal India [27, p. 36], a company
producing only coal, has more underground mines; from 429 mines 55% are under-
ground or mixed operations and the remaining 45% are surface mines. A rough estimate
is that 70–80% of all mines are surface operations, and 20–30% mixed or underground
mines. In the future mines the ore must be recovered deeper [18, p. 6], and therefore it
can be assumed that the number of underground mines will only increase in the future.

6
2.2 Mining sectors
One way to classify the mining sectors is the division into iron and ferroalloy metals,
non-ferrous materials, precious metals, industrial minerals, and mineral fuels. Figure 2
presents the world production of minerals in different mining sectors in 2012 (natural
gas and petroleum excluded). The largest portion of world’s minerals production is in
mineral fuels (77%), and the highest production of metals is in iron and ferroalloy met-
als (15%). The third most produced mineral is industrial minerals (7%). Non-ferrous
and precious metals together cover only one percent of the world production [1, pp. 38–
39].
Figure 2. World production of minerals in 2012 [1, pp. 38–39] (natural gas and petro-
leum excluded).
Figure 3 shows the same mining sectors when inspecting their market value from statis-
tics provided by Index Mundi [28] in June 2014. To simplify the framework, from each
sector a highly produced material according to Reichl et al. [1] is chosen; for ferrous
metals the price of iron is examined, for non-ferrous metals the prices of aluminum and
copper (an average of the two), for precious metals gold, for industrial minerals phos-
phate, and for mineral fuels coal. Industrial minerals and iron have quite similar figures
in both graphs. The largest difference is with mineral fuels and non-ferrous and precious
metals. The market value of mineral fuels is clearly smaller than their production value.
On the other side there are non-ferrous metals and precious metals, which have a high
market price compared to the production rate.
15%
1%
0.0003%
7%
77%
Iron, Ferroalloy Met. Non-Ferrous Metals Precious Metals
Industrial Minerals Mineral Fuels

7
Figure 3. Estimated market value of the mining sectors: World production numbers are
from 2012 [1] and the price estimations from June 2014 [28] (natural gas and petrole-
um excluded).
2.3 Average mine
There are hundreds of different minerals in the world with different properties; easily
mined soft minerals as sand and gravel or harder minerals like metal ores. In addition,
the environment and grade of the same mineral can vary, from underground extraction
to the surface, and from abundant to a very low grade [29, p. 933].
As a framework for defining the average size of a mine, the production numbers of
some of the largest mining companies in the world [30], and additionally some other
mine sites, are used. A separate inspection is done to all five mining sectors presented in
Chapter 2.2. A detailed Table of mine sites is found in Appendix B. The production
numbers are presented in the scale which is common for the mineral in question; indus-
trial minerals, iron and mineral fuels are in mega tonnes, precious metals are given in
ounces, diamonds are given in carats and the production of other metals than iron are
presented in kilo tonnes. A higher emphasis is given to coal and iron. Iron mining is
also more carefully examined in the case studies of this thesis.
2.3.1 Global production of coal
Mineral fuels are the largest group in mining, even when oil and natural gas are exclud-
ed from the investigation. The mineral fuels group includes coal in different forms
(steam coal, hard coal, coking coal, and lignite) and uranium. The percentage of urani-
um in mineral fuels is only 0.0009%, so in reality this sector mainly includes coal. The
11%
36%
0.004%
7%
46%
Iron, Ferroalloy Met. Non-Ferrous Metals Precious Metals
Industrial Minerals Mineral Fuels
Calculations have been made using the world price in June 2012. The following prices where used: Non-ferrous metals: Aluminum and copper Precious Metals: Gold Industrial Minerals: Phosphate Mineral Fuels: Coal

8
world’s largest coal producing countries are China, USA, India, Australia and South
Africa [1, pp. 45, 175–177].
Coal is mined by both surface and underground methods. The choice of method de-
pends mainly on the geology of the coal deposit. For example in Australia, the amount
of surface mines is large (80%) while in USA it is a little bit smaller (67%) [31]. The
grade of the coal is measured with its ability to create energy, also known as the Calorif-
ic value (CV) [32]. Different coals are mainly used in power generation, steel manufac-
turing, and industrial uses [33].
The world’s largest coal mine is found in Wyoming, USA [34]. North Antelope Ro-
chelle mine had the annual production of 108 million tonnes in 2012. Other large coal
mines are found in China, Mozambique, Australia, Russia and Colombia [34]. Figure 4
lists the annual production in the year 2013 for 50 coal mines. The mines are owned by
large mining companies, Vale [26, p. 34], Shenshua Energy [35, p. 18], Rio Tinto [36,
p. 212], BHP Billinton [17, p. 48] and Anglo American [37, p. 251]. After the mine’s
name the country of location is presented by using the country codes provided by stand-
ard ISO 3166 [38]. CN stands for China, AU for Australia, US for USA, MZ for
Mozambique, ZA South America, ID Indonesia and CO for Columbia. More detailed
information about the selected mines can be found in Appendix B. The annual produc-
tion of an average coal mine in this list is 10.3 Mt, and the median is 8.2 Mt. Under the
line of average are listed 32 mines and above 28 mines. Since the deviation from the
average is quite large, (standard deviation 8.4 Mt), it can be assumed that the median
provides a better view.
When the total production of these 50 mines is compared to the global total, [1, p. 177],
it can be noticed that they cover only seven percent of the world’s production. Especial-
ly in the developing countries there are still many small mine sites. The emphasis is,
however, towards efficient mass production. All the large mines in this inspection are
Chinese mines. It can be assumed that there are many more very large mine sites in
China as well as in other large coal mining countries. There is no data available of the
third largest coal producer, India, but the annual report of India’s largest coal producer
Coal India (80% of India’s coal production) states that their annual coal production is
462.4 Mt, and the total amount of mines is 429 [27, p. 36]. These numbers indicate that
an average Indian coal mine has an annual production of only 1.1 Mt.

9
Figure 4. Annual production of selected coal mines in 2013 [17, p. 48][35, p. 18][36, p.
212][37, p. 251].
1.0
1.1
1.6
2.0
2.0
2.4
2.6
3.1
3.4
3.7
3.8
3.9
4.0
4.2
4.4
4.5
5.0
5.4
6.5
6.7
6.9
7.0
7.5
7.9
8.2
8.2
8.3
8.3
9.0
9.1
10.0
10.6
10.3
10.9
11.0
11.8
12.4
13.6
14.7
14.8
16.3
16.4
17.1
18.0
18.8
27.1
30.5
30.8
31.4
34.7
Daunia, AU
Chaijiangou Mining, CN
Benga,MZ
EMM Indonesia, ID
Isaac Plains, AU
Integra Coal, AU
Kestrel Coal, AU
Carborough Downs, AU
Poitrel, AU
Drayton, AU
Moatize, MZ
Liuta Mine, CN
Dawson, AU
Mount Thorley, AU
Cuncaota No 2 mine, CN
Cuncaota No 1 mine, CN
Gregory, Joint…
South Walker Creek, AU
Navajo, US
San Juan, US
Saraji, AU
Hail Creek Coal, Met, AU
Wulanmulun, CN
Illawarra Coal, AU
Median
Bengalla, AU
Wakworth, AU
Baotou Energy…
Baode, CN
Peak Downs, AU
Cerrejón, CO
Khutala, ZA
Average
Wanli No.1 mine, CN
Shigetai, CN
Clermont, AU
Goonyella Riverside, AU
Hunter Valley, AU
Shangwan, CN
Halagou, CN
Middleburg, ZA
Bu'ertai, CN
Yujialiang, CN
Mt Arthur, AU
Beidian Shengli…
Bulianta, CN
Ha'erwusu Branch, CN
Heidaigou, CN
Shenbao Energy , CN
Daliuta-Huojitu, CN
0.0 10.0 20.0 30.0 40.0
Annual production, Mt
Average: 10.3 Mt/year Standard Deviation: 8.41 Mt Median: 8.23 Mt/year

10
2.3.2 Global production of metals
As Figure 2 illustrated, metals cover less than one fifth of the total minerals production.
The global importance of metals is, however, larger industrially and in everyday life. In
this Chapter, the global production of each metal group is studied: iron and ferroalloy
metals, non-ferrous metals, and precious metals.
2.3.2.1 Iron and ferroalloy metals
Iron and ferroalloy metals are clearly the most highly produced metals in the world. The
majority in this group are iron mines, but other significant ferroalloy minerals are for
example chromium, manganese, nickel and titanium [1, p. 43]. Iron is usually found in
iron oxide ores [39, p. 1]. The most significant iron containing minerals are magnetite,
hematite, goethite and limonite. Iron can be found almost in every country in the world,
but places where mining is economically profitable are not so many. For iron to be cost-
effectively mined, the grade should be 60% iron. However, in China and Russia ore
with a grade as low as 30% is mined [40, p. 2]. Most iron deposits are surface mines,
but there are also underground iron mines [39, pp. 1–2]. The largest iron producing
countries are China, Australia and Brazil, which together produce 70% of the world’s
iron ore [1, pp. 95–96]. The world’s four largest iron mines are all situated in Brazil
[41].
Figure 5 displays the annual production of the year 2013 for 36 iron mines, whose pro-
duction together exceed 50% of the world’s iron production [1, p. 53]. As in the inspec-
tion for coal mines (Chapter 2.3.1), the location of the mine is presented after the name
with the international country code [38]. In addition to the previously presented codes,
BR stands for Brazil, SE for Sweden and CA for Canada. The listed iron mines are
owned by BHP [17, p. 48], Vale [26, p. 27], Rio Tinto [36, p. 213], Anglo American
[37, p. 251], and LKAB [42, p. 96]. From the figure it can be noted that as with coal
mines, the sizes of iron mines vary quite a lot from small production (less than one mil-
lion tonnes annually) to very large (over 60 million tonnes a year). When from these
mines the average sized mine is calculated, the annual production would be 18.1 Mt and
the median 13.9 Mt. The standard deviation of the iron mine sizes is 14.8 Mt. There are
ten quite small mines with an annual production less than 10 Mt and four extremely
large mines with an annual production of over 50 Mt a year. Due to the lack of infor-
mation, mine sites in the largest iron producer country, China, are excluded from this
examination. Considering the decreasing trend in iron prices [43] and the fact that ore in
China has a lower grade than in other iron producing countries [44], it can be assumed
that the size of iron mines in China is large rather than small.

11
Figure 5. Annual production of selected iron mines in 2013 [17, p. 48], [26, p. 25], [36,
p. 213], [37, p. 251], [42, p. 96]
0.0 10.0 20.0 30.0 40.0 50.0 60.0 70.0
Thabazimbi, ZA
Mt Goldsworthy Yarry, AU
Urucum, BR
Mar Azul, BR
Agua Limpa, BR
Corumbá, BR
Gonco Soco, BR
Abóboras, BR
Córreco do Feiao, BR
Tamanduá, BR
Jangada, BR
Capao Xavier, BR
Fazendao, BR
Capitao do mato, BR
Hamersley, Eastern Range, AU
Kolomela, ZA
Hamersley Channar, AU
Segredo, BR
Fábrica Nova, BR
Median
Iron Ore Company, CA
Alegria, BR
Caue, BR
Hope Down, AU
Conceicäo, BR
Average
Sapacado, BR
N4E, BR
Robe River, AU
Samarco, BR
Hamersley Iron, Nammuldi, BR
Kiruna, SE
Brucutu, BR
Sishen, ZA
N4W, BR
Mt. Goldswothy Area C, AU
N5, BR
Newman, AU
0.6
1.3
2
4.2
4.4
4.5
4.7
5.4
5.8
6.7
6.9
9.2
9.3
9.9
10.1
10.8
11.0
12
12.5
13.9
15.4
15.8
15.9
16.9
18.1
18.4
19
19.9
20.8
21.8
22.2
25.3
28.7
30.9
31.3
52.6
53.6
62.4
Annual Production Kt
Average Production 18.4 Kt/year Standard Deviation 14.81 Median: 13.9

12
2.3.2.2 Non-ferrous and precious metals
The most abundantly mined non-ferrous metals are aluminum, copper, zinc, and lead.
The most common precious metals are silver and gold [1, pp. 43–44]. The mine sites of
non-ferrous and precious metals are globally spread to all continents, and both surface
and underground operations occur. Underground operations require more investments,
but especially with precious metals if the size of the recovery is reasonable, there is a
high probability for a profitable operation. Many metal mines do not produce only one
metal but on the side a few or many ores are mined. It is quite common that as by-
products of copper mines, gold and silver are mined, and likewise. Pyhäsalmi mine,
producing copper, zinc, and sulfur [45], is an example of a diversified mine operation.
For defining the average non-ferrous metal mine, the production in the year 2013 for 50
mine sites around the world is studied. For precious metals the production in 2013 for
25 gold mines is examined. Information about the mines is provided by mining compa-
nies BHP [17, p. 47,49], Norilsk Nickel [18, pp. 34–35], Vale [26, pp. 47–49], Rio Tin-
to [36, pp. 212–213], Anglo American [37, pp. 252–253], Glencore Xtrata [46, pp. 56–
57], First Quantum Minerals [47, p. 11,12,16], Barrick [48, pp. 39–46], Newmont [49,
p. 27], Teck [50, p. 43], and Goldcorp [51]. From the 50 non-ferrous metal mines exam-
ined, the type of 43 is known: 26 were surface mines, 10 underground operations, and 7
seven mixed mines. With precious metals the corresponding numbers are 20, 3 and 2.
In the non-ferrous metals group, mines that mainly produce copper, nickel, aluminum,
and zinc are included. An average non-ferrous mine produces 2123 kt annually. The
median is 105 kt and the standard deviation 4996 kt. Mines and sites in this group have
the most variation; large mines have the annual production of over 25,000 kilo tonnes,
when small mines have an annual production of only a few kilo tonnes. The largest
mines mainly produce bauxite and the small mines nickel or copper.
For defining the size of an average precious metal mine, gold mines located in Austral-
ia, North- and South America and Africa are studied. The annual production of precious
metals is commonly announced in ounces. Similarly with non-ferrous metals, the devia-
tion in size is large. The standard deviation is 318 kilo ounces (9.0t) and the average
production is 283 thousand ounces (8.0 t). The median of the examined gold mines is
155 thousand ounces (4.4 t).
2.3.3 Global production of industrial minerals
Industrial minerals are minerals that are mostly used as feedstock for other industries
[52, p. 1]. The most common or valuable industrial minerals are industrial salt, gypsum,
sulphur, and diamonds [1, p. 44].

13
For defining an average industrial mineral mine, the annual productions from 2013 or
2012 (OCP) from some potash, phosphate, salt, and diamond mines owned by Vale [26,
pp. 49–50], Rio Tinto[36, p. 213], PotashCorp[53, p. 62] and OCP[54, p. 16] are exam-
ined. Industrial mineral producers do not give out as much information about separate
mines in English as the other mineral producers do, so the amount of mines studied is
smaller than in the other sections. From the batch of 22 mines, similarities to earlier
inspections can be noted. The size of the mines varies a lot from very small to very
large. Since the price of industrial minerals is not that high, the annual production rates
of even the smallest mines are higher than for example for precious metals. Due to this
reason it can also be assumed that the trend in mine size is increasing. An average in-
dustrial mineral mine has an annual production of approximately 2.9 Mt. The median is
1.9 Mt and the standard deviation 4.0 Mt. With diamond mines the production numbers
are a lot smaller than with other industrial minerals. Since annual productions are meas-
ured in carats (ct), it is rational to inspect diamonds separately. Seven diamond mines
were examined. The average annual production is 6200 ct, the median being 3345 ct,
and the standard deviation 7702 ct.
2.3.4 Summary of the average mines
Table 2 summarizes the average productions, medians and standard deviations of all six
mine types examined in this Chapter. The results indicate that defining one global aver-
age mine is not advisable. However, the inspection of the magnitude of an average mine
for each mine type can be made, even with such a restricted sampling. Common to all
inspections is a large deviation in mine sizes. Coal mines, iron mines and industrial
mineral mines (excluding diamonds) are generally large mines, whereas other metal
mines or diamond mines are significantly smaller. In all mine types there are also very
small operations. In addition, as concerns the really large numbers, there is a possibility,
that in the annual reports the production of many mine sites together are announced.
Table 2. Summary of average sizes of different mine types.
Mine type Average production ( year) Standard deviation Median
Coal mines 10.3 Mt 8.4 Mt 8.23 Mt
Iron mines 18.4 Mt 14.8 Mt 13.9 Mt
Non-ferrous metals 2123 kt 4996 kt 105 kt
Precious metals 8.0 t 9.0 t 4.4 t
Industrial minerals 3.0 Mt 4.0 Mt 1.9 Mt
Diamonds 6200 ct 7702 ct 3345 ct
2.3.5 Operational lifetime of a mine
The lifetime of a mine can roughly be divided into four stages: exploration, mine devel-
opment, mine operation, and mine closure [55]. All stages last for several years and

14
must be thought of when planning a mine operation. In this thesis the concentration is
merely on the mine’s operation stage.
The operational, also known as the production, stage can vary from a few years to hun-
dreds of years. Generally it is not profitable to build up a mine in a location where the
resources are poor, but exceptions occur [19, p. 14]. If a really small mine operates in
the surroundings of a large mine it can profit from the infrastructure of this mine and be
profitable even if not very productive. The lifetime of the mine does not only depend on
the production rate and grade of ore, but also the politics and environmental issues have
an important role [19, p. 14]. A mine might run out of operational permits before pro-
duction would end, or the world price of the product may change in a way that it is not
profitable to produce anymore In some sites, for example in Australia, it is common that
smaller mines are only operating in an uptrend period and in the downtrend they are
closed [56].
Figure 6 presents the estimated operational lifetime of some mines, whose production
was earlier under inspection. The annual reports of BHP [17, pp. 26–45] and Vale [26,
pp. 60–68] provided information of when the operation was started and when is it esti-
mated to end. From these figures the estimated operational lifetime of a mine was calcu-
lated. After the mine’s name, also the main product is listed. The mines marked with
yellow are iron mines (Fe), black ones produce coal (Coal), brown phosphate (Ph) and
blue other metals such as copper (Cu) or nickel (Ni).
As with the production rate, the deviation between mine lifetimes is quite large, varying
from seven years to 154 years of production. The average lifetime of a mine is 45 years,
having a standard deviation of 47 years. The median is 39 years. There are not many
mines with a really low life expectancy. Normally production for less than 10 years is
not very profitable to set up. On the other hand, mines with the life expectancy of over
100 years are not so numerous, either. The mine sites found in the 21st century have
lower life expectancy than the ones found in the 20th
century. It is reasonable to believe
that such deposits, which would produce for over 100 years are not very easily found
anymore. The operational lifetime of future mines is most likely between 20 and 40
years.

15
Figure 6. The estimated lifetime of selected mines [17, pp. 26–45], [26, pp. 60–68]. The
mines marked with yellow are iron mines black ones produce coal, brown phosphate
and blue other metals such as copper or nickel.
7
11
14
16
17
20
20
21
25
29
31
32
33
35
35
37
38
38
39
40
43
44
44
45
45
46
46
53
60
61
65
65
68
68
72
72
105
154
0 50 100 150 200
Jangada, Fe
Isaac Plains, coal
Capao Xavier, Fe
Agua Limpa, Fe
Voisey Bay, Cu
Sossego, Cu
Red Dog, Zn
Mt. Keith, Ni
Urucum, Fe
Brucutu, Fe
Moatize, Coal
VNC, Ni
Alegria, Fe
Fábrica Nova, Fe
Bayóvar, Ph
N5, Fe
N4W, Fe
Araxá, Ph
Median
Integra Coal, coal
Leinster, Ni
Segredo, Fe
N4E, Fe
Average
Tamanduá, Fe
Abóboras, Fe
Caue, Fe
Salobo, Cu
Cerro Matoso, Ni
Capitao do Mato, Fe
Cataláo, Ph
Cajati, Ph
Conceicäo, Fe
Sapacado, Fe
Thompson, Cu
Fazendao, Fe
Samarco, Fe
Sudbury, Cu
Estimated lifetime of the mine, years
Iron Mines Coal Mines Phosphate Mines Other Metals Average & Median Average 45 years Median 39 years Standard deviation 47 years
16
2.4 The main operational categories in mining
The mining process from extraction of ore to a processed mineral is different depending
on the geography of the mine site, the material mined, the level of the grade, etc. The
basic route, however, is similar in all mining operations. The mining process can rough-
ly be divided into three different stages: extraction, haulage and processing [24], [39].
The functions in extraction are drilling and blasting and depending on the mine type,
topsoil and overburden removal (surface mines) or underground crushing and loading
(underground mines). Haulage means the forms of transportation with equipment like
trucks, skips and conveyors. Processing differs a lot depending on the material mined.
Coal or industrial minerals are hardly processed, while for example copper goes through
many processing stages [57]. All operations require supporting activities, which are for
example dewatering and road maintenance [58, p. 9]. Underground mining operations
also require for example ventilation and backfilling [59, p. 13]. In this study extraction
in surface and underground mines is examined separately, and haulage and processing
together for both mine types. Figure 7 presents the route of iron from ore to the product
in both surface and underground operations [39, p. 7]. Next to each operation, the com-
mon equipment used is listed [24, p. 9].
2.4.1 Extraction
The basic functions of extraction are drilling, blasting and digging, and as supporting
operations pumping and dewatering [24, p. 9]. Significant factors in choosing the most
suitable mining method are the hardness and rate of production of the ore [25, p. 357].
Ores that cannot be mined by mechanical mining machines are called hard rock ores.
Most metals are in this group. Soft rocks are, for example, coal, oil shale, salt, and pot-
ash [23, p.377]. In this Chapter, some of the most common surface and underground
mining methods are briefly introduced.
2.4.1.1 Surface mining methods
The two most common surface mining methods are open cut mining and strip mining
[25, pp. 362–365]. In open cut mining the ore body is removed in slices with large rope
shovels, hydraulic shovels or excavators. For soft rocks, continuous excavation without
drilling and blasting can also be used. In strip mining, the overburden is removed in
long strips so that the ore body can be revealed. The strips are moved straight into a
previously mined void. This method requires the ore to be close to the surface, as often
is for example with coal.

17
Figure 7. Underground and surface mining processes of iron and typical equipment
used in different operational categories, modified from [24, p. 9],[39, p. 7].
2.4.1.2 Underground mining methods
Underground mining methods can be divided into three main groups: caving, stoping,
and other methods [25, pp. 366–367, 381]. The caving methods are based on controlled
collapse of the rock mass due to gravity, while in stoping the extraction requires stable
tunneling. Caving methods are block caving, sub-level caving, and longwall mining. In
block caving large low-grade ore bodies can be removed practically as complete blocks.
In sublevel caving ore is partly drilled and blasted and just the overburden is caved by
gravity. Longwall mining is a technique where the material is excavated in slices with
shearers and then conveyed to the surface. In stoping methods a stable void is excavat-
ed, which is then filled with material such as tailings or overburden. The most common
stoping method is the room and pillar method. As the name implies, only pillars in a
regular pattern are left in the cave, while the rest of the ‘room’ is mined. The ore is then
excavated laterally so that no drilling and blasting is required. Other underground min-
ing methods are new methods or innovative combinations of the previous ones devel-
oped to match the unique requirements of some mine sites. An example of such meth-
ods is coal seam methane drainage, which utilizes the physical properties of coal.

18
2.4.2 Haulage
Haulage is required in each step of mining; the ore or overburden is transported from
one stage to another, ore is lifted to the surface, etc. [60, p. 1457].The most adequate
hauling technique depends on the mining method, distances and geographies in the mine
site as well as the abundance of ore resources. Commonly used haulage equipment, are
haul trucks, conveyor belts, and hoists, such as draglines or skips. Haulage also includes
rail road and marine transport of the processed mineral. In this thesis only the haulage
inside the mine site is considered.
2.4.2.1 Haul trucks
The amount of material hauled with loaders and truck haulers is more than with all other
extraction systems combined. The size of haulage equipment has increased drastically in
the last decades. In 2008 an average truck in an open pit mine had the capacity of 160
tonnes [19, p. 15].The type and size of the hauler depend on the haulage distance and
the quantity of the material. With short distances from a few to 120 meters, it is advisa-
ble to use a truck dozer, which only pushes the material to the following site, or load
and carry equipment such as wheel loaders or hydraulic shovels and mining shovels [29,
pp. 912–913,919]. With distances over 120 meters, scrapers or articulated and rear-
dump trucks are used. Articulated and rear dump trucks have both on-highway and off-
highway applications, of which the on-highway is not commonly used in mines due to
lower productivity. The off-highway rigid-frame trucks are the primary hauling ma-
chines used in mining, with the capacity of 80–325 tonnes. For haulage distances of
over ten kilometers haulage wagons are usually used [29, pp. 919–921].
Similar haul trucks are used in both underground and surface mining. In underground
mining, however, the circumstances create some limitations. For underground haulage,
adapted applications of rear-dump and articulated rear-dump trucks are most commonly
used. In underground applications, more than in surface mines the proper ventilation,
road maintenance and the optimum cycle must be considered so that the productivity is
high and there is no unnecessary traffic in the often narrow roads [29, p. 1149].
The haulers move either with chains or with tires. Tires have a better mobility than
chains, but on the other hand, the tires are very liable to wear. A haul truck experiences
resistance to motion due to friction, which is called rolling resistance. The main con-
tributors to this resistance are the road conditions, the wheel load, and less significantly
tire flexing and internal friction [29, p. 914].
2.4.2.2 Conveyor belts
The use of conveyor belts in mining haulage has increased in the last decades. The capi-
tal costs between haul trucks and conveyor belts depend a lot on the application, but in

19
use the conveyor belts are more cost efficient and require less labor and energy. When
the production exceeds 1,000,000 t/year, the haulage distances are more than 5 km, the
vertical lift is more than 250 meters, and the operation can be expected to continue for
at least 7-8 years, it is advisable to build a conveyor belt system. The standard style
conveyor belts are sheet belts supported with idler rolls. In applications where there are
tighter curves, pipe conveyors or a sandwich belt consisting of two separate belts or a
pocket lift application can be used [29, pp. 982–984]. The length of a conveying system
can vary from some meters to over 20 kilometers [61].
2.4.2.3 Draglines and skips
Draglines are used in sites of flat geology for transporting load, usually overburden, to a
dump point. They are productive, have a life expectancy of over 30 years, and have low
operating costs and requirements for labor. The possible scale of work of the dragline is
50 meters over and 65 meters under the working level, and the buckets have a capacity
of 125 m3. The efficiency of the dragline depends on the ore’s material composition and
production variability. As an average efficiency factor, 70% of the loaders full capacity
is used [29, pp. 903–904,910].
A similar hoisting system can be used also in underground applications. For example
the LKAB Kiruna Iron mine [62, pp. 4–5] and First Quantum Minerals Pyhäsalmi cop-
per mine [45, p. 60] use skips to carry the primary crushed rock to the surface. In Py-
häsalmi, one hoist can carry 20 tonnes and in Kiruna 40 tonnes. The skip is powered by
an electric motor.
2.4.3 Processing
Minerals processing means upgrading and recovering metals or minerals from ores and
transforming them to their purest form. Processing includes many different kinds of
fields of science and engineering, which makes it a complicated stage in mining also
from the point of view of wear. The stage of processing depends a lot on the mineral;
coal or industrial minerals are not processed much, while for example precious metals
require several stages of processing. The efficiency of a metallurgical process is de-
scribed with two concepts, recovery and grade. Recovery means the amount of valuable
material achieved in the concentrate, and grade is the purity of the material. It is im-
portant to obtain an optimum balance between these two. High recovery with low grade
is not desired [60, p. 1455]. The operational efficiency of the processing units is com-
monly very high, reaching 85-90% [56],[63]. Processing can roughly be divided into
two phases; comminution and concentration. The Mining Engineering Handbook [60,
p. 1457] further classifies processing operations to size reduction, size separation, con-
centration, dewatering and aqueous dissolution.

20
2.4.3.1 Comminution
Size reduction and separation, crushing and grinding the ore are also known as commi-
nution. This process has three reasons: to liberate valuable minerals from the ore matrix,
to increase the surface area for higher reactivity, and to facilitate the transport of the ore
particles between operations. Depending on the material, the comminution circuit has
from a few to several stages which, depending on the source, are named as crushing or
milling. Most commonly the comminution circuit has at least two stages. Table 3 pre-
sents the most common unit operations for different milling stages and the average size
of feed material in each operation [15, p. 1461-62]. The percentage of the indicated size
is presented in the suffix. For example, f80 means that 80% of the feed material must be
of the given size.
Table 3. Unit operations for the stages of comminution, modified from [60, p. 1462] f
presents the percentage of the feed of the material in a given size.
Milling stage Typical top size
(mm)
Common unit operations
ROM f100=10000 Primary crusher(gyratory/jaw)
Secondary pre-crush
Primary f100=250
f80=50-100
AG/SAG/pebble crusher circuit
2nd/3rd/4th crushing circuits
Crusher/ HPCG- circuits
Secondary f100=13 Ball mills
Pebble mills
Tertiary Nominally 0.2 Ball Mill
HPGR
Vertical shaft mills
Horizontal shaft mills
Primary crushing
The aim of primary crushing is to reduce the size of the run-of-mine (ROM) material for
further haulage and processing. In underground operations primary crushing is usually
done below the surface in order to minimize the energy consumption in haulage [20, p.
11]. The diameter of the material fed to the crusher is usually between 100 and 1,000
millimeters. For primary crushing, jaw crushers and gyratory crushers are the most
commonly used, of which the gyratory crusher is used when feed material input is 1,000
t/h or higher. The jaw crushers are used with lover material input. The crushers can be
permanently located, semi-mobile or mobile. Factors affecting the choice of a crusher
are: the cost of truck haulage against the cost of the mobility of the station, feeding the
crusher, and conveying the crushing product. When crushers are fed with direct truck
dumping, the method is simple but might contain long waiting times, which decrease
the crusher’s utilization rate. With an apron feeder the crusher can be partially discon-
nected from truck dumping, which decreases truck queues and increases the utilization

21
rate. However, more equipment creates capital and maintenance costs in the mine [60,
pp. 1461–1463].
Secondary crushing/ primary milling
When the top size reduces, a different kind of comminution method is used. The autog-
enous/semi-autogenous mills (AG/SAG mill) are widely used for grinding due to their
ability to comminute the widest range of size (from a diameter of over 100 to 0.1 mm).
The comminution is done through impact, attrition, and abrasion breakage of the ore
serving as media. In autogenous mills the grinding is done by the ore, while in semi-
autogenous mills particles are added to aid the comminution [60, pp. 1471–72]. The
commonly used grinding media are forged steel balls. Together with the AG/SAG mill a
pebble crusher is often used instead of directly recycling the oversized material. Pebble
crusher increases the costs and complexity of the circuit, but on the other hand, it can be
used for bypassing the crusher(s) during maintenance. The aim in all comminution pro-
cesses is to maintain the stockpile size reasonable, which means that the possible
maintenance as well as the load and haul of the material must be thought of in the cir-
cuit planning [60, pp. 1466–68].
Tertiary and quaternary crushing/ secondary and tertiary milling
After secondary crushing and grinding, high pressure grinding rolls (HPGR), cone
crushers, ball mills or pebble mills are commonly used. The HPGR are used especially
with hard minerals. They require more energy than for example cone crusher units (5
MW compared to 750 kW), but the final product is finer than in other milling applica-
tions, and the increased efficiency of the whole plant decreases the number of required
material handling units [60, p. 1469].
2.4.3.2 Concentration
In concentration the physiochemical properties of the minerals are exploited to separate
the ore. Different methods of concentration are flotation, gravity concentration, and
magnetic and electrostatic concentration [60, p. 1457].
Flotation
In flotation, air bubbles which collect hydrophobic particles are generated on the surface
of the aqueous slurry formed of oil water and minerals. Flotation is a very common pro-
cessing method, especially for metals. The hydrophobic effect is created with polariza-
tion, and the effect can be increased with addition of chemicals. The particles that re-
main completely wetted stay in the solution [60, p. 1517].

22
Gravity concentration
In gravity concentration the different densities of minerals are utilized, i.e., heavy min-
erals are separated from the lighter gangue. Separation can be done either with relative
or absolute gravity separation. In relative gravity separation a large difference in the
densities is required, while in absolute gravity separation a gravity intermediate is used
so that the difference in densities does not need to be so large. In magnetic and electro-
static concentration, the electrical conductivity and magnetic susceptibility of the min-
erals are utilized [60, p. 1457,1507].
Dewatering and aqueous dissolution
Many of the minerals processing operations are conducted in aqueous solutions. With
the help of thickeners and filters, water can be separated from minerals. Metals can also
be separated from the ore by dissolving them [60, p. 1457].
2.5 Energy consumption in the mining industry
In this Chapter, the energy consumption in the global mining industry is examined.
First, the energy consumption and emissions of large mining companies are studied and
estimated how much energy is used in producing one tonne of ore. Second, the energy
distribution between operations of surface and underground mining is reviewed. From
the energy distribution between surface and underground mines, a summary is made and
compared to the global framework. As in earlier studies, the operations are divided into
extraction, haulage and processing. In addition to these three operations, the group of
supporting activities is examined.
2.5.1 Energy consumption of some large mining companies
The total energy consumption in the world in 2013 was 8979 Mtoe [10]. The share of
mining in the total consumption is approximately 5% globally[4]–[6], which corre-
sponds to 450 Mtoe or 18,840 PJ. Of the total global energy consumption, 65% is from
burning fossil fuels [10], the use of which is very common also in the mining industry.
In mining company Vale’s [60 p.80 ] production, the portion of fossil fuels was 70%,
and in BHP Billinton’s production [65, p. 25] 55% of the total energy use. The use of
fossil fuels is relatively higher in the developing industrial countries [10] such as China
and India.
In addition to the energy consumption, the mining sector is a large emitter of green-
house gases (GHG). The main sources for GHG emissions are combustion of diesel
fuels during mining activities and electricity generation [66][65, p. 26]. Norgate et al.
[67] suggest that even 50% of the GHG emissions in mining are due to the loading and
hauling operations. The emissions can be divided into direct and indirect emissions,

23
from which direct emissions are straight consequences of activities. These emissions
can also be divided into three different areas known as scopes: scope one includes all
indirect emissions, scope two indirect emissions from consumption of purchased ener-
gy, and scope three all other indirect emissions [68]. The GHG emissions are measured
with a carbon equivalent (CO2e), which evaluates the emissions according to their glob-
al warming potential [69].
Table 4 lists the annual energy consumption and greenhouse gas emissions of some
mining companies in 2013: BHP Billiton [17][65, p. 25], Vale [26][64, p. 79], Rio Tinto
(RT) [36] [70, p. 45], Anglo American (AA) [37, pp. 251–253][71, p. 17], Glencore
Xtrata (GX) [46, p. 13] and Freeport McMoran (FM) [72][73, pp. 14–20]. As additional
information, the geographical location as well as the main operations and main products
mined are reported. The GHG emissions are emissions of scope 1 and 2. The energy
consumption and GHG emissions are divided by the annual production in order to ob-
tain the corresponding number per produced tonne (pt).
Table 4. Energy consumption and GHG emissions of large mining companies [17], [26],
[36], [37, pp. 251–253], [46, p. 13], [64, p. 79], [65, p. 25], [70, p. 70], [71, p. 17], [72,
pp. 14–20], [73].
Company
Location of
main opera-
tions
Main
products
Produc-
tion
Energy
consumption
GHG emissions
(CO2e)
Mt/year PJ/year MJ/pt Mt/year Mt/pt
BHP
AU, ZA
Fe, Cu
(oil)
296 325
1097 22 0.16
Vale BR, AU Fe, 370 0.15 0.0004 14 0.04
RT
CA, EU, AU
Al, Cu, Fe
Di
301 483
1605 83 0.27
AA
ZA, AU, MZ
Fe, Cu,
Coal
131 63
477 9 0.07
GX
EU, US, CA
Cu, Ni,
Coal
250 285
1139 26 0.16
FM
US, CA
Cu Au
(oil)
296 98
1097 6 0.16
Table 4 indicates that both energy consumption and emissions of larger companies are
high. The total annual energy consumption of BHP Billiton and Rio Tinto corresponds
to 25–30% of the total annual energy consumption in Finland in 2013 [74]. When inves-
tigating the estimated energy consumptions/produced tonne it is noticed that the energy
consumption is very case dependent. For example, metals which require many stages of
processing (copper, precious metals, aluminum), also require more energy, while coal
operations cope with less. Also fewer large operations are more efficient than many
small. This is one of the reasons for the low numbers of Vale. Other reasons might be
that all of the company’s operations are surface mines and that the company produces a
24
lot of its own energy and the annual report reports only the bought energy. If Vale is
excluded from the study, the energy consumption/produced tonne varies from 477–1605
MJ/pt. Coal company Shenhua [35, p. 18][75, pp. 93–94] and gold company Barrick
[76] presented their energy consumption/produced tonne directly in their annual re-
ports. The number for Shenhua is only 1.38 MJ/pt while for Barrick it is 274 MJ/tonne
produced. In the American Bandwidth Study [24] the total energy consumption in min-
ing was reported to be approximately 2460 MJ/tonne of ore produced (2713 tons). The
greenhouse gas emissions of the mining companies vary from 6 to 83 Mt annually. As a
comparison, the GHG emissions of Finland where 64 Mt in 2012 [77]. The GHG emis-
sions per tonne produced vary from 0.04–0.27 Mt CO2e.
2.5.2 Energy distribution in surface mining operations
Figure 8 presents the energy consumption in different surface mining operations. The
numbers are obtained from a report comparing the energy use of several surface mines
made by Canadian Industry Program for Energy Conservation [58]. Figure 8 illustrates
all the individual operations and categorization to the main operations: extraction, min-
erals processing, haulage and supporting activities. To illustrate different categories the
following, colors are used in Figure 8: operations in red are a part of extraction, blue
indicates processing, green haulage, and purple supporting activities.
From the categories it can be noted that processing requires almost half of the total en-
ergy (49%), supporting activities and haulage both a fifth (19 and 21%), and extraction
only a tenth (11%). The largest individual energy consumer in surface mining opera-
tions is other processing (28.9%). This category includes the different kinds of concen-
tration processes described in Chapter 2.3.4. The second largest individual energy con-
sumer is grinding (16.1%). After processing operations, the largest energy consumer is
transport; waste rock transport (10.7%) and ore transport (8.5%).
2.5.3 Energy distribution of underground mining operations
Figure 9 displays a similar investigation for underground mines. The results are averag-
es based on the information provided by the report made by the Canadian Industry Pro-
gram for Energy Conservation [59]. As in Figure 8, the energy consumption percent-
ages of individual operations and the total energy consumption of the categorized
groups are presented. The colors used in the Figure 9 are the same as in Figure 8: opera-
tions in red are a part of extraction, in blue processing, green haulage, and purple sup-
porting activities.

25
Figure 8. Distribution of energy consumption in surface mining, modified from [58].
In underground activities, a large part of the energy consumption goes to supporting
activities; the most energy is consumed in ventilation (24%) and mill hydrating and
lighting (22.5%). In total, the supporting activities account for over a half (56%) of the
total energy consumption. When examining the actual mining operations, the results are
very similar to the surface mine numbers; the most highly energy-consuming operations
are the processing stages like separation, grinding, crushing, and filtration. The total
energies used in extraction (8%) and haulage (9%) are quite the same as in surface op-
erations.
5.35%
4.66%
5.03%
1.08%
4.33%
8.53%
10.66%
4.03%
16.09%
28.92%
1.12%
1.54%
2.12%
1.94%
0.83%
1.38%
2.39%
Tailings
Process water
Other plant
Dewatering
Mine support
Transport
Waste rock transport
Crushing
Grinding
Other processing
Waste rock drilling
Waste rock blasting
Waste rock digging
Waste rock handling
Drilling
Blasting
Digging
11%
49% 19%
21%
Excavation
Processing
Haulage
Supportingactivities

26
Figure 9. Distribution of energy consumption in underground mining, modified from
[59].
2.5.4 Energy distribution of a global mine
Table 5 summarizes the results of the two previous Chapters. The numbers for both sur-
face and underground mines are presented as percentages of energy consumption of
each operation as well as in the corresponding energy values in petajoules. On the bot-
tom line, the energy consumptions of these two operations are summed together and the
22.5%
1.0%
0.9%
24.0%
2.3%
2.0%
3.2%
5.0%
1.8%
1.8%
3.4%
8.4%
8.6%
6.2%
0.5%
0.6%
3.5%
4.4%
Mill hydrating and lightning
Mill support
Tailings disposal
Ventilation
Backfill
Dewatering
Other underground support
Hoisting
Transport to mill
Underground transport
Crushing
Grinding
Separation/flotation
Thickening, filtaration and drying
Underground crushing
Blasting
Mucking
Drilling
27%
9% 8%
56%
Processing
Excavation
Haulage
Supportingactivities

27
energy consumption of each operation in an average mine is estimated. As estimated in
Chapter 2.1, the number of underground mines or mixed mines represents one third of
the global mining industry. The total energy consumption of an underground mine is,
however, at least double of a corresponding surface mine. This means that the total en-
ergy is distributed more or less evenly between these two types of mines.
Table 5. Summary of the energy distribution in surface and underground mines[58],
[59].
Operations Total
energy
use
Extraction Haulage
Processing
Supporting
activities
PJ % PJ % PJ % PJ % PJ
Surface mine
(70%)
9400 11 1034 19 1786 49 4606 21 1974
Underground
mine (30%)
9400 9 846 8 752 27 2538 56 5264
Global aver-
age
18800 10 1880 13.5 2538 38 7144 38.5 7238
Table 5 indicates that in a global mine most of the energy is consumed in the supporting
activities and comminution processes. Transportation is a large energy consumer in sur-
face mines, but from a global point of view its fraction is relatively low, only 14%. Ex-
traction is the only operation, which is almost similar in both types of mines. The ener-
gy consumption of the comminution process has also been noted by Ziemski et al. [78],
who propose that the energy consumption of comminution (crushing and grinding) is as
high as 75% and that of flotation over 20% of the total energy consumption. The sup-
porting activities were not included in this study. The potential energy savings in min-
ing operations have been studied in the Swedish Smart Mine of the Future (MIFU) re-
port [20], as well as in a study of energy consumption of mining three metal ores, iron,
copper, and bauxite by Norgate et al. [67]. The MIFU report proposes that annual ener-
gy savings of 30% are possible, where the cutback in energy usage in ventilation is on
average 20%, in grinding 24%, and in haulage 18%. Norgate and Hague propose energy
savings of 50% in haulage, 23% in ventilation, and 71% in crushing and grinding. The
energy savings are obtained by improving the practices and energy efficiency of the
equipment.
2.6 Wear and friction in the mining industry
Wear and friction are strongly present in the mining industry. These phenomena are not
always negative but can also be used to advantage. This thesis, however, will be con-
centrating on the energy consumption caused by these two. In this Chapter, the types of
wear and friction most commonly encountered in the mining industry are presented.
Wear is usually classified by the dominant wear mechanism to abrasive, adhesive, tri-

28
bochemical and fatigue wear [79, p. 8], [80, p. 3]. Another classification method is by
the types of relative motion between the surfaces. The types of motion are sliding, roll-
ing, oscillation, impact, and erosion. Friction is defined as the encountered resistance
when one body moves over another. The types of friction are sliding and rolling friction
[50, p 22].
2.6.1.1 Adhesive and tribochemical wear
Adhesive wear occurs due to the formation and breakage of adhesive bonds. If the
strength of the adhesive bond is less than the strength of the attaching surfaces, the bond
can disintegrates from one or both of the surfaces. If the bond breaks off from both at-
taching surfaces, an extra particle is formed. This particle can act as an abrasive and
cause more wear. When the adhesive wear is only mild, the surface might be able to
protect itself with an oxide layer. When the adhesive wear is more severe, there is not
enough time for the oxide layer to form. The best ways to prevent adhesive wear are
lubrication and materials selection. In tribochemical wear the fragile layer formed by
the atmosphere and reactants suffers from wear. This type is also known as mild adhe-
sive wear and it occurs as long as the circumstances do not change [33, pp. 8–9,11].
2.6.1.2 Abrasive wear
Abrasive wear is the most common mechanism in mining; more than half of occurring
wear is abrasive. The most common abrasive wear modes are ploughing, cutting and
cracking [79, p. 9]. Ploughing occurs commonly with low wear rates and attack angles.
It is a typical mode for ductile materials. Cutting wear occurs with higher wear angles,
and the wear rates are also higher. Cutting wear occurs often in bars and facings of
grinding mills. Cracking occurs due to impacts on a highly stressed surface. This wear
mode is common for brittle materials. Cracking is found for example in sieves, slurry
pumps, and tools used to mold soft soil.
Abrasive wear can also be classified according to the ability of the abrasive particles to
move. When the particles can freely move between two surfaces, the situation is called
three-body abrasion. When particles for example rub against a surface and do not freely
move, the situation is called two-body abrasion. Commonly wear is more severe in two-
body abrasion, because in three-body abrasion a lot of the energy of the abrasives goes
to the movement between the surfaces. When investigating the resistance of a material
to abrasive wear, the most important factor is the relation between the abrasive and the
material exposed to wear. The hardness of the material also has an effect on the wear
resistance [79, p. 10].
2.6.1.3 Fatigue wear
Fatigue wear occurs due to repetitive cyclic loading. The released wear particles leave a
pit on the surface, which later develops into cracks. Fatigue can appear quite suddenly
and it often exists simultaneously with other wear modes. Fatigue occurs typically in
lubricated parts, such as gear wheels, bearings, and slug rolls [79, p. 11].
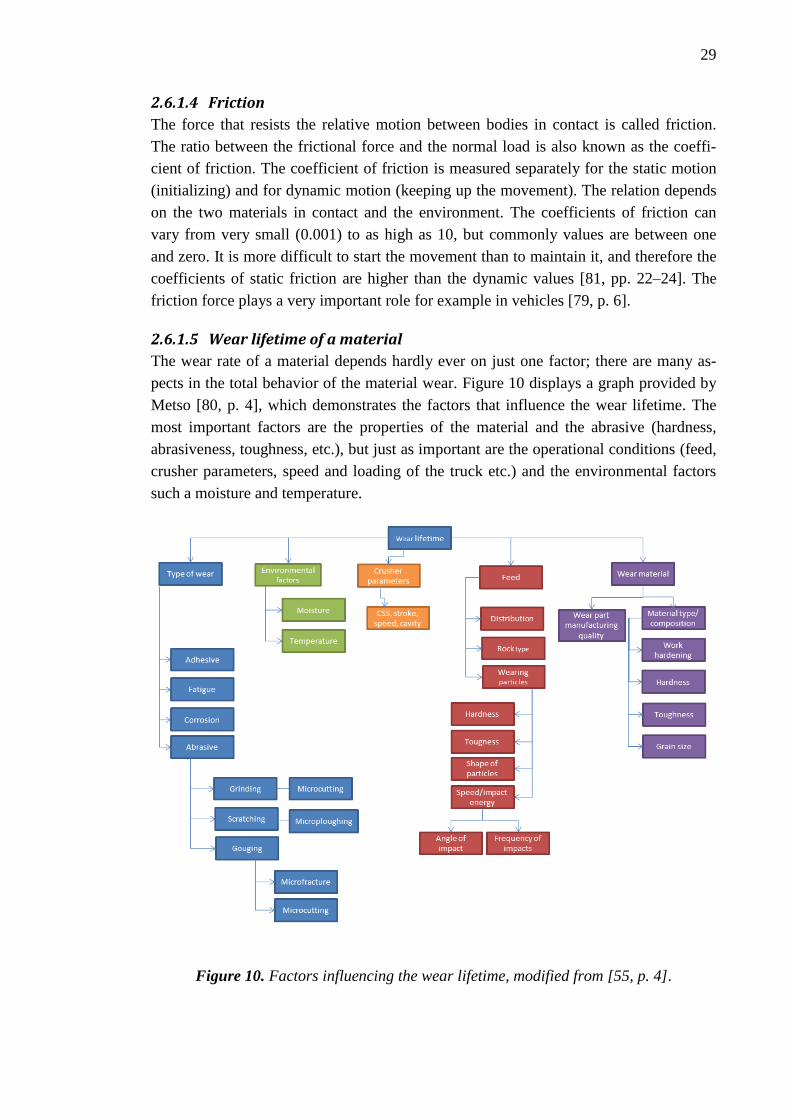
29
2.6.1.4 Friction
The force that resists the relative motion between bodies in contact is called friction.
The ratio between the frictional force and the normal load is also known as the coeffi-
cient of friction. The coefficient of friction is measured separately for the static motion
(initializing) and for dynamic motion (keeping up the movement). The relation depends
on the two materials in contact and the environment. The coefficients of friction can
vary from very small (0.001) to as high as 10, but commonly values are between one
and zero. It is more difficult to start the movement than to maintain it, and therefore the
coefficients of static friction are higher than the dynamic values [81, pp. 22–24]. The
friction force plays a very important role for example in vehicles [79, p. 6].
2.6.1.5 Wear lifetime of a material
The wear rate of a material depends hardly ever on just one factor; there are many as-
pects in the total behavior of the material wear. Figure 10 displays a graph provided by
Metso [80, p. 4], which demonstrates the factors that influence the wear lifetime. The
most important factors are the properties of the material and the abrasive (hardness,
abrasiveness, toughness, etc.), but just as important are the operational conditions (feed,
crusher parameters, speed and loading of the truck etc.) and the environmental factors
such a moisture and temperature.
Figure 10. Factors influencing the wear lifetime, modified from [55, p. 4].

30
2.6.1.6 Measuring the wear rates
There are basically three ways to measure the wear rate of a material. The first method
is to measure wear in the service with field tests. It is, however, difficult to assure that
the operational conditions and the wear rate stay stable. The second option is testing
only a few components in a controlled environment. The third option is to calculate the
wear rates with the help of theoretical equations [81, pp. 198–205]. A commonly used
equation is the Archard’s wear model, which calculates the volume loss as a function of
normal load, sliding distance, and hardness of the material [82]. Wear and friction can
both be slowed down with the selection of materials, change of the operational
conditions, and with the help of lubrication.
2.7 Maintenance and utilization rate
Maintenance is an important factor for efficient and sustainable production. The diverse
and complex equipment used and the different environments of mine sites bring chal-
lenges also for maintenance [83]. From the net costs of a mine operation the part of
maintenance is approximately 25% [84, p. 329]. Over half (51%) of the maintenance
costs go to the processing unit, 41% to the mine, and the rest (8%) to other operations
[84, p. 330].
The maintenance of a device can be divided into preventing, improving and interference
maintenance [84, p. 330]. The preventing, improving and other planned maintenance
together account for two thirds of the maintenance operations, while the amount of in-
terference maintenance is only one third [85]. The trend in maintenance is towards in-
creasing prevention and less interference maintenance. Maintenance costs can be divid-
ed into own labor, purchased materials, and subcontracted services [84]. The corre-
sponding numbers for mines/processing units are: salaries 32%/20%, materials
52%/46% and subcontracted services and materials 16%/34%. In the last ten years the
role of subcontracting has also increased in all operations, so this division might also
look a little bit different. The total costs of maintenance, however, have not decreased
[85]. Figure 11 presents the different forms of maintenance and the costs they cause.
A disturbance in some device can cause stoppage of the entire production. The mainte-
nance of these critical devices must be carefully planned in order to keep the total pro-
duction efficient. Many suppliers provide also programs that allow surveillance for ex-
ample of the wear of the grinding mill liners. The total cost of spare parts is on average
5-8% of the device’s repurchase price [86, p. 156]. The main maintenance costs are
caused by inspections or changing of wear parts such as loader liners or crusher jaws.
The most commonly used wear materials are steel and rubber; generally rubber is rec-
ommended with very small incidence angles and steel for medium angles [84, p. 340].

31
Figure 11. Maintenance operations and the costs they cause.
The requirements for maintenance for one tonne of ore recovered are in Finland on av-
erage 0.1h/t. [59 p. 334]. This would mean that for a daily operation of 10,000 tonnes
1,000 hours of maintenance is required. Mining service supplier Ventyx [83] proposes
that currently even 60% of the work force of a mine site actually work in the mainte-
nance sector.
The salary costs of maintenance include the actual salary of the employee, holiday re-
muneration, sick leave compensations, and other social costs such as the pension contri-
butions. The salary is influenced by the nature of the work, work-years, and extra com-
pensation for shift work. According to the collective agreement of the Finnish metal
workers union [61 p.29], the average salary in 2014 in the field of maintenance is 12.02
euros/h. The compensation for evening/night shifts is 1.15/2.11 euros/hour. Assuming
that one third of the shifts is done in the day, one third in the evening, and the last third
at night, the average salary is 13.15 €/h. The Finnish entrepreneurs [88] provide a coun-
ter to evaluate the costs of one employee; on average 30% of the salary must be added
as social costs. The hourly costs of maintenance are then approximately
13.15€+3.95€=17.1€. In this thesis an hourly cost of 17€ will be used.
The utilization rate of a device means the percentage of capacity of the device that is in
use. A utilization rate of 100% is almost impossible to achieve, but for example rates of
95% are possible if maintenance is carefully planned and no surprises occur. The opera-
tion efficiency means the time that the machine actually operates as planned, and it
normally is 75– 90% in mining [29, p. 932]. In the USA the average utilization rate in
mining between 1972-2013 was 87.3% [89], as for all industries the average in USA
was only 80%. Globally the utilization rate in mining can be assumed to be a little bit
lower.
Improving Maintenance
Interference Maintenance
Preventing Maintenance
Salary
Materials
Idle costs

32
3. METHODOLOGY OF THE CASE STUDIES
As Chapter 2.5 indicated, the largest energy consumers in the actual mining operations
are processing and haulage. In the following three chapters, a more thorough examina-
tion of three energy consuming mining devices is made: an off-highway haul truck, a
jaw crusher, and a grinding mill. In all three cases the relation between wear, friction
and energy consumption is studied from two perspectives.
First, the total energy consumption of the device is evaluated; how much of the total
energy is used for the main function and how much is lost due to friction. A total energy
breakdown is made by applying data from previous studies of Holmberg et al. [7]–[9].
The energy input is divided into the force to resist motion, mechanical work, and cool-
ing. The mechanical work is further divided into energy losses caused by friction and
wear, and the remaining energy used for the actual operation. Figure 12 demonstrates
the energy breakdown of a device.
Second, the extent of wear in the device is examined. The degree of wear is rather com-
plicated to transform to energy directly so the energy losses caused by wear are exam-
ined through the costs caused by wear. The examination is done by dividing the device
into components and by separately examining the wear and operational life of these
components. The maintenance required for each device is also studied, and an evalua-
tion of the total maintenance required is made. Figure 13 illustrates the costs caused by
wear. The operational lifetimes are estimated case-dependently, by literature search, and
based on private discussions with specialists in the field in question. The components
with a wear life of less than a year are considered as severe wear components, and the
ones with longer operational life as not-so-severe wear components. The annual re-
placement need and cost of spare parts are more closely examined from severe wear
components as well as from components that are known to create large costs due to
wear. In the end of each chapter, a comparison with other equipment used for similar
operations is made. All three case studies are summarized in Chapter 7.
It must be noted that the operational life of the device in question is linked to the utiliza-
tion rate. Grinding mills have a very high utilization rates whereas the rates of jaw
crushers or haul trucks are lower. Each case is considered in its own framework. The
idle times are considered as part of normal operation so that they are recognized in the
utilization rate. No separate inspection of idle costs is made. In many cases wear/spare
parts can be replaced or reused. Using a half worn component, for example a tire, is,
however, not energy efficient. To simplify the framework, in the following cases it is
assumed that after severe wear all parts are changed to new ones.

33
Figure 12. Energy breakdown of a device.
Figure 13. Costs caused by wear.
All calculations are made with an assumption that the mine could be in operation 24
hours a day for 365 days a year so that the total would be 8760 operational hours annu-
ally. As a material example, iron is used. All calculations are made in euros using the
Finnish price and salary levels as the framework.

34
4. OFF-HIGHWAY HAUL TRUCK CASE
Haulage is one of the largest single energy consumers in surface mining operations
(Chapter 2.4.1). In this chapter, an off-highway rigid-frame haul truck with the capacity
of 90 tons (91,400 kg) is examined in more detail. For defining the framework, Caterpil-
lar model 777G off-highway trucks are used. Figure 14 displays the off-highway haul
truck [90]. Table 6 summarizes the key technical data of the truck model CAT-777 [90].
The nominal payload is achieved with a full load of clinker coal or a half load of iron
ore. Carbon, with the density of 0.6 t/m3
[91], weight only 38 tonnes while iron ore has
the density of 1.2 t/m3
and the full load would have a weight of 77 tonnes. The average
utilization rate of a haul truck is ~70% [92][93], which corresponds to ~17 working
hours/day.
Figure 14. A Rigid-frame haul truck CAT-777 [90].
Table 6. Technical data of the haul truck CAT-777 [90].
Mass: Total Weight (t) Nominal payload (t) Weight loaded (t)
167.2 91.4 229
Body :
Width (mm) Length (mm) Depth (max) (mm) Capacity (m3)
1200 6850 1895 64.1
Engine:
Gross Power (kW) Net Power (kW)
765 683

35
4.1 Energy consumption of a haul truck
Haulage in mines is commonly measured as haulage cycles. One haulage cycle includes
the load time, the travel time, the dump time, and the travel empty. The productivity of
a haulage cycle depends on the equipment used and the special features of that mine site
(road elevations, weather conditions etc.). The Mining Engineering Handbook [29, p.
938] defines the average haul time to be 100–180 seconds (2–3 minutes). The dump
time can be expected to be similar. Other factors such as road conditions, traffic or park-
ing can also add minutes to the cycle. Table 7 presents an example of the haulage cycle.
The speed of an empty truck is approximately 35km/h and the speed of the loaded truck
20 km/h [94]. In this example the distance between the load and dump points is 10 km.
With a full load the time for the transport is 30 minutes and with an empty load the time
is approximately 20 minutes. The time for haul and dump takes 3 minutes each (180s),
and the time for other occurrences is estimated to be 4 minutes. This totals in a cycle
time of one hour, which results in 17 cycles per day.
Table 7. An example of a haulage cycle.
Speed (km/h) Distance (km) Time (min)
Truck, empty 35 10 30
Truck, full 20 10 20
Haulage/dump 0 3/3
Other 0 4
Total time 60
The average fuel consumption of a haul truck is difficult to define. The fuel consump-
tion depends on the mass and speed of the vehicle, road conditions as well as the driver.
In previous studies made in the University of British Columbia by J Parreira et al. [94]
it was noted that variations in the fuel consumption of the same vehicle can vary even
16% depending on the driver. When examining the mass and speed, the fuel consump-
tion is linear; heavier vehicles use more energy, as does increased speed or variations of
speed. In a research made by VTT [95], different trucks of various weight classes were
compared. The fuel consumption of a 30 000 tonne truck was 30 liters/100km and the
consumption of a 60 000t truck was 55 liters/100km. Adapting these figures to a truck
of 167.2/229 tonnes (empty/loaded), the corresponding numbers would be 160 l/100km
and 220 l/100km. The idling time of the truck varies from 10–15% of the cycle [94]. In
this example, the idling time has been assumed to be 10 minutes, which is equivalent to
17% of the cycle. The energy content of one liter of gasoline is approximately 8.9kWh/l
[96]. Table 8 lists the assumed fuel and energy consumption in one haulage cycle and
correspondingly in a day and in a year. The hourly fuel consumption numbers are aver-
ages from different driving styles from the open pit haul truck study by Parreira et al.
[94].

36
Table 8. The fuel consumption of a haul truck [94]
Empty truck Loaded truck Idling truck Total
Time (h) 0.33 0.5 0.17 1
Speed (km/h) 35 20 0
Distance (km/day) 150 150 0 300
Fuel consumption
(l/h)
150 406 27
Fuel consump-
tion(l/cycle)
49.5 203 4.5 257
Fuel consumption
(l/day)
842 3451 77 4369
Fuel consumption
(l/year)
307148 27923 1259615 1594685
Energy consumption
(kWh)
440 1807 40 2287
Energy consumption
(kWh/day)
7489 30712 681 38884
Energy consumption
(kWh/year)
2733613 11210574 248510 14192697
The energy distribution of vehicles has been examined in the previous studies by
Holmberg et al. [7][8]. These studies indicate that the total energy losses in passenger
and heavy duty vehicles are as high as 60–80%. Using these studies as a framework, the
energy breakdown for heavy-duty vehicles is made. Larger vehicles are more energy
efficient so the energy for the mechanical power can be assumed to be a little over half
of the consumption. In the bus and truck study single-unit and semi-trailer trucks, city
busses and coaches were researched. The driving conditions of a haul truck are very
similar to a city bus; the speed is low and there is a lot of braking. From the mechanical
power it can be assumed that half of the energy is lost due to friction. In the mine sites
there is commonly a lot of variation in the altitudes, so a large part of energy is lost in
the brakes as well as for rolling friction. In total, approximately one third of the fuel
energy is used to move the vehicle. Figure 15 illustrates an estimation of the energy
consumption for an average heavy duty vehicle. Table 8 summarizes that in one year a
haul truck of 225 tons consumes 1,594,685 liters of gasoline. The annual friction losses
of 24% conclude as 382,724 liters of gasoline.

37
Figure 15. Estimation of the energy distribution of a heavy-duty vehicle.
4.2 Wear of haul truck components
The main parts of a haul truck are the truck frame, tires, diesel engine, and transmission
[90]. The operational life of the main components of these parts is studied in the follow-
ing chapter.
4.2.1 Truck frame
The main components in the truck frame are the truck chassis and the dumb body. The
frame parts are commonly made of steel [97], but nowadays lighter materials such as
aluminum, fiberglass or plastic composites, and carbon fiber are also used [98]. The
form of the truck’s dumb body depends on the main application used. In CAT-777, a
dual slope body is used for haulage with slopes, a X-body for feeding a crusher, and a
coal body for lightweight materials [90]. In this case example, a dual slope body is used.
The dumb body is exposed to heavy impacts during loading, pressure during transport,
and sliding abrasion during the unloading process. The operational lifetime of a haul
truck is assumed to be 10 years [99], [100]. Commonly the truck chassis or body is not
changed in this time-period. To increase the body lifetime, it can be lined with steel or
rubber [90], [101]. The most suitable liner material [102] is chosen according to the
angle of impact; when the angle is really low or high, it is recommended to use rubber,
with medium angles of 50–70, both materials are good. Rubber liners cost even 60%
more than steel liners. However, rubber liners require 10% less maintenance and have
lower energy consumption. The structure of the liner plates can be flat or have a lattice
structure [103]. In this example, steel plates are used. The optimum thickness of the
liner depends on the particle size as well as on the drop height. An average thickness

38
value for rubber is 125 mm and for steel 25 mm [102]. The linings are commonly made
of rectangular pieces. Assuming that the truck body would be covered with plates of the
size 1140 mm*580*25mm, the total amount of plates required would be approximately
42 liner pieces. The 42 steel plates weight approximately 5,500 kg. The operational life
of the plates is quite long as the periods of impact are really short. Figure 16 presents a
rubber liner after 5200 service hours [102], showing that there are not yet severe marks
of wear. It can be assumed that the life of the liner can be up to 10,000 operational
hours. If each plate requires eight bolts, the total amount of bolts required would be 336.
The bolts are commonly made of steel or wear resistant steel [104]. The main wear
mechanism of the bolts is fatigue [105], [106], which implies a relatively long wear life.
One bolt can be used for 20,000 operational hours, which would mean that the same
bolts can be used for two sets of liners. The possibility to reuse bolts is checked when
the linings are changed. Table 9 present the wear and estimated operational life of haul
truck components. The operational hours are converted to years based on the utilization
rate of the device.
Table 9. Wear and estimated operational life of the haul truck body components [99],
[100], [102], [104], [105].
Part Material Size Main wear mechanisms
Operational life (h)
Operational life (years)
Truck
chassis
Steel Impact wear,
sliding erosion
50 000 10
Body Steel 1200*1895*6850 Impact wear,
sliding erosion
50 000 10
Linings (42
pieces)
Steel 1140*580*25 Impact wear,
sliding erosion
10 000 2
Liner bolts
(336 piec-
es)
Steel/wear
resistant
steel
Fatigue 20 000 4
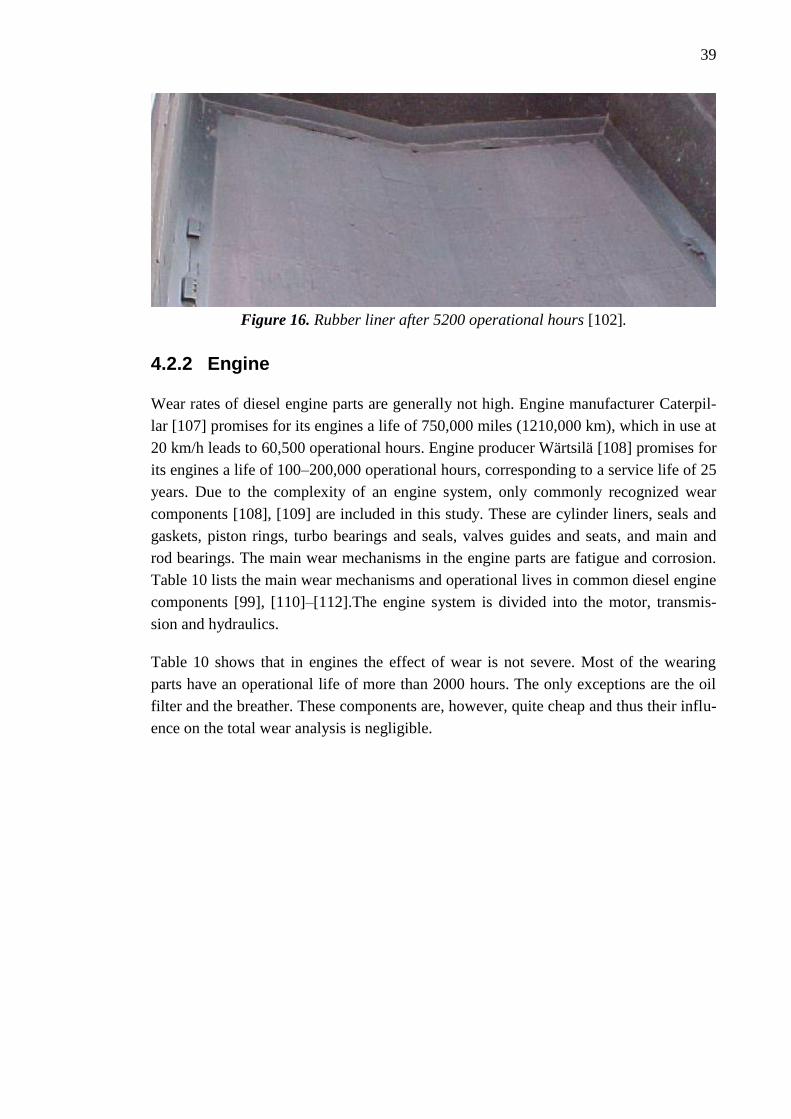
39
Figure 16. Rubber liner after 5200 operational hours [102].
4.2.2 Engine
Wear rates of diesel engine parts are generally not high. Engine manufacturer Caterpil-
lar [107] promises for its engines a life of 750,000 miles (1210,000 km), which in use at
20 km/h leads to 60,500 operational hours. Engine producer Wärtsilä [108] promises for
its engines a life of 100–200,000 operational hours, corresponding to a service life of 25
years. Due to the complexity of an engine system, only commonly recognized wear
components [108], [109] are included in this study. These are cylinder liners, seals and
gaskets, piston rings, turbo bearings and seals, valves guides and seats, and main and
rod bearings. The main wear mechanisms in the engine parts are fatigue and corrosion.
Table 10 lists the main wear mechanisms and operational lives in common diesel engine
components [99], [110]–[112].The engine system is divided into the motor, transmis-
sion and hydraulics.
Table 10 shows that in engines the effect of wear is not severe. Most of the wearing
parts have an operational life of more than 2000 hours. The only exceptions are the oil
filter and the breather. These components are, however, quite cheap and thus their influ-
ence on the total wear analysis is negligible.

40
Table 10. Wear and estimated operational life of the haul truck diesel engine compo-
nents [99], [110]–[112].
Part Material Main wear mechanism
Operational life (h)
Operational life (years)
Engine
Turbocharger High temperature
strength alloys
Fatigue, corro-
sion
10000 2.0
Vee belt Polymers Fatigue 5000 1.0
Start engine High temperature
strength alloys
Fatigue, corro-
sion
9000 1.9
Valves, seats,
bearings
Metallic compo-
sites, elastomers
and plastics
Fatigue, corro-
sion
15000 3
Transmission 7000 1.5
Converter Forged steel Fatigue 10000 2.1
Front axle Forged steel Fatigue 8000 1.7
Hydraulics
Cylinders Cast
iron/steel/aluminu
m
Fatigue 9000 1.9
Hydraulic pump Polymers 7000 1.5
Oil filter, breather Polymers 2000 0.4
4.2.3 Tires
The tires used in the haul truck model of this study are standard tires manufactured by
EROCK with a diameter of 2700 mm. The material of the tires is fiber reinforced rub-
ber. The main components of the tire are the tire part and the rim. Table 11 summarizes
the key technical data of EROCK tires [113].
Table 11. Technical data of haul truck EROCK tires [113].
Weight (kg) 1630
Diameter (mm) 2700
Loaded radius (mm) 1250
Loaded Width (mm) 825
Thread depth (mm) 75
The main reason for tire wear is scrubbing in different forms. Scrubbing occurs when
the vehicle reduces speed and the tires slide. Tire wear rate is influenced by many fac-
tors, which are the driving style, tire position, material properties of the tire, vehicle
traction properties, road conditions, and weather [114]. The weight distribution of the
four tires is not even; normally the rear tires wear more because the weight is more fo-
cused to the back.

41
The average lifetime of a truck tire is typically estimated to be 100,000 km, which in the
daily drive of 340 km would mean a tire usage of 10 months. The lifetime, however,
depends a lot on the truck usage and loads, and for the demanding circumstances of
mines, it can be assumed to be less. The weight loss of a tire in its lifetime can vary
from a few grams to even a total of 10 kg in a truck [114].
The estimated tire wear rates vary from 189 to 768 mg/vehicle kilometer (vkm) [115, p.
5]. The average wear rate is then 574 mg/vkm. Considering that in mining applications
the wear rate is probably higher than on average, a reasonable value is 600 mg/vkm,
which means that for a daily drive of 300 km the wear loss in a year would be 65.7 kg.
Another option to measure the wear rate was presented in a research made in the Uni-
versity of British Columbia [94]. In the calculations of the wear rate, the variations of
speed and temperature in the tire were taken into account. Instead of the mass loss, the
wear rate in millimeters was measured directly. Table 12 presents the average rates of
three different driving styles. The wear rates in each stage of the haulage cycle were
studied separately and summed together to find out the total wear in a cycle. Wear in a
day and in a year were also examined. The results clearly indicate that wear increases
with mass and speed; the wear rate of a loaded truck is almost the double of an empty
one.
Table 12. Wear in a haul truck tire [94].
Empty truck
Loaded truck
Idling truck Total
Wear rate (mm/h) 0.01267 0.0243 0.0032
Time (h) 0.33 0.5 0.17 1
Wear in a circle (mm) 0.0042 0.0121 0.0005 0.0169
Wear in a day, (mm) 0.27
Wear in a year (mm) 105
Wear in a tire is commonly measured as the loss of thickness of the tire. Tire wear can
be examined with electronic devices, but a more common procedure is the manual in-
spection. In use even 80% of tires fail before wearing out [60, p. 870].The estimated
operational lifetime of a tire is 2,000 hours [99]. Figure 17 presents wear in a tire [116].

42
Figure 17. Wear in a truck tire [116].
The most commonly used rim type for haul trucks is a one-piece rim. The rims are typi-
cally made of aluminum or steel [117]. In addition to tire wear, the wheel rim can suffer
from damages, such as bends or dents [118]. A common cause of damages is overload-
ing of the rim. Wear in a rim occurs mainly due to fatigue, and if no severe external
damages occur, the operational life of the rim is high, even 12,000 operational hours
[99]. Table 10 summarizes the wear characteristics and estimated operational life of tire
components.
Table 13. Wear and estimated operational life of the haul truck tire components [99].
Part Material Main wear mechanisms Operational life
(h)
Operational life
(years)
Tire Rubber Scrubbing 2000 0.4
Rim Steel Fatigue 12000 2.5
4.2.4 Maintenance and wear parts costs of a haul truck
The truck requires daily planned and unplanned maintenance. A longer maintenance
stop is commonly done every half a year or so. Planned maintenance includes inspec-
tion of the truck parts, changing of worn or broken parts, and cleaning and lubrication
[119]. Also the maintenance of haul roads can be included in the haul truck mainte-
nance; dust, potholes, corrugations and loose material increase wear and damages in the
haul truck [114]. The largest wear related maintenance procedure is changing the tires,
which is done approximately twice a year. The changing operation includes changing
the sealing ring, the inner ring and if necessary, the inner rim and the rim liner [118].
Monitoring the condition of the tires can be done for example with the help of computer

43
programs. Table 14 presents the maintenance operations and their recommended fre-
quency for a haul truck [110].
Table 14. Maintenance operations of a haul truck [110].
Operation Frequency
Inspections of the motor, breaks, cooling and
the engine oil level. Filling the fuel tank.
Daily
Inspections of tire condition and air pressure
and liner condition, axle and bearing lubrica-
tion. Washing the vehicle.
Weekly
Changing the oil filters and breathers. Every 3 months
Inspections of frame and body, changing the
tires.
Every 6 months
Changing the box liners. Every 12 months
Maintenance work done every 2-4 years
(electrical components, cooling system ad-
justments etc.)
Done in the annual
maintenance
In the study made in the University of British Columbia [94], it was estimated that
2.64h/truck is used daily for planned maintenance and 1.16 h/truck for unplanned
maintenance. This would result in total in 3.9h/truck/day or 27.3h/week and
1420h/truck in a year. Most of the maintenance procedures are wear-related. Assuming
the division between wear-related and other maintenance to be 80/20%, the annual
wear-related maintenance hours are ~1150.
Table 15 shows the estimated prices of the most common wear parts of haul truck com-
ponents. Shipping costs, other service fees or value added tax are not taken into account
in this study. Orders of all wear parts can be assumed to be in large quantities, which
will decrease the price from the average. The prices of tires were examined from three
producers, Nokian Renkaat [120], Goodyear [121, p. 4] and Bridgestone [122, p. 9].
The price varies from less than 500 to almost 1,500 euros/tire. In this thesis the price for
one tire is taken as 1,000 euros and for one haul truck 4,000 euros. Oil filter prices vary
from 5 to 30 euros [123], so as an average we can use 10 euros. Breather prices vary
from 10 to 40 euros [124], from which an approximate value of 20 euros/filter is used.
In an engine there are on average 9 filters and 2 breathers, which are recommended to
be changed every three months [110]. Assuming the steel to have a price of 1.30€/kg
[125], new bed liners weighting 5500 kg would cost 7,150€. When liner bolts are added
to the total, the cost of a new liner can be assumed to be 7,300€, of which half is allo-
cated for each year. In one year the cost of liners would then be 3,650 euros.

44
Table 15. Annual costs for the common spare and wear parts of a haul truck [120]–
[124].
Wear part Pieces in a
year
Material
used
Average
price
(€/piece)
Total cost
(€/year)
Tires 4*2 Rubber 1000 8000
Bed liners 0.5 Steel 7300 3650
Oil Filters 9*4 Polymers 10 360
Breathers
(small
vents)
2*4 Polymers 20 160
Total sum ~12200
4.3 Summary of the haul truck case
From the point of view of wear, the biggest challenge in haul trucks is the wear of the
tires. In this case example a truck with four tires was presented. Commonly there are
also trucks with six or eight tires. The trend in trucks is towards larger vehicles [60, p.
954], which means larger tires and brings even more importance to the tire wear man-
agement. New programs for monitoring and adjusting the tire conditions are developed
constantly [126]. Currently most haul trucks are powered by liquid fuel, but the direc-
tion is also towards electric drive vehicles. These vehicles have higher costs [60, p.
938], but there could be savings in the energy efficiency and friction losses. The friction
losses in the haul truck are currently approximately 24%. Another option for tires is
movement with chains (Chapter 2.4.2.1). The assembly is more expensive, but the
chains use significantly less energy, and also the wear losses are smaller. Another wear
challenge in haul trucks are the bed liners. In the liners the energy saving potential is in
developing longer lasting liner materials. For example the use of nano-structured steel
alloys is suggested to increase the life of a liner by 400% compared to a common steel
wear plate [127].
With haul trucks it is also rational to debate whether a truck is the best option for the
situation in question. One option is using conveyor belts or in underground mines skips
instead of tucks, as it is done in many mine sites. The investment is higher but there is
no need for a driver and the requirements for maintenance are significantly lower.

45
5. JAW CRUSHER CASE
In this chapter, a mobile jaw crusher is studied. For defining the framework, technical
data from Metso Lokotrack model LT140 [128] is used. As in the previous chapter, first
the energy distribution of the device and second the wear in each main component of
the device is examined. Table 16 presents the technical data of the Lokotrack LT140
mobile jaw crusher, and Figure 18 illustrates the components of the crusher and the
crushing process [128]. The optimum operational utilization rate of a jaw crusher is
70% [91]. In the global framework the rate is probably a little lower. In this thesis, a
utilization rate of 65% is therefore used, which means 5700 operation hours annually.
Table 16. Technical data of the Lokotrack LT140 mobile jaw crusher [128].
Crusher unit:
Intake opening (mm) 1400*1070 Weight (kg) 44700
Maximum feed size (mm) 900 Capacity t/h 700
Engine:
Engine max power (kWh) 403
Feeder:
Size (mm) 1600*500 Weight (t)
12.1
Hopper capacity (m3) 12
Conveyor:
Width (m) 1 Length (m) 13
Weight (kg): 4300
Figure 18. Crushing process of Lokotrack LT140 jaw crusher[128].

46
5.1 Energy consumption of a jaw crusher
The total energy, E, required for the grinding process of a short ton can be estimated
with the Bond formula [82, p. 637].
𝐸 = 10 ∗ 𝑊𝑖 ∗1
√𝑝−
1
√𝑓 (1)
where p= mesh in microns, through which 80% of the product passes, f= mesh in mi-
crons, which passes 80% of the feed, and Wi is the work index of the material in ques-
tion in kWh.
The material dependent Bond work index can vary from 0 to 20 kWh or more. All mate-
rials are divided into five classes from very easy (work index 0–7 kWh) to very difficult
(work index 18– kWh). The average value for a hard material is approximately 16 kWh
[91]. The Bond formula indicates that as the feed size gets smaller, the energy require-
ments approach infinity; the finer the material is ground, the more energy is used in the
grinding process. The Bond formula is usually presented in short tons, but in this thesis
the results have been converted to metric tons.
The recommended feed size maximum is 85% of the intake opening of the jaw [129],
which in this case is approximately 800 mm. For this feed size with a jaw crusher as the
primary crusher, a typical end product maximum particle size is 200–300 mm [91, pp.
3–7]. By substituting these numbers in the Bond formula the theoretical crushing energy
of 0.19kWh/t is obtained. A simulation by Metso [130] gives with the same numbers a
crushing energy of 0.29 kWh/t. Table 17 summarizes the parameters affecting the crush-
ing energy. For the total energy consumption, an average of the theoretical and simula-
tion values is used, i.e., 0.25kWh/t.
Table 17. Crushing energy and affecting parameters.
Intake opening 950 85% of intake opening, f85 (mm) 800
Work index (kWh/st) 16 Desired product size, p80 (mm) 200–300
Crushing energy, E (kWh/t):
Bond kwh/t 0.19 Metso simulation 0.29
Average 0.25
Crushing capacity (t/h) 700 Energy consumed/h (kWh) 175
Energy consumed/day (kWh) 2730 Energy consumed/year (kWh) 997 500
The engine used in this model is Caterpillar C15 diesel engine with a maximum power
of 403 kW. In this example the maximum fuel energy of 400kWh is used. The fuel en-
ergy dissipates also as heat, noise and ineffective deformation. Using the previous stud-
ies by Holmberg et al. [7]–[9] as a reference, the energy distribution in a crushing pro-
cess can be estimated. Assuming that half of the energy is lost as thermal losses, it
leaves 50% for the mechanical power. The mechanical power is further divided between

47
the conveyor, the feeder, and the crusher unit. The feeder and conveyor use only a small
portion of the total energy, ca. 8%. To the crusher goes then 42% of the total energy. Of
the energy in the conveyor, approximately 70% is lost due to friction [61]. Assuming
the number in the feeder to be similar, of the 8% used by the conveyor and feeder, ap-
proximately 5% of the total energy is lost due to friction and only 3% goes to mechani-
cal work, i.e., rock processing of the conveyor and the feeder. In the crushing unit there
are a lot of thermal losses, as the processed rock heats up. There are also friction losses
due to the sliding movement in the jaws. Friction losses of the engine, transmission and
hydraulics are estimated to be 20%. This leaves 22% of the total energy for the crush-
ing. Earlier studies [131], [132] indicate that only approximately 3–10% of the total
energy is used for crushing. Assuming that the friction losses in the crushing are also
5% and the thermal losses 14%, 3% is left for mechanical work, i.e., rock processing.
When the numbers of mechanical work of the crusher unit and the conveyor and feeder
are summed together the total energy used for rock processing concludes as 6%. The
total friction losses are 30% of the total energy. In one year the crusher uses approxi-
mately 400kWh*5700= 2,280,000kWh. The friction losses in one year’s operation result
in 684,000kWh. Figure 19 displays an estimation of the energy distribution of a jaw
crusher.
Figure 19. Estimation of the energy distribution of a jaw crusher.
5.2 Wear in a jaw crusher
The main components of a mobile jaw crusher are the feeder, the crusher unit, engines,
transmission, chain tracks, and a conveyor. The crusher is powered by a diesel engine
but the feeder and conveyor can also be powered with an electric motor. In the follow-
ing chapter each main component is examined separately.
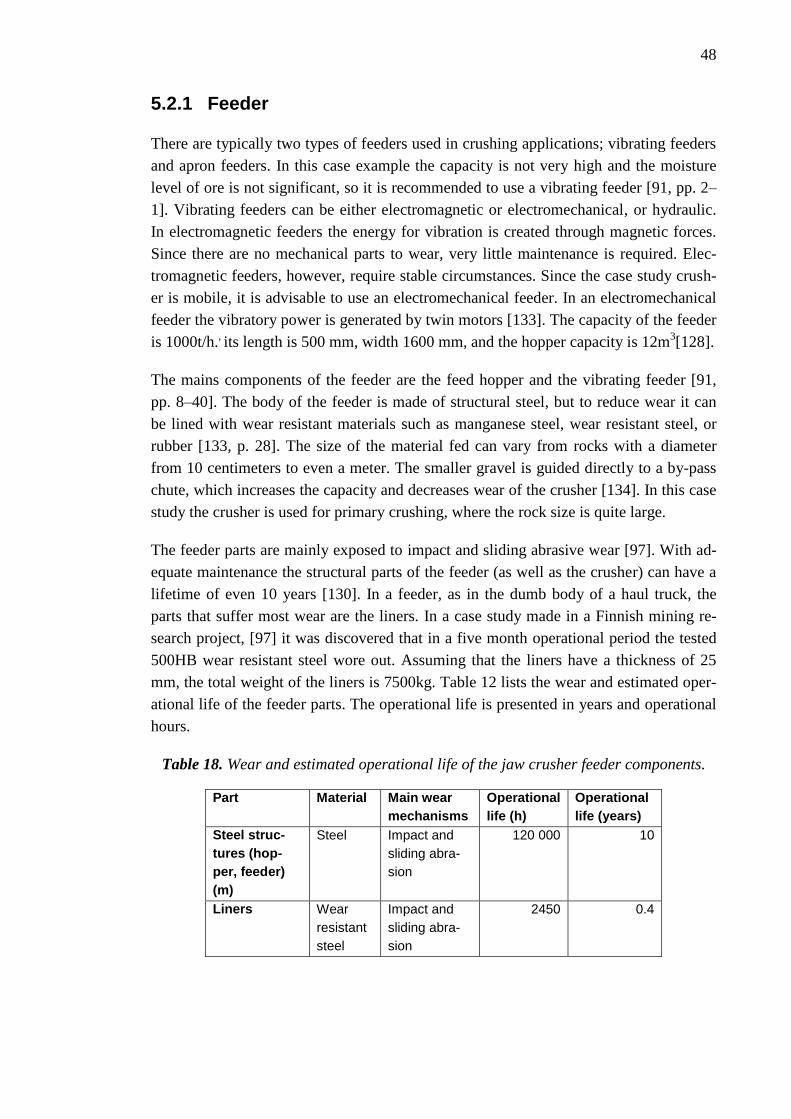
48
5.2.1 Feeder
There are typically two types of feeders used in crushing applications; vibrating feeders
and apron feeders. In this case example the capacity is not very high and the moisture
level of ore is not significant, so it is recommended to use a vibrating feeder [91, pp. 2–
1]. Vibrating feeders can be either electromagnetic or electromechanical, or hydraulic.
In electromagnetic feeders the energy for vibration is created through magnetic forces.
Since there are no mechanical parts to wear, very little maintenance is required. Elec-
tromagnetic feeders, however, require stable circumstances. Since the case study crush-
er is mobile, it is advisable to use an electromechanical feeder. In an electromechanical
feeder the vibratory power is generated by twin motors [133]. The capacity of the feeder
is 1000t/h., its length is 500 mm, width 1600 mm, and the hopper capacity is 12m
3[128].
The mains components of the feeder are the feed hopper and the vibrating feeder [91,
pp. 8–40]. The body of the feeder is made of structural steel, but to reduce wear it can
be lined with wear resistant materials such as manganese steel, wear resistant steel, or
rubber [133, p. 28]. The size of the material fed can vary from rocks with a diameter
from 10 centimeters to even a meter. The smaller gravel is guided directly to a by-pass
chute, which increases the capacity and decreases wear of the crusher [134]. In this case
study the crusher is used for primary crushing, where the rock size is quite large.
The feeder parts are mainly exposed to impact and sliding abrasive wear [97]. With ad-
equate maintenance the structural parts of the feeder (as well as the crusher) can have a
lifetime of even 10 years [130]. In a feeder, as in the dumb body of a haul truck, the
parts that suffer most wear are the liners. In a case study made in a Finnish mining re-
search project, [97] it was discovered that in a five month operational period the tested
500HB wear resistant steel wore out. Assuming that the liners have a thickness of 25
mm, the total weight of the liners is 7500kg. Table 12 lists the wear and estimated oper-
ational life of the feeder parts. The operational life is presented in years and operational
hours.
Table 18. Wear and estimated operational life of the jaw crusher feeder components.
Part Material Main wear
mechanisms
Operational
life (h)
Operational
life (years)
Steel struc-
tures (hop-
per, feeder)
(m)
Steel Impact and
sliding abra-
sion
120 000 10
Liners Wear
resistant
steel
Impact and
sliding abra-
sion
2450 0.4

49
5.2.2 Engine
The diesel engine in a jaw crusher is very similar to the engine in a haul truck. In this
example crusher, a C15 engine for lightweight heavy duty performance is used [135].
With recommended maintenance this type of engine is expected to have a lifetime of
750,000 miles (1.2 million kilometers), which can be assumed to be at least 20 years of
operation. An examination of a diesel engine was made in Chapter 4.2.2. Here the wear
behavior is assumed to be similar. Approximately 500 euros are annually used for the
wear parts of the engine (Chapter 4.2.4).
5.2.3 Conveyor
Conveyor belts are used widely in mining to transport ore from one process to another.
In this case example, the belt is a smaller belt connected to the crushing unit. However,
it is quite common that the belts are even many kilometers long. The main parts of a
conveyor belt are the rubber belt, pulleys (or idlers), and the motor [91, pp. 5–11,5–12].
Figure 20 illustrates the main components of a conveying system [136, p. 9].
Figure 20. Main components of a conveying system[136, p. 9].
The basic idlers are made of standard steel, but for more demanding applications such
as abrasion or corrosion conditions also coating with rubber or polyurethane is used.
When selecting idlers, the influencing factors are the load and the speed, but so that the
idler load is always less than the bearing load [137]. Roller bearings are commonly
made of stainless or plated steel [138]. The cause of bearing failure is commonly fatigue
[139]. Bearing operational life can vary from 10,000 to 100,000 operational hours, so it
can be assumed that in a normal situation both the idler and bearing life to be at least
10,000 operational hours. Idler diameter sizes vary from 76 to 220 millimeters. In the

50
case example, it is advisable to use an idler of size ᴓ89 mm. The belt is commonly made
of natural rubber mixed with butadiene rubber. It consists of three different layers; wear
resistant top layer, strengthening carcass layer, and the friction creating bottom layer.
The belt is mostly worn from the center area due to 2 and 3-body abrasion, of which the
3-body abrasion is the dominant wear mechanism. Some fatigue also occurs. In a re-
search made by Molnar et al. [140] it was discovered that the middle part wore in 8
years of use to only 20% of the original thickness. Table 19 presents the estimated oper-
ational life of conveyor belt parts.
Table 19. Wear and estimated operational life of the jaw crusher conveyor belt compo-
nents [137]–[140].
Part: Material Size Main wear
mechanisms
Operational
life (h)
Operational
life (years)
Belt Rubber 1000mm*3000mm 2- and 3-body
abrasion,
fatigue
60 000 10
Idlers Steel, cov-
ered with
polyurethane
or rubber
ᴓ 89 mm Sliding ab-
rasion
10 000 1.6
Pulleys Steel Sliding abra-
sion
60 000 10
Bearings Steel Fatigue 10 000 1.6
The power consumption of the belt is influenced by the terrain and temperature, rubber
material, belt speed, idler shape and diameter and the mass of the belt and the ore [141],
[142]. The energy consumption of the conveyor belt is determined by the belt’s ability
to resist motion [143]. Laboratory and field tests have shown [61] that in total 70% of
the conveyor’s power is needed to overcome the drag due to the small indentations in
the belt’s rubber cover as it passes over each roller.
The total resistance can be calculated with the following formula [143, p. 84]:
𝐹𝑡𝑜𝑡𝑎𝑙= 𝐹𝑚 + 𝐹𝑠 + 𝐹𝑐𝑙 + 𝐹𝑠𝑝 (2)
where 𝐹𝑚 is the main resistance (tractional resistance of idlers and flexing resistance of
the conveyor belts), 𝐹𝑠 is the secondary resistance (inertia and frictional resistance be-
tween the conveyor belt and the transported material), 𝐹𝑐𝑙 is the climbing resistance, and
𝐹𝑠𝑝 a special resistance (such as plunging resistance caused by the carrying idlers). The
total forces of the conveyor belt are determined by the friction coefficient of the belt
material, f. The lower the friction coefficient is, the less energy the conveyor system
requires. The case study conveyor belt uses energy approximately 15kWh [130].

51
The life of a conveyor belt can be extended with an increase in the tensile strength as
well as with design. In Palabora mine in South America, changing a straight line to a
curved one increased belt life substantially; before the change the belt wore out in three
years, while after the new design it has a life expectancy of even twenty years [61]. In
reality the life of a conveyor belt can be assumed to be something in between these two
extremes.
5.2.4 Tracks
The analyzed crusher uses D4 tracks created originally for Caterpillar tractors. The main
components of the tracks are the track frame, track assembly, rollers, idlers, and the
drive sprocket. Figure 21 presents the track system [144].The assembly is a continuous
chain surrounding the track frame and drive sprocket. Track shoes, which distribute the
weight of tracks, are bolted to the outside links of the chain. Due to constant pivoting
the bolts, pins and bushings suffer from internal wear, which causes the track to length-
en [144]. In order for the tracks to work properly, they require lubrication and adjust-
ment every three months [110]. The planned frequency of moves of a mobile crusher is
between one and seven days [29, p. 953], which indicates that the amount of wear in the
tracks is very small in the total scale. In this thesis a more thorough wear analysis of the
tracks is not made. The tracks are assumed to increase the energy consumption by 2%
[91, pp. 1–1].
Figure 21. Main components of a track system [144].
5.2.5 Jaws
The jaws consist of two, four or more pieces divided evenly on both sides. The upper
plates are called jaw plates and the lower plates are cheeks. The jaws on one side are
stationary and on the other side they are moving [134]. The main force and so also wear
focuses on the lower third of the jaw. In some situations the jaws are designed to be
interchangeable, and so their lifetime can be increased [80]. In this case study it will be
52
assumed that the jaw and cheek plates are symmetrical. The weight of the jaws is ap-
proximately 6,000kg [128]. The jaws are secured with steel bolts. The main wear parts
in the jaw section are the jaws, the jaw bolts, the pusher, and the damper [130].
The jaw plates of the crusher are made of manganese steel and the cheek plates from
tempered manganese steel. Manganese steel is used quite widely in wear applications
due to its ability to work harden under impacts. The manganese contents can vary, the
average content used by Metso being 14% [91, pp. 10–2]. The studies made by Yan et
al. [145] indicate that with optimum manganese content the work hardening can in-
crease the hardness from 256 HV to 774 HV. The work hardening, however, cannot go
on perpetually but after ‘excess’ impacts micro cracks start to form in the surface layer.
The most common types of wear occurring in crushing are abrasive wear and fatigue
wear. In high-load conditions the wear mass loss is mainly due to the spalling of the
work hardened layer [146].
Factors affecting the wear rate of the jaws are environmental factors, crusher parame-
ters, and the feed and abrasiveness of the feed material. Wrong jaw adjustments can
increase wear substantially [84, p. 342]. In addition, irregularity in the wear profile both
increases wear and lowers the efficiency of the crusher [147]. Theoretical wear rates
have been obtained for crushing conditions by M. Lindqvist et al. [82]. The study indi-
cates that when the crushing force is 6kN and the time cycle 0.15s, the wear rate in is
208kN/mm2
for sliding and 274 kN/mm2
for compressive wear. In reality the wear and
operational life of jaws is very case dependent and the wear in jaws may vary a lot even
with similar conditions [130]. In this case example the operational life of the jaws is
estimated to be approximately 0.5 years [99]. Table 20 presents the operational life and
wear in the main jaw parts. The operational life in years is evaluated according to the
utilization rate.
As with haul truck liner bolts (Chapter 4.2.1), the main wear mechanism for jaw bolts
can be assumed to be fatigue [105], [106] and the wear life to be long, approximately
20,000 operational hours. Assuming that each plate has five bolts in the upper and five
in the lower section, the total amount of bolts required is 40. The main wear mechanism
in bearings is also fatigue. In a continuous operation with correct lubrication, the bear-
ing life is generally long, even 50,000 operational hours. The main cause of bearing
wear is incorrect lubrication [139]. In this case example, the bearing life of 20,000 oper-
ational hours is assumed.
The pusher is a metallic plate used for pushing the crushed material forward. The pusher
is commonly made of manganese steel [148]. The pusher is not exposed to so heavy
impacts as the jaws, and therefore its operational life is longer. An estimated operational
life of the pusher is 2.5 years [99].

53
The dampers are rubber plates mounted to the frame of the crusher and used for absorb-
ing the peak load, which decreases the pressure to the foundations of the crusher [149].
The impacts on a dumper are quite severe and therefore the operational life of the
dampers can be assumed to be the same as for the jaws, 0.5 years. Table 21 lists the
wear and estimated operational life of the jaw crusher jaw components.
Table 20. Wear and estimated operational life of the jaw crusher jaw components [99],
[104], [105], [148], [149].
Part Material Amount
of mate-
rial
Main wear
mechanisms
Operational
life (h)
Operational
life (years)
Cheek
plates
Manganese
steel
371000
mm2
Abrasive and
impact wear
3000 0.5
Jaw
plates
Manganese
steel
371000
mm2
Abrasive and
impact wear
3000 0.5
Jaw bolts Wear re-
sistant steel
40 pieces Fatigue 20 000 3.5
Pusher Manganese
steel
1 Abrasive and
impact wear
7500 2.5
Dampers Rubber Abrasive and
impact wear
3000 0.5
Bearings Steel Fatigue 20 000 3.5
5.2.6 Maintenance and wear part costs of a jaw crusher
The jaw crusher requires constant maintenance. The jaws’ condition and wear, feeder
condition and the condition of other components in the crusher unit are inspected daily.
Weekly inspection is conducted to not-so-critical bolts and lubrication of the bearings,
and monthly inspection is made to even more secure components such as the sides.
Changes of oils, jaws and other wear components are done every half year. The change
of other common wear parts is done every year. Table 21 summarizes the maintenance
procedures for a jaw crusher [99][150].
Table 21. Maintenance operations of a jaw crusher [99], [150]
Operation Frequency
Inspections of jaws, feeder, belt, securing bolts Daily
Lubrication of bearings and inspection of other bolts Weekly
Securing the side brackets Monthly
Changing the oil, jaws and bolts of the jaws Every 6 months
Changing the pusher, pusher bearings and dampers Every 12 months

54
Weekly maintenance of a jaw crusher in a mine requires approximately 10 hours, which
includes both planned and unplanned maintenance. In a year this corresponds to 520
hours. In addition to the normal maintenance procedures, every half a year the jaws
must be changed and other maintenance procedures performed. This takes approximate-
ly two working days, which corresponds to four days in a year. The total maintenance of
a jaw crusher is then 620 hours. As in the previous chapter, the 80/20 rule assuming that
80% of the maintenance procedures of the crusher are wear-related is used here. The
wear-related maintenance hours are then ~500 hours annually.
The cost of the jaw assembly is estimated to be 40,000. Using the average wear resistant
steel price 1.3€/kg [125], the price of the liners is estimated to be 9750€, and when liner
the assembly is included, approximately 10,000€. In a year the cost concludes as 5,000
euros. To the engine parts, about 500 euros is used annually (Chapter 4.2.4). Table 22
summarizes the total annual costs of the wear parts in a jaw crusher [99].
Table 22. Estimated annual cost of jaw crusher wear parts [99].
Wear part Amount in
a year
Material
used
Average
price
Total cost/
year (€)
The Jaw
assembly:
2*4 Manganese
steel
40 000 80 000
Jaw bolts Steel
Pusher 1 Steel
Pusher
Bearings
Steel
Damper 2 Rubber
Feeder
liners
0.5 Wear re-
sistant steel
10 000 5 000
Engine
parts
500
Total: 90 500
5.2.7 Summary of the jaw crusher case
From the point of view of wear, the biggest challenge in a jaw crusher is the wear of the
jaws and the feeder liners. The losses due to friction are high, 30% of the total energy
use, which indicates a large energy savings potential in process optimization. It is un-
likely that in an application such as the crusher wear could be totally eliminated, but
with materials development, feed size control, planned maintenance, and making sure
that the adjustments are correct, wear and energy consumption can be decreased.

55
6. GRINDING MILL CASE
In this chapter, an autogenous grinding mill (AG-mill) is examined. This mill is used in
primary milling of iron ore. Iron ore is a hard material and works itself as a grinding
media. The studied AG mill has dimensions of 6.5*6 meters. It is a part of a milling
circuit, where a ball mill is used for secondary and a HPGR for fine grinding. The tech-
nical data of the mill is provided by Outotec [63] Tenovagroup [151] and Mining Engi-
neering handbook [60, p. 1463]. Table 23 summarizes the technical data of the mill.
Figure 22 presents the AG grinding mill used in the Kiruna iron mine in North Sweden
[152]. Grinding mills are critical devices from the point of view of production; a mill
stop causes the entire processing circuit to stop. The operational efficiency of grinding
mills is high, on a global average 80–90% [56]. This corresponds to 7500 operational
hours annually.
Figure 22. An AG grinding mill [152]
Table 23. Technical data of the AG grinding mill [63], [151].
Mill Diameter (m) 6.5 Mill length (m) 6
Motor power (kW) 5.6 Feed (t/h) 500

56
6.1 Energy used for grinding
Even though the operational efficiency of a grinding mill is high, the amount of energy
used for mechanical work is low, as it is for a jaw crusher. When the size of the particles
is reduced, the total surface area increases. This means that for finer grinding more en-
ergy must be used [153]. Factors affecting the energy consumption in grinding are:
characteristics of the grinding media (hardness and size distribution), the liner, and op-
erational conditions [60, pp. 1474–1475].
In Chapter 5.1, the Bond formula for calculating the theoretical energy consumption of
a grinding process was presented. Here the formula is applied to a situation where the
feed of the mill is 500t/h, the feed size is 100 mm, and the wanted product size is 10
mm. The grade of the ore is 30–50% iron [40]. With an average operational efficiency
of 90%, the daily production is 10800~11 000 tons, which corresponds to 21.5 opera-
tional hours/day. The total energy consumption in grinding and the affecting parameters
are presented in Table 24.
Table 24. Energy consumption of the grinding process.
Feed size F80 (µm) 100000 Product size P80 (µm) 100
Work Index (kW) 16 Energy for grinding (kW/t) 0.75
Feed (t/h) 500 Energy consumed (kWh) 372
Energy con-
sumed/day (MWh)
8 Energy consumed/year (MWh) 2920
In a grinding mill the power is produced typically with electricity [60, p. 1466]. The
energy distribution of a grinding mill is examined with the same methodology as in the
two previous chapters. Previous studies by Holmberg et al. [7]–[9] are used as a frame-
work. The greatest difference between electrical and fuel powered devices is that there
are no thermal losses due to exhaust. There are some energy losses due to electricity,
but they are only ~10%. The energy losses caused by cooling of the system stay similar,
at approximately one third. Almost 60% of the total energy is converted to mechanical
power. The grinding mill works with a gearless drive so that there are no losses in the
transmission. However, there are some losses in the motor. There are also a lot of fric-
tion losses in the bearings of the shell, which resist the rolling movement. To the actual
crushing is used merely ~7% of the total input energy. The total friction losses are high,
approximately half of the total energy. Figure 23 illustrates an estimation of the energy
distribution in a rock grinding process.

57
Figure 23.Estimation of the energy distribution in a grinding mill.
The grinding mill of the feed of 500t/h requires the power of 5MW [60, p. 1463]. In one
year, the mill uses approximately 35 GWh of energy. Comparison of this number to the
energy distribution given in Figure 23 indicates that the energy lost due to friction
would be 2.5 MWh. In one year, the losses due to friction are 18,750 MWh.
6.2 Wear in a grinding mill
Wear in a grinding mill is examined in the same manner as in the previous examples of
the jaw crusher and the haul truck. The most significant mill components are the shell,
the feeder, and the electric motor.
6.2.1 Feeder
The grinding mill is fed through a chute. The application may also contain a vibrating
drum or a scoop type feeder. The main components of the feeder are the steel structures,
liners, twin motors, and sieve mesh. The feeder and the wear parts and other features are
very similar to the feeder of a jaw crusher (presented in Chapter 5.2.1). The steel struc-
tures as well as the motors have similar long operational life expectations of approxi-
mately 20 years. The liners are made of wear resistant steel [97]. The only difference
with the jaw crusher feeder liners is that since the ore is smaller and finer, it may not
create as much wear in the liners. In this case the wear and operational life are assumed
to be a little bit longer than for a jaw crusher, 0.5 years. The finer ore is fed through a
sieve mesh, which wears quite fast in use. The operational life of the sieve is approxi-
mately 6 months [63]. Table 25 presents the estimated operational life and wear of the
main components of a grinding mill feeder [63], [97], [108].

58
Table 25. Wear and estimated operational life of the grinding mill feeder components
[63], [97], [108].
Part Material Main wear
mechanisms
Operational
life (h)
Operational
life (years)
Steel struc-
tures (hop-
per, feeder)
Steel Impact and
sliding abra-
sion
120 000 20
Liners Abrasion
resistant
steel
Impact and
sliding abra-
sion
3650 0.5
Twin mo-
tors
Cast iron
frame
120 000 20
Sieve mesh Steel Impact and
sliding abra-
sion
3060 0.5
6.2.2 Shell
The shell in a mill is commonly made from steel, which may be reinforced with design
as well as protecting linings. Larger mills are often supported with trunnions. Another
option are shell-supported mills, which are supported with bearings mounted directly to
the shell [154]. In this example a shell-supported mill with multi-pad bearings is used.
The multi-pad bearings are made of machined high strength steel and coated with white
metal [154].
The wear rate of the shell components is influenced by the pressure in the mill, mois-
ture, feed rate, and the abrasiveness of the feed material. If the mill settings are fixed,
the only factor affecting wear is the abrasion index. The wear on a shell’s surface is a
function of the ore’s abrasiveness. Increasing pressure or the shell speed will increase
wear. The rolls often suffer from the ‘’bathtub’’ effect where the center of the rolls
wears more rapidly than the outer areas. This has been decreased with edge blocks and
cheek plates [60, p. 1469]. The mill linings are the parts mostly suffering from wear [60,
p. 1478] [155]. Figure 24 illustrates worn grinding mill liners. The operational life for
linings is approximately 10 months with iron ore. The end linings last longer [63]. For
lining materials, cast steel, cast iron, solid rubber, rubber-steel composites or ceramics
are often used [154]. The main wear mechanism in the supporting bearings is fatigue.
Table 26 lists the wear and operational life of the grinding mill shell components.

59
Table 26. Wear and estimated operational life of the grinding mill shell components
[63], [139].
Part Material Amount of
material
Main wear
mechanisms
Operational
life (h)
Operational
life
(years)
Shell Steel 122m2+20.4
m2= 142.4
m2
Impact and
abrasive
wear
140 000 20
Middle
lining
Steel rein-
forced rub-
ber
6m*6.5m*π=
122m2
Impact and
abrasive
wear
5600 0.8
End lining Steel rein-
forced rub-
ber
6.5m*π=20.4
m2
Impact and
abrasive
wear
7000 1
Supporting
bearings
Steel/bronze Fatigue 10 000 1.5
Figure 24. Worn grinding mill liners [116].
6.2.3 Motor
SAG/AG mills are normally powered by adjustable gearless drives cast either of nodu-
lar iron, cast or forged steel [156]. Motor rotor elements are bolted to the mill shell and
covered with a stationary assembly. Mill speed is controlled with the motor current.
Gearless drives decrease the energy losses due to friction and allow the power use of
the mill to be increased to even 20 MW [60, p. 1466]. The motor should be dimensioned
to withstand certain amounts of overload conditions caused by worn liners, harder ore,
or higher charge [157]. In Chapter 4.2.1 it was already mentioned that the wear of en-
gine components in a diesel engine are very low; the circumstances for an electric motor
are very similar, and with adequate maintenance and use the motor has a life expectancy

60
of 15 years [158]. Therefore a more thorough inspection of the motor parts is not made.
The cost of the wear parts of motors are annually approximately 500 euros.
6.2.4 Maintenance and wear part costs of a grinding mill
Table 27 summarizes the common maintenance procedures for a grinding mill [63],
[99], [159]. Linings and securing bolts, feeder condition and the condition of the other
components in the grinding unit are inspected daily. Inspection of the not-so-critical
bolts and lubrication of bearings is done weekly. Monthly inspections include the more
secure components such as the sides. It is recommended to do a longer maintenance
stop 2–3 times a year when the linings are changed and other necessary maintenance
procedures done.
Table 27. Planned maintenance of a grinding mill [63], [99], [159].
Operation Frequency
Inspections of linings, securing bolts Daily
Lubrication of bearings and inspection of other bolts Weekly
Securing the side brackets Monthly
Changing the oil, liners,
Inspection of, Bearings, gears, shaft alignment lubrica-
tion
Every 6 months
Changing the liners, ring chamber cleaning, brake
adjustments
Every 12 months
The weekly maintenance of a grinding mill is estimated to take 10 hours, which in-
cludes both planned and unplanned maintenance procedures. In a year this gives 520
hours. It is recommended to do a maintenance stop in the mine 2–3 times a year. In this
study it is expected that there are two maintenance stops; during one of the stops the
liners are changed, and the other stop is used for other inspections and adjustments.
Changing of the liners takes approximately three days for five workers, which requires
360 hours of work. The other maintenance stop requires only three days for one worker,
i.e., 72 hours. The total maintenance hours annually are then approximately 950. As in
the two previous chapters, an assumption is made that 80% of the maintenance is wear-
related and the rest is other maintenance. This corresponds to 760 wear-related mainte-
nance hours annually.
The most severe wear parts in a grinding mill are the shell liners, liner bolts, and the
sieve mesh. The shell liners cost approximately 700,000 euros and the other wear com-
ponents 100,000 euros [63], [99]. The feeder liners are made of wear resistant steel. The
cost can be assumed to be similar with the jaw crusher feeder (Chapter 5.2.6), i.e.,
10,000€ for new liners. For motor spare parts, 500 euros are used. Table 30 summarizes
the most severe wear parts of a grinding mill and their estimated costs.

61
Table 28. Annual costs of grinding mill wear parts [63], [99], [123], [124].
Wear part Amount
in a year
Material
used
Average
price
Total cost/
year (€)
Shell liners 1 Manganese
steel
2€/kg 700 000
Liner bolts Steel
100 000 Sieve mesh 2 Steel
Feeder liners 0.5 Wear re-
sistant steel
10 000 5 000
Motor parts 500
Total 810 500
6.3 Summary of the grinding mill case
From the point of view of wear, the biggest challenge in a grinding mill is the wear of
the mill and feeder liners. The liner endurance is important from the point of view of the
entire process, since extremely worn liners burden the motors and increase the total en-
ergy consumption [157]. If additional grinding media is used, (as in SAG mills) the
wear of the liners can be assumed to be even higher. In addition to linings, there is the
cost of the grinding media [60, p. 1470]. In grinding mills the energy use is significantly
higher compared to a haul truck or a crusher. The friction losses in the grinding mill are
also very high, even 47%.
Energy consumption and wear in grinding can be reduced by material selection; one
option is to use lighter materials, which are optimized to the process. In Berezitovy
mine, the change of material almost doubled the wear life of the mill linings [160]. An-
other key factor in controlling wear and energy consumption is controlling the opera-
tional conditions; wear increases substantially with pressure in the mill or with incorrect
feed rate. The energy efficiency is also improved by choosing the correct milling circuit;
with some ores it is advisable to use two-stage milling, while others require three stages.
Savings can also be obtained with planned maintenance; the grinding mill is a critical
device, which means that a stop in the mill is a stop in the entire production of the pro-
cessing unit.

62
7. SUMMARY OF THE CASE STUDIES
In this chapter, the main conclusions of the three previous chapters are summarized.
Table 29 summarizes the friction losses related to the haul truck, the jaw crusher, and
the grinding mill. Table 30 lists the wear costs of these three devices. The oil consump-
tion of the haul truck is converted to euros by using the average diesel fuel price in Fin-
land at the end of year 2014, 1.30€/l[161]. The energy is converted to euros using the
average electricity price in 2014, 0.05€ kWh [162]. The maintenance hours are convert-
ed to costs by using the average salary presented in Chapter 2.7, i.e.,17€/h.
Table 31 lists estimations of the purchase prices of the studied equipment and a compar-
ison with the wear and friction costs of a one-year period. The prices are estimations
adjusted to the case examples from the numbers found in the Boliden Aitik Copper
Mine project [163] and in a truck report completed by Industry Tap News [164]. In the
haul truck the annual costs due to wear and friction are approximately 28% of the pur-
chase price, of which 3% is due to wear and 25% due to friction. The friction losses are
significantly higher than the losses due to wear. This is explained by the high fuel price.
There is a savings potential in increasing the wear resistance of tires and liners as well
as in making the maintenance more efficient. A large saving could be obtained by in-
creasing the fuel efficiency or by using different haulage equipment, i.e., electric vehi-
cles, conveyors, etc. In the jaw crusher the total losses are also approximately 13% of
the estimated purchase price, of which only 3% is lost due to friction and 10% due to
wear. The losses due to friction are significantly lower than the costs of wear. In the jaw
crusher the largest savings potential is in the control of wear in the jaws by optimizing
the crushing process and in improving the energy efficiency of the crushing process. In
the grinding mill the wear and friction losses are both higher than in the two previous
examples. The costs of friction are approximately 18% and the costs of wear 16% of the
purchase price, making a total of 34%. There is a savings potential in the energy effi-
ciency of the grinding process as well as in controlling and preventing wear of the lin-
ers.

63
Table 29. Summary of annual friction losses.
Operation Annual
use (h)
Annual energy
use
Friction loss
from total
energy
(%)
Energy loss,
friction
Energy loss,
friction
(€/year)
Haul truck 4800 121 9465 l 34 292 672 l 380 473
Jaw crusher 5700 2 280 MWh 30 684 MWh 34 200
Grinding mill 7000 35 000 Mwh 50 17 500 Mwh 875 000
Table 30. Summary of annual wear losses.
Operation Wear parts (€) Maintenance (h) Maintenance (€) Total (€)
Haul truck 18 500 1150 19 550 38 050
Jaw crusher 90 500 500 8 500 99 000
Grinding mill 800 000 750 12 750 823 250
Table 31. Annual costs of wear and friction vs. the estimated purchase price.
Purchase
price (€)
Annual
cost of
wear and
friction
(€)
Friction
loss of
purchase
price (%)
Wear loss
of pur-
chase
price (%)
Wear and
friction/
new device
(%)
Haul truck 1 500 000 421 973 25 3 28
Jaw crusher 1 000 000 124 759 3 10 13
Grinding mill 5 000 000 1 700 500 18 16 34

64
8. SUMMARY AND CONCLUSIONS
The most abundant minerals mined in 2012 were mineral fuels, accounting for 77% of
all mined minerals. In the second place were iron and ferroalloy metals with 15% of the
total world production. The portion of non-ferrous metals or precious metals is not high,
only about one percent altogether. However, the significance and value of these miner-
als is high. The last group examined, the industrial minerals, cover approximately 7% of
the total production [1]. From this examination oil and natural gas were excluded.
Most of the mines in the world are found in China, USA, Australia, India and Russia.
The top five countries together cover almost 70% of the total production [1]. The geo-
graphical trend is towards developing countries, which also brings challenges from the
point of view of energy consumption. The total amount of mines globally is difficult to
evaluate; depending on the source and the framework, the numbers vary a lot. Some
statistics only notice large industrial mines, while others include all small quarries as
well. A reasonable estimation (which includes small operations as well) is that globally
there are 100,000–125,000 mines.
Most of the mines are surface mines, approximately 7% of the total [25, pp. 341–342].
The rest are underground or mixed operations. Surface operations are preferred due to
lower infrastructure costs. The trend is, however, more towards underground mines.
There are many reasons for this development, of which the most important one is that
ore is no longer found so much from the surface but must be extracted deeper.
The mining sector is a very wide and versatile sector; mine sizes, materials mined, mine
types or means of extraction and processing vary a lot. It is therefore not rational to de-
fine one average mine. When mines were classified according to the mineral groups,
some approximations could be made. With information provided by the annual reports
of large mining companies, the medians of mine sizes were estimated as follows: coal
8.2 Mt, iron: 14 Mt, other metals 105 kt, precious metals 4.4 t (155,000 oz), industrial
minerals 1.9 Mt, and diamonds 3345 ct. The median lifetime for a mine is 40 years. The
standard deviations in each sampling group were very large, but the numbers give an
idea about the magnitudes in the different mineral groups.
Mining is a large energy consumer. From the global energy consumption even ~5% is
used for mining. Studies made by the Mining Association of Canada [58], [59] indicate
that the most energy consuming operations in surface mining are processing (49%),
supporting activities (21%), and haulage (14%). In an underground mine most energy is
consumed in supporting activities (56%), processing (27%), and extraction (8%). The

65
underground mines use significantly more energy than the surface mines. Assuming that
the energy consumption of underground mines is double, the total energy distribution
between these two mine types is 50/50. When the energy consumption is investigated in
a global framework, the most energy goes to supporting activities (38.5%) and pro-
cessing (38%). The rest is divided between haulage (13.5%) and extraction (10%).
Previous studies [7]–[9] suggest that the friction losses in passenger cars and trucks are
~30% and in paper machines 15–25% of the total energy consumption. In addition to
studying energy losses caused by friction, the viewpoint of wear was added in this
study. The effects of wear and friction in the mining industry were studied through case
studies of highly energy consuming devices. Friction was studied through the energy
loss and wear from the point of view of costs resulting from the wear parts and mainte-
nance. The chosen equipment for the study were a jaw crusher used for primary crush-
ing, a haul truck used in haulage, and an AG mill used in primary milling. This study
was based on iron ore mines.
According to this study, the energy losses due to friction are 24% in a haul truck, 30%
in a jaw crusher, and 50% in a grinding mill. The losses in the haul truck are quite simi-
lar to those found in the previous studies. The friction losses in comminution, especially
in grinding, are significantly higher than those of the previous studies.
Wear was studied by examining separately the main components of the case study
equipment. Both the cost of wear-related maintenance and costs of wear parts were ex-
amined. In the haul truck, the most important wear components are the tires and the bed
liners, which annually cause costs of almost 20,000€. The annual cost of maintenance is
approximately 20,000€. The losses due to friction in a haul truck are annually approxi-
mately 380,000€. The friction costs are in this case very high due to the high gasoline
price in Finland. The annual total costs of maintenance and spare parts correspond to
28% of the purchase price of a new truck. There is a lot of energy saving potential in
developing more wear resistant materials for tires and bed liners as well as in improving
the fuel efficiency. Monitoring tire wear is also in an important role.
In the jaw crusher the most important wear components are the jaw assembly parts; the
jaws, jaw bolts, the pusher and the damper, and the feeder liners. The annual costs of a
jaw crusher spare parts are approximately 100,000€, and to maintenance is used 8,500€.
Annual losses due to friction are approximately 34,000€. The annual costs of mainte-
nance and spare parts correspond to 13% of the purchase price. In the crusher, energy
savings could be obtained by optimizing the crushing process as well as by improving
the wear resistance of the materials used, especially in jaws.
In the grinding mill the most important wear parts are the mill liners and other liner as-
sembly components. The annual cost of the wear parts is approximately 800,000€, and
the required maintenance costs 13,000€. The annual losses due to friction are approxi-

66
mately 875,000€. The annual costs due to wear and friction correspond to approximate-
ly 34% of the purchase price of a new mill. In the grinding mill there is a savings poten-
tial in developing more wear resistant liner materials as well as in better planning of the
maintenance; an unnecessary stop of the grinding circuit causes the entire process to
stop. Since the energy consumption of mills is particularly high, there is a lot of poten-
tial in improving the energy efficiency of the device. From the viewpoint of the entire
mine operation, improving the energy efficiency in grinding circuits has the highest
energy savings potential. This has been noticed also in earlier studies [20], [67].
It must be noted that the current case-studies were made in the framework of one opera-
tional year and only severe wear components were taken into account. In a long-term
examination the wear life of parts such as conveyor idlers, bearings, engines etc. should
also be included. Adding these components would only increase the wear costs. Many
of the presented numbers are rough estimations. The estimations, however, clearly
demonstrate that the energy savings potential in mining is high from both friction and
wear viewpoints. Most of the estimations made in this thesis are done from the view-
point of Finland or Europe. Outside Europe both labor and material costs are probably
lower, but at the same time operations and maintenance are not so efficient and planned,
and therefore the costs due to wear and maintenance will probably be even higher.
As a conclusion, there are two key factors in reducing the wear and energy consumption
in the mining sector: anticipatory actions and the courage to make investments. Plan-
ning is important from various points of view. Since the mining sector is a very com-
plex area and there are very different kinds of mines and mine sites, it is particularly
important to make sure that the equipment used is the most suitable one to that frame-
work. Keikkala et al. [165] compared the energy consumption of two mines in similar
circumstances. In the Russian Apatit mine, the energy consumption was 2.5 times more
than in Kiruna mine in Sweden. A large change could be done just by improving the
energy efficiency. Careful planning also plays an important role in the maintenance.
With well-planned and controlled maintenance long stops in the production can be pre-
vented. The planning is particularly important to critical devices such as the grinding
mill, which determine the total utilization rate of the operation. In planning and control-
ling, in a vital role is the utilization of technology to control wear. Planning of the oper-
ations is very common in developed countries, for example the Pyhäsalmi mine in Fin-
land or Aitik copper mine in Sweden, are very energy efficient. But, as mentioned earli-
er, the majority of mines are not in developed countries.
The second important factor is the courage to invest in order to gain savings. Most en-
ergy saving procedures requires new investments. Conveyor belts are much more ex-
pensive than haul trucks but they do not require labor and suffer significantly less from
wear than the haul truck tires. As concerns material selection, for example rubber lin-
ings are 60% more expensive than a steel lining, but in certain applications they suffer
significantly less from wear.
67
REFERENCES
[1] C. Reichl, M. Schatz, and G. Zsak, “World Mining Data -Welt bergbau Daten-
Minerals Production /Rohstoffproduktion 2014,” Vienna, 2014.
[2] “Mining Explained,” Mining Journal, 2014. [Online]. Available:
http://www.mining-journal.com/knowledge/Mining-Explained.
[3] IBRAM, Brazilian Institute of Mining, “Private Discussions,” 2014.
[4] Republic of South Africa Energy Department, “South African Energy Synopsis,”
2010. [Online]. Available:
http://www.energy.gov.za/files/media/explained/2010/South_African_Energy_Sy
nopsis_2010.pdf.
[5] Natural Resources Canada, “Energy Efficiency Trends in Canada, 1990 to 2009,”
2012. [Online]. Available:
http://oee.rncan.gc.ca/publications/statistics/trends11/chapter5.cfm?attr=0.
[6] US Energy Information and Administration, “Industries Consumed More than
30% of U.S. Energy in 2011,” 2012. [Online]. Available:
http://www.eia.gov/todayinenergy/detail.cfm?id=8110.
[7] K. Holmberg, P. Andersson, and A. Erdemir, “Global Energy Consumption due
to Friction in Passenger Cars,” Tribol. Int., vol. 47, pp. 221–234, Mar. 2012.
[8] K. Holmberg, P. Andersson, N.-O. Nylund, K. Mäkelä, and A. Erdemir, “Global
Energy Consumption due to Friction in Trucks and Buses,” Tribol. Int., vol. 78,
pp. 94–114, Oct. 2014.
[9] K. Holmberg, R. Siilasto, T. Laitinen, P. Andersson, and A. Jäsberg, “Global
Energy Consumption due to Friction in Paper Machines,” Tribol. Int., vol. 62, pp.
58–77, Jun. 2013.
[10] International Energy Agency, “2014 Key World Energy Statistics,” 2015.
[Online]. Available:
http://www.iea.org/publications/freepublications/publication/key-world-energy-
statistics-2014.html.
[11] British Petroleum, “BP Statistical Review of World Energy 2014,” 2015.
[Online]. Available: http://www.bp.com/en/global/corporate/about-bp/energy-
economics/statistical-review-of-world-energy.html.
[12] International Energy Agency, “Redrawing the Energy Climate Map,” 2013.
[Online]. Available:
http://www.worldenergyoutlook.org/media/weowebsite/2013/energyclimatemap/
redrawingenergyclimatemap.pdf.
[13] P. Jost, “Committee of Tribology, Report 1966-67,” 1968.

68
[14] K. Budinski, “Wear News,” G02 Wear News, vol. 9, no. 5, p. 8, 2013.
[15] T. B. Theo Mang, Kirsten Bobzin, “Introduction,” in Industrial Tribology:
Tribosystems, Friction Wear and Surface Engineering, Weinheim: WILEY-VCH
Verlag GmbH & Co., 2011, p. 8.
[16] Ulkoasianministeriö, “EU:n budjetti,” 2014. [Online]. Available:
http://www.eurooppatiedotus.fi/public/default.aspx?contentid=92787#.VKprDG
O8qZU. [Accessed: 12-Jan-2015].
[17] BHP Billiton, “Annual Report 2013,” 2014.
[18] MMC Norilsk Nickel, “Annual Report 2013,” 2014.
[19] P. Darling, Ed., “Setting the Scene,” in SME Mining Engineering Handbook,
Third Edit., Society for Mining, Metallurgy and Exploration, Inc., 2011, pp. 1–
60.
[20] G. Bäckblom, E. Forssberg, S. Haugen, J. Johansson, T. Naarttijärvi, and B.
Öhlander, “MIFU | Smart Mine of the Future Conceptual Study 2009-2010,”
Luleå, 2010.
[21] Jartti T, Rantala E, Litmanen T, Sosiaalisen toimiluvan ehdot ja rajat. Jyväskylän
Yliopisto, 2014, p. 232.
[22] InfoMine, “MapMine Mapper.” [Online]. Available:
http://mapper.infomine.com/.
[23] IMMAGE, “Information search for VTT, 28.8.2014.”
[24] U.S. Department of Energy, “Mining Industry Energy Bandwidth Study,” 2007.
[25] P. Darling, Ed., “Mining Method Selection,” in SME Mining Engineering
Handbook, Third Edit., Society for Mining, Metallurgy and Exploration, Inc.,
2011, pp. 341–416.
[26] Vale, “Annual Report 2013,” 2014.
[27] Coal India Limited, “Annual Report 2012-13,” 2013.
[28] Index Mundi, “Indecs Mundi Commodity Prices,” 2014. [Online]. Available:
http://www.indexmundi.com/commodities/?commodity. [Accessed: 25-Oct-
2014].
[29] P. Darling, Ed., “Surface Extraction,” in SME Mining Engineering Handbook, 3
rd., Society for Mining, Metallurgy and Exploration, Inc., 2011, pp. 880–1071.
[30] The Statistics Portal, “Top 10 Mining Companies Worldwide Based on Market
Value in 2014.” [Online]. Available:

69
http://www.statista.com/statistics/272706/top-10-mining-companies-worldwide-
based-on-market-value/. [Accessed: 23-Oct-2014].
[31] World of Coal, “Coal Mining.” [Online]. Available:
http://www.worldcoal.org/coal/coal-mining/. [Accessed: 05-Nov-2014].
[32] World of Coal, “Coal Conversion Statistics,” 2015. [Online]. Available:
http://www.worldcoal.org/resources/coal-statistics/coal-conversion-statistics/.
[Accessed: 22-Feb-2015].
[33] World Coal Association, “What is Coal,” 2014. [Online]. Available:
http://www.worldcoal.org/coal/what-is-coal/. [Accessed: 05-Nov-2014].
[34] mining-technology.com, “The Biggest Coal Mines in The World,” 2013.
[Online]. Available: http://www.mining-technology.com/features/feature-the-10-
biggest-coal-mines-in-the-world. [Accessed: 06-Nov-2014].
[35] China Shenhua Energy Company Limited, “Annual Report 2013,” 2014.
[36] Rio Tinto, “Annual Report 2013,” 2014.
[37] Anglo American, “Annual report 2013,” 2014.
[38] International Organization for Standardization, ISO 3166 -Country Codes. .
[39] U.S Mining Industry, “Iron,” 2001.
[40] Intercontiental Exchange, “Iron Ore Product Guide,” 2010. [Online]. Available:
https://www.theice.com/publicdocs/ICE_Iron_Ore_Product_Guide_ENG.pdf.
[41] Mining Technology, “The World’s Biggest Iron Ore Mines,” 2013. [Online].
Available: http://www.mining-technology.com/features/featurethe-worlds-11-
biggest-iron-ore-mines-4180663/. [Accessed: 13-Nov-2014].
[42] LKAB, “Integrated Report Annual and Sustainability Report 2013,” 2013.
[43] Index Mundi, “Iron Ore Monthly Price,” 2014. [Online]. Available:
http://www.indexmundi.com/commodities/?commodity=iron-ore. [Accessed: 05-
Nov-2014].
[44] C. Jamasmie, “Largest Iron ore Miners Smashing Chinese Competitors,”
Mining.com, 2014. [Online]. Available: http://www.mining.com/largest-iron-ore-
miners-smashing-chinese-competitors-64366/. [Accessed: 05-Nov-2014].
[45] Inmet Mining, “Pyhasali Mine Presentation,” 2002.
[46] Glencore Xtrata, “Annual Report 2013,” 2014.
[47] First Quantum Minerals, “Financial Statement Q4 2013,” 2014.

70
[48] Barrick Gold Corporation, “Annual Report 2013,” 2014.
[49] Newmont, “Annual Report 2013,” 2014.
[50] Teck, “Annual Report 2013,” 2014.
[51] Goldcorp, “Mines and Projects,” 2014. [Online]. Available:
http://www.goldcorp.com/English/Unrivalled-Assets/Mines-and-Projects/.
[Accessed: 23-Nov-2014].
[52] U.S. Minining Industry, “Potash, Soda Ash, and Borates,” 1997.
[53] PotashCorp, “2013 Annual Integrated Report,” 2014.
[54] OCP, “Annual Report 2012,” 2013.
[55] Careers in Mining, “4 Stages in the Life-Cycle of a Mine and the Careers
Associated,” 2012. [Online]. Available: http://careersinmining.com/blog/4-
stages-of-the-life-cycle-of-a-mine-and-the-careers-associated/. [Accessed: 03-
Dec-2014].
[56] “Private Discussions with Maintenance Specialist Seppo Tolonen,” 2015.
[57] mine-engineering.com, “Copper Mining Info,” 2012. [Online]. Available:
http://www.mine-engineer.com/mining/copperm.htm. [Accessed: 23-Feb-2015].
[58] Mining Association of Canada, “Benchmarking the Energy Consumption of
Canadian Open-pit Mines,” Ottawa, 2005.
[59] The Mining Association of Canada, “Bechmarking the Energy Consumption of
Canadian Underground Bulk Mines,” Ottawa, 2005.
[60] P. Darling, Ed., “Mineral Processing,” in SME Mining Engineering Handbook,
Third Edit., Society for Mining, Metallurgy and Exploration, Inc., 2011, pp.
1455–1556.
[61] L. K. Nordell, “A New Era in Overland Conveyor Belt Design,” Eng. Min. J., no.
April, pp. 40–41, 1999.
[62] LKAB, “Mining, How Ore is Mined.”
[63] “Private Discussions with Outotec,” 2015.
[64] Vale, “Sustainability Report 2013,” 2014.
[65] BHP Billiton, “Sustainability Report 2013,” 2014.
[66] F. Q. M. Ltd, “Greenhouse Gas Report,” 2012.

71
[67] T. Norgate and N. Haque, “Energy and greenhouse gas impacts of mining and
mineral processing operations,” J. Clean. Prod., vol. 18, no. 3, pp. 266–274, Feb.
2010.
[68] “Greenhouse Gas Protocol,” 2012. [Online]. Available:
http://www.ghgprotocol.org/calculation-tools/faq.
[69] Organisation for Economic Cooperation and Development, “Carbon Dioxide
Equivalent,” Glossary of Statistical Terms, 2013. [Online]. Available:
http://stats.oecd.org/glossary/detail.asp?ID=285. [Accessed: 25-Feb-2015].
[70] Rio Tinto, “2013 Sustainable Developement,” 2014.
[71] Anglo American, “Sustainability Report 2013,” 2014.
[72] Freeport McMoran, “Energy Management,” 2014. [Online]. Available:
http://www.fcx.com/sd/env/energy_manage.htm.
[73] Freeport McMoran, “Freeport McMoran Annual Report 2013,” 2014.
[74] Tilastokeskus, “Energian kokonaiskulutus edellisvuoden tasolla vuonna 2013,”
2014. [Online]. Available: http://www.stat.fi/til/ehk/2013/ehk_2013_2014-12-
10_tie_001_fi.html.
[75] China Shenhua Energy Company Limited, “2012 CSR Report,” 2013.
[76] Barrick Gold Corporation, “Energy Use and Climate Change,” 2014. [Online].
Available: http://barrickresponsibility.com/2013-performance/energy-use-and-
climate-change/. [Accessed: 24-Feb-2015].
[77] Tilastokeskus, “Kasvihuonekaasupäästöt vähenivät teollisuudessa ja
energiahuollossa vuonna 2012,” 2014. [Online]. Available:
http://www.tilastokeskus.fi/til/tilma/2012/tilma_2012_2014-09-
25_tie_001_fi.html. [Accessed: 22-Feb-2015].
[78] M. Ziemski, A. Bye, N. Plint, M. Cole, and A. Tordoir, “An Integrated Geology-
Mine-Plant and Eco-efficiency Simulator for Anglo Platinum’s Evaluation and
Operational Improvement Initiatives,” XXV Int. Miner. Process. Kongress, pp.
3629, 3633, 2010.
[79] J. Valli, “Kitkan ja kulumisen fysikaaliset perusteet,” in Kaivos -ja metallurgisen
teollisuuden kulumisongelmia, INSKO, Ed. 1983, pp. 1–12.
[80] Metso, “Wear Parts Application Guide,” 2014. [Online]. Available:
http://www.metso.com/miningandconstruction/matobox7.nsf/docsbyid/23a0181e
98d2fa3ac2257856002e27c2/$file/wear_and_materials_en.pdf.
[81] I. M. Hutchings, Friction and Wear of Engineering Materials. Oxford:
Butterwoth-Heinemann, 1992, p. 262.

72
[82] M. Lindqvist and C. M. Evertsson, “Linear Wear in Jaw Crushers,” Miner. Eng.,
vol. 16, no. 1, pp. 1–12, 2003.
[83] Ventyx, “Increasing Field Maintenance Productivity in Mining,” 2012. [Online].
Available: http://www.ventyx.com/~/media/files/whitepapers/wp-field-
maintenance-productivity.ashx?download=1.
[84] S. Tolonen, “Kunnossapito ja tehdaspalvelu,” in Kaivos- ja louhintatekniikka, 1
st., P. L. Antero Hakapää, Ed. 2009, pp. 329–346.
[85] K. Komonen, “Kunnossapidon tunnuslukuja,” pp. 1–31, 2003.
[86] R. Heinonkoski, “Varaosahuolto on osa tehokasta ennakkohuoltoa,” in
Koneautomaation kunnossapito, 2nd ed., Opetushallitus, 2004, p. 2007.
[87] Metallityöväenliitto ry, “Teknisen huollon ja kunnossapidon työehtosopimuksen
allekirjoituspöytäkirja,” 2013. [Online]. Available:
http://www.metalliliitto.fi/documents/385493/862756/Tekninen_huolto_ja_kunn
ossapito_tes_+2013_2016.pdf/.
[88] Yrittäjät.fi, “Palkkalaskuri,” 2015. [Online]. Available: http://www.yrittajat.fi/fi-
FI/palkkalaskuri/.
[89] Board of Governors of the Federal Reserve System, “Industrial Production and
Capacity Utilization -G.17,” 2015. [Online]. Available:
http://www.federalreserve.gov/releases/g17/current/.
[90] Caterpillar, “777G Off-Highway Truck,” 2014. [Online]. Available:
http://s7d2.scene7.com/is/content/Caterpillar/C725187.
[91] K. Viilo, Ed., Crushing and Screening Handbook, 5th editio. Metso, 2011.
[92] pwc.com.au, “Productivity and Cost Management,” 2012. [Online]. Available:
https://www.pwc.com/id/en/asia-school-of-mines/assets/productivity-and-cost-
management_franz-wentzel.pdf. [Accessed: 16-Mar-2015].
[93] “Haul Cycle Analysis.” [Online]. Available:
http://files.carlsonsw.com/mirror/manuals/Carlson_2013/source/Surface_Mining/
Reserves_Timing/Haul_Cycle_Analysis/Haul_Cycle_Analysis.html. [Accessed:
16-Mar-2015].
[94] J. Parreira and J. Meech, “Simulation of an Open Pit Mine to Study Autonomous
Haulage Trucks,” in Canadian Institute of Mining, Conference and Exchibition,
2012, p. 9.
[95] K. E. Nils-Olof Nylund, “Heavy-duty Truck Emissions and Fuel Consumption
Simulating Real-world Driving in Laboratory Conditions,” in 2005 DEER
Conference, 2005.

73
[96] The Engineering Toolbox, “Fossil Fuels Energy Content,” 2014. [Online].
Available: http://www.engineeringtoolbox.com/fossil-fuels-energy-content-
d_1298.html. [Accessed: 12-Jan-2015].
[97] T. Rissanen, Kaivosteollisuuden teräkset, tekninen raportti. Lapin
ammattikorkeakoulu, 2014, p. 52.
[98] S. Lyden, “It’s a Lightweight Material World,” Work Truck Magazine, 2012.
[99] “Private Discussions with Pyhäsalmi Mine,” 2015.
[100] A. Thakur, C. E. Canter, and A. Kumar, “Life-cycle Energy and Emission
Analysis of Power Generation from Forest Biomass,” Appl. Energy, vol. 128, pp.
246–253, 2014.
[101] Metso Minerals, “Trellex Wear Catalogue,” 2014. [Online]. Available:
http://www.metso.com/miningandconstruction/MaTobox7.nsf/DocsByID/60620F
40DD456B7E482574DB004ED115/$File/2263_Trellex_WearCatalogue_EN.pdf
.
[102] Crimar, “Industrial Haul Truck Liners.” [Online]. Available:
http://www.infomine.com/suppliers/PublicDoc/CRIMAR/TruckBedLiners.pdf.
[103] ESCO, “Truck Bed Liners,” 2014. [Online]. Available:
http://www.escocorp.com/EN/service/Pages/Truck-Bed-Liners.aspx.
[104] Macsteel, “Bolts for Liners.” [Online]. Available:
http://www.macsteel.co.za/files/macsteel_vrn_-_bolts.pdf.
[105] H. S. Chen, P. T. Tseng, and S. F. Hwang, “Failure Analysis of Bolts on an End
Flange of a Steam Pipe,” Eng. Fail. Anal., vol. 13, pp. 656–668, 2006.
[106] Z. Yu and X. Xu, “Failure Analysis of Connecting Bolts and Location Pins
Assembled on the Plate of Main-shaft Used in a Locomotive Turbochanger,”
Eng. Fail. Anal., vol. 15, pp. 471–479, 2008.
[107] Caterpillar, “CAT C9 For Lightweight Heavy Duty Performance,” 2007.
[Online]. Available: http://www.cat.com/en_AU/power-systems/industrial-
oem/industrial-diesel-engines-lesser-regulated-non-regulated/18396452.html.
[Accessed: 06-Mar-2015].
[108] Wärtsilä, “Materials, Engines,” Products and Environmental Aspects, 2015.
[Online]. Available: http://www.wartsila.com/en/sustainability/environmental-
responsibility/products-environmental-aspects/materials. [Accessed: 14-Jan-
2015].
[109] Caterpillar, “Engine Systems Diesel Engine Analyst,” 2013. [Online]. Available:
http://www.slideshare.net/wilbort/engine-systems-diesel-engine-analyst-part-
1?related=1.

74
[110] Caterpillar, “Operation and Maintenance Manual,” 2010. [Online]. Available:
https://safety.cat.com/cda/files/2452776/7/SEBU7790-09 M.pdf.
[111] J. Betz, “10. Materials and Their Selection,” in Handbook of Diesel Engines,
Springer-Verlag Berlin Heidelberg, 2010.
[112] Y. Zhang, J. Wang, and F.-X. Ai, “Determination of the Wear of Internal
Combustion Engine Components Based on Measurement of the Oil Spectrum,”
Proc. Inst. Mech. Eng. Part D J. Automob. Eng., vol. 224, no. 11, pp. 1451–1457,
Nov. 2010.
[113] Eurotire, “EROCK tire specs,” 2014. [Online]. Available:
http://www.eurotire.net/tires/27-00r49-erock/.
[114] L. Ntziachristos and P. Boulter, “Road Vehicle Tyre and Break Wear,” in
EMEP/EEA emission inventory Guidebook, 2009, pp. 1–34.
[115] H. D. van der G. H. ten Broeke, J. Hulskotte, “Road traffic Tyre Wear,” in
Emission Estimates for Diffuse Sources Netherlands Emission Inventory, no.
September, 2008, p. 27.
[116] “Material Obtained from Pyhäsalmi Mine Visit 25.2.2015.”
[117] Rengasonline.com, “Vannemerkit,” 2015. [Online]. Available:
http://www.rengas-online.com/vannemerkit.html. [Accessed: 02-Feb-2015].
[118] Nokian Renkaat, “Vanteet raskaille renkaille,” 2014. [Online]. Available:
http://www.nokianraskaatrenkaat.fi/rengasturvallisuus_vanteet.
[119] Caterpillar, “Maintenance Intervals, Operation and Maintenance Manual
Excerpt,” 2010. [Online]. Available:
https://safety.cat.com/cda/files/2452950/7/SEBU6155-02 M.pdf.
[120] Nokian Renkaat, “Kuorma ja linja-auton renkaiden hinnasto 1.6.2012,” 2012.
[121] Goodyear, “Kuorma- ja linja-autojen renkaat,” 2014.
[122] Bridgestone, “Kuorma-auton renkaat, hinnasto 2013,” 2013.
[123] Synlube, “Oil Filter Price List,” 2015. [Online]. Available:
http://www.synlube.com/pricelist.htm. [Accessed: 12-Jan-2015].
[124] Nextag.com, “Motor Breather Prices,” 2015. [Online]. Available:
http://www.aliexpress.com/price/fuel-tank-vent_price.html. [Accessed: 28-Feb-
2015].
[125] SSAB, “Private Discussions,” 2015.
[126] ETF Mining Trucks, “Innovative Mining Haul Train,” 2105. [Online]. Available:
http://www.etftrucks.eu/Haul-Trains/.

75
[127] Nanosteel, “Haul Truck Bed Liner Life Increased by 400%+,” 2015. [Online].
Available: https://nanosteelco.com/markets/mining/haul-truck-bed-wear-plate.
[Accessed: 02-Mar-2015].
[128] Metso, “LT140 Mobile Crusher Technical Data,” 2008.
[129] B. P. Numbi, J. Zhang, and X. Xia, “Optimal Energy Management for a Jaw
Crushing Process in Deep Mines,” Energy, vol. 68, pp. 337–348, Apr. 2014.
[130] “Private Discussions with Metso Minerals,” 2015.
[131] D. Legendre and R. Zevenhoven, “Assessing the Energy Efficiency of a Jaw
Crusher,” Energy, vol. 74, pp. 119–130, Sep. 2014.
[132] D. Tromans, “Mineral Comminution: Energy Efficiency Considerations,” Miner.
Eng., vol. 21, no. 8, pp. 613–620, Jul. 2008.
[133] FMC Technologies, “Syntron Heavy Duty Feeders,” 2008.
[134] Metso, “Lokotrack LT106, LT106S Product Presentation,” 2014.
[135] Caterpillar, “Cat C15 Technical information,” 2015. [Online]. Available:
http://www.cat.com/en_AU/power-systems/industrial-oem/industrial-diesel-
engines-highly-regulated/18375173.html. [Accessed: 06-Apr-2015].
[136] Martin Engineering, Foundations 3 The Practical Resource for Total Dust&
Material Control. 2002, p. 273.
[137] Sandvik, “Selection and Load Ratings of the Idlers for Belt Conveyors,” 1999.
[138] Ensalco, “Bearings and Bearing Inserts,” 2015. [Online]. Available:
http://www.ensalco.com/rollerpdfs/3.pdf. [Accessed: 18-Mar-2015].
[139] SPB Presion Ball Bearings, “Bearing Life& Load Rating,” 2012. [Online].
Available: http://www.spb-usa.com/info-life-load-rating.php. [Accessed: 06-Mar-
2015].
[140] W. Molnar, M. Varga, P. Braun, K. Adam, and E. Badisch, “Correlation of
Rubber Based Conveyor Belt Properties and Abrasive Wear Rates Under 2- and
3-body Conditions,” Wear, vol. 320, pp. 1–6, Dec. 2014.
[141] S. Zhang and X. Xia, “Modeling and Energy Efficiency Optimization of Belt
Conveyors,” Appl. Energy, vol. 88, no. 9, pp. 3061–3071, 2011.
[142] M. Betner, “Belt Wear Basics,” www.trucklink.com, no. March, 2005.
[143] M. Jansen, “The Development of Energy Optimised Conveyor Belts -A Joint
Project of the Conveyor Belt Group of ContiTech AG and RWE Power AG.pdf,”
World Min., no. 2., pp. 83–87, 2008.

76
[144] Integrated Publishing, “Tracks and Track Frames,” 2015. [Online]. Available:
http://www.tpub.com/basae/145.htm. [Accessed: 06-Feb-2015].
[145] W. Yan, L. Fang, K. Sun, and Y. Xu, “Effect of Surface Work Hardening on
Wear Behavior of Hadfield Steel,” Mater. Sci. Eng. A, vol. 460–461, pp. 542–
549, Jul. 2007.
[146] D. Xiaodong, S. Guodong, W. Yifei, W. Jianfeng, and Y. Haoyu, “Abrasion
Behavior of High Manganese Steel under Low Impact Energy and Corrosive
Conditions,” Adv. Tribol., vol. 2009, pp. 1–5, 2009.
[147] Metso, “Nordbeg C-sarjan murskaimet, kulutusopas,” 2010. [Online]. Available:
http://www.metso.com/fi/miningandconstruction/Mining_Construction_FI.nsf/W
ebWID/WTB-111010-22576-960FE/$File/C-Jaw_fi.pdf.
[148] Fazendomedia.com, “Industrial Equipment, Pusher,” 2015. [Online]. Available:
http://www.fazendomedia.com/pz1ed2d7e-czf35a05-pusher.html. [Accessed: 28-
Feb-2015].
[149] Metso, “C-Series Jaw Crushers.” [Online]. Available:
http://www.tracsa.com.mx/fichas-tecnicas/metso-nordberg-serie-c.pdf.
[150] C. Wasson, “Jaw Crusher Maintenance,” Pit and Quarry, 2014. [Online].
Available: http://www.pitandquarry.com/jaw-crusher-maintenance/.
[151] T. Mining&Minerals, “Tenova Bateman Mills,” 2012. [Online]. Available:
http://www.tenovagroup.com/pdf/brochure/78-SAG, AG, Rod, Ball Mills.pdf.
[152] Kiruna Mine, “Information received from Kiruna Mine Visit 20.10.2014.” .
[153] M. Lindqvist, “Energy Considerations in Compressive and Impact Crushing of
Rock,” Miner. Eng., vol. 21, no. 9, pp. 631–641, Aug. 2008.
[154] Outotec, “Outotec Grinding Technologies the Key to Successful Concentration,”
2013. .
[155] J. Sligar, “Component Wear in Vertical Spindle Mills Grinding Coal,” vol. 45,
no. 95, 1996.
[156] Metso, “Gearless Autogenous /Semi-Autogenous Mills,” 2010. [Online].
Available:
http://www.metso.com/miningandconstruction/MaTobox7.nsf/DocsByID/5C1F5
7281C8E40B1C1256C5A002BF06C/$File/Gearless AG SAG Mills EN.pdf.
[157] A. Doll and D. Barratt, “Overview of Mill Selection,” in Procemin 2010, VII
International MIneral Processing Seminar, 2010.
[158] Ohio Electric Motors, “What is the Average AC Induction Motor Life
Expectancy,” 2012. [Online]. Available:

77
http://www.ohioelectricmotors.com/what-is-the-average-ac-induction-motor-life-
expectancy-1016. [Accessed: 23-Mar-2015].
[159] D. Braitwaithe, “Mill Maintenance, It’s All in the Planning,” Outotec Australias
Querterly e-newsletter, 2009. [Online]. Available:
http://www.outotec.com/ImageVaultFiles/id_592/cf_2/Mill_maintanance-_it-
s_all_in_the_planning.PDF.
[160] Metso, “Longer Wear Life and Reduced Energy Consumption at Berezitovy Gold
Mine,” 2014. [Online]. Available:
http://www.metso.com/showroom/mining/longer-wear-life-and-reduced-energy-
consumption-at-berezitovy-gold-mine/.
[161] Globalpetrolprices.com, “Finland Diesel Prices, Liter,” 2015. [Online].
Available: http://www.globalpetrolprices.com/Finland/diesel_prices/. [Accessed:
16-Mar-2015].
[162] Energiateollisuus, “Energiavuosi 2014,” 2015. [Online]. Available:
http://energia.fi/kalvosarjat/energiavuosi-2014-sahko.
[163] “Aitik Automation,” International Mining, 2010. [Online]. Available:
http://www05.abb.com/global/scot/scot244.nsf/veritydisplay/b9d7277f5f5f051ec
125782300554244/$file/AITIKAUTOMATION.pdf.
[164] M. Cooney, “Is the CAT 797F Too Expensive? $5 Million, Options Extra.,”
Industry Tap Into News, 2013. [Online]. Available:
http://www.industrytap.com/is-the-cat-797f-too-expensive-5-million-options-
extra/1035.
[165] G. Keikkala, A. Kask, J. Dahl, V. Malyshev, and V. Kotomkin, “Estimation of
the Potential for Reduced Greenhouse Gas Emission in North-East Russia: A
Comparison of Energy Use in Mining, Mineral Processing and Residential
Heating in Kiruna and Kirovsk-Apatity,” Energy Policy, vol. 35, no. 3, pp. 1452–
1463, Mar. 2007.

1
APPENDIX A. CONVERSION FACTORS
1 Short ton= 907,185 kg (metric tons)
1 mile=1.61 km
1 Ounce, oz =2.83495231 × 10⁻⁵
tonnes
1 Inch= 0.0254 m
1 kNm=0.000277778 kWh
1 kW= 1000j/s
1 Mtoe= 11630 kWh
1 kWh= 3600 000 J
1 dollar=0.84 €

2
APPENDIX B. LIST OF MINES
Coal Mines
Mine Location Production,
Mt/year
Mine
Type
Established Until Lifetime,
years
Owner
Daunia Australia 0.95 SM 2013 BHP
Chaijiangou Mining China 1.10 Shenshua
Benga Mozambique 1.62 SM/UM 2012 Rio Tinto
EMM Indonesia Indonesia 2.00 Shenshua
Isaac Plains Australia 2.01 SM 2006 2017 11 Vale
Integra Coal Australia 2.45 SM/UM 1991 2031 40 Vale
Kestrel Coal Australia 2.55 UM 1999 Rio Tinto
Carborough Downs Australia 3.06 Vale
Poitrel Australia 3.39 2006 BHP
Drayton Australia 3.70 Shenshua
Moatize Mozambique 3.82 SM 2011 2042 31 Vale
Liuta Mine China 3.90 Shenshua
Dawson Australia 3.99 SM Anglo American
Mount Thorley Australia 4.20 SM/UM NA Rio Tinto
Cuncaota No 2
mine China 4.40
Shenshua
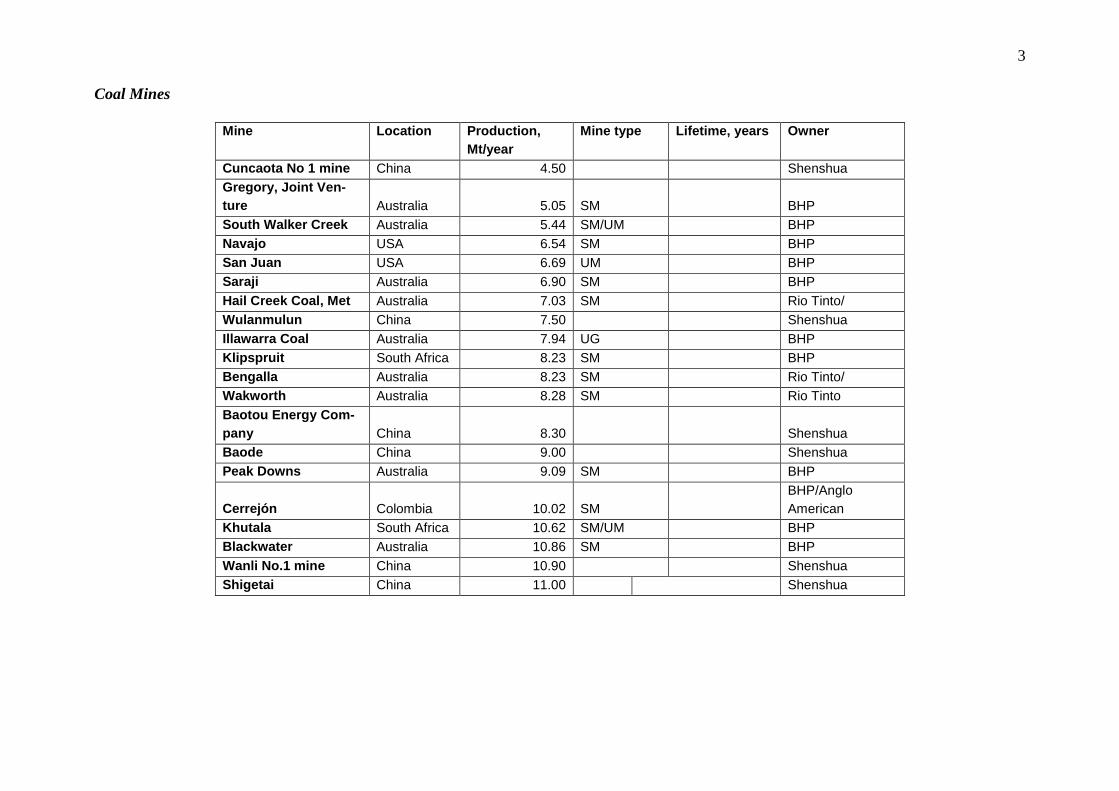
3
Coal Mines
Mine Location Production,
Mt/year
Mine type Lifetime, years Owner
Cuncaota No 1 mine China 4.50 Shenshua
Gregory, Joint Ven-
ture Australia 5.05 SM BHP
South Walker Creek Australia 5.44 SM/UM BHP
Navajo USA 6.54 SM BHP
San Juan USA 6.69 UM BHP
Saraji Australia 6.90 SM BHP
Hail Creek Coal, Met Australia 7.03 SM Rio Tinto/
Wulanmulun China 7.50 Shenshua
Illawarra Coal Australia 7.94 UG BHP
Klipspruit South Africa 8.23 SM BHP
Bengalla Australia 8.23 SM Rio Tinto/
Wakworth Australia 8.28 SM Rio Tinto
Baotou Energy Com-
pany China 8.30 Shenshua
Baode China 9.00 Shenshua
Peak Downs Australia 9.09 SM BHP
Cerrejón Colombia 10.02 SM
BHP/Anglo
American
Khutala South Africa 10.62 SM/UM BHP
Blackwater Australia 10.86 SM BHP
Wanli No.1 mine China 10.90 Shenshua
Shigetai China 11.00 Shenshua

4
Coal Mines
Mine Location Production,
Mt/year
Mine Type Lifetime,years Owner
Clermont Australia 11.78 SM Rio Tinto
Goonyella Riverside Australia 12.44 SM/UM BHP
Hunter Valley Australia 13.64 SM Rio Tinto
Shangwan China 14.70 Shenshua
Halagou China 14.80 Shenshua
Middleburg South Africa 16.30 SM BHP
Bu'ertai China 16.40 Shenshua
Yujialiang China 17.10 Shenshua
Mt Arthur Australia 18.01 SM BHP
Beidian Shengli
Enenrgy China 18.80 Shenshua
Bulianta China 27.10 Shenshua
Ha'erwusu Branch China 30.50 Shenshua
Heidaigou China 30.80 Shenshua
Shenbao Energy China 31.40 Shenshua
Daliuta-Huojitu China 34.70 Shenshua

5
Iron Mines
Mine Location Production,
Mt/year
Mine Ty-
pe
Grade Lifetime,
years
Comments Owner
Thabazimbi
South
Africa 0.6 SM 60.5
Part of Kumba
iron ore Anglo American
Mt Golds-
worthy Yarry Australia 1.3 BHP
Urucum Brazil 2 SM 62.3 25 Vale
Mar Azul Brazil 4.2 SM Vale
Agua Limpa Brazil 4.4 SM 42.2 16 Vale
Corumbá Brazil 4.5 SM Vale
Gonco Soco Brazil 4.7 SM NA Vale
Abóboras Brazil 5.4 SM 40.7 46 Vale
Córreco do
Feiao Brazil 5.8 SM NA Vale
Tamanduá Brazil 6.7 SM 49.2 45 Vale
Jangada Brazil 6.9 SM 66.6 7 Vale
Capao Xa-
vier Brazil 9.2 SM 65 14 Vale
Fazendao Brazil 9.3 SM 43.2 72 Vale
Capitao do
mato Brazil 9.9 SM 46.5 61 Vale
Hamersley,
Eastern
Range Australia 10.1 SM 62.7 Rio Tinto
Kolomela
South
Africa 10.8 SM 64.4
Part of Kumba
iron ore Anglo American

6
Iron Mines
Mine Location Production,
Mt/year
Mine Ty-
pe
Grade Lifetime,
years
Comments Owner
Hamersley,
Channar Australia 11.0 SM 62.9 Rio Tinto
Segredo Brazil 12 SM 48.7 44 Vale
Fábrica Nova Brazil 12.5 SM 41.8 35 Vale
Iron Ore
Company Canada 15.4 SM 65 Rio Tinto
Alegria Brazil 15.8 SM 45.4 33 Vale
Caue Brazil 15.9 SM 50.8 46
With the name
minas do Meio Vale
Hope Down Australia 16.9 SM NA
Production 1/2
of 2 sites, Vale
Conceicäo Brazil 18.1 SM 46.1 68
Average 18.4 Vale
Sapacado Brazil 19 SM 44 105 Vale
N4E Brazil 19.9 SM 66.5 44 Vale/BHP
Robe River Australia 20.8 SM 56.9
Production 1/3
of 3 sites Rio Tinto
Samarco Brazil 21.8 SM 39.7 53 LKAB
Hamersley Iron,
Nammuldi Australia 22.2 SM 62.6
Production 1/6
of 6 sites Vale
Kiruna Sweden 25.3 UM
Includes
Svappavaara&
Malmberget Anglo American
Brucutu Brazil 28.7 SM 49.3 29 Vale

7
Mine Location Production,
Mt/year
Mine Ty-
pe
Grade Lifetime,
years
Comments Owner
Sishen
South Afri-
ca 30.9 SM 59.1 Rio Tinto
N4W Brazil 31.3 SM 66.4 38 BHP/
Mt. Goldswothy
Area C Australia 52.6 Vale
N5 Brazil 53.6 SM 67.2 37 BHP
Newman Australia 62.4 SM Rio Tinto
Other Metal Mines
Mine Mineral(s) Mined Location Producti-
on, Kt/year
Mine type Grade Lifetime,
years
Com-
ments
Owner
Codemine Ni 9 SM 1.30 Anglo American
Fakcondo Ni 9 SM 4.90 Glencore Xtrata
Tres Valles Cu Chile 11 SM/UM Vale
Lumwana Cu Zambia 12 Barrick
Grasberg Cu/Au/Ag Indonesia 16 SM/UM
1.01/0.84/
4.26 Rio Tinto
Pinto Val-
ley Cu/Ag USA 17 BHP
VNC Co/Ni
New Cale-
donia 17 SM 0.11/1.42 32 Vale

8
Other Metal Mines
Mine Mineral(s)
Mined
Location Producti-
on, Kt/year
Mine type Grade Life-
time,
years
Comments Owner
Palabora Cu South Africa 22 UM Rio Tinto
Lubambe Cu Zambia 23 UM Vale
Kevitsa Ni/Cu/Au Finland 24 SM FQM
External Cu Canada 24 Vale
Barro Alto Ni 25 SM 1.55 Anglo American
Raventhorpe Ni Australia 38 FQM
Northparkes Cu/Ag Australia 51 UM Rio Tinto
Cerro Matoso Ni Colombia 51 SM 0.77 60 BHP
Leinster 52 SM/UM 44.70 43 BHP
Mt.Keith 52 SM 0.87 21 BHP
Mantos Blan-
cos Cu 55 SM 0.78 Anglo American
Quabrada
Blanca Au/Pl/Pa/Oz Chile 56 SM 0.41 Teck
Mantoverde Cu 57 SM 0.53 Anglo American
Cayell Cu/Zn Turkey 58 UM 3.1/3.6 FQM
Salobo Cu/AU Brazil 65 SM 0.71/0.4 53 Vale
Oyu Tolgoi Cu/Au/Ag Mongolia 77 SM
0.46/0.26/
2.08 Rio Tinto

9
Other Metal Mines
Mine Mineral(s) Mined Location Produc-
tion,
Kt/year
Mine
type
Grade Life-
time,
years
Comments Owner
Carmen de
Andacollo Cu Chile 81 SM 0.44 Teck
Sudbury
Cu/Ni/Co/Pl/Pal/A
u Canada 103 UM
1.51/1.25/0.
04/0.9/1.1/0
.4 154 Vale
Voisey Bay Cu/Co/Ni Canada 107 SM
1.34/0.11/2.
38 17 Vale
Highland Val-
ley Copper Cu USA 113 SM 0.29 Teck
Cerro Colorado Cu Chile 116 SM 0.29 BHP
Spence Cu Chile 116 SM 0.38 BHP
Sossego Cu/Au Brazil 119 SM NA/0.2 20 Vale
Olympic Dam Cu/Au/Ag Australia 166 UM
1.92/0.007/
0.004 BHP
Bingham Ca-
nyon Cu/Au/Ag/Mo USA 211 SM
0.47/0.19/2.
08/0.043 Rio Tinto
Lake Johnston Ni Australia 230 1.38
Was shut
down 2013 Norilsk
Cannigton Pb/Ag/Zn 270 SM/UM
4.455/0.14/
2.81 BHP
Antamina Cu/Ag/Zn/Mo Peru 289 SM
0.89/0.008/
1.88/NA BHP

10
Other Metal Mines
Mine Mineral(s) Mined Location Produc-
tion,
Kt/year
Mine type Grade Lifetime,
years
Com-
ments
Owner
Thompson Cu/Ni/Co Canada 319 UM 1.75 72 Vale
Red Dog Zn USA 623 SM 15.80
Age, Ap-
paluk
mine Teck
Kaula Ni/Cu Russia 788 UM 1.30 Norilsk
Escondida Cu/Au/Ag/Zn Chile 957 SM 0.88
Two
mines
BHP/ Rio
Tinto
Kazzinc, Ma-
leevsky Zn/Pb/Cu/Au 2300
6/1/1.9/0.6/6
0
Glencore
Xtrata
Alumar Alumina Brazil 3347 48.90 BHP
Taimyrsky Ni/Cu/PGM Russia 3415 UM 1.30 Norilsk
Hotazel, Mamat-
wan Manganese
South Afri-
ca 3930 SM/UM 37.60
Producti-
on,Mamat
wan BHP
Worsley Alumina Australia 4273 31.00 BHP
Oktyabrskoye Ni/Cu/PGM Russia 4999 UM 1.30 Norilsk
Komsomolsky Ni/Cu/PGM Russia 5586 UM 1.30 Norilsk
Severny Ni/Cu Russia 6558 SM/UM 1.30 Norilsk
Gove Bauxite Australia 8029 SM 49.30 Rio Tinto
GEMCO Manganese Australia 8378 SM 46.50 BHP
Sangaredi Bauxite Guinea 15437 SM 49.60 Rio Tinto
Porto Trombetas Bauxite Brazil 15729 SM 49.50
Weipa Bauxite Australia 26341 SM 52.10

11
Precious Metal Mines
Mine Mineral
mined
Location Production
Koz/year
Mine type Grade Comments Owner
Akyem Au Ghana 0.1 SM 1.72 Newmont
La Herradura Au Mexico 0.2 SM 0.68 Newmont
Batu Hijau Au/Cu Indonesia 0.2 SM 0.23 Newmont
Ahafo Au Ghana 0.6 SM/UM 1.96 Newmont
Boddington,
Open Pit
Au/Cu Australia 0.8 SM 0.7 Newmont
Yanacocha Au Peru 1.0 SM 0.83 Newmont
Wharf Au USA 56.2 SM 0.7 Goldcorp
El Sauzal Au Mexico 80.6 SM 1.13 Goldcorp
Ruby Hill Au USA 91 SM Barrick
Golden Sun-
light
Au USA 92 SM Barrick
Bald Moun-
tain
Au USA 94 SM Barrick
Pierina Au Peru 97 SM Barrick
Williams Au Canada 102 SM Hemlo mine site Barrick
David Bells Au Canada 102 UM Hemlo mine site Barrick
BMarigold Au USA 108 SM Goldcorp
Marlin Au Guatemala 202 UM 3.1 Goldcorp
Musselwhite Au Canada 256 UM 5.59 Goldcorp
Porcupine Au Canada 292 UM 1.19 Goldcorp
Cowal Au Australia 297 SM Barrick

12
Precious Metal Mines
Mine Mineral
mined
Location Production
Koz/year
Mine type Grade Comments Owner
Alumbreta Au Argentina 313 SM Goldcorp
Los Filos Au Mexico 332 SM/UM 1.07 Goldcorp
Peñasquito Au Mexico 404 SM 0.27 Goldcorp
Red lake Au Canada 493 UM 16.34 Goldcorp
Porgera Au Papua new
Guinea
507 SM Barrick
Lagunas
Norte
Au Peru 606 SM Barrick
Veladero Au Argentina Barrick
Pueblo Viejo Au/Ag/Cu Dominican
Republic
813. SM 2.42/13.31/0.09 Barrick
Gold Strike Au USA 892 UM Barrick
Cortez Au USA 1340 SM Barrick
Nevada Au USA 1768 0.58 Newmont
Industrial Mineral Mines
Mine Location Mineral
mined
Production,
Mt/year
Mine type Grade Lifetime,
years
Owner
Patos de Minas Phosphate 0.1 Vale
Patience lake Candada Potash 0.3 PotashCorp

13
Industrial Mineral Mines
Mine Location Mineral
mined
Production,
Mt/year
Mine type Grade Lifetime,
years
Owner
Khewra Pakistan Salt 0.4
Pakistan Mineral Deve-
lopement Corporation
Rio Tinto
Minerals USA Boron 0.5
SM
Rio Tinto
New
Brunswick Potash 0.6
PotashCorp
Cajati Phosphate 0.6 5.2 65 Vale
Cataláo Phosphate 1.1 10.4 38 Vale
Araxá Phosphate 1.1 11,7 50 Vale
Allan Canada Potash 1.2 PotashCorp
Cory Canada Potash 1.5 PotashCorp
Tapira Phosphate 1.9 6.8 Vale
Rocanville Canada Potash 2.0 PotashCorp
Lanigan Canada Potash 2.2 PotashCorp
Boucraa Phosphate 2.4 OCP
Bayóvar Phosphate 3.5 15.5 Vale
Youssoufia USA Phosphate 3.6 OCP
White
Springs Phosphate 3.7
PotashCorp
Bengueir Canada Phosphate 4.4 OCP
Aurora Australia Phosphate 6.0 PotashCorp
Dampier
Salt Salt 9.8
SM
Rio Tinto
Khourigba Phosphate 18 OCP
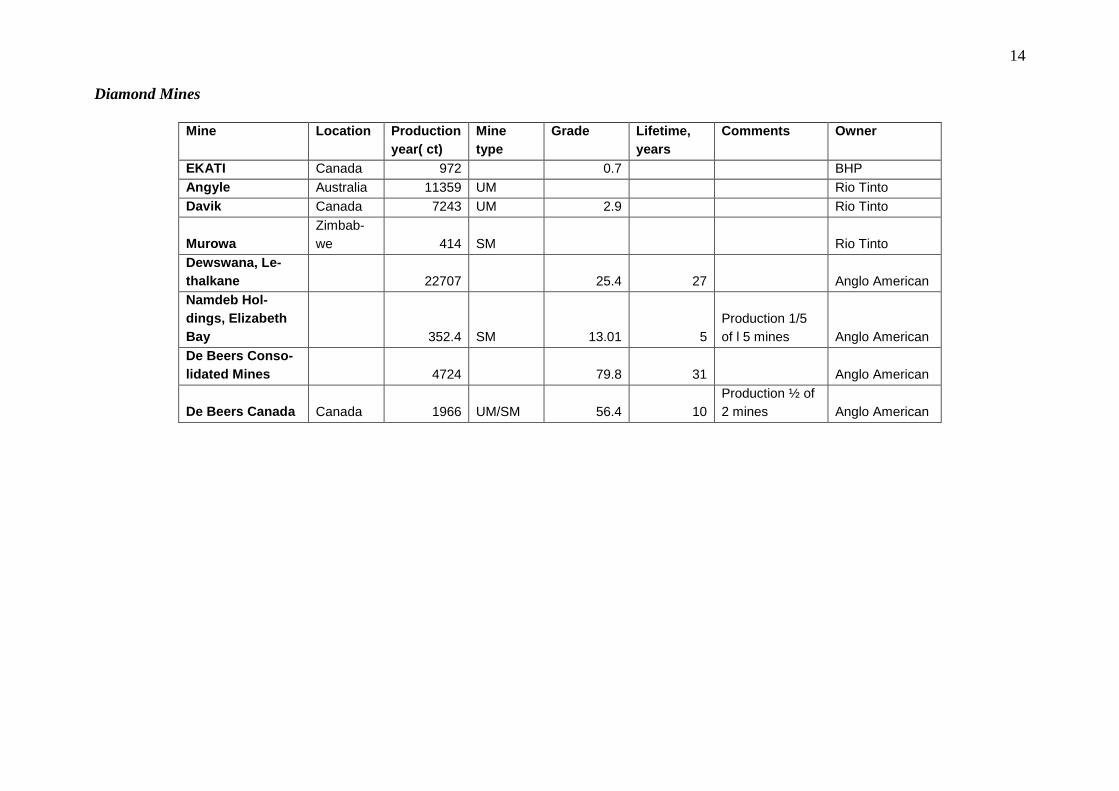
14
Diamond Mines
Mine Location Production
year( ct)
Mine
type
Grade Lifetime,
years
Comments Owner
EKATI Canada 972 0.7 BHP
Angyle Australia 11359 UM Rio Tinto
Davik Canada 7243 UM 2.9 Rio Tinto
Murowa
Zimbab-
we 414 SM Rio Tinto
Dewswana, Le-
thalkane 22707 25.4 27 Anglo American
Namdeb Hol-
dings, Elizabeth
Bay 352.4 SM 13.01 5
Production 1/5
of l 5 mines Anglo American
De Beers Conso-
lidated Mines 4724 79.8 31 Anglo American
De Beers Canada Canada 1966 UM/SM 56.4 10
Production ½ of
2 mines Anglo American