weakly half-factorial sets in finite abelian groups - karl-franzens
TRANSCRIPT

DIF Detection and Interpretation in Large-Scale Science Assessments:
Informing Item Writing Practices1,2
April L. Zenisky and Ronald K. Hambleton
University of Massachusetts Amherst
and
Frederic Robin
Educational Testing Service
March 17, 2003
1 Center for Educational Assessment MCAS Validity Report No. 1. (CEA-429). Amherst, MA:
University of Massachusetts, School of Education, Center for Educational Assessment. 2 The research was completed as part of a contract between the Massachusetts Department of
Education and the University of Massachusetts Amherst. However, the Department of
Education is not responsible for any errors that remain in the paper nor should it be assumed
that they agree with the findings and conclusions.

2
Abstract
Differential item functioning (DIF) analyses are a routine part of the development of
large-scale assessments. Less common are studies to understand the potential sources of DIF.
The goals of this study were (1) to identify gender DIF in a large-scale science assessment, and
(2) to look for trends in the DIF and non-DIF items due to content, cognitive demands, item type,
item text, and visual-spatial/reference factors. To facilitate the analyses, DIF studies were
conducted at three grade levels, and for two randomly-equivalent forms of the science
assessment at each grade level (administered in different years). The DIF procedure itself was a
variant of the “standardization procedure” of Dorans and Kulick and was applied to very large
sets of data (six sets of data, each involving 60,000 students), and has the advantages of being
easy to understand and to explain to practitioners. Several findings emerged from the study that
would be useful to pass on to test development committees. For example, when there is DIF in
science items, multiple-choice items tend to favor males and open-response items tend to favor
females. Compiling DIF information across multiple grades and years increases the likelihood
that important trends in the data will be identified and item writing practices are informed by
more than anecdotal reports about DIF.

3
Introduction
Large-scale state testing programs usually include studies to detect the presence of
differential item functioning (DIF) as a routine part of field-testing and regular test
administrations. When DIF is found during field-testing, the normal course of action is to delay
operational use of the item or items exhibiting DIF, returning any DIF items to item writers for
review and revision. When items are found to show DIF on operational test administrations, a
common practice is to try and identify the causes of DIF, and delete those items that are judged
to introduce unfairness into the test.
Both solutions, while reasonable in the context of dealing with DIF after administration
of items to examinees, are comparatively unsatisfactory from a test development perspective
because they are reactive rather than proactive. Delaying the use of items, or deleting them from
an assessment can impact content and cognitive domain coverage. And, if the decision is made to
leave any problematic DIF items in a test, examinees with the same level of proficiency from
different subgroups of interest (e.g., males and females) are likely to be assigned different test
scores. Either way, the validity of test scores is compromised, and the presence of DIF clearly
raises questions about the legitimacy of linking consequences (such as high school graduation or
school funding) to test scores.
While DIF detection has become routine in testing programs, studies to understand (not
just detect) potential sources of DIF are rarely carried out. Efforts in this regard can be aided by
using results from multiple differential item functioning analyses (over forms, over levels, and
even over years) to generate hypotheses about the sources of DIF, and then to provide this
information to item writers to improve the item writing process (Gierl, et al., 2001; Camilli &
Shepard, 1994; AERA, APA, & NCME, 1999). The goal is not to look narrowly at individual

4
DIF items, but rather to look comprehensively at many DIF as well as non-DIF items across
forms, levels, and years to identify patterns in the DIF findings.
This alternative approach involves using the statistical information identifying each item
as DIF or non-DIF to complete careful study of groups of test items in the context of various
item attributes, and searching out possible sources of or patterns to the occurrence of DIF in test
data. By combining analyses over items and over tests, hypotheses as to sources of DIF can be
checked with more confidence because of the presence of more items for analysis. It may be
particularly instructive in this regard to pay attention to any relationships or obvious differences
that can be determined between items found to be DIF and those where DIF is not present (a kind
of causal-comparative experimental study). Some possible sources for such trends include item
content, item type or format, the content and cognitive dimensions associated with items,
negatively worded item stems, and the presence of pictures or other reference materials (such as
tables, charts, and diagrams). It may be possible to gain considerable insight about the potential
causes of DIF by considering the statistical evidence of item-level DIF in light of such item
attributes. Then, by communicating those results to item writers, any patterns or trends detected
can be used to assist in developing a protocol for creating items less like those found to be
inappropriate. Items identified as DIF are not necessarily deleted from future tests but these
items are among those that need to be carefully reviewed prior to their use again.
The goals of this study were twofold. First, potential sources of observed gender DIF in a
large-scale state science and technology assessment were identified by statistical analyses to
detect evidence of DIF at the item level. These results across three levels and two forms were
then studied for possible larger trends relating to content domain, cognitive dimensions, item
type, item text, and visual-spatial/reference components that could be used to formulate
guidelines for item development.

5
Background on Interpreting DIF
A substantial amount of research over the years has resulted in the development of
numerous methods to detect DIF, among them the Mantel-Haenszel statistic (Holland & Thayer,
1988), logistic regression (Swaminathan & Rogers, 1990), IRT (see Hambleton, Swaminathan, &
Rogers, 1991), standardization (Dorans & Holland, 1993; Dorans & Kulick, 1986), and the
SIBTEST (Shealy & Stout, 1993) procedure. The question of how to put this statistical
information to best use has drawn somewhat more limited study, although several recent studies
have turned to the matter of trying to methodologically understand and/or predict the occurrence
of DIF in a variety of subjects or contexts (e.g., Bridgman & Lewis, 1996; Burton, 1996; Harris
& Carlton, 1993; Lane, Wang, & Magone, 1996; Ryan & Fan, 1996; Wainer & Steinberg, 1992).
Interestingly, most of this research has been carried out with mathematical ability tests.
Research on sources of DIF in science has been completed by Hamilton and Snow (1998)
and Hamilton (1999). They looked at the National Education Longitudinal Study of 1988
(NELS: 88; for information on this assessment program see Hafner, et al., 1990; also, see Ingels,
1990). Evidence was found that male examinees performed differentially better than female
students (when matched on total test score) on items requiring spatial reasoning or visual
content. Differences in course-taking and exposure to science outside of school were also
mentioned as potential causal explanations for the observed DIF.
Other investigations into interpreting DIF at the item level include Allalouf, Hambleton,
and Sireci (1999) who considered causes of DIF in translated verbal items, as well as the work of
Stricker and Emmerich (1999). The latter study focused on interest, familiarity, and emotional
reaction as ways that might be helpful in explaining why some items were DIF and others were
not. Educational Testing Service (1998), in the context of fairness reviews, has detailed several
topics and characteristics to avoid in item writing/test development. Among these are specialized

6
military topics, detailed sports knowledge, violence or harm, and unnecessarily difficult words or
syntactic structures that are irrelevant to the purpose of the test.
In addition to the results from those studies, the process of detecting and interpreting in
various DIF analyses has been aided by recent investigations into approaches to identify
simultaneous DIF. This condition refers to the occurrence of a set of items (associated by some
organizing principle such as “includes a figure,” “involves a negative stem,” or “are the last few
items in a test”) in which each item exhibits DIF. The collective differential impact of such sets
for different examinee subpopulations can be termed DIF amplification, and recent research has
referred to such item sets as bundles (Nandakumar, 1993; Douglas, Roussos, & Stout, 1996;
Gierl, et al., 2001). Much of the research with bundles has come about through developments in
and studies with dimensionality-based DIF hypotheses (Shealy & Stout, 1993; Douglas, Roussos,
& Stout, 1996) where the methodology involves statistical testing of the bundles for evidence of
DIF, rather than consideration of separate item-level DIF indices. For example, Ryan and Chiu
(2001) considered mathematics DIF in this bundle framework, which is referred to in the
literature as differential bundle functioning (DBF). In focusing on item order effects they found
that levels of gender DIF were not substantially related to the sequence in which the items they
looked at were presented.
Research Method
Data
The data used in this study were item-level responses from approximately 360,000
students participating in a large-scale state science and technology assessment program at each
of three education levels—tests were administered at the elementary school (ES), middle school
(MS), and high school (HS) levels. At each education level, data was obtained from two forms (1
and 2). The forms corresponded to two different administrations of the assessment a year apart.

7
Each test contained between 32 and 42 items, and both multiple-choice and constructed response
(CR) items were used on each test form: About half the total points on each test came from each
item type. Multiple-choice items were scored dichotomously; constructed response items were
scored on a range of score categories from 0 to 3. No items were common across forms or
across levels, but tests at each level across forms were built from the same test specifications
with regard to content and cognitive skills, and the test specifications were generally similar
across levels as well. In total, six data sets were evaluated for evidence of gender DIF: 3
education levels (ES, MS, and HS) x 2 test forms (1 and 2).
DIF Detection Procedure
The DIF procedure used in this study is called the “weighted two-stage conditional p-
value comparison procedure” and was carried out comparing the conditional item performance of
males and females matched on an internal criterion. This procedure is closely aligned with the
standardization procedure introduced by Dorans and Kulick (1986) with minor modifications
(e.g., a two-stage procedure was used in this study). These analyses were aided by means of the
STDIF computer program (Robin, 2001). The procedure used is detailed in Zenisky, Hambleton,
and Robin (2003): in short, examinees are first matched on total test score, and an overall DIF
statistic (Dorans & Kulick, 1986) is then computed for each item. The DIF statistic is the average
of the weighted item mean performance difference between males and females computed at each
of the possible scores on the test. It should be mentioned that for CR items scored on a 0 to 3
scale, the scores were rescaled to a scale 0 to 1 prior to carrying out the DIF analyses so that the
interpretation of the DIF statistics would be the same for all item types. The full value of the CR
items was used, however, in calculating the total test score for each examinee.
The conditional male-female item performance difference at each test score was weighted
by the proportion of the total candidates obtaining the score so that the distributions of the male
8
and female test scores could be taken into account in the analyses. A positive-valued DIF statistic
would show conditional differences favoring males, while a negative-valued statistic would show
conditional differences favoring females. The primary advantages of this procedure are that it is
easy to understand and explain to practitioners, and any patterns in item performance across
groups of interest are easy to spot because of the large samples used in the analyses.
Presentation of the information in graphical form is especially appreciated by practitioners.
Graphical presentations are possible with all of the DIF procedures but they are not usually
provided.
Basically, with this procedure then, examinees in the two groups of interest are matched
on test score, and then item performance is compared. Any differences at a test score are then
averaged across the test scores where comparisons are made. Sometimes, a weighted average is
preferred (and it was in this study) because item performance differences obtained at test scores
where there are large numbers of examinees are often more important than item performance
differences where there are small numbers of examinees.
On the basis of the DIF statistics, a number of items on each test were identified as first-
stage DIF. Items with DIF statistics greater than ±.05 were considered worthy of further study
and investigation. This was an arbitrary choice and would lead to the detection of items showing
a very low level of DIF (20 items at this level of DIF, all showing DIF in the same direction,
would result in a one point total score difference between males and females). These items were
subsequently removed from the calculation of test scores, and then the DIF analyses were
repeated. In this way, examinees were matched on total test scores adjusted for any items
showing DIF in the test. The overall DIF statistic for each item was then recomputed for all
items, and these results from stage 2 provided a truer representation of the extent to which DIF
was present in the data (as shown by Zenisky, Hambleton, & Robin, 2003). This two-stage DIF

9
procedure removes some of the potential bias that may exist in the total score. At the same time,
it must be recognized that DIF is not an intrinsic property of a test item, but rather represents the
differential functioning of a test item in the context of other test items. Items showing a pattern
of item performance that differs from other items in the set are the ones identified as DIF.
Change the item context and DIF may disappear, or appear when it was not detected previously.
The goal in conducting DIF studies is to identify items in the context of the test in which they are
used where patterns of item responses may differ across gender, race, age, etc. Then, those items
that show DIF can be further investigated for potential shortcomings that may make them
unsuitable for use in a test.
To demonstrate the functionality of this statistic (in which differences across the score
scale are averaged), these conditional p-value differences for the reference and focal groups at
each possible score level can be plotted against one another to graphically represent the presence
(or absence) of DIF across the score scale. An example of a conditional p-value plot for an item
exhibiting substantial DIF in favor of the reference group is shown in Figure 1. The DIF statistic
for the item is 0.136 (putting the weights aside, there is an average p-value difference at each test
score of just over .13 or 13%). This plot shows about the maximum DIF we have observed in the
analysis of over 600 test items. This DIF procedure seems particularly useful following the
administration of a test to a large sample of examinees—conditioning on test score simplifies the
analysis, and because of the large sample, fitting smooth curves to the data is not necessary.

10
Figure 1. Example of a conditional item mean plot exhibiting DIF in favor of the reference
group.
0
0.2
0.4
0.6
0.8
1
1 11 21 31 41 51 61 71 81
Test Score
Proportion Correct
Reference
Focal
For the purpose of this study, items with weighted average absolute p-value differences
(the DIF statistic) between .05 and .08 (or -.05 and -.08) were defined as exhibiting minor DIF.
In cases where the DIF statistic for an item was greater than .08 (or lesser than -.08) the item was
classified as moderate-to-high DIF. Those items with DIF statistics between -.05 and .05 were
found not to exhibit DIF. Negatively signed items advantaged female examinees, while a
positively sign to the DIF index value indicated that male examinees performed better on the
item.
It is important to note that these thresholds for flagging items are lower than those that
would be used in operational test settings. However, the use of more sensitive (i.e., lower)
thresholds in this research was warranted given the goals of exploring potential sources of DIF in
large-scale test data and detecting larger trends in the occurrence of item-level between-group
differences.
Framework for Understanding Sources of DIF
Three variables or dimensions were available for classifying test items:

11
1. Content category. Each test item was defined by the test developers to assess one of
five content categories: earth and space sciences, technology, physical sciences,
inquiry, and life sciences.
2. Visual/spatial or reference component. A number of items on each test used pictures,
graphs, charts, or maps, as well as more text-based reference components such as
tables and text boxes. Halpern (1997) noted that females may not do as well as males
on items that require processing of such components, particularly within the domain
of mathematics.
3. Item type. The tests used in this study consisted of both multiple-choice (MC) and
open-response (OR) items. Open-response items are thought to assess different skills
than MC items, and some research has shown that male-female differences in science
are smaller on OR tests than MC tests (Bolger & Kellaghan, 1990; Mazzeo, Schmitt,
& Bleistein, 1993). On the other hand, evidence from Cole (1997) and Hamilton
(1999) does not clearly substantiate the presence of a format effect.
With each dimension, the goal was to search for possible patterns in the items being identified as
DIF. For each dimension, these analyses were completed by sorting items in each of the relevant
ways and inspecting the results for patterns in the DIF statistics. Perhaps in future studies other
variables might be considered such as the placement of items in a test (early versus late),
difficulty of vocabulary, and gender-relevant situations. Variables should be chosen much like
they might be in any causal-comparative study—they must be accessible to the researcher, and
appear potentially relevant as a causal explanation for the findings.
Results
Table 1 summarizes the observed DIF in the six science and technology tests (two forms
at three levels) according to the number of items at each level exhibiting minor and moderate-to-
12
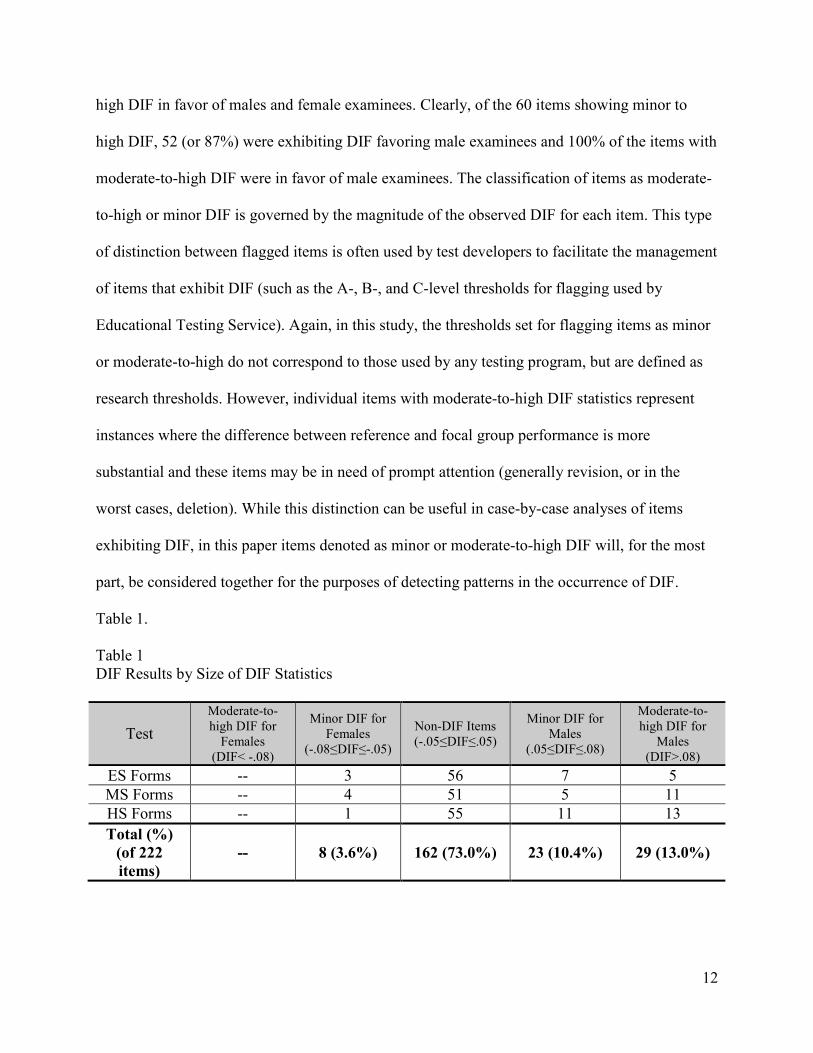
high DIF in favor of males and female examinees. Clearly, of the 60 items showing minor to
high DIF, 52 (or 87%) were exhibiting DIF favoring male examinees and 100% of the items with
moderate-to-high DIF were in favor of male examinees. The classification of items as moderate-
to-high or minor DIF is governed by the magnitude of the observed DIF for each item. This type
of distinction between flagged items is often used by test developers to facilitate the management
of items that exhibit DIF (such as the A-, B-, and C-level thresholds for flagging used by
Educational Testing Service). Again, in this study, the thresholds set for flagging items as minor
or moderate-to-high do not correspond to those used by any testing program, but are defined as
research thresholds. However, individual items with moderate-to-high DIF statistics represent
instances where the difference between reference and focal group performance is more
substantial and these items may be in need of prompt attention (generally revision, or in the
worst cases, deletion). While this distinction can be useful in case-by-case analyses of items
exhibiting DIF, in this paper items denoted as minor or moderate-to-high DIF will, for the most
part, be considered together for the purposes of detecting patterns in the occurrence of DIF.
Table 1.
Table 1
DIF Results by Size of DIF Statistics
Test
Moderate-to-
high DIF for
Females
(DIF< -.08)
Minor DIF for
Females
(-.08≤DIF≤-.05)
Non-DIF Items
(-.05≤DIF≤.05)
Minor DIF for
Males
(.05≤DIF≤.08)
Moderate-to-
high DIF for
Males
(DIF>.08)
ES Forms -- 3 56 7 5
MS Forms -- 4 51 5 11
HS Forms -- 1 55 11 13
Total (%)
(of 222
items)
-- 8 (3.6%) 162 (73.0%) 23 (10.4%) 29 (13.0%)

13
Dimension 1 Results: Content Category.
There were five content categories identified in the test specifications: earth and space
sciences, inquiry, life sciences, physical sciences, and technology. All of these were more or less
consistently emphasized in the test specifications at each grade level except inquiry, which was
substantially more extensively assessed at the ES and MS levels. These results are given in Table
2, and the content category results are summarized graphically (by level) in Figures 2, 3, and 4.
Table 2.
Content Category Results
(All items flagged advantage males unless otherwise noted)
Test
Earth and
Space Sciences Inquiry Life Sciences
Physical
Sciences Technology
# of
Items
#
Flagged
# of
Items
#
Flagged
# of
Items
#
Flagged
# of
Items
#
Flagged
# of
Items
#
Flagged
ES
Forms 14 4
1 15 2 15 3
2 11 3 16 3
MS
Forms 14 4 12 5
3 14 2 15 4 16 5
1
HS
Forms 18 9
1 5 1 19 2 22 6 16 7
Total:
All
Tests 46 17
2 32 8
3 48 7
2 48 13 48 15
1
1 One item is DIF in favor of female examinees.
2 Two of these items are DIF in favor of female examinees.
3 Three of these items are DIF in favor of female examinees.

14
Figure 2. Content Category Results: DIF Statistics for ES Test Items
Average W
eighted Absolute p-value Difference
.2
.1
0.0
-.1
-.2
Figure 3. Content Category Results: DIF Statistics for MS Test Items
Average W
eighted Absolute p-value Difference
.2
.1
0.0
-.1
-.2
Content Categories
ESS: Earth and Space
Sciences
Tech: Technology
PS: Physical Sciences
Inq: Inquiry
LS: Life Sciences
ESS Tech PS Inq LS
ESS Tech PS Inq LS
Content Categories
ESS: Earth and Space
Sciences
Tech: Technology
PS: Physical Sciences
Inq: Inquiry
LS: Life Sciences
Advantage for Females
Advantage for Females
Advantage for Males
Advantage for Males

15
Figure 4. Content Category Results: DIF Statistics for HS Test Items
Average W
eighted Absolute p-value Difference
.2
.1
0.0
-.1
-.2
`
Earth and space sciences. Of the 46 items assessing earth and space sciences
understanding across the two forms and three grade levels, 17 of these were flagged as DIF
(37%). Two of these were in favor of female examinees (both minor DIF), and the remaining 15
were in favor of males (6 minor DIF, 9 moderate-to-high DIF). Earth and space sciences DIF
was particularly concentrated at the HS level, where 9 of 18 earth and space sciences items were
categorized as DIF.
Inquiry. Eight of 32 inquiry items across all six tests (25%) were identified as DIF in this
analysis. As noted previously, inquiry is only minimally tested in the HS test; accordingly, only
one of the flagged items was from that grade level. On the other hand, inquiry was extensively
covered in the ES test but only two items there were flagged (of 15 items total). The remaining
five flagged inquiry items were found on the MS test, where a total of 12 inquiry items were
present. Of these five, three were in favor of females and two advantaged males.
Content Categories
ESS: Earth and Space
Sciences
Tech: Technology
PS: Physical Sciences
Inq: Inquiry
LS: Life Sciences
ESS Tech PS Inq LS
Advantage for Females
Advantage for Males

16
Life sciences. This is the content category with the fewest DIF items (seven of 48 items,
or roughly 15%). Two of these were minor DIF in favor of females, four were minor DIF in
favor of males, and the other two were moderate-to-high DIF in favor of males. For the most
part, however, performance was largely even at all levels, with just one or two items flagged on
each test.
Physical sciences. Approximately 27% of the physical sciences items were flagged (13 of
48), and all of these were found to be in favor of male examinees. Four items exhibited minor
DIF, while nine were moderate-to-high DIF in favor of males. Amounts of DIF were very
consistent across grade levels for this content category. Approximately 27% of the physical
sciences items at each grade level were identified as DIF.
Technology. Fully 31% of the technology items across the six tests were found to be
either moderate-to-high or minor DIF (15 of 48 items). Nearly all of these (14) advantaged male
examinees, while just one item was DIF in favor of females. The differences in performance
were particularly evident at the HS level, where seven of the flagged technology items were
located. These seven items represented nearly 50% of the technology items administered to
examinees on the HS tests.
Dimension 2 Results: Visual-Spatial/Reference Components
Approximately 37% of the items on each of the tests contained a visual-spatial or
reference dimension (82 of 222 items). Items identified in this way include one (71 items) or two
(11 items) of the following: map, bar chart, line graph, flow chart, diagram, timeline, picture,
periodic table, table, text box, measurement/ruler, list, picture answer choices, and diagram
answer option. Most common among these on the tests are maps (7 items), diagrams (9 items),
tables (14 items), pictures (11 items), text boxes (8 items), diagram answer option (12 items),
line graphs (7 items), and picture answer choices (12 items). Of the 82 items with at least one

17
visual-spatial or reference component across the tests studied, 25 of these (30%) were flagged as
either minor or moderate-to-high DIF (Table 3). In contrast, among the 140 items with no visual-
spatial or reference aspects, 37 items (26%) were flagged.
Table 3
Visual-Spatial/Reference Component Results
(All items flagged in favor of males unless otherwise noted)
Non-Text/Reference
Dimension
ES
forms
MS
forms
HS
forms
Totals:
All
Tests
Picture answer
choices
Total 3 2 7 12
Flagged 1 1 5 7
Diagram
Answer
Total 5 3 4 12
Flagged -- -- -- --
Table Total 6 6 3 15
Flagged -- 24 1 3
Map Total 2 1 4 7
Flagged 2 -- 2 4
Picture Total 7 3 1 11
Flagged -- -- -- --
Line Graph Total 2 4 1 7
Flagged -- 1 -- 1
Flow Chart Total 2 1 -- 3
Flagged 1 -- -- 1
Bar Chart Total 2 1 -- 3
Flagged -- -- -- --
Text Box Total -- 3 5 8
Flagged -- 1 -- 1
Diagram Total -- 4 6 10
Flagged -- 3 41 7
List Total 1 -- 1 2
Flagged -- -- -- --
Measurement/
Ruler
Total 1 -- -- 1
Flagged -- -- -- 0
Periodic Table Total -- 1 1 2
Flagged -- -- -- 0
Timeline Total -- -- 1 1
Flagged -- -- 1 1
See page 12 for the explanation of footnote 1.
4 One item is DIF in favor of female examinees.

18
Seventeen of the 25 flagged items with a visual-spatial/reference dimension were
concentrated within three specific types of such components. Four flagged items had maps (of
seven items total with maps), seven had diagrams (of 10 items total with diagrams), and seven
were multiple-choice items that had picture answer choices (of 12 items total with picture answer
choices). All of the flagged map and picture answer choice items were DIF in favor of males,
while one flagged diagram item (of seven) was in favor of females.
It was also interesting to note that picture answer choices and diagrams were common
within the physical sciences content category, in which (as noted above) many items were DIF in
favor of male examinees. Likewise, visual-spatial/reference components were frequently present
in the technology items, and six of the eight flagged items from that content category had such
components (particularly maps and tables), although many items with tables from this category
were not flagged. In the earth and space sciences content category, nearly every item with a map
was flagged, as were most with pictures of any kind. Earth and space sciences items with tables,
text boxes, and lists showed no differences between male and female performance.
Furthermore, not one of the relatively few life sciences items found to exhibit DIF
contained a visual-spatial reference component. In fact, very few of the life sciences or
technology items contained visual-spatial/reference components. However, it is interesting to
note that of the five technology items with such components, three were DIF (two picture answer
choice items and one item with a timeline). The two items not DIF were open-response and
contained lists.

19
Dimension 3 Results: Item Type
There are two types of items used on these tests: multiple-choice and open-response.
Across the three levels, there were 37 open-response-type items, and for the majority of these,
written answers were expected, although on several items examinees could respond with
diagrams. It can be seen from Table 4 that only three OR items were flagged across the three
levels of tests, and these three items had two attributes in common. All were minor DIF in favor
of females, and all were related to the inquiry content category. These three flagged items were
among eight OR inquiry items, so five items from the same content category did not exhibit DIF,
and none of the 28 other OR items were flagged as DIF.
Table 4
Item Type Results
Level
/Form
Item
Type
Number of Items with DIF Statistics
Less than
-.05
Between
-.05 and .00
Between
.00 and .05
Greater
than .05
All ES
Forms
MC 3 18 27 12
OR -- 8 3 --
All MS
Forms
MC 1 17 26 16
OR 3 6 2 --
All HS
Forms
MC 1 14 26 24
OR -- 13 2 --
All Tests MC 5 49 79 52
OR 3 27 7 --

20
Figure 5. Item Type Results: Distribution of DIF Statistics by Item Type
0.0
10.0
20.0
30.0
40.0
50.0
60.0
70.0
80.0
90.0
100.0
Less than -.05 Between -.05
and .00
Between .00 and
.05
Greater than .05
Percent
ES MC
ES OR
MS MC
MS OR
HS MC
HS OR
An interesting pattern seen in Table 4 is illustrated in Figure 5. By plotting the
distribution of DIF statistics for each level, broken out by percent of each item type in each
category, it is clear that even though fewer OR items are present, the “leaning” of those items is
toward female examinees. This is in contrast to the MC items, where more of the DIF statistics
are greater than 0 (thereby leaning toward or exhibiting DIF in favor of males). Since each of the
OR items is worth as many as four points, while one score point is awarded for each correct MC
item, even though few of the OR items are DIF, the “leaning” toward females of such items may
serve to slightly boost the overall test scores of female examinees, though differences in item-
level performance (where males do better than females) are clearly present.
Conclusions
In reflecting on the findings from each of the three dimensions, it is necessary to be
cautious about the extent to which these results can reasonably be integrated into any testing
program. Patterns based on two or three items can only be taken as preliminary, although
evidence across two forms at each level adds a measure of generalizability to the findings. In

21
addition, DIF is not equivalent to bias and so it is unclear how these findings should be addressed
in operational testing programs. However, the findings detailed here are indicative of possible
sources of DIF, and in some cases perhaps the results can be used by item writers as preliminary
guidelines of what may be problematic or which topics might be minimized in test development
work. In summary,
• In terms of content categories, performance between male and female examinees was
most balanced on the life sciences items and substantially less balanced on the
technology and earth and space sciences items. This was particularly the case with the
latter two content categories on the high school tests, where the proportion of items
flagged was somewhat higher. Nearly 50% of the items for each of those content
categories were identified as DIF.
• An interesting finding relating to the presence of a visual-spatial/reference component
is that when picture answer choices were present on MC items, female examinees did
less well than males for the most part, but for OR items when examinees were asked
to diagram the answer themselves, no differences in performance were noted. The
two other components where a high proportion of items were flagged (most items
advantaging males) were items where maps and diagrams were used in the item stem.
• Underlying some of the other results is a propensity for OR items to “lean toward”
female examinees and for MC items to similarly “lean toward” male examinees. This
result may be particularly relevant to a content category like “inquiry” where many of
the items are OR and almost 50% of the flagged items advantaged female examinees.
• For the most part, most of the items where there appeared to be plausible sources of
DIF were found on the MS and HS tests, rather than the ES tests.

22
Identifying DIF in test data and considering these various sources of DIF in a critical way
can be an important part of test development. From this analysis, it seems clear that gaining
greater perspective on sources of DIF by looking at multiple facets of items to search out trends
was a very useful activity. In many cases, it is not obvious from item statistics or initial
inspection of flagged items alone why between-group differences are present. Indeed, the item(s)
may not be the problem but rather only a symptom of differences in curriculum, teaching
methods, and/or motivation. In some cases, item-level difference may signal the need for
curriculum change, but this is a policy decision that can be addressed after problematic items
have been identified and thoroughly analyzed.
Though some efforts at interpreting item-level DIF have met with success (most have
not), emerging approaches focusing on patterns among bundles or sets of items are providing test
developers with opportunities for insight into sources of DIF that were previously not at all clear.
The results presented here indicate that in many cases evaluation of various critical details about
items can lead to the detection of numerous potential trends in items flagged and not flagged. As
such studies are completed and the results disseminated to item writers and test directors, the
accumulation of evidence will ensure that item writing practices are informed by more than
anecdotal reports about why some items exhibit DIF, and can help to streamline the process of
item production by making note of items that may turn out to be problematic later. However,
caution must be taken to make certain that such findings are not used to negatively impact on
domain coverage.

23
References
Allalouf, A., Hambleton, R. K., & Sireci, S. G. (1999). Identifying the causes of DIF in
translated verbal items. Journal of Educational Measurement, 36(3), 185-198.
American Educational Research Association, American Psychological Association, and National
Council for Measurement in Education. (1999). Standards for educational and
psychological testing. Washington, D.C.: American Educational Research Association.
Bolger, N., & Kellaghan, T. (1990). Method of measurement and gender differences in scholastic
achievement. Journal of Educational Measurement, 27, 165-174.
Bridgman, B., & Lewis, C. (1996). Gender differences in college mathematics and SAT-M
scores: A reanalysis of Wainer & Steinberg. Journal of Educational Measurement, 33,
257-270.
Burton, N. (1996). How have the changes in the SAT affected women’s mathematics
performance? Educational Measurement: Issues and Practice, 15(4), 5-9.
Camilli, G., & Shepard, L. (1994). Methods for identifying biased test items. Newbury Park, CA:
Sage.
Cole, N. S. (1997, May). The ETS gender study: How males and females perform in educational
settings. Princeton, NJ: Educational Testing Service.
Dorans, N. J., & Holland, P. W. (1993). DIF detection and description: Mantel-Haenszel and
standardization. In P. W. Holland & H. Wainer (Eds.), Differential item functioning (pp.
35-66. Hillsdale, NJ: Lawrence Erlbaum.
Dorans, N. J., & Kulick, E. (1986). Demonstrating the utility of the standardization approach to
assessing the unexpected differential item functioning on the Scholastic Aptitude Test.
Journal of Educational Measurement, 23, 355-368.
Douglas, J. A., Roussos, L. A., & Stout, W. (1996). Item-bundle DIF hypothesis testing:
Identifying suspect bundles and assessing their differential functioning. Journal of
Educational Measurement, 33(4), 465-484.
Educational Testing Service. (1998). Overview: ETS fairness review. Princeton, NJ: Author.
Gierl, M. J., Bisanz, J., Bisanz, G. L., Boughton, K. A., & Khaliq, S. N. (2001). Illustrating the
utility of differential bundle functioning analyses to identify and interpret group
differences on achievement tests. Educational Measurement: Issues and Practice, 20(2),
26-36.
Hafner, A., Ingels, S., Schneider, B., & Stevenson, D. (1990). A profile of the American eighth
grader: NELS:88 student descriptive summary. Washington, DC: National Center for
Education Statistics.

24
Halpern, D. F. (1997). Sex differences in intelligence: Implications for education. American
Psychologist, 52, 1091-1102.
Hambleton, R. K., Swaminathan, H., & Rogers, H. J. (1991). Fundamentals of item response
theory. Newbury Park, CA: Sage.
Hamilton, L. S. (1999). Detecting gender-based differential item functioning on a constructed-
response science test. Applied Measurement in Education, 12, 211-235.
Hamilton, L. S., & Snow, R. E. (1998). Exploring differential item functioning on science
achievement tests (CSE Technical Report 483). Los Angeles, CA: National Center for
Research on Evaluation, Standards, and Student Testing.
Harris, A. & Carlton, S. (1993). Patterns of gender differences on mathematics items on the
Scholastic Aptitude Test. Applied Measurement in Education, 6(2), 137-151.
Holland, P. W., & Thayer, D. T. (1988). Differential item functioning and the Mantel-Haenszel
procedure. In H. Wainer & H. I. Braun (Eds.), Test validity (pp.129-145). Hillsdale, NJ:
Lawrence Erlbaum.
Ingels, S. J. (1990, April). Findings from the NELS:88 Base Year Student Survey. Paper
presented at the meeting of the American Educational Research Association, Boston.
Lane, S., Wang, N., & Magone, M. (1996). Gender related differential item functioning on a
middle school mathematics performance assessment. Educational Measurement: Issues
and Practice, 15(4), 21-27, 31.
Mazzeo, J., Schmitt, A., & Bleistein, C. (1993). Sex-related differences on constructed response
and multiple-choice sections of Advanced Placement Examinations (GB Report No. 927,
ETS RR 93-5). New York: College Entrance Examination Board.
Nandakumar, R. (1993). Simultaneous DIF amplification and cancellation: Shealy-Stout’s test
for DIF. Journal of Educational Measurement, 16, 159-176.
Robin, F. (2001). STDIF: Standardization-DIF analysis program [Computer program]. Amherst,
MA: University of Massachusetts, School of Education.
Ryan, K. E., & Chiu, S. (2001). An examination of item context effects, DIF, and gender DIF.
Applied Measurement in Education, 14(1), 73-90.
Ryan, K. E., & Fan, M. (1996). Examining gender DIF on a multiple-choice test of mathematics:
A confirmatory approach. Educational Measurement: Issues and Practice, 15(4), 21-27.
Shealy, R. T., & Stout, W. F. (1993). A model-based standardization approach that separates
true-bias/DIF from group ability differences and detects test bias/DIF as well as item
bias/DIF. Psychometrika, 58, 159-194.
25
Stricker, L. J., & Emmerich, W. (1999). Possible determinants of differential item functioning:
Familiarity, interest, and emotional reaction. Journal of Educational Measurement, 36(4),
347-366.
Swaminathan, H., & Rogers, H. J. (1990). Detecting differential item functioning using logistic
regression procedures. Journal of Educational Measurement, 27, 361-370.
Wainer, H., & Steinberg, L. S. (1992). Sex differences in performance on the mathematics
section of the Scholastic Aptitude Test: A bidirectional validity study. Harvard
Educational Review, 62, 323-326.
Zenisky, A. L., Hambleton, R. K., & Robin, F. (2003). Detection of differential item functioning
in large-scale state assessments: A study evaluating a two-stage approach. Educational
and Psychological Measurement, 63, 51-64.