we think we are doing a good job, but what do our customers think? andrew frowd director –...
TRANSCRIPT
We Think We Are Doing a Good Job,
BUT
What Do Our Customers Think?
Andrew FrowdDirector – Facilities Management
QUT
28,000 EFT
9 Faculties
No Residential
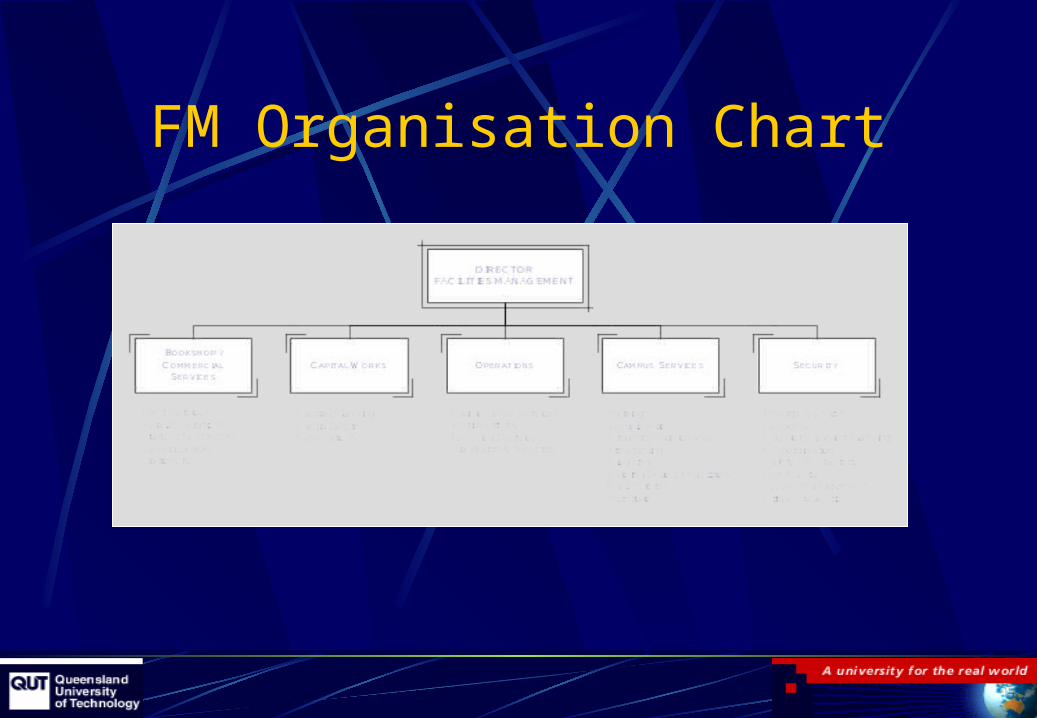
FM Organisation Chart
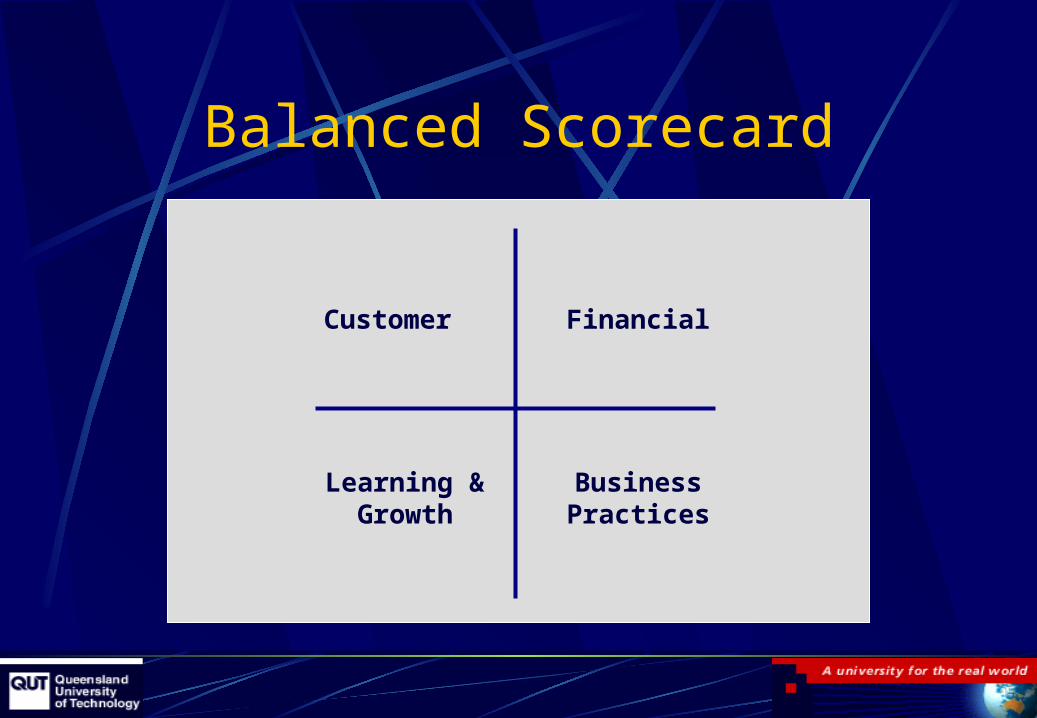
Balanced Scorecard
Customer
Learning &Growth
BusinessPractices
Financial

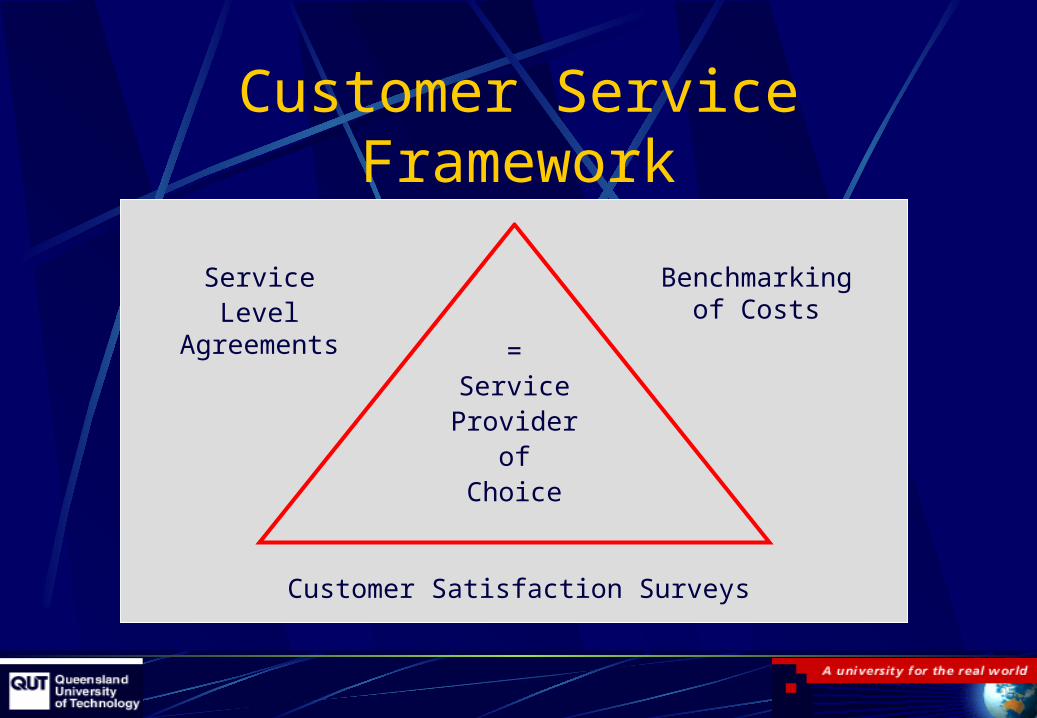
Customer Service Framework
=ServiceProvider
ofChoice
ServiceLevel
Agreements
Benchmarking of Costs
Customer Satisfaction Surveys
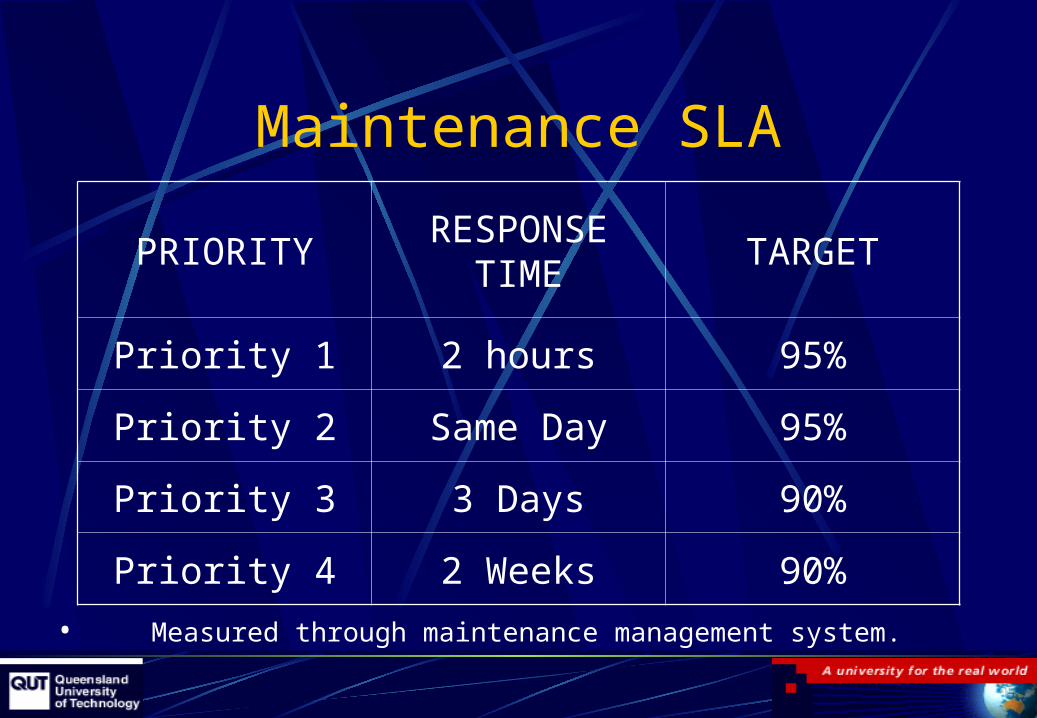
Maintenance SLA
PRIORITYRESPONSE
TIMETARGET
Priority 1 2 hours 95%
Priority 2 Same Day 95%
Priority 3 3 Days 90%
Priority 4 2 Weeks 90%
• Measured through maintenance management system.
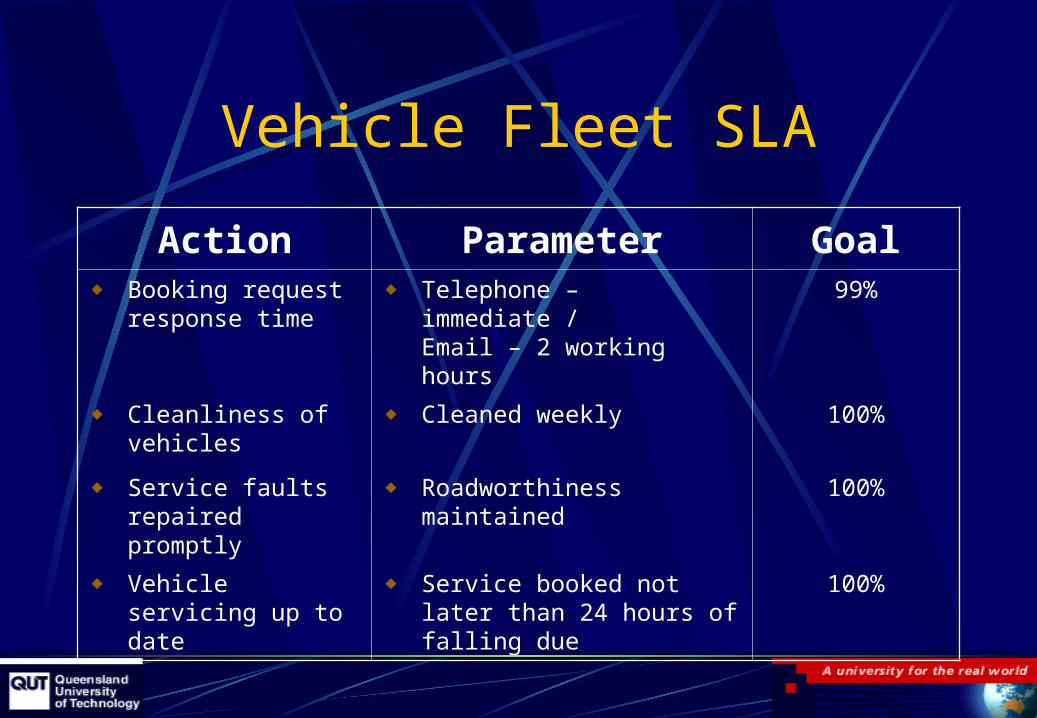
Vehicle Fleet SLA
Action Parameter GoalBooking requestresponse time
Telephone – immediate /Email – 2 working hours
99%
Cleanliness of vehicles
Cleaned weekly 100%
Service faults repaired promptly
Roadworthiness maintained 100%
Vehicle servicing up to date
Service booked not later than 24 hours of falling due
100%

Maintenance KPI
PRIORITYRESPONSE
TIMETARGET
Priority 1 2 hours 95%
Priority 2 Same Day 95%
Priority 3 3 Days 90%
Priority 4 2 Weeks 90%
• Measured through maintenance management system.
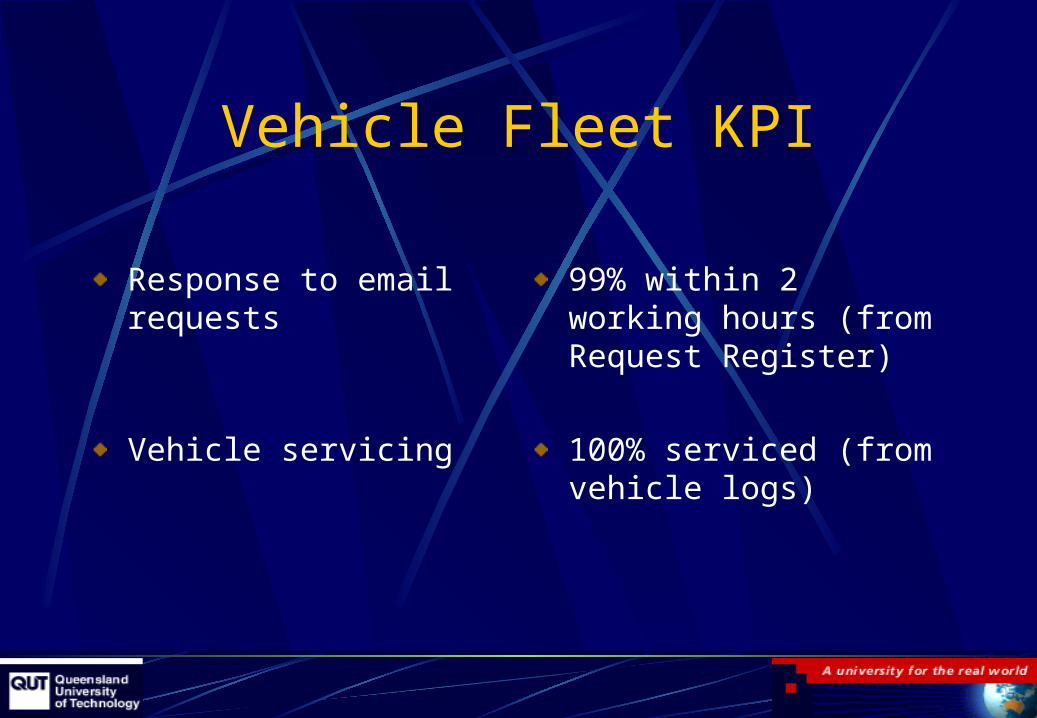
Vehicle Fleet KPI
Response to email requests
99% within 2 working hours (from Request Register)
Vehicle servicing 100% serviced (from vehicle logs)
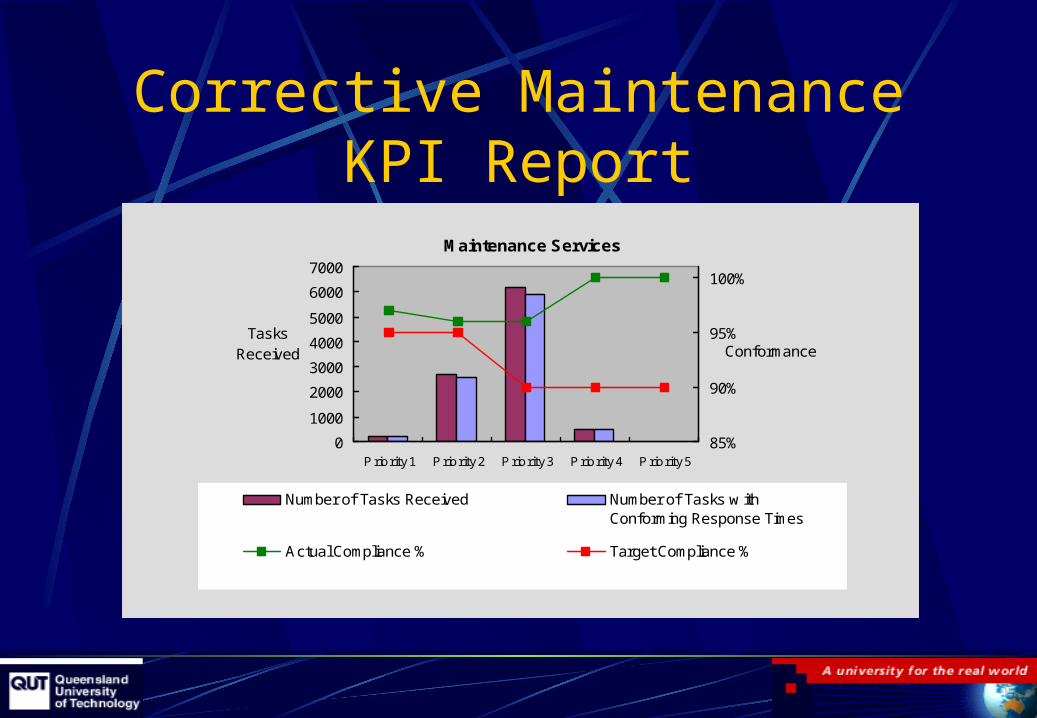
Corrective Maintenance KPI Report
Maintenance Services
0
1000
2000
3000
4000
5000
6000
7000
P riority 1 P riority 2 P riority 3 P riority 4 P riority 5
Tasks Received
85%
90%
95%
100%
Conformance
Number of Tasks Received Number of Tasks w ith Conforming Response Times
Actual Compliance % Target Compliance %
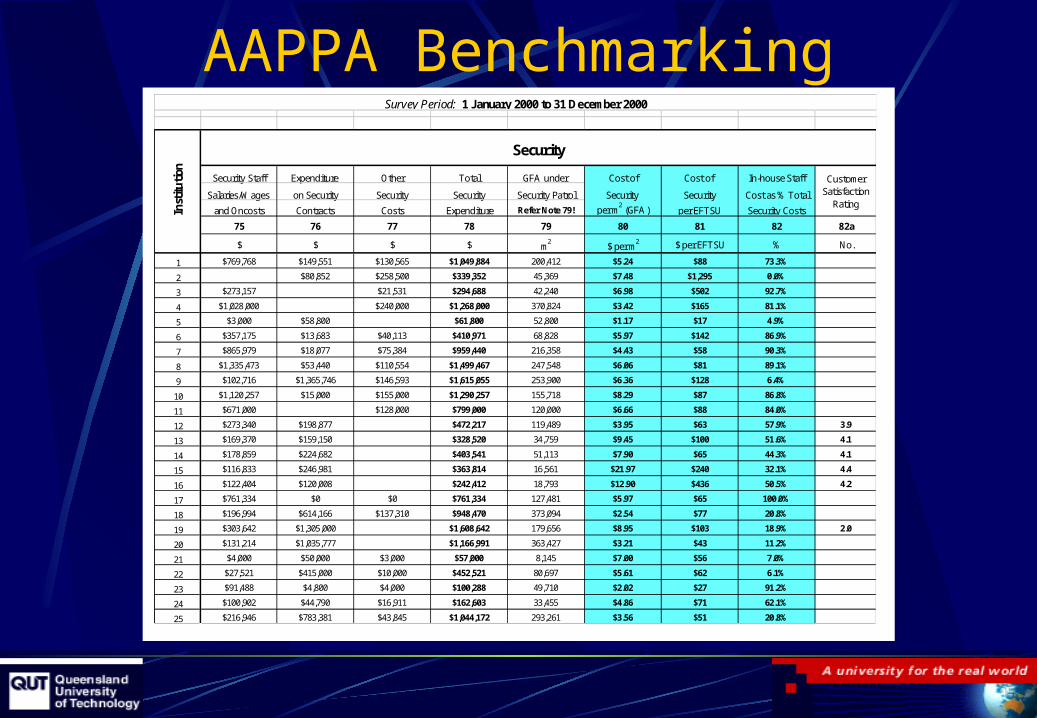
AAPPA Benchmarking
Security Staff Expenditure Other Total GFA under Cost of Cost of In-house Staff
Salaries/Wages on Security Security Security Security Patrol Security Security Cost as % Total
and Oncosts Contracts Costs Expenditure Refer Note 79! per m2 (GFA) per EFTSU Security Costs
75 76 77 78 79 80 81 82 82a
$ $ $ $ m2
$ per m2 $ per EFTSU % No.
1 $769,768 $149,551 $130,565 $1,049,884 200,412 $5.24 $88 73.3%
2 $80,852 $258,500 $339,352 45,369 $7.48 $1,295 0.0%
3 $273,157 $21,531 $294,688 42,240 $6.98 $502 92.7%
4 $1,028,000 $240,000 $1,268,000 370,824 $3.42 $165 81.1%
5 $3,000 $58,800 $61,800 52,800 $1.17 $17 4.9%
6 $357,175 $13,683 $40,113 $410,971 68,828 $5.97 $142 86.9%
7 $865,979 $18,077 $75,384 $959,440 216,358 $4.43 $58 90.3%
8 $1,335,473 $53,440 $110,554 $1,499,467 247,548 $6.06 $81 89.1%
9 $102,716 $1,365,746 $146,593 $1,615,055 253,900 $6.36 $128 6.4%
10 $1,120,257 $15,000 $155,000 $1,290,257 155,718 $8.29 $87 86.8%
11 $671,000 $128,000 $799,000 120,000 $6.66 $88 84.0%
12 $273,340 $198,877 $472,217 119,489 $3.95 $63 57.9% 3.9
13 $169,370 $159,150 $328,520 34,759 $9.45 $100 51.6% 4.1
14 $178,859 $224,682 $403,541 51,113 $7.90 $65 44.3% 4.1
15 $116,833 $246,981 $363,814 16,561 $21.97 $240 32.1% 4.4
16 $122,404 $120,008 $242,412 18,793 $12.90 $436 50.5% 4.2
17 $761,334 $0 $0 $761,334 127,481 $5.97 $65 100.0%
18 $196,994 $614,166 $137,310 $948,470 373,094 $2.54 $77 20.8%
19 $303,642 $1,305,000 $1,608,642 179,656 $8.95 $103 18.9% 2.0
20 $131,214 $1,035,777 $1,166,991 363,427 $3.21 $43 11.2%
21 $4,000 $50,000 $3,000 $57,000 8,145 $7.00 $56 7.0%
22 $27,521 $415,000 $10,000 $452,521 80,697 $5.61 $62 6.1%
23 $91,488 $4,800 $4,000 $100,288 49,710 $2.02 $27 91.2%
24 $100,902 $44,790 $16,911 $162,603 33,455 $4.86 $71 62.1%
25 $216,946 $783,381 $43,845 $1,044,172 293,261 $3.56 $51 20.8%
Customer Satisfaction
Rating
Inst
itu
tion
Survey Period: 1 January 2000 to 31 December 2000
Security
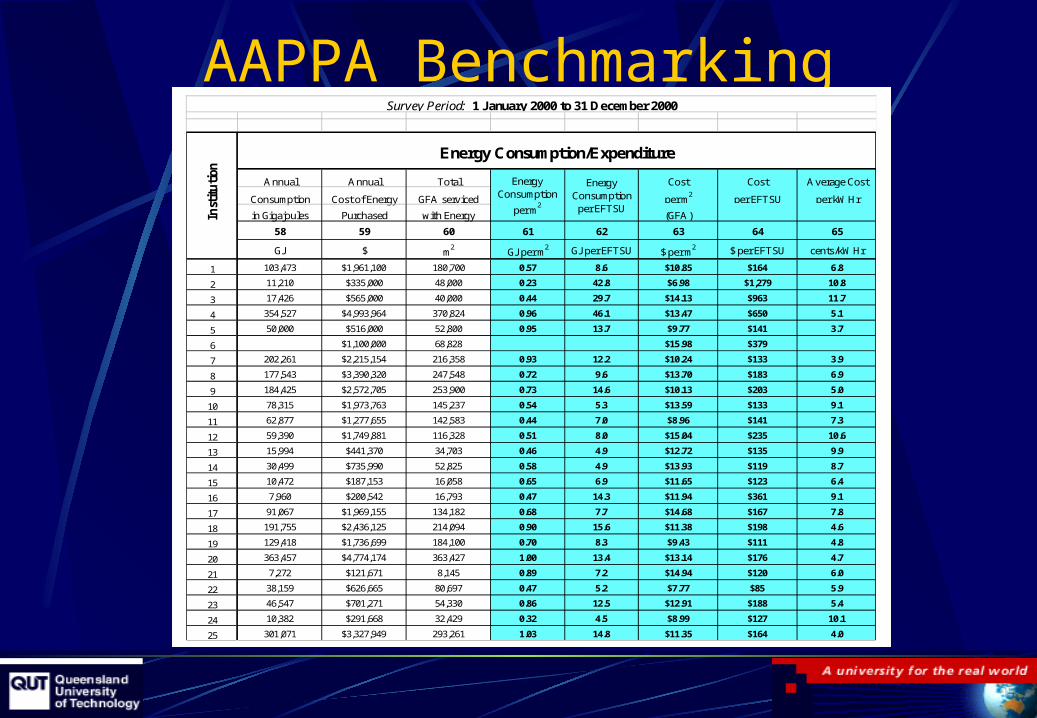
AAPPA Benchmarking
Annual Annual Total Cost Cost Average Cost
Consumption Cost of Energy GFA serviced per m2
per EFTSU per kWHr
in Gigajoules Purchased with Energy (GFA)
58 59 60 61 62 63 64 65
GJ $ m2
GJ per m2 GJ per EFTSU $ per m
2 $ per EFTSU cents/kWHr
1 103,473 $1,961,100 180,700 0.57 8.6 $10.85 $164 6.8
2 11,210 $335,000 48,000 0.23 42.8 $6.98 $1,279 10.8
3 17,426 $565,000 40,000 0.44 29.7 $14.13 $963 11.7
4 354,527 $4,993,964 370,824 0.96 46.1 $13.47 $650 5.1
5 50,000 $516,000 52,800 0.95 13.7 $9.77 $141 3.7
6 $1,100,000 68,828 $15.98 $379
7 202,261 $2,215,154 216,358 0.93 12.2 $10.24 $133 3.9
8 177,543 $3,390,320 247,548 0.72 9.6 $13.70 $183 6.9
9 184,425 $2,572,705 253,900 0.73 14.6 $10.13 $203 5.0
10 78,315 $1,973,763 145,237 0.54 5.3 $13.59 $133 9.1
11 62,877 $1,277,655 142,583 0.44 7.0 $8.96 $141 7.3
12 59,390 $1,749,881 116,328 0.51 8.0 $15.04 $235 10.6
13 15,994 $441,370 34,703 0.46 4.9 $12.72 $135 9.9
14 30,499 $735,990 52,825 0.58 4.9 $13.93 $119 8.7
15 10,472 $187,153 16,058 0.65 6.9 $11.65 $123 6.4
16 7,960 $200,542 16,793 0.47 14.3 $11.94 $361 9.1
17 91,067 $1,969,155 134,182 0.68 7.7 $14.68 $167 7.8
18 191,755 $2,436,125 214,094 0.90 15.6 $11.38 $198 4.6
19 129,418 $1,736,699 184,100 0.70 8.3 $9.43 $111 4.8
20 363,457 $4,774,174 363,427 1.00 13.4 $13.14 $176 4.7
21 7,272 $121,671 8,145 0.89 7.2 $14.94 $120 6.0
22 38,159 $626,665 80,697 0.47 5.2 $7.77 $85 5.9
23 46,547 $701,271 54,330 0.86 12.5 $12.91 $188 5.4
24 10,382 $291,668 32,429 0.32 4.5 $8.99 $127 10.1
25 301,071 $3,327,949 293,261 1.03 14.8 $11.35 $164 4.0
Energy Consumption
per EFTSU
Survey Period: 1 January 2000 to 31 December 2000
Inst
itu
tion
Energy Consumption/Expenditure
Energy Consumption
per m2
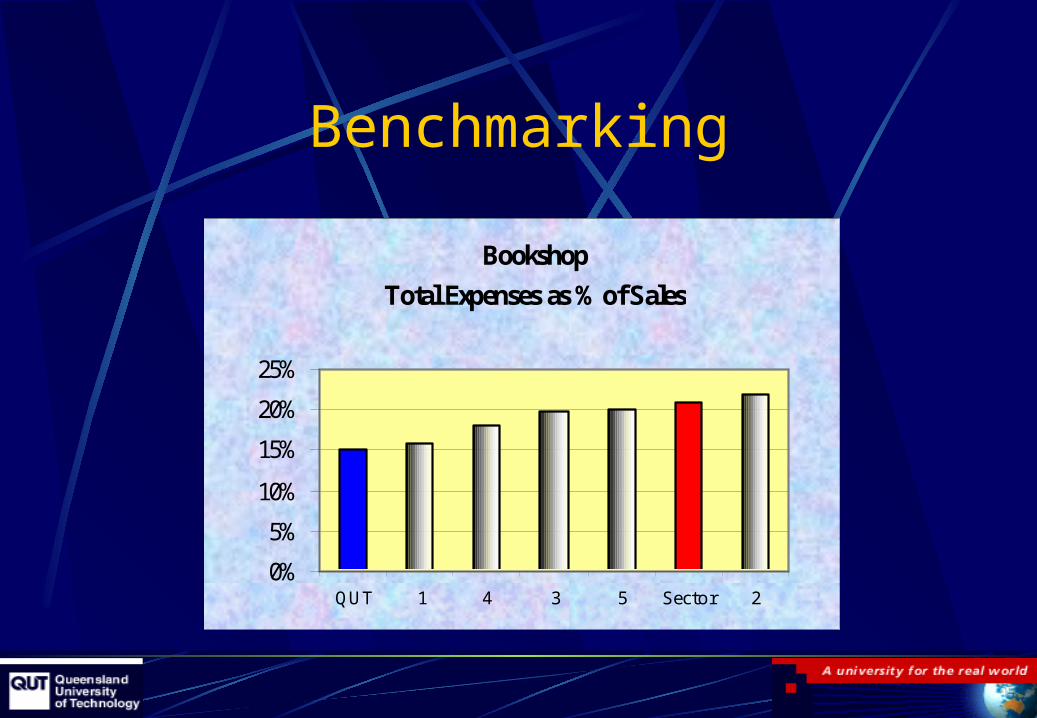
Benchmarking
Bookshop
Total Expenses as % of Sales
0%
5%
10%
15%
20%
25%
QUT 1 4 3 5 Sector 2
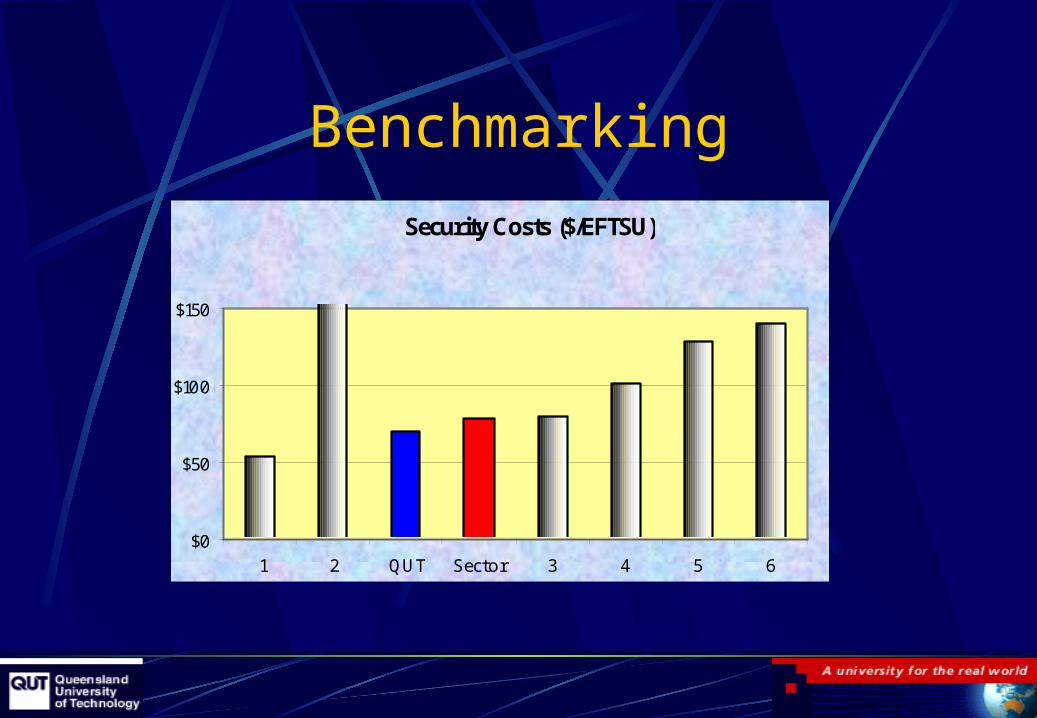
BenchmarkingSecurity Costs ($/EFTSU)
$0
$50
$100
$150
1 2 QUT Sector 3 4 5 6
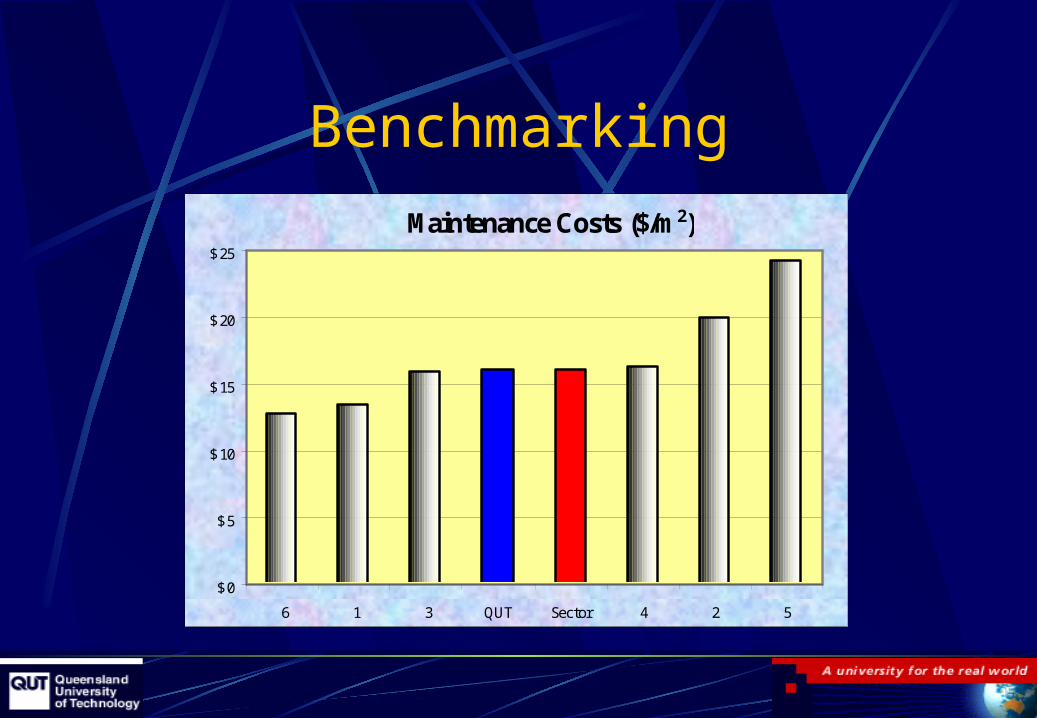
Maintenance Costs ($/m 2)
$0
$5
$10
$15
$20
$25
6 1 3 QUT Sector 4 2 5
Benchmarking
Customer Satisfaction
Linkage between consumption and payment
Promulgation AND acceptance of SLAs
Who is the customer?
Who is the Customer?
Individual consumer
Corporate university
Statutory obligations
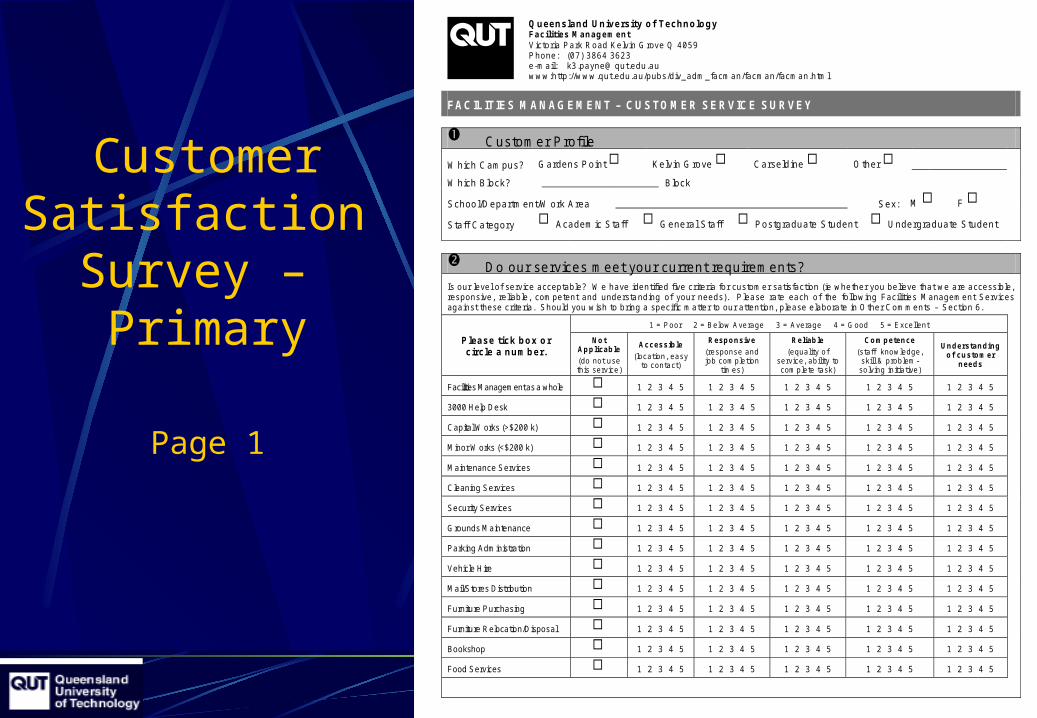
CustomerSatisfaction
Survey – Primary
Q u e e n s la n d U n iv e rs ity o f T ec h n o lo g y F a c ilitie s M a n ag e m en t V ic to ria P a rk R o ad K e lv in G rove Q 4 0 5 9 P h o n e : (0 7 ) 3 86 4 36 2 3 e -m a il: k3 .pa yn e @ q u t.e d u .a u w w w :h ttp ://w w w .q u t.e d u .a u /p ub s /d iv_ a d m _ facm an /facm a n /facm an .h tm l
F A C IL IT IE S M A N A G E M E N T – C U S T O M E R S E R V IC E S U R V E Y
C u s to m e r P ro file
W h ich C a m p u s? G a rd e ns P o in t K e lv in G ro ve C a rse ld in e O th e r
W h ich B lo ck ? B lo ck
S ch o o l/D e p a rtm e n t/W ork A re a S e x : M F
S ta ff C a te g o ry A ca d e m ic S ta ff G e n e ra l S ta ff P o s tg ra d u a te S tu d e n t U n d e rg ra d u a te S tu d e n t
D o o u r se rv ice s m ee t yo u r cu rre n t re q u ire m e n ts? Is ou r leve l o f se rvice accep tab le? W e have iden tified five c rite ria fo r cus tom er sa tis fac tion (ie w he ther you be lieve tha t w e a re accessib le , respons ive , re liab le , com petent and unders ta nd ing o f your needs). P lease ra te each o f the fo llow ing F ac ilities M anagem ent S ervices aga ins t these crite ria . S hould you w ish to b ring a spec ific m a tte r to ou r a tten tion , p lease e labora te in O the r C om m ents – S ection 6 .
1 = P oo r 2 = B e low A ve rage 3 = A ve rage 4 = G ood 5 = E xce llen t
P le a s e tic k b o x o r c irc le a n u m b e r.
N o t Ap p licab le
(do no t use th is se rv ice )
Ac ces s ib le
(loca tion , easy to con tact)
R esp o n s ive
(response and job com ple tion
tim es )
R eliab le
(equa lity o f se rv ice , ab ility to
com p lete task )
C o m p eten ce
(s ta ff know ledge , sk ill & p rob lem -
so lv ing in itia tive )
U n d ers tan d ing o f cu s to m er
n eed s
Facilities Management as a whole 1 2 3 4 5 1 2 3 4 5 1 2 3 4 5 1 2 3 4 5 1 2 3 4 5
3000 Help Desk 1 2 3 4 5 1 2 3 4 5 1 2 3 4 5 1 2 3 4 5 1 2 3 4 5
Capital W orks (>$200 k) 1 2 3 4 5 1 2 3 4 5 1 2 3 4 5 1 2 3 4 5 1 2 3 4 5
Minor W orks (<$200 k) 1 2 3 4 5 1 2 3 4 5 1 2 3 4 5 1 2 3 4 5 1 2 3 4 5
Maintenance Services 1 2 3 4 5 1 2 3 4 5 1 2 3 4 5 1 2 3 4 5 1 2 3 4 5
Cleaning Services 1 2 3 4 5 1 2 3 4 5 1 2 3 4 5 1 2 3 4 5 1 2 3 4 5
Security Services 1 2 3 4 5 1 2 3 4 5 1 2 3 4 5 1 2 3 4 5 1 2 3 4 5
Grounds Maintenance 1 2 3 4 5 1 2 3 4 5 1 2 3 4 5 1 2 3 4 5 1 2 3 4 5
Parking Administration 1 2 3 4 5 1 2 3 4 5 1 2 3 4 5 1 2 3 4 5 1 2 3 4 5
Vehicle Hire 1 2 3 4 5 1 2 3 4 5 1 2 3 4 5 1 2 3 4 5 1 2 3 4 5
Mail/Stores Distribution 1 2 3 4 5 1 2 3 4 5 1 2 3 4 5 1 2 3 4 5 1 2 3 4 5
Furniture Purchasing 1 2 3 4 5 1 2 3 4 5 1 2 3 4 5 1 2 3 4 5 1 2 3 4 5
Furniture Relocation/Disposal 1 2 3 4 5 1 2 3 4 5 1 2 3 4 5 1 2 3 4 5 1 2 3 4 5
Bookshop 1 2 3 4 5 1 2 3 4 5 1 2 3 4 5 1 2 3 4 5 1 2 3 4 5
Food Services 1 2 3 4 5 1 2 3 4 5 1 2 3 4 5 1 2 3 4 5 1 2 3 4 5
Page 1
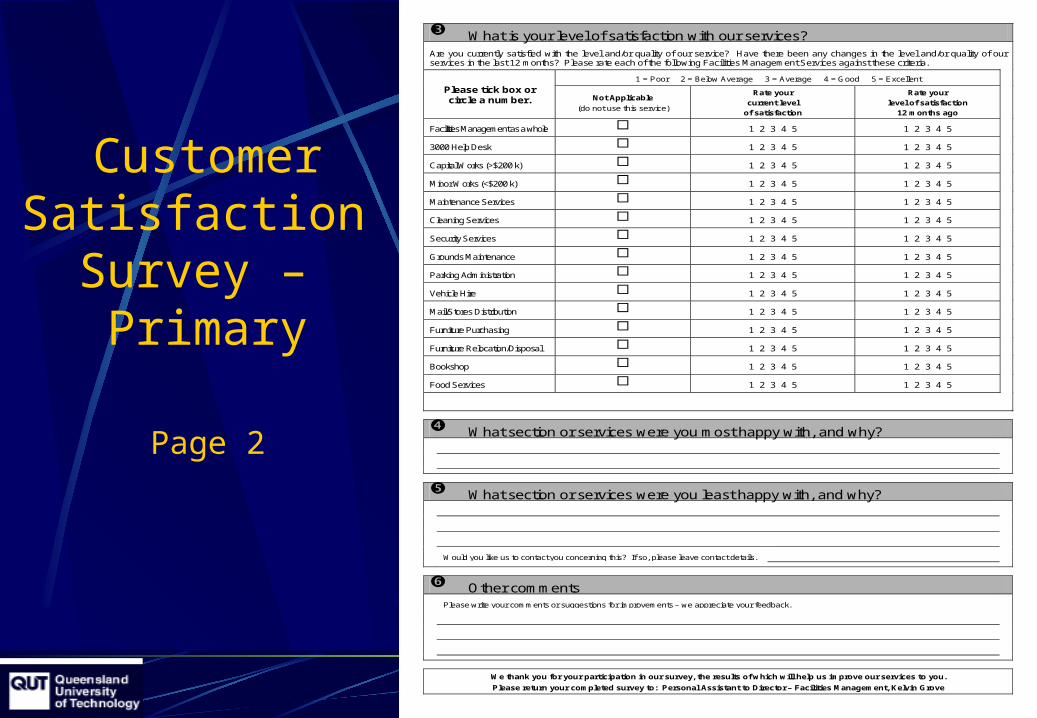
What is your level of satisfaction with our services? Are you currently satisfied with the level and/or quality of our service? Have there been any changes in the level and/or quality of our services in the last 12 months? Please rate each of the following Facilities Management Services against these criteria.
1 = Poor 2 = Below Average 3 = Average 4 = Good 5 = Excellent
Please tick box or circle a number. Not Applicable
(do not use this service)
Rate your
current level
of satisfaction
Rate your
level of satisfaction
12 months ago
Facilities Management as a whole 1 2 3 4 5 1 2 3 4 5
3000 Help Desk 1 2 3 4 5 1 2 3 4 5
Capital Works (>$200 k) 1 2 3 4 5 1 2 3 4 5
Minor Works (<$200 k) 1 2 3 4 5 1 2 3 4 5
Maintenance Services 1 2 3 4 5 1 2 3 4 5
Cleaning Services 1 2 3 4 5 1 2 3 4 5
Security Services 1 2 3 4 5 1 2 3 4 5
Grounds Maintenance 1 2 3 4 5 1 2 3 4 5
Parking Administration 1 2 3 4 5 1 2 3 4 5
Vehicle Hire 1 2 3 4 5 1 2 3 4 5
Mail/Stores Distribution 1 2 3 4 5 1 2 3 4 5
Furniture Purchasing 1 2 3 4 5 1 2 3 4 5
Furniture Relocation/Disposal 1 2 3 4 5 1 2 3 4 5
Bookshop 1 2 3 4 5 1 2 3 4 5
Food Services 1 2 3 4 5 1 2 3 4 5
What section or services were you most happy with, and why?
What section or services were you least happy with, and why?
Would you like us to contact you concerning this? If so, please leave contact details.
Other comments Please write your comments or suggestions for improvements – we appreciate your feedback.
We thank you for your participation in our survey, the results of which will help us improve our services to you.
Please return your completed survey to: Personal Assistant to Director – Facilities Management, Kelvin Grove
CustomerSatisfaction
Survey – Primary
Page 2
Customer Satisfaction
Survey – Secondary
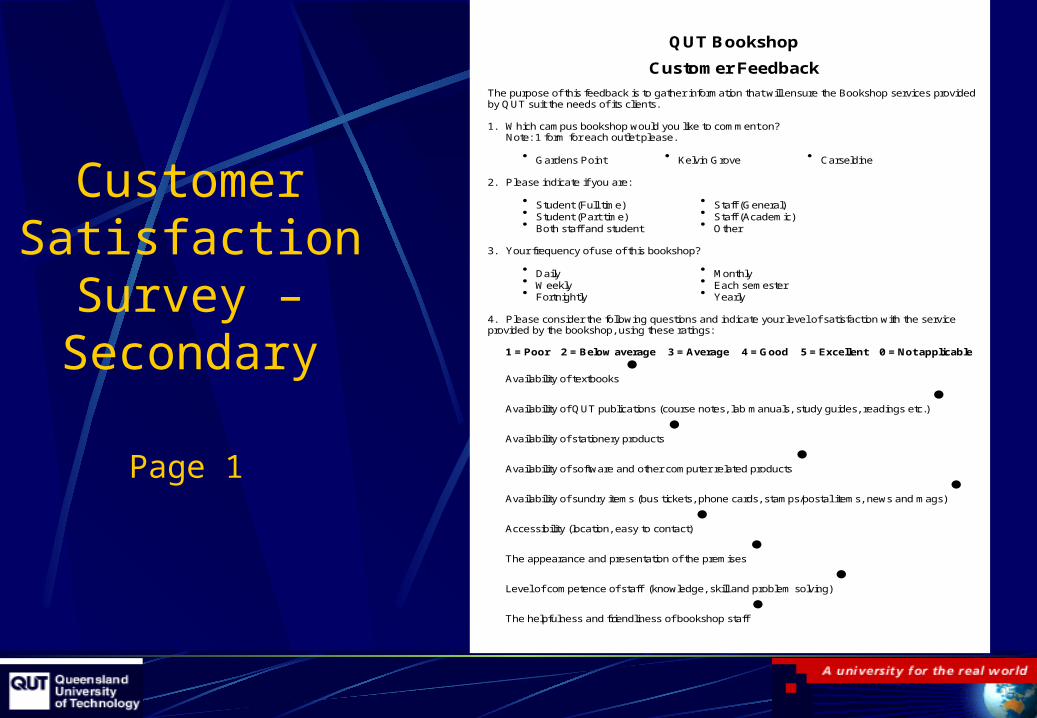
QUT Bookshop
Customer Feedback The purpose of this feedback is to gather information that will ensure the Bookshop services provided by QUT suit the needs of its clients. 1. Which campus bookshop would you like to comment on? Note: 1 form for each outlet please.
Gardens Point Kelvin Grove Carseldine 2. Please indicate if you are:
Student (Full time) Staff (General) Student (Part time) Staff (Academic) Both staff and student Other
3. Your frequency of use of this bookshop?
Daily Monthly
Weekly Each semester Fortnightly Yearly
4. Please consider the following questions and indicate your level of satisfaction with the service provided by the bookshop, using these ratings:
1 = Poor 2 = Below average 3 = Average 4 = Good 5 = Excellent 0 = Not applicable
Availability of textbooks
Availability of QUT publications (course notes, lab manuals, study guides, readings etc.)
Availability of stationery products
Availability of software and other computer related products
Availability of sundry items (bus tickets, phone cards, stamps/postal items, news and mags)
Accessibility (location, easy to contact)
The appearance and presentation of the premises
Level of competence of staff (knowledge, skill and problem solving)
The helpfulness and friendliness of bookshop staff
Page 1
Customer Satisfaction
Survey – Secondary
Page 2
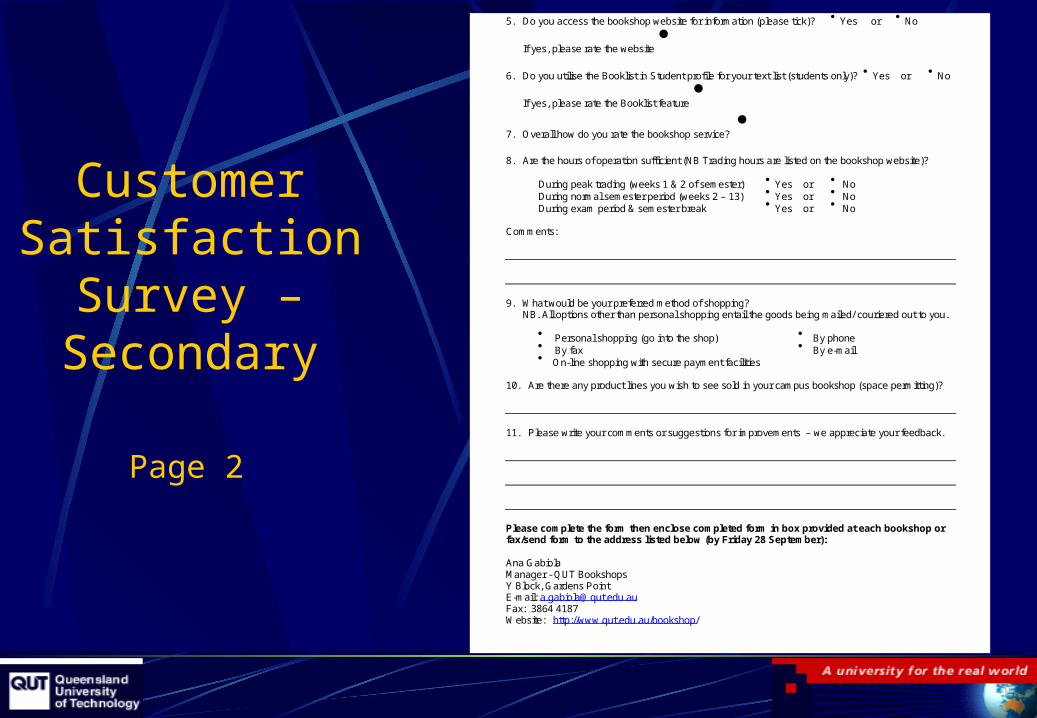
5. Do you access the bookshop website for information (please tick)? Yes or No
If yes, please rate the website
6. Do you utilise the Booklist in Student profile for your text list (students only)? Yes or No
If yes, please rate the Booklist feature
7. Overall how do you rate the bookshop service?
8. Are the hours of operation sufficient (NB Trading hours are listed on the bookshop website)?
During peak trading (weeks 1 & 2 of semester) Yes or No During normal semester period (weeks 2 – 13) Yes or No During exam period & semester break Yes or No
Comments: 9. What would be your preferred method of shopping? NB. All options other than personal shopping entail the goods being mailed/ couriered out to you.
Personal shopping (go into the shop) By phone By fax By e-mail On-line shopping with secure payment facilities
10. Are there any product lines you wish to see sold in your campus bookshop (space permitting)? 11. Please write your comments or suggestions for improvements – we appreciate your feedback. Please complete the form then enclose completed form in box provided at each bookshop or fax/send form to the address listed below (by Friday 28 September): Ana Gabiola Manager - QUT Bookshops Y Block, Gardens Point E-mail: [email protected] Fax: 3864 4187 Website: http://www.qut.edu.au/bookshop/
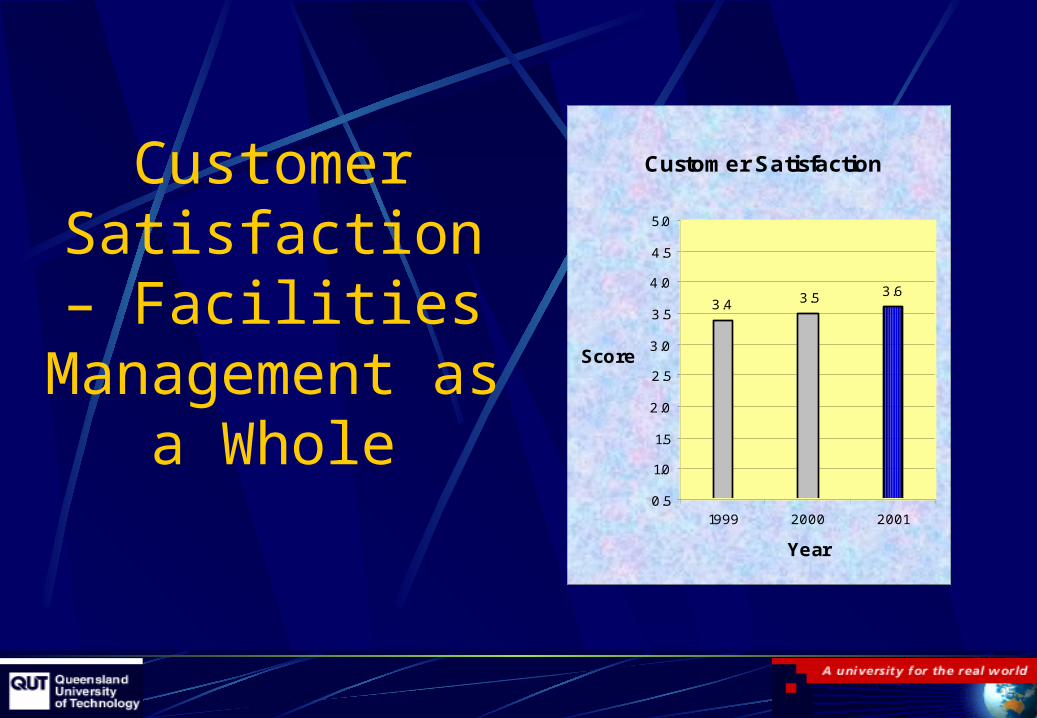
Customer Satisfaction –
Facilities Management as
a Whole
Customer Satisfaction
3.4 3.5 3.6
0.5
1.0
1.5
2.0
2.5
3.0
3.5
4.0
4.5
5.0
1999 2000 2001
Year
Score
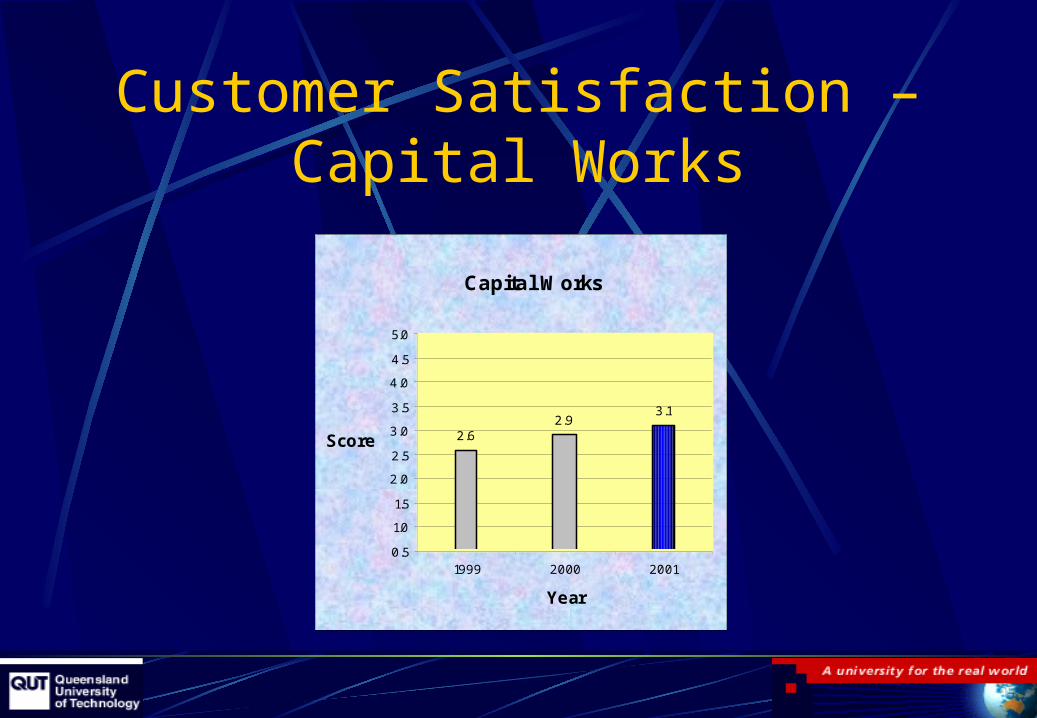
Customer Satisfaction – Capital Works
Capital Works
2.62.9
3.1
0.5
1.0
1.5
2.0
2.5
3.0
3.5
4.0
4.5
5.0
1999 2000 2001
Year
Score
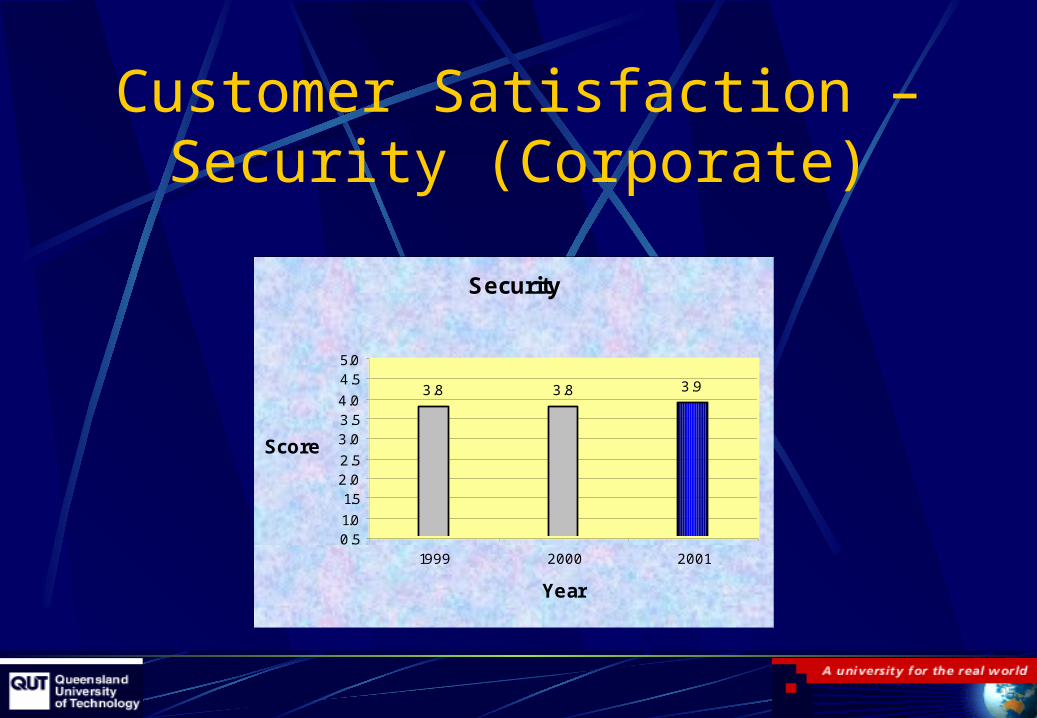
Customer Satisfaction – Security (Corporate)
Security
3.8 3.8 3.9
0.51.0
1.52.02.5
3.03.54.0
4.55.0
1999 2000 2001
Year
Score
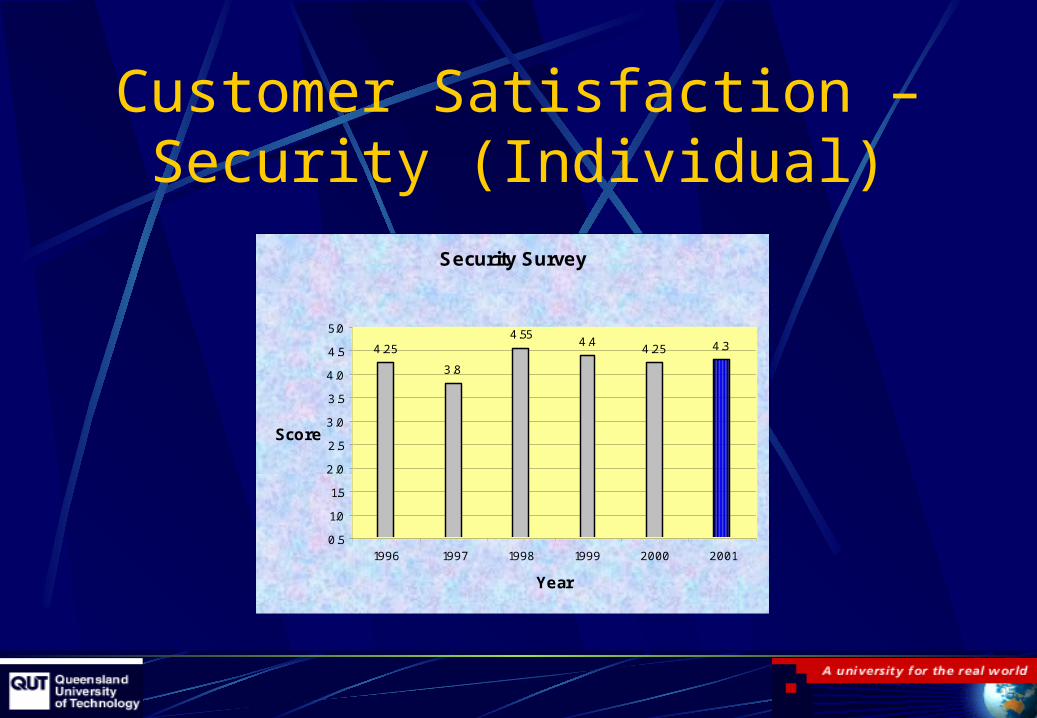
Customer Satisfaction – Security (Individual)
Security Survey
4.25
3.8
4.554.4
4.25 4.3
0.5
1.0
1.5
2.0
2.5
3.0
3.5
4.0
4.5
5.0
1996 1997 1998 1999 2000 2001
Year
Score
Customer Service Framework
=ServiceProvider
ofChoice
ServiceLevel
Agreements
Benchmarking of Costs
Customer Satisfaction Surveys

AAPPA Benchmarking
Security Staff Expenditure Other Total GFA under Cost of Cost of In-house Staff
Salaries/Wages on Security Security Security Security Patrol Security Security Cost as % Total
and Oncosts Contracts Costs Expenditure Refer Note 79! per m2 (GFA) per EFTSU Security Costs
75 76 77 78 79 80 81 82 82a
$ $ $ $ m2
$ per m2 $ per EFTSU % No.
1 $769,768 $149,551 $130,565 $1,049,884 200,412 $5.24 $88 73.3%
2 $80,852 $258,500 $339,352 45,369 $7.48 $1,295 0.0%
3 $273,157 $21,531 $294,688 42,240 $6.98 $502 92.7%
4 $1,028,000 $240,000 $1,268,000 370,824 $3.42 $165 81.1%
5 $3,000 $58,800 $61,800 52,800 $1.17 $17 4.9%
6 $357,175 $13,683 $40,113 $410,971 68,828 $5.97 $142 86.9%
7 $865,979 $18,077 $75,384 $959,440 216,358 $4.43 $58 90.3%
8 $1,335,473 $53,440 $110,554 $1,499,467 247,548 $6.06 $81 89.1%
9 $102,716 $1,365,746 $146,593 $1,615,055 253,900 $6.36 $128 6.4%
10 $1,120,257 $15,000 $155,000 $1,290,257 155,718 $8.29 $87 86.8%
11 $671,000 $128,000 $799,000 120,000 $6.66 $88 84.0%
12 $273,340 $198,877 $472,217 119,489 $3.95 $63 57.9% 3.9
13 $169,370 $159,150 $328,520 34,759 $9.45 $100 51.6% 4.1
14 $178,859 $224,682 $403,541 51,113 $7.90 $65 44.3% 4.1
15 $116,833 $246,981 $363,814 16,561 $21.97 $240 32.1% 4.4
16 $122,404 $120,008 $242,412 18,793 $12.90 $436 50.5% 4.2
17 $761,334 $0 $0 $761,334 127,481 $5.97 $65 100.0%
18 $196,994 $614,166 $137,310 $948,470 373,094 $2.54 $77 20.8%
19 $303,642 $1,305,000 $1,608,642 179,656 $8.95 $103 18.9% 2.0
20 $131,214 $1,035,777 $1,166,991 363,427 $3.21 $43 11.2%
21 $4,000 $50,000 $3,000 $57,000 8,145 $7.00 $56 7.0%
22 $27,521 $415,000 $10,000 $452,521 80,697 $5.61 $62 6.1%
23 $91,488 $4,800 $4,000 $100,288 49,710 $2.02 $27 91.2%
24 $100,902 $44,790 $16,911 $162,603 33,455 $4.86 $71 62.1%
25 $216,946 $783,381 $43,845 $1,044,172 293,261 $3.56 $51 20.8%
Customer Satisfaction
Rating
Inst
itu
tion
Survey Period: 1 January 2000 to 31 December 2000
Security
1.5 1.6 1.7 1.8 1.9 2.0 2.1 2.2 2.3 2.4 2.5 2.6 2.7 2.8 2.9 3.0 3.1 3.2 3.3 3.4 3.5 3.6 3.7 3.8 3.9 4.0 4.1 4.2 4.3 4.4 4.5 4.6 4.7 4.8 4.9 5.0
$8.60
$8.80
$9.00
$9.20
$9.40
$9.60
$9.80
$10.00
$10.20
$10.40
$10.60
$10.80 3
$11.00
$11.20
$11.40
$11.60
$11.80
$12.00 4
$12.20
$12.40
$12.60
$12.80
$13.00
$13.20 1 2
$13.40
$13.60
$13.80
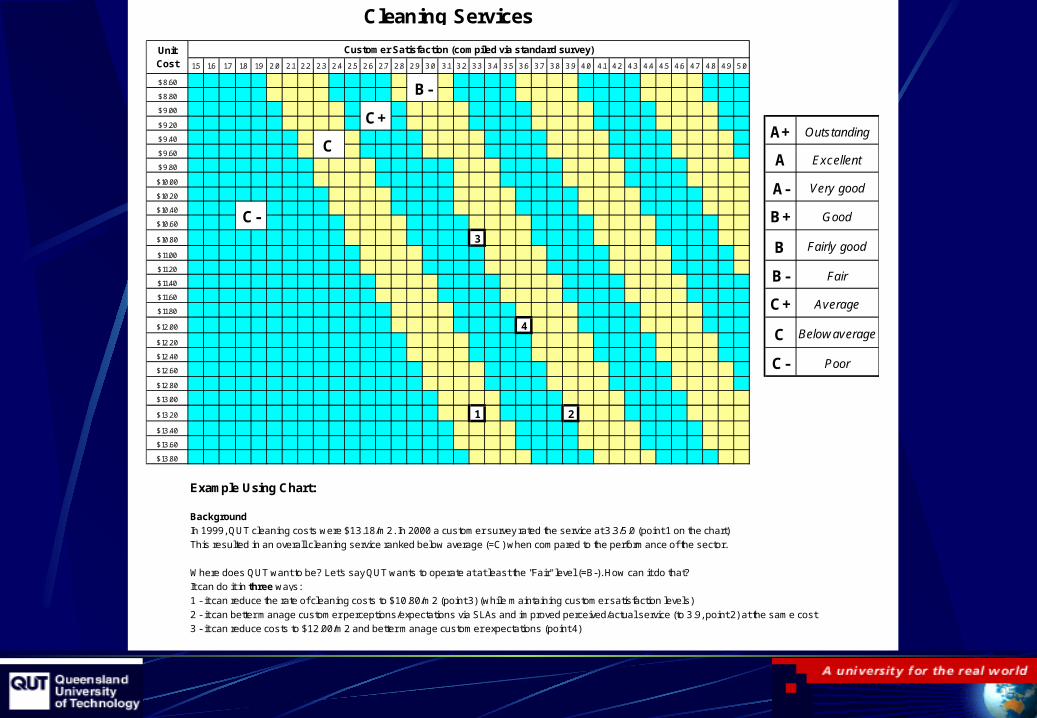
Example Using Chart:
Background
In 1999, QUT cleaning costs were $13.18/m2. In 2000 a customer survey rated the service at 3.3/5.0 (point 1 on the chart)
This resulted in an overall cleaning service ranked below average (=C) when compared to the performance of the sector.
Where does QUT want to be? Let's say QUT wants to operate at at least the "Fair" level (=B-). How can it do that?
It can do it in three ways:
1 - it can reduce the rate of cleaning costs to $10.80/m2 (point 3) (while maintaining customer satisfaction levels)
2 - it can better manage customer perceptions/expectations via SLAs and improved perceived/actual service (to 3.9, point 2) at the same cost
3 - it can reduce costs to $12.00/m2 and better manage customer expectations (point 4)
C+
C
B-
Below average
C
C-
A+
A
A-
B+
B
B-
C+
Good
Fairly good
Fair
Average
Poor
Cleaning Services
Customer Satisfaction (compiled via standard survey)Unit Cost
C-
Outstanding
Excellent
Very good
We Think We Are Doing a Good Job,
BUTWhat Do Our
Customers Think?
Questions?